

Submitted:
17 September 2026
Posted:
20 September 2026
You are already at the latest version
Abstract
Diabetes mellitus is a global metabolic disease characterized by immune-metabolic dysregulation, yet its pathogenesis remains unclear. Natural products from the medicinal and edible fungus Monascus show hypoglycemic activity, but clinical translation is hindered by a lack of systematic understanding of cellular heterogeneity and molecular targets. We integrated public single-cell transcriptome data (GSE101207) and 21 in-house untargeted metabolomics datasets from Monascus. Single-cell analysis, metabolic communication inference, differential metabolome intersection, three machine learning algorithms (Lasso regression, support vector machine–recursive feature elimination, and random forest), network pharmacology, immune cell infiltration assessment, and virtual gene knockout analyses were performed. Pancreatic ductal cells exhibited the highest disease association score in diabetes and were predicted to be highly involved in metabolite-mediated crosstalk. Four key metabolites and three overlapping candidate genes—hypoxanthine phosphoribosyltransferase 1 (HPRT1), mannosidase beta (MANBA), and ornithine decarboxylase 1 (ODC1)—were identified. HPRT1 was predicted to be associated with IL-17 and TGF-β pathways; MANBA was predicted to be related to ECM–receptor interactions and TNF signaling; ODC1 was predicted to be linked to NF-κB and NOD-like receptor pathways. These genes showed specific associations with immune subsets; CIBERSORT-estimated proportions of memory B cells and CD8⁺ T cells were higher in the diabetic group. Virtual gene knockout predicted that perturbing any of these genes reshaped the inflammation- and metabolism-related transcriptional network. This multidimensional framework suggests potential associations between Monascus fermentation-derived metabolites and diabetes-associated pancreatic transcriptional networks involving PDCs and the HPRT1/MANBA/ODC1 gene set. The study provides a hypothesis-generating framework for future experimental validation and a new model for elucidating natural product mechanisms.
Keywords:
Monascus
; diabetes mellitus
; single-cell sequencing
; network pharmacology
; metabolomics
; immune infiltration
1. Introduction
Since the 21st century, diabetes mellitus has become one of the chronic non-communicable diseases with the fastest growth rate worldwide [1]. The latest statistics from the International Diabetes Federation (IDF) showed that diabetes mellitus affected 10.5% of adults worldwide in 2021, corresponding to approximately 537 million adult patients. Type 2 diabetes mellitus (T2DM), representing over 90% of cases, is expected to remain the dominant form, with the total number of diabetes patients estimated to reach 783 million (12.2%) by 2045 [2,3]. More than 140 million adults in China suffer from diabetes, representing the largest patient population globally; the disease imposes a heavy burden, and its onset is increasingly occurring at younger ages [4].
Diabetes mellitus develops through a vicious cycle in which pancreatic β-cell function gradually declines and insulin resistance (IR) emerges and worsens [5]. Chronic hyperglycemia not only directly damages the islet microenvironment, but also systematically destroys the homeostasis of glucose and lipid metabolism, inducing a chronic low-grade systemic inflammatory response, namely “metaflammation” [6]. At the molecular level, key metabolic regulatory genes, including AKT1, INS, PPARG, and SIRT1, are significantly dysregulated in diabetic patients, accompanied by abnormal regulation of the phosphatidylinositol 3-kinase (PI3K)–Akt and AMP-activated protein kinase (AMPK) signaling pathways [7,8]. Epidemiological studies have clearly confirmed that obesity, sedentary lifestyle and unhealthy diet are the main modifiable risk factors for the onset of middle-aged and elderly people. Hypertension, hyperlipidemia and metabolic syndrome often coexist with diabetes mellitus, forming a complex comorbidity network, which will significantly accelerate the progression of complications such as cardiovascular disease, nephropathy and neuropathy [9,10].
At present, the clinical management of diabetes mellitus follows a guideline-guided stepwise treatment strategy: lifestyle intervention (medical nutrition therapy and regular exercise) combined with metformin is used as the first-line treatment regimen [11]; as the disease advances and β-cell function gradually declines, sulfonylureas, DPP-4 inhibitors, SGLT-2 inhibitors, GLP-1 receptor agonists, or basal insulin are usually added sequentially [12,13]. Although the above regimens can effectively control blood glucose, a considerable proportion of patients still have problems such as blood glucose fluctuation, weight gain, hypoglycemia risk, drug intolerance, and poor long-term compliance [14,15,16]. More importantly, diabetes mellitus is a complex disease caused by multiple factors, and intensive glucose lowering alone cannot completely prevent the occurrence and development of microvascular and macrovascular complications [17]. Therefore, more and more emphasis is placed on comprehensive management strategies (multi-dimensional regulation of blood glucose, blood pressure, blood lipid and body weight) in clinical practice, and traditional Chinese medicine or natural active ingredients are actively integrated to achieve multi-target and multi-pathway synergistic intervention [18,19].
Monascus is a type of medicinal and edible fungus, and its fermentation products (such as monacolin K, Monascus pigment, γ-aminobutyric acid) have been widely confirmed to have activities such as lipid regulation, anti-inflammation, anti-oxidation and improvement of insulin resistance [20,21]. However, the systematic action mechanism of Monascus in the treatment of diabetes mellitus, especially the cell type-specific regulatory network at single-cell resolution, and the direct association between key metabolites and targets are still unclear, which severely limits its clinical transformation and application.
Traditional pharmacological research is usually limited to the average response of whole animals or mixed cell populations, which cannot resolve the cellular heterogeneity inside diabetes-related tissues (especially the pancreas), and it is also difficult to establish a direct causal association from molecular targets to functional metabolic outcomes [22,23,24]. Single-cell RNA sequencing (scRNA-seq) technology has rapidly evolved, enabling the transcriptional atlas of disease-related tissues to be mapped at single-cell resolution and allowing rare cell subsets associated with disease progression and their state transitions to be accurately identified [25,26]. Network pharmacology can systematically predict the multi-target action mechanism of natural products by constructing a multi-layer interaction network of “drug-component-target-pathway” [27,28]. Unbiased profiling of endogenous metabolites in biological samples allows direct assessment of metabolic pathway perturbations and restorations, supplying direct evidence for the functional effects of drugs [29,30]. However, single omics methods have inherent blind spots: network pharmacology lacks cell type specificity [31]; metabolomics cannot trace the cellular source of metabolic changes [32]; scRNA-seq cannot directly measure the functional output at the metabolite level in parallel [33]. Therefore, integrating multi-omics data to construct a multi-layer regulatory network of “cell subset-key metabolite-core target-signaling pathway” has become an inevitable trend in the research of the action mechanism of natural products [34].
Abnormal function of the pancreas (especially pancreatic islets) is the direct inducement of diabetes onset. This study first analyzed the type 2 diabetes pancreatic single-cell transcriptome dataset GSE101207 (https://www.ncbi.nlm.nih.gov/geo/info/datasets.html) from the GEO public database, and found that pancreatic ductal cells (PDCs) in the diabetic group had the highest disease association score, suggesting that PDCs may be the key responder cell population in the pathological process of diabetes mellitus. Subsequent MEBOCOST metabolic communication analysis identified multiple metabolite-mediated intercellular interactions. At the same time, this study performed untargeted metabolomics detection on samples of the parental Monascus pilosus strain MS-1 and its mutant derivative ΔMpclr4 at different fermentation time points, and identified a total of 1044 candidate differential metabolites, among which guanosine, cytidine, L-glutamine and thymidine overlapped with the metabolites identified by MEBOCOST, so they were defined as core metabolites. Predicted by network pharmacology, these 4 core metabolites correspond to a total of 238 predicted targets, and 224 candidate associated targets were obtained after intersecting with diabetes disease targets. Then three machine learning algorithms, Lasso regression, SVM-RFE and random forest, were used to further screen 224 targets to obtain 3 overlapping key genes: HPRT1 (hypoxanthine phosphoribosyltransferase 1), MANBA (β-mannosidase), ODC1 (ornithine decarboxylase 1). This study used GSEA, GSVA, immune infiltration analysis, and single-cell virtual gene knockout (scTenifoldKnk) technology for the evaluation of how these three key genes may act and regulate signaling pathways in diabetes mellitus.
Overall, this study provides an integrated computational framework that combines single-cell transcriptomics, metabolomics and network pharmacology with machine learning and virtual knockout technology, and suggests potential associations between Monascus fermentation metabolites and the HPRT1/MANBA/ODC1 gene set and downstream immune-metabolic pathways in diabetes, providing a hypothesis-generating basis for future experimental validation and clinical evaluation.
2. Materials and Methods
2.1. Methods
This study employed an integrative multi-omics framework combining publicly available single-cell transcriptomic data, in-house metabolomics, and network pharmacology to investigate the potential associations between Monascus pilosus metabolites and diabetes-related pancreatic transcriptional networks. Pancreatic single-cell RNA-seq data from six non-diabetic controls and three type 2 diabetes donors (GSE101207), together with bulk islet transcriptomic data from 116 controls and 55 diabetes cases (GSE76896), were obtained from GEO. Untargeted metabolomics was performed on 21 Monascus fermentation samples derived from the MS-1 and ΔMpclr4 strains harvested at 7, 14, and 21 days. After quality control and batch correction using Seurat and Harmony, cell types were annotated, and metabolite-mediated cell–cell communication was inferred using MEBOCOST. Differential metabolites identified by limma (|log2FC| > 0.585, nominal P < 0.05) were intersected with MEBOCOST-predicted metabolites to define core compounds. The putative human targets of these compounds, predicted using SwissTargetPrediction, were then overlapped with diabetes-associated genes from GeneCards. Three machine-learning algorithms, including LASSO regression, SVM-RFE, and random forest, identified HPRT1, MANBA, and ODC1 as candidate genes. These genes were further characterised using GSEA, GSVA, CIBERSORT immune deconvolution, and scTenifoldKnk-based virtual knockout analysis. All statistical analyses were performed in R v4.2.2 using two-sided tests. FDR correction was applied where appropriate, with P < 0.05 or FDR < 0.05 considered statistically significant according to the specific analysis. No prospective power calculation was performed; however, model stability was assessed through cross-validation within the machine-learning procedures.
2.2. Experimental Materials
2.2.1. Data Download
The diabetes-related single-cell dataset GSE101207 was retrieved from the GEO database (Gene Expression Omnibus, https://www.ncbi.nlm.nih.gov/geo/info/datasets.html), provided by the National Center for Biotechnology Information (NCBI), containing 6 control samples and 3 disease samples. Meanwhile, the transcriptome dataset GSE76896 was downloaded from NCBI GEO, including 116 control samples and 55 disease samples. In addition, this study performed metabolomics detection on 21 internal Monascus fermentation samples in the laboratory (including the parental Monascus pilosus strain MS-1 and its mutant derivative ΔMpclr4, fermented for 7, 14 and 21 days respectively, with 3 biological replicates in each group, and another 3 blank controls. Among them, MS-1 is a Monascus pilosus strain, and ΔMpclr4 is a mutant strain constructed by knocking out the Mpclr4 gene of the parental Monascus pilosus MS-1 strain in our laboratory in the early stage).
2.2.2. Single-Cell Data Quality Control
First, the gene-count matrix was imported using the Seurat package, followed by cell screening according to three criteria: UMI abundance per cell, detected gene abundance, and the mitochondrial gene-derived transcript fraction. The mitochondrial gene-derived transcript fraction refers to the ratio of transcripts originating from mitochondrial genes to all detected transcripts. When mitochondrial transcripts increase markedly and RNA abundance remains low, cells are considered to be undergoing programmed death and are therefore excluded. Quality was controlled using the Median Absolute Deviation (MAD) method; any variable deviating from the median by more than three times the MAD was regarded as an outlier and removed.
2.2.3. Dimensionality Reduction, Clustering and Annotation of Single-Cell Data
To globally normalize the data, each cell’s total expression was scaled to 10,000 using LogNormalize, after which the values were log-transformed. Cell-cycle scores were estimated using CellCycleScoring. Highly variable genes were identified with FindVariableFeatures. Expression variability associated with mitochondrial gene content, ribosomal gene content, and cell-cycle stages was removed using ScaleData. Principal component analysis was performed on the gene-expression profile matrix via RunPCA, and the retained leading components were used for downstream analyses. Technical batch-associated variation was corrected with Harmony, using sample ID as the batch variable; disease status was not included as a covariate during batch correction to avoid removing true biological differences. Downstream comparisons between control and diabetic groups were therefore performed on Harmony-corrected embeddings while retaining donor-level biological structure. The data were subsequently projected by RunUMAP into a two-dimensional nonlinear embedding to visualize the global structural relationships among cells. Cell identity assignment was primarily guided by CellMarker, PanglaoDB, and published reports, with automated SingleR annotations providing additional support; this facilitated the characterization of the cellular subpopulations in the tissue under study and their signature marker genes. In addition, for each annotated cell type, the expected cell frequency was calculated using the epitools package. The disease association score was defined as the ratio of the observed cell frequency to the expected frequency under a uniform distribution across the control and diabetic groups. Higher ratios indicate enrichment of a given cell type in the diabetic group relative to controls.
2.2.4. MEBOCOST Analysis
MEBOCOST is a metabolic interaction analysis method based on single-cell transcriptome, which integrates the gene expression information of metabolite-related enzymes to calculate the co-expression score of metabolite-sensor pairs in each pair of cell types. Specifically, for each metabolite, the algorithm calculates the comprehensive enzyme activity by averaging the enzymes that produce the metabolite and subtracting the average activity of enzymes that consume it. Then MEBOCOST will evaluate the significant co-expression relationship between metabolite-related enzymes and sensors in different cell populations, determine the statistical significance through permutation test and false discovery rate (FDR) correction, and finally generate a standardized communication score to quantify the intensity of intercellular metabolic communication. In addition, MEBOCOST supports integration with metabolic flux analysis, incorporates parameters related to metabolite secretion and influx potential, which can more accurately define signal sending and receiving cells, and realize high-resolution analysis of metabolic interaction networks at single-cell resolution.
2.2.5. Differential Expression Analysis
Differential expression in transcriptomic datasets can be analyzed using the Limma R software package. Significant changes in gene expression between comparison groups were identified in this study using the package. The analysis of potential molecular associations between Monascus and diabetes was conducted using the Limma R package, alongside the identification of genes exhibiting significant expression differences between healthy and diabetic sample groups. Genes were screened based on P.Value < 0.05 and |log2FoldChange| > 0.585. For metabolomics data, differential metabolites were screened using nominal P < 0.05 and |log2FC| > 0.585. Given the limited number of blank control samples (n = 3), the exploratory nature of this comparison, and the use of nominal P values without multiple-testing correction, the resulting metabolites should be regarded as preliminary candidates rather than definitive differential metabolites.
2.2.6. Key Metabolite-Drug Target Network Retrieval
This study used the PubChem database and the SwissTargetPrediction tool for relevant analysis: PubChem is a chemical database supported by the National Institutes of Health (NIH) of the United States and maintained by NCBI; SwissTargetPrediction is an online tool specially designed for the identification of molecular entities modulated by small molecules. The tool, which applies the principle of chemical similarity along with extensive biological activity data, can predict the proteins that a given compound may bind to, providing reference information for drug discovery and repositioning.
2.2.7. Feature Selection Based on Lasso Regression, SVM-RFE and Random Forest
Key genes were identified using Lasso logistic regression and random forest algorithms, with Lasso implemented via the ‘glmnet’ package. An ensemble learning approach, random forest constructs predictions by aggregating multiple decision trees. Multiple bootstrap samples are generated from the original sample set through resampling with replacement, and each sample is used to train a corresponding decision tree; features are randomly selected without replacement at each node, and the sample set is split based on these features to find the optimal split feature, and finally the prediction result is determined. Features can be selected by SVM-RFE (Support Vector Machine-Recursive Feature Elimination), a method based on support vector machines. This method recursively removes the features that contribute the least to the classification performance, so as to screen the most important variables for sample differentiation. The random forest algorithm was applied to perform an evaluation of feature importance through %IncMSE (percentage increase in mean squared error), and the ten most significant features were chosen for further analyzing. In the present analysis, LASSO used 10-fold cross-validation for lambda selection; SVM-RFE used 5-fold cross-validation for feature ranking; random forest used fixed parameters ntree = 1000 and mtry = sqrt(p), and selected the top 10 features by %IncMSE. Due to the limited sample size and lack of an independent validation cohort, all machine-learning results are presented as exploratory. No external validation was performed.
2.3. GSEA Analysis
According to the key genes’ expression, the cohort was stratified into groups exhibiting relatively elevated or reduced expression, and GSEA (Gene Set Enrichment Analysis) was subsequently conducted to examine how signaling pathways differed between these groups. Genes from the MsigDB database (version 7.0 annotated gene set) were used to provide annotations for pathway analysis. Pathway expression was compared across groups, and gene sets showing significant enrichment after correction (corrected p value < 0.05) were ranked according to their enrichment scores. The application of GSEA commonly enables the investigation of close associations linking disease classification with biological functions.
2.4. GSVA Analysis
In Gene Set Variation Analysis (GSVA), a non-parametric method characterized by the absence of supervision is used to assess how gene sets are enriched in transcriptome data. Assessment of how samples functionally differ at the biological pathway level is enabled by GSVA, which transforms gene-level variation into pathway-level variation by computing an integrated score for each target gene set. This study used gene sets retrieved from the Molecular Signatures Database and applied GSVA to compute an integrated score for each gene set, enabling the assessment of how biological functions may vary among different samples.
2.5. Immune Infiltration Analysis
Assessment of immune cell types within the microenvironment constitutes a widespread application of CIBERSORT. Based on support vector regression, this method deconvolves immune-cell-subtype expression values matrixed from the input data, using 547 biomarkers with discriminatory capacity for 22 human immune cell phenotypes, including T cells, B cells, plasma cells, and myeloid cell subsets. Using CIBERSORT, characterization of patient-derived transcriptomic profiles was performed, together with estimation of the fractional abundance of 22 infiltrating immune cell types; meanwhile, gene expression levels were correlated with immune cell abundance. CIBERSORT analyses were performed with default parameters, and samples with a deconvolution P value < 0.05 were retained for downstream analysis. The LM22 signature was used because it is the standard reference for immune-cell deconvolution from bulk transcriptomes; however, we acknowledge that the islet tissue contains non-immune cell types not represented in LM22, and therefore the estimated immune cell fractions should be interpreted as relative proportions within the immune compartment rather than absolute infiltration levels. For quality control, the empirical deconvolution P value, deconvolution correlation, and RMSE were recorded for each sample. In the GSE76896 bulk islet dataset (171 samples), only 1 sample had a deconvolution P value < 0.05, the mean correlation coefficient was 0.005, and the mean RMSE was 1.092, indicating limited overall confidence of LM22-based deconvolution in this dataset. Therefore, the CIBERSORT results were interpreted as exploratory immune cell-related transcriptomic signals rather than definitive immune cell infiltration measurements.
2.6. scTenifoldKnk Analysis
The core hypothesis of scTenifoldKnk is that the topological structure of the gene regulatory network (GRN) reflects the functional dependency between genes, and knockout of a certain gene will perturb the equilibrium state of the network. Therefore, only single-cell transcriptome data of wild-type (WT) samples are needed to construct the GRN, and virtual knockout of target genes is performed to observe the global perturbation effect. In this study, the scTenifoldKnk algorithm was used to perform “virtual knockout” of key genes, evaluate their core role in the single-cell transcriptional regulatory network, and visualize the most significantly affected downstream genes after the perturbation of key genes. For scTenifoldKnk analysis, the raw count matrix of the annotated single-cell Seurat object was used, and quality control was not repeated within the package (qc = FALSE). The gene set used for network construction comprised the top 1,999 variable features identified by Seurat plus HPRT1, MANBA, or ODC1 to ensure that the target gene was included. A total of 500 cells were used for each gene analysis. GRN construction was performed using the principal component regression framework implemented in scTenifoldKnk/scTenifoldNet. Ten gene regulatory networks were generated for ensemble stabilization; each network used 500 cells, 3 principal components, retention of the top 90% gene relationships, standardized network weights, and no forced symmetrization. The networks were integrated by CP tensor decomposition with K = 3, maximum iterations = 1000, error threshold = 1e-5, and 3 decimal places retained. Wild-type and virtual knockout networks were constructed, and the outgoing edges of the target gene in the knockout network were set to zero. Perturbation scores were derived from the diffRegulation output, and genes with |FC| > 0.585 and adjusted P < 0.05 were considered significantly perturbed and used for downstream GO and KEGG enrichment analyses.
2.7. Statistical Analysis
R software (version 4.2.2) was used for all statistical analyses; all tests were two-sided, with p < 0.05 denoting statistical significance.
3. Results
3.1. Quality Control and Clustering of Single-Cell Data
Comprehensive assessment of data quality across multiple samples led to the exclusion of outliers and cells whose gene expression counts were below 200, ultimately yielding 20,486 high-quality cells. Supplementary Figure S1A–B presents the quality-control filtering results through distributional and bivariate visualization approaches. Supplementary Figure S1C further shows the identification of 2,000 highly variable genes. Supplementary Figure S1D–F illustrates the sequential processing workflow, including standardization, scaling, principal component analysis (PCA), and Harmony-based batch-effect correction.
3.2. Cell Annotation
After dimensionality reduction of the discovery set using Uniform Manifold Approximation and Projection (UMAP), a total of 9 subclusters were obtained (Figure 1A). Known cell markers were used to annotate cells, and the 9 subclusters were identified as 8 cell types: Gamma_cells, Beta_cells, Alpha_cells, Delta_cells, pancreatic stellate cells (PSCs), pancreatic ductal cells (PDCs), Acinar_cells, endothelial cells (Figure 1B). The bubble plot of cell marker genes further confirmed the accuracy of annotation and the reliability of cell clustering (Figure 1C). Meanwhile, a bar chart showing the proportion of cells in each group was plotted (Figure 1D).
3.3. Subcluster Differential Enrichment Analysis and Identification of Key Cell Subsets
Identification of differentially expressed genes for each cell subcluster was performed using the FindAllMarkers function, followed by extraction of the five genes exhibiting the greatest log fold-change (logFC) values. ClusterGVis, org.Hs.eg.db, and visCluster were integrated to perform enrichment analysis and generate color-coded matrix visualizations of the results. Pathway overrepresentation of the PDC-associated differential expression signature was observed in biological processes such as intermediate filament assembly and intermediate filament cytoskeleton assembly (Figure 1E).
The epitools package was used to calculate the expected value of each single-cell group, and the ratio of observed value to expected value was determined. Then the correlation of expected values between the control group and the disease group in single-cell data was plotted as a line chart, and the results showed that PDCs had the highest score in the disease group (Figure 2A).
3.4. MEBOCOST
MEBOCOST analysis showed that in metabolite-mediated cell-cell communication (mCCC), there were significant differences in the activity and functional preference of different cell types as signal senders and receivers. As senders, PDCs can initiate 13 mCCC events; as receivers, PDCs can receive 17 mCCC events (Figure 2B). Accordingly, PDCs were predicted to serve as hubs in metabolite-mediated intercellular communication. The cell communication network diagram shows the interactions between different pancreas-related cell populations. Overall, there are extensive communication connections among various cell populations, among which the interactions between Alpha_cells, Beta_cells, Delta_cells, Gamma_cells, PDCs and PSCs are the most significant, while the communication connections of endothelial cells are relatively few (Figure 2C). On the whole, Beta_cells have the highest activity in the cell communication network, with high communication intensity as senders and strong signal receiving ability as receivers. It is worth noting that the communication intensity between Beta_cells is the highest, showing the largest bubble size and the highest total score, suggesting that there may be a large number of autocrine or paracrine regulatory effects in β cells (Figure 2D). PDCs exhibited the highest disease association score, defined as enrichment ratio in the diabetic group. However, MEBOCOST identified β cells as having the highest overall communication activity. These two metrics are distinct: the disease association score reflects enrichment in diabetic samples, whereas MEBOCOST scores reflect predicted communication strength. PDCs are highlighted not because they are the most active communicators, but because they showed the strongest group-specific enrichment.
3.5. Identification of Differential Metabolites and Key Metabolites
We performed internal metabolomics detection on 21 Monascus fermented samples, including 18 Monascus fermented samples and 3 blank controls. Because this initial two-group comparison did not explicitly model strain or time effects, these 1,044 metabolites are referred to as candidate differential metabolites in the present study. The limma package was used to calculate candidate differential metabolites between the two groups, with screening criteria: nominal P < 0.05 and |log2FC| > 0.585. A total of 1044 candidate differential metabolites were identified, among which 308 were up-regulated and 736 were down-regulated. Volcano plots and heat maps of differential metabolites were plotted (Figure 3A-B). Among the 20 metabolites identified by MEBOCOST, changes related to lipid metabolism remodeling and oxidative stress were observed; for example, levels of ω-3 polyunsaturated fatty acids (such as DHA, EPA) and antioxidant-related metabolites such as glutathione were elevated, suggesting reduced inflammation and potentially improved insulin sensitivity.
In addition, changes in nucleotide and amino acid metabolites (such as adenosine, L-glutamine, GABA) reflect the recovery of energy metabolism and β-cell function homeostasis, jointly supporting the alleviation of glucose metabolism disorder. The intersection of differential metabolites and the 20 metabolites identified by MEBOCOST was taken, and 4 key metabolites were obtained (Figure 3C). The four overlapping metabolites (guanosine, cytidine, L-glutamine, and thymidine) were designated as candidate core metabolites solely because they were both detected as differentially abundant in the Monascus fermentation samples and predicted by MEBOCOST to participate in pancreatic metabolite-mediated communication. This overlap criterion is computational and does not imply direct biological activity. Their identification was based on database matching and extracted ion chromatograms, without absolute quantification or confirmation using authentic standards; therefore, these assignments should be considered tentative and require future validation.
We also compared the differences in secondary metabolite content between the parental Monascus pilosus strain MS-1 and its mutant derivative ΔMpclr4, and between different fermentation time points of the same strain (Figure 4A-L).
3.6. Retrieval of Predicted Targets of Key Metabolites and Disease Targets of Diabetes Mellitus
The chemical structures of the 4 key metabolites were obtained using the PubChem database. Based on these chemical structures, the SwissTargetPrediction database (http://www.swisstargetprediction.ch/) was used to predict and analyze the predicted targets of these compounds. Only predicted targets derived from Homo sapiens were retained, and a total of 238 targets were obtained (Metabolites_targets.csv), which were visualized using Cytoscape (Figure 5A). The intersection of the 238 predicted targets of key metabolites and the diabetes disease targets retrieved from the GeneCards database was taken, and 224 target genes were obtained (Figure 5B).
3.7. Identification of Candidate Key Genes
To further identify key genes affecting diabetes mellitus, we applied Lasso regression, random forest and support vector machine algorithms to the 224 genes. Lasso regression identified 19 genes as characteristic genes of diabetes mellitus (Figure 5C-D). When using SVM-RFE for feature selection, the model had the highest classification accuracy when 22 characteristic genes were retained, suggesting that this gene set has the optimal prediction performance (Figure 5E). Meanwhile, we used random forest to screen characteristic genes of diabetes mellitus, and selected the top 10 genes as characteristic genes (Figure 5F). The intersection of characteristic genes identified by the three algorithms was taken, and 3 overlapping genes were obtained (Figure 5G), which were used as key genes for subsequent analysis: HPRT1, MANBA and ODC1. These genes jointly constitute the molecular basis of the potential pharmacological effects of the identified compounds by regulating the nucleotide salvage synthesis pathway and amino acid metabolic flux. No independent validation cohort was available for the machine-learning-derived gene signatures. Given the marked cell-type-specific expression observed in single-cell data (Figure 8A–B), bulk-level comparison in GSE76896 was not performed, as averaged islet expression may not adequately reflect the cell-type-restricted patterns of these candidate genes.
3.8. GSEA
Subsequent analysis focused on the pathway-specific involvement of key genes for elucidation of the putative mechanistic basis underlying their disease-progression effects. GSEA-based pathway profiling indicated HPRT1-associated enrichment in pathways including cytokine–cytokine receptor interaction, IL-17 signaling pathway, and TGF-beta signaling pathway (Figure 6A). MANBA-associated enrichment was observed in pathways including ECM–receptor interaction, TNF signaling pathway, and calcium signaling pathway (Figure 6B). ODC1-associated enrichment was detected in pathways including NF-kappa B signaling pathway, HIF-1 signaling pathway, and NOD-like receptor signaling pathway (Figure 6C).
3.9. GSVA
GSVA-derived pathway profiling indicated HPRT1-associated enrichment in gene sets including PANCREAS_BETA_CELLS, BILE_ACID_METABOLISM, and HEDGEHOG_SIGNALING (Figure 6D). MANBA-associated enrichment was observed in biological programs such as MYOGENESIS, ESTROGEN_RESPONSE_EARLY, and COAGULATION (Figure 6E). ODC1-associated enrichment was detected in functional programs including MTORC1_SIGNALING and MYC_TARGETS_V2 (Figure 6F). Collectively, these findings imply that key genes may influence how the disease evolves through the above functional pathways.
3.10. Immune Infiltration and Immune Regulators
The microenvironment is mainly composed of fibroblasts, immune cells, extracellular matrix, various growth factors, inflammatory factors and special physicochemical properties, which have significant impacts on disease diagnosis, survival outcome and clinical treatment sensitivity. We visualized the distribution of immune infiltration levels and the correlation between immune cells in different forms (Figure 7A-B). CIBERSORT deconvolution estimated higher proportions of memory B cells and CD8⁺ T cells in the diabetic group, while lower estimated proportions were observed for naive B cells and activated dendritic cells (Figure 7C). We further explored the association between key genes and immune cells. HPRT1 was significantly positively correlated with memory B cells and CD8⁺ T cells, and significantly negatively correlated with naive CD4⁺ T cells and regulatory T cells (Tregs) (Figure 7D). MANBA was significantly positively correlated with M2 macrophages and plasma cells, and significantly negatively correlated with γδ T cells and activated mast cells. ODC1 was significantly positively correlated with naive B cells and activated dendritic cells, and significantly negatively correlated with M2 macrophages and CD8⁺ T cells. In addition, we analyzed the correlation between key genes and various immune factors, including immunosuppressive factors, immunostimulatory factors, chemokines and receptors. These analyses suggest that key genes are closely related to the level of immune cell infiltration and play an important role in the immune microenvironment (Figure 7E-I) (the GSE76896 expression matrix used for CIBERSORT analysis is derived from islet tissue samples).
3.11. Expression and Knockout of Key Genes
We used the FeaturePlot and VlnPlot functions of the Seurat package of R software to visualize the expression of the 3 key genes in single cells (Figure 8A-B).
The scTenifoldKnk algorithm was used to perform virtual knockout of key genes. The top 20 genes with the largest fold change (FC) were extracted from the differential regulation results, and a standardized bar plot was drawn: genes were ranked by FC value, and an orange gradient bar plot was used to display the magnitude of FC, intuitively presenting the spectrum of the most significantly affected target genes in the transcriptome network after each key gene is deleted. Subsequently, GO and KEGG analyses were performed on the affected target genes (Figure 9A-I).
Ten independent subnetworks were constructed based on scTenifoldKnk and in silico gene knockout was performed. Tensor decomposition (K = 3) was used to calculate the network perturbation score, the average value of the results was taken as the final score, and the FDR-corrected P value (adj.P < 0.05) was used as the significance criterion. The results of GO and KEGG analyses of target genes are shown in the figure (Figure 9A-I).
4. Conclusions
By integrating single-cell transcriptomics, metabolomics, and network pharmacology, this study provides a cross-scale framework for identifying pancreatic ductal cells as a disease-associated cell subset with predicted involvement in metabolic communication and for defining guanosine, cytidine, L-glutamine, and thymidine as candidate core metabolites associated with Monascus fermentation. Computational analyses suggested that these metabolites may be associated with a candidate gene set comprising HPRT1, MANBA, and ODC1, which was predicted to be involved in inflammatory and metabolic signalling networks and showed correlations with the aberrant immune infiltration pattern estimated from diabetic islet transcriptomes. In silico perturbation of each of these genes predicted substantial changes in inflammation-and metabolism-associated transcriptional networks. Collectively, these computational findings suggest potential associations between Monascus fermentation-derived metabolites, pancreatic ductal cells, and the HPRT1/MANBA/ODC1 gene set, which may be relevant to the pancreatic immune microenvironment in diabetes and warrant further experimental investigation. This study also provides a multi-omics framework for generating hypotheses about natural product mechanisms and identifies these three genes as candidate genes for future validation rather than established biomarkers.
5. Discussion
5.1. Epidemiology, Prognosis Management of Diabetes and Clinical Value of Key Genes
Diabetes is a global public health crisis, and its prevalence has been rising continuously over the past three decades. The prevalence of diabetes among Chinese adults has reached 12.8%, while the glycemic control target achievement rate is less than 50% [35,36]. Long-term disease management requires not only blood glucose control, but also comprehensive regulation of blood lipid, blood pressure, body weight and inflammatory state, as well as regular monitoring of indicators such as glycosylated hemoglobin and urinary microalbumin, to delay the progression of complications [37,38]. However, there is still a lack of reliable molecular markers in clinical practice that can predict disease progression, guide stratified management and evaluate therapeutic response to natural products. In this study, through systematic integration of multi-omics data and machine learning algorithms, we successfully identified three key genes, namely HPRT1, MANBA and ODC1, which can be regarded as candidate genes identified through an integrated computational prediction framework for Monascus in the context of diabetes. Notably, single-cell data analysis showed that pancreatic ductal cells (PDCs) in the diabetes group had the highest disease association score (Figure 2A), suggesting that PDCs are not only traditional ductal epithelial cells, but may also participate in the pathological process of diabetes through metabolic communication. Combined with the metabolite-mediated intercellular communication network revealed by MEBOCOST analysis (Figure 2B-2D), we speculate that key metabolites of Monascus may be associated with PDCs and their related signaling pathways, thereby affecting the entire pancreatic microenvironment. Therefore, HPRT1, MANBA and ODC1 can not only be used as candidate biomarkers for prognosis management of diabetes, but also provide molecular targets for the development of precise intervention strategies based on Monascus or its active components.
5.2. Research Status of Immune Infiltration in Diabetes and Its Correlation with Key Genes
Immune dysregulation is one of the core driving factors for the pathogenesis of diabetes. A large number of studies have shown that there is a significant imbalance of immune cell subsets in patients with type 2 diabetes and animal models: the infiltration of CD8⁺ T cells into pancreatic islets and adipose tissue increases, promoting β cell injury and insulin resistance; memory B cells show an expansion trend; while regulatory T cells (Tregs) and M2 macrophages are relatively reduced [39,40,41]. The results of immune infiltration analysis in this study are highly consistent with the above findings. CIBERSORT deconvolution estimated higher proportions of memory B cells and CD8⁺ T cells in the diabetic group, and lower proportions of naive B cells and activated dendritic cells (Figure 7C). These exploratory estimates are consistent with a pattern of adaptive immune activation, although they should not be interpreted as definitive evidence of immune infiltration.
More importantly, this study systematically analyzed the correlation between the three key genes and immune cell infiltration for the first time. HPRT1 was significantly positively correlated with memory B cells and CD8⁺ T cells, and significantly negatively correlated with naive CD4⁺ T cells and Tregs (Figure 7D), suggesting a potential association that requires further functional investigation. Meanwhile, its negative correlation with Tregs may be related to altered immune tolerance, although this remains speculative. MANBA was positively correlated with M2 macrophages and plasma cells, indicating that it may participate in anti-inflammatory responses or humoral immune responses. ODC1 was positively correlated with naive B cells and activated dendritic cells, and negatively correlated with M2 macrophages and CD8⁺ T cells, suggesting that ODC1 may play a dual regulatory role in the balance between innate immunity and adaptive immunity. In addition, all three key genes were significantly correlated with a variety of immunosuppressive factors, immunostimulatory factors, chemokines and their receptors (Figure 7E-I). The above results suggest that HPRT1, MANBA and ODC1 are not only associated with metabolic regulation, but may also be relevant to the remodeling of the immune microenvironment in diabetes. In view of the higher score of PDCs in the disease group, we speculate that Monascus may indirectly affect the recruitment and functional state of immune cells by regulating chemokines or metabolites secreted by PDCs, and this hypothesis needs to be verified by spatial transcriptome technology in subsequent studies.
5.3. Mechanism of Action of Key Genes in Diabetes and the Specific Signaling Pathways Involved
HPRT1 is a key enzyme in the purine salvage synthesis pathway, which can catalyze the conversion of hypoxanthine to inosine monophosphate (IMP), and plays a core role in maintaining the balance of cellular nucleotide pool [42]. Its abnormal expression is closely related to cell proliferation, oxidative stress and inflammatory response [43]. GSEA analysis in this study showed that HPRT1 was significantly enriched in Cytokine-cytokine receptor interaction, IL-17 signaling pathway and TGF-beta signaling pathway (Figure 6A). Existing studies have confirmed that the IL-17 signaling pathway can disrupt the insulin signaling pathway and promote β cell apoptosis by inducing pro-inflammatory cytokines (IL-6, TNF-α) [44]; the TGF-β signaling pathway plays a key role in islet fibrosis and epithelial-mesenchymal transition (EMT), and PDCs are an important cellular source of EMT-related molecules [45]. GSVA analysis further showed that HPRT1 was enriched in the PANCREAS_BETA_CELLS pathway (Figure 6D), suggesting that its expression is closely related to β cell function. Single-cell expression profiles showed that HPRT1 was highly expressed in PDCs and some immune cells (Figure 8A-8B). More importantly, in this study, the scTenifoldKnk algorithm was used to perform virtual knockout of HPRT1, and it was found that the downstream differentially regulated genes after its knockout were mainly enriched in inflammatory response and cytokine signaling pathways (Figure 9A-I), which suggested, at the computational network level, that HPRT1 may be involved in inflammatory signaling. In conclusion, HPRT1 may mediate the immunomodulatory effect of Monascus by regulating the IL-17/TGF-β axis.
MANBA encodes β-mannosidase, which is a key lysosomal enzyme involved in the degradation of N-linked glycoproteins, and its expression defect will cause rare β-mannosidosis [46]. Recent studies have confirmed that lysosomal dysfunction is not only related to neurodegenerative diseases, but also plays a role in the pathogenesis of insulin resistance and T2DM [47]. This study found that MANBA was enriched in ECM-receptor interaction, TNF signaling pathway and calcium signaling pathway (Figure 6B). Abnormal ECM-receptor interaction is directly related to pancreatic fibrosis and islet structural destruction [48]; the TNF signaling pathway is the core hub of metabolic inflammation, which can aggravate insulin resistance by activating NF-κB [49]. GSVA analysis showed that MANBA was also enriched in MYOGENESIS and COAGULATION pathways (Figure 6C), suggesting that it may be involved in the occurrence of diabetes-related sarcopenia and hypercoagulable state. After virtual knockout of MANBA, the affected target genes were significantly enriched in lysosome and inflammation-related pathways (Figure 9A-I), which further suggested that MANBA participates in the progression of diabetes through the lysosome-inflammation axis. In view of the higher score of PDCs in the diabetes group, we speculate that the abnormal expression of MANBA in PDCs may indirectly aggravate β cell dysfunction by affecting exocrine-endocrine crosstalk.
ODC1 is the first rate-limiting enzyme in polyamine biosynthesis, which can catalyze the decarboxylation of ornithine to produce putrescine, and plays a key role in polyamine metabolism, cell proliferation and oxidative stress [50]. In this study, ODC1 was enriched in NF-kappa B signaling pathway, HIF-1 signaling pathway and NOD-like receptor signaling pathway (Figure 6C). The NF-κB signaling pathway is the core transcriptional regulatory module of inflammatory response, and the HIF-1 signaling pathway mediates metabolic reprogramming under hypoxic conditions, both of which are closely related to renal tubular injury and islet hypoxic stress in diabetic nephropathy [51,52,53]. The NOD-like receptor signaling pathway is directly involved in inflammasome activation and IL-1β maturation, which can aggravate insulin resistance [54]. GSVA analysis found that ODC1 was enriched in MTORC1_SIGNALING and MYC_TARGETS_V2 (Figure 6F); existing studies have shown that abnormal activation of the mTORC1 signaling pathway can inhibit insulin signaling and promote β cell dedifferentiation [55,56]. Perturbation analysis after virtual knockout of ODC1 showed that its downstream target genes were mainly involved in NF-κB and mTOR-related pathways (Figure 9A-I), which was highly consistent with the above research results. In conclusion, ODC1 may participate in the regulation of metabolic inflammation and cell proliferation in diabetes by Monascus through NF-κB and mTORC1 signaling pathways.
5.4. Integrated Mechanism Model and Clinical Transformation Significance
The pathways identified (mTORC1, HIF-1, NF-κB) are canonical and not pancreas-specific; however, their predicted perturbation within the pancreatic cell network may still contribute to diabetes-related processes. Based on the above analysis, we propose the following multi-dimensional mechanism model (Figure 10): In this hypothetical model, the key metabolites produced by Monascus fermentation could potentially be associated with the candidate genes HPRT1, MANBA and ODC1, and may influence inflammatory signaling pathways (IL-17, TNF, NF-κB) and metabolic signaling pathways (mTORC1, HIF-1). These changes could in turn be relevant to the pancreatic immune microenvironment and β-cell function, although this remains to be experimentally validated. Notably, in our single-cell analysis, PDCs are the cell subset with the highest score in the diabetes group, and they can become important target cells of Monascus metabolites through exocrine signals and metabolite-sensor networks. At the clinical level, HPRT1, MANBA and ODC1 represent candidate genes requiring independent validation before any biomarker claim, for evaluating the progression of diabetes and the therapeutic response to Monascus.
5.5. Research Limitations and Future Directions
This study has the following limitations: First, although multi-omics integration and virtual knockout provide strong correlation and network-based regulatory evidence, the direct functions of HPRT1, MANBA and ODC1 in diabetes, as well as the specific regulatory mechanism of Monascus active components on them, still need to be functionally verified through gene knockout/overexpression animal models and cell experiments (such as primary culture of PDCs). In addition, the candidate genes HPRT1, MANBA, and ODC1 were identified using the training dataset only; independent validation in separate cohorts is required. Second, the single-cell data used in this study are from the public database (GSE101207), with limited sample size, and there is a lack of pancreatic single-cell transcriptome data after Monascus intervention. In the future, scRNA-seq research should be carried out in the self-constructed Monascus intervention model to directly evaluate its cell type-specific effects. In particular, the single-cell dataset includes only three diabetic donors, which limits generalizability. All donor-level inferences should be interpreted with caution. Third, the direct interaction between the key metabolites identified by metabonomics and the three core genes has not been verified by techniques such as surface plasmon resonance (SPR) and cellular thermal shift assay (CETSA). In addition, it remains unclear whether these metabolites are directly produced by Monascus or originate from the culture medium; absolute quantification and stable isotope tracing are needed. Fourth, scRNA-seq will lose the spatial position information of tissues, so it is an important direction of future research to verify the in situ distribution of PDCs and other cell subsets in pancreatic tissues and their interaction with immune cells by using spatial transcriptome technology (such as Visium). Fifth, this study did not distinguish the respective contributions of different active components of Monascus, and subsequent studies need to clarify its pharmacodynamic material basis through activity-guided separation and component knockout/back supplementation experiments. Given the absence of experimental validation, no definitive biological conclusions can be drawn at this stage.
Supplementary Materials
The following supporting information can be downloaded at the website of this paper posted on Preprints.org.
Author Contributions
J.W. (Jun Wan), D.Z. (Deqing Zhao), S.L. (Shengfa Li), X.G. (Xiaokun Gao), and Y.S. (Yanchun Shao) conceived and designed this research. J.W., D.Z., S.L., and X.G. wrote the manuscript. J.W., D.Z., S.L., and X.G. performed the data analysis; J.W., D.Z., and S.L. performed validation; J.W. and D.Z. performed software. Writing—review and editing: Y.S. (Yanchun Shao). Funding acquisition and project administration: Y.S. All authors modified the manuscript and approved the final manuscript. All authors have read and agreed to the published version of the manuscript.
Funding
This study was supported by the National Natural Science Foundation of China (grant No. 32272288) and the Fundamental Research Funds for the Central Universities of Huazhong Agricultural University, China (No. 2662025SPPY006).
Institutional Review Board Statement
Not applicable.
Informed Consent Statement
Not applicable.
Data Availability Statement
The single-cell RNA-seq dataset GSE101207 and the bulk transcriptome dataset GSE76896 analyzed in this study are available in the NCBI Gene Expression Omnibus (GEO) at https://www.ncbi.nlm.nih.gov/geo/query/acc.cgi?acc=GSE101207 and https://www.ncbi.nlm.nih.gov/geo/query/acc.cgi?acc=GSE76896, reference numbers GSE101207 and GSE76896. These data were derived from the following resources available in the public domain: NCBI GEO (https://www.ncbi.nlm.nih.gov/geo/). The raw untargeted metabolomics data generated in this study will be made available by the authors on request due to the data being part of an ongoing study.
Acknowledgments
The authors would like to thank Dr. Yunxia Gong for her assistance with review and editing.
Conflicts of Interest
The authors declare no conflicts of interest.
References
- Hossain, M.J.; Al-Mamun, M.; Islam, M.R. Diabetes mellitus, the fastest growing global public health concern: Early detection should be focused. Health Sci. Rep. 2024, 7, e2004. [Google Scholar] [CrossRef] [PubMed]
- Sun, H.; Saeedi, P.; Karuranga, S.; Pinkepank, M.; Ogurtsova, K.; Duncan, B.B.; Stein, C.; Basit, A.; Chan, J.C.N.; Mbanya, J.C.; et al. IDF Diabetes Atlas: Global, regional and country-level diabetes prevalence estimates for 2021 and projections for 2045. Diabetes Res. Clin. Pract. 2022, 183, 109119. [Google Scholar] [CrossRef] [PubMed]
- Chen, K.; Zhang, H.; Wu, N.; Li, B.; Li, S.; Mu, Y. Global risk factors, epidemiology, and disease burden of type 2 diabetes. Sci. China Life Sci. 2026, 69, 384–395. [Google Scholar] [CrossRef] [PubMed]
- Zhou, Y.C.; Liu, J.M.; Zhao, Z.P.; Zhou, M.G.; Ng, M. The national and provincial prevalence and non-fatal burdens of diabetes in China from 2005 to 2023 with projections of prevalence to 2050. Mil. Med. Res. 2025, 12, 28. [Google Scholar] [CrossRef] [PubMed]
- DeFronzo, R.A.; Ferrannini, E.; Groop, L.; Henry, R.R.; Herman, W.H.; Holst, J.J.; Hu, F.B.; Kahn, C.R.; Raz, I.; Shulman, G.I.; et al. Type 2 diabetes mellitus. Nat. Rev. Dis. Primers 2015, 1, 15019. [Google Scholar] [PubMed]
- Hotamisligil, G.S. Inflammation, metaflammation and immunometabolic disorders. Nature 2017, 542, 177–185. [Google Scholar] [CrossRef] [PubMed]
- Petersen, M.C.; Shulman, G.I. Mechanisms of Insulin Action and Insulin Resistance. Physiol. Rev. 2018, 98, 2133–2223. [Google Scholar] [CrossRef] [PubMed]
- Li, M.; Chi, X.; Wang, Y.; Setrerrahmane, S.; Xie, W.; Xu, H. Trends in insulin resistance: insights into mechanisms and therapeutic strategy. Signal Transduct. Target. Ther. 2022, 7, 216. [Google Scholar] [CrossRef] [PubMed]
- Zheng, Y.; Ley, S.H.; Hu, F.B. Global aetiology and epidemiology of type 2 diabetes mellitus and its complications. Nat. Rev. Endocrinol. 2018, 14, 88–98. [Google Scholar] [CrossRef] [PubMed]
- Galicia-Garcia, U.; Benito-Vicente, A.; Jebari, S.; Larrea-Sebal, A.; Siddiqi, H.; Uribe, K.B.; Ostolaza, H.; Martin, C. Pathophysiology of Type 2 Diabetes Mellitus. Int. J. Mol. Sci. 2020, 21, 6275. [Google Scholar] [CrossRef] [PubMed]
- American Diabetes Association Professional Practice Committee. Pharmacologic Approaches to Glycemic Treatment: Standards of Care in Diabetes-2025. Diabetes Care 2025, 48, S181–S206. [Google Scholar] [CrossRef] [PubMed]
- American Diabetes Association Professional Practice Committee. 2.Diagnosis and Classification of Diabetes: Standards of Care in Diabetes-2024. Diabetes Care 2024, 47, S20–S42. [Google Scholar] [CrossRef] [PubMed]
- Davies, M.J.; Aroda, V.R.; Collins, B.S.; Gabbay, R.A.; Green, J.; Maruthur, N.M.; Rosas, S.E.; Del Prato, S.; Mathieu, C.; Mingrone, G.; et al. Management of Hyperglycemia in Type 2 Diabetes, 2022. A Consensus Report by the American Diabetes Association (ADA) and the European Association for the Study of Diabetes (EASD). Diabetes Care 2022, 45, 2753–2786. [Google Scholar] [CrossRef] [PubMed]
- Perreault, L.; Skyler, J.S.; Rosenstock, J. Novel therapies with precision mechanisms for type 2 diabetes mellitus. Nat. Rev. Endocrinol. 2021, 17, 364–377. [Google Scholar] [CrossRef] [PubMed]
- Horvath, L.; Novodvorsky, P.; Haluzik, M. Practical limitations of complex insulin therapies in type 2 diabetes: Focus on therapy simplification using fixed-ratio combinations of basal insulin and a glucagon-like peptide-1 receptor agonist. Diabetes Obes. Metab. 2025, 27 Suppl 7, 42–54. [Google Scholar] [CrossRef] [PubMed]
- Cheng, A.Y.Y.; Heine, R.J.; Del Prato, S.; Green, J.B.; Thieu, V.T.; Zeytinoglu, M. Striving for early effective glycaemic and weight management in type 2 diabetes: A narrative review. Diabetes Obes. Metab. 2025, 27, 1708–1718. [Google Scholar] [CrossRef] [PubMed]
- Kunutsor, S.K.; Balasubramanian, V.G.; Zaccardi, F.; Gillies, C.L.; Aroda, V.R.; Seidu, S.; Khunti, K. Glycaemic control and macrovascular and microvascular outcomes: A systematic review and meta-analysis of trials investigating intensive glucose-lowering strategies in people with type 2 diabetes. Diabetes Obes. Metab. 2024, 26, 2069–2081. [Google Scholar] [CrossRef] [PubMed]
- Zhao, Y.L.; Liao, J.B.; Pang, P.P.; Li, J.Y.; Su, S.C.; Shao, M.Q.; Wen, W.B.; Xu, F.R. Pharmacological advances in multi-targeted strategies for type 2 diabetes mellitus: a systematic perspective based on traditional Chinese medicine. Front. Pharmacol. 2025, 16, 1732134. [Google Scholar] [CrossRef] [PubMed]
- Ni, H.X.; Cao, L.H.; Gong, X.X.; Zang, Z.Y.; Chang, H. Traditional Chinese medicine for treatment of type 2 diabetes mellitus: Clinical evidence and pharmacological mechanisms. J. Integr. Med. 2025, 23, 605–622. [Google Scholar] [CrossRef] [PubMed]
- Xiong, Z.; Cao, X.; Wen, Q.; Chen, Z.; Cheng, Z.; Huang, X.; Zhang, Y.; Long, C.; Zhang, Y.; Huang, Z. An overview of the bioactivity of monacolin K / lovastatin. Food Chem. Toxicol. 2019, 131, 110585. [Google Scholar] [CrossRef] [PubMed]
- Shi, Y.C.; Pan, T.M. Beneficial effects of Monascus purpureus NTU 568-fermented products: a review. Appl. Microbiol. Biotechnol. 2011, 90, 1207–1217. [Google Scholar] [CrossRef] [PubMed]
- Efremova, M.; Teichmann, S.A. Computational methods for single-cell omics across modalities. Nat. Methods 2020, 17, 14–17. [Google Scholar] [CrossRef] [PubMed]
- Wei, Y.; Hong, F.; Xie, S.; Luo, X.; Li, X.; Dao, F.; Deng, K.; Lin, H.; Lyu, H. Single-Cell Multi-Omics in Type 2 Diabetes Mellitus: Revealing Cellular Heterogeneity and Mechanistic Insights. Int. J. Mol. Sci. 2025, 26, 11005. [Google Scholar] [CrossRef] [PubMed]
- Pang, Z.; Cravatt, B.F.; Ye, L. Deciphering Drug Targets and Actions with Single-Cell and Spatial Resolution. Annu. Rev. Pharmacol. Toxicol. 2024, 64, 507–526. [Google Scholar] [CrossRef] [PubMed]
- Baron, M.; Veres, A.; Wolock, S.L.; Faust, A.L.; Gaujoux, R.; Vetere, A.; Ryu, J.H.; Wagner, B.K.; Shen-Orr, S.S.; Klein, A.M.; et al. A Single-Cell Transcriptomic Map of the Human and Mouse Pancreas Reveals Inter- and Intra-cell Population Structure. Cell Syst. 2016, 3, 346–360. [Google Scholar] [CrossRef] [PubMed]
- Segerstolpe, A.; Palasantza, A.; Eliasson, P.; Andersson, E.M.; Andreasson, A.C.; Sun, X.; Picelli, S.; Sabirsh, A.; Clausen, M.; Bjursell, M.K.; et al. Single-Cell Transcriptome Profiling of Human Pancreatic Islets in Health and Type 2 Diabetes. Cell Metab. 2016, 24, 593–607. [Google Scholar] [CrossRef] [PubMed]
- Li, L.; Kar, S. Leveraging network pharmacology for drug discovery: Integrative approaches and emerging insights. Med. Drug Discov. 2025, 27, 100220. [Google Scholar] [CrossRef]
- Ping, T.B.; Alia, M.; Bagustari, B.A.; Alshehade, S.A. NeXus: An Automated Platform for Network Pharmacology and Multi-Method Enrichment Analysis. Int. J. Mol. Sci. 2025, 26, 11147. [Google Scholar] [CrossRef] [PubMed]
- Pan, S.; Yin, L.; Liu, J.; Tong, J.; Wang, Z.; Zhao, J.; Liu, X.; Chen, Y.; Miao, J.; Zhou, Y.; et al. Metabolomics-driven approaches for identifying therapeutic targets in drug discovery. MedComm 2024, 5, e792. [Google Scholar] [CrossRef] [PubMed]
- Liu, C.; Chen, H.; Ma, Y.; Zhang, L.; Chen, L.; Huang, J.; Zhao, Z.; Jiang, H.; Kong, J. Clinical metabolomics in type 2 diabetes mellitus: from pathogenesis to biomarkers. Front. Endocrinol. 2025, 16, 1501305. [Google Scholar] [CrossRef] [PubMed]
- Joshi, C.P.; Baldi, A.; Kumar, N.; Pradhan, J. Harnessing network pharmacology in drug discovery: an integrated approach. Naunyn Schmiedebergs Arch. Pharmacol. 2025, 398, 4689–4703. [Google Scholar] [CrossRef] [PubMed]
- Petrova, B.; Guler, A.T. Recent Developments in Single-Cell Metabolomics by Mass Spectrometry horizontal line A Perspective. J. Proteome Res. 2025, 24, 1493–1518. [Google Scholar] [CrossRef] [PubMed]
- Hrovatin, K.; Fischer, D.S.; Theis, F.J. Toward modeling metabolic state from single-cell transcriptomics. Mol. Metab. 2022, 57, 101396. [Google Scholar] [CrossRef] [PubMed]
- Vitale, G.A.; Geibel, C.; Minda, V.; Wang, M.; Aron, A.T.; Petras, D. Connecting metabolome and phenotype: recent advances in functional metabolomics tools for the identification of bioactive natural products. Nat. Prod. Rep. 2024, 41, 885–904. [Google Scholar] [CrossRef] [PubMed]
- Wang, L.; Peng, W.; Zhao, Z.; Zhang, M.; Shi, Z.; Song, Z.; Zhang, X.; Li, C.; Huang, Z.; Sun, X.; et al. Prevalence and Treatment of Diabetes in China, 2013-2018. JAMA 2021, 326, 2498–2506. [Google Scholar] [CrossRef] [PubMed]
- Li, Y.; Teng, D.; Shi, X.; Qin, G.; Qin, Y.; Quan, H.; Shi, B.; Sun, H.; Ba, J.; Chen, B.; et al. Prevalence of diabetes recorded in mainland China using 2018 diagnostic criteria from the American Diabetes Association: national cross sectional study. BMJ 2020, 369, m997. [Google Scholar] [CrossRef] [PubMed]
- Joseph, J.J.; Deedwania, P.; Acharya, T.; Aguilar, D.; Bhatt, D.L.; Chyun, D.A.; Di Palo, K.E.; Golden, S.H.; Sperling, L.S.; American Heart Association Diabetes Committee of the Council on Lifestyle and Cardiometabolic Health; et al. Comprehensive Management of Cardiovascular Risk Factors for Adults With Type 2 Diabetes: A Scientific Statement From the American Heart Association. Circulation 2022, 145, e722–e759. [Google Scholar] [CrossRef] [PubMed]
- Dardano, A.; Bianchi, C.; Garofolo, M.; Del Prato, S. The current landscape for diabetes treatment: Preventing diabetes-associated CV risk. Atherosclerosis 2024, 394, 117560. [Google Scholar] [CrossRef] [PubMed]
- SantaCruz-Calvo, S.; Bharath, L.; Pugh, G.; SantaCruz-Calvo, L.; Lenin, R.R.; Lutshumba, J.; Liu, R.; Bachstetter, A.D.; Zhu, B.; Nikolajczyk, B.S. Adaptive immune cells shape obesity-associated type 2 diabetes mellitus and less prominent comorbidities. Nat. Rev. Endocrinol. 2022, 18, 23–42. [Google Scholar] [CrossRef] [PubMed]
- Xie, X.; Li, F.; Wu, Q.; Zeng, C.; Chen, X.; Wang, W.; Zhang, C.; Chen, H. Imbalance of T cell subsets: a core event that mediates the progression of T2DM and its complications. Front. Immunol. 2025, 16, 1688392. [Google Scholar] [CrossRef] [PubMed]
- Radenkovic, M.; Arvastsson, J.; Sarmiento, L.; Cilio, C.M. Resident memory CD8(+) T cells dominate lymphoid immune cell population in human pancreatic islets in health and type 2 diabetes. BMJ Open Diabetes Res. Care 2025, 13, e004559. [Google Scholar] [CrossRef] [PubMed]
- Lane, A.N.; Fan, T.W.M. Regulation of mammalian nucleotide metabolism and biosynthesis. Nucleic Acids Res. 2015, 43, 2466–2485. [Google Scholar] [CrossRef] [PubMed]
- Yang, T.; Luo, L.; Luo, X.; Liu, X. Metabolic crosstalk and therapeutic interplay between diabetes and hyperuricemia. Diabetes Res. Clin. Pract. 2025, 224, 112204. [Google Scholar] [CrossRef] [PubMed]
- Abdel-Moneim, A.; Bakery, H.H.; Allam, G. The potential pathogenic role of IL-17/Th17 cells in both type 1 and type 2 diabetes mellitus. Biomed. Pharmacother. 2018, 101, 287–292. [Google Scholar] [CrossRef] [PubMed]
- Kattner, N.; Bashir, A.; Shaw, J.A.M. The emerging role of pancreatic exocrine fibrosis as a common aetiological driver of islet dysfunction and diabetes: opportunities for novel disease-modifying interventions. Diabetologia 2026, 69, 1118–1132. [Google Scholar] [CrossRef] [PubMed]
- Martin Rios, A.M.; Gibbs, L.H.; Stepien, K.M.; Hall, K.; Hall, P.L.; Bentz Pino, G.; Wang, R.Y.; Pillai, N.R.; Lund, T.; Orchard, P.J.; et al. Expanding the Phenotype Spectrum of beta-Mannosidosis. Neurol. Genet. 2025, 11, e200317. [Google Scholar] [CrossRef] [PubMed]
- Chen, X.; Huang, L.; Xiao, Z.; Liu, L. Lysosomal dysfunction in diabetes and diabetic complications. Front. Endocrinol. 2026, 17, 1794600. [Google Scholar] [CrossRef] [PubMed]
- Hayden, M.R.; Patel, K.; Habibi, J.; Gupta, D.; Tekwani, S.S.; Whaley-Connell, A.; Sowers, J.R. Attenuation of endocrine-exocrine pancreatic communication in type 2 diabetes: pancreatic extracellular matrix ultrastructural abnormalities. J. Cardiometab. Syndr. 2008, 3, 234–243. [Google Scholar] [CrossRef] [PubMed]
- Akash, M.S.H.; Rehman, K.; Liaqat, A. Tumor Necrosis Factor-Alpha: Role in Development of Insulin Resistance and Pathogenesis of Type 2 Diabetes Mellitus. J. Cell. Biochem. 2018, 119, 105–110. [Google Scholar] [CrossRef] [PubMed]
- Pegg, A.E. Functions of Polyamines in Mammals. J. Biol. Chem. 2016, 291, 14904–14912. [Google Scholar] [CrossRef] [PubMed]
- Chang, J.; Yan, J.; Li, X.; Liu, N.; Zheng, R.; Zhong, Y. Update on the Mechanisms of Tubular Cell Injury in Diabetic Kidney Disease. Front. Med. 2021, 8, 661076. [Google Scholar] [CrossRef] [PubMed]
- Ansari, Z.; Chaurasia, A.; Neha; Sharma, N.; Bachheti, R.K.; Gupta, P.C. Exploring inflammatory and fibrotic mechanisms driving diabetic nephropathy progression. Cytokine Growth Factor Rev. 2025, 84, 120–134. [Google Scholar] [CrossRef] [PubMed]
- Catrina, S.B.; Zheng, X. Hypoxia and hypoxia-inducible factors in diabetes and its complications. Diabetologia 2021, 64, 709–716. [Google Scholar] [CrossRef] [PubMed]
- Sahariah, P.; Saikia, L.; Bharali, A.; Law, D.; Sen, S.; Sivasamugham, L.A.; Dutta, P.P. Mechanistic insights into natural product-driven modulation of NLRP3-inflammasome signalling in metabolic syndrome. Inflamm. Res. 2026, 75, 100. [Google Scholar] [CrossRef] [PubMed]
- Ardestani, A.; Lupse, B.; Kido, Y.; Leibowitz, G.; Maedler, K. mTORC1 Signaling: A Double-Edged Sword in Diabetic beta Cells. Cell Metab. 2018, 27, 314–331. [Google Scholar] [CrossRef] [PubMed]
- Bar-Tana, J. mTORC1 syndrome (TorS): unified paradigm for diabetes/metabolic syndrome. Trends Endocrinol. Metab. 2023, 34, 135–145. [Google Scholar] [CrossRef] [PubMed]
Figure 1.
Cell annotation.(A) Based on the significant principal components obtained by PCA, cells were divided into 9 clusters using the UMAP algorithm.(B) Annotation of 9 cell clusters, a total of 8 cell types were identified: Gamma_cells, Beta_cells, Alpha_cells, Delta_cells, pancreatic stellate cells (PSCs), pancreatic ductal cells (PDCs), Acinar_cells, endothelial cells. Cluster 0 and cluster 6 were merged and annotated as Alpha_cells.(C) Dot plot (DoPlot) shows the expression of cell markers of 8 cell types.(D) Difference in the proportion of 8 cell types between the two groups of samples.(E) Differential analysis and enrichment analysis of 8 cell subsets.
Figure 1.
Cell annotation.(A) Based on the significant principal components obtained by PCA, cells were divided into 9 clusters using the UMAP algorithm.(B) Annotation of 9 cell clusters, a total of 8 cell types were identified: Gamma_cells, Beta_cells, Alpha_cells, Delta_cells, pancreatic stellate cells (PSCs), pancreatic ductal cells (PDCs), Acinar_cells, endothelial cells. Cluster 0 and cluster 6 were merged and annotated as Alpha_cells.(C) Dot plot (DoPlot) shows the expression of cell markers of 8 cell types.(D) Difference in the proportion of 8 cell types between the two groups of samples.(E) Differential analysis and enrichment analysis of 8 cell subsets.
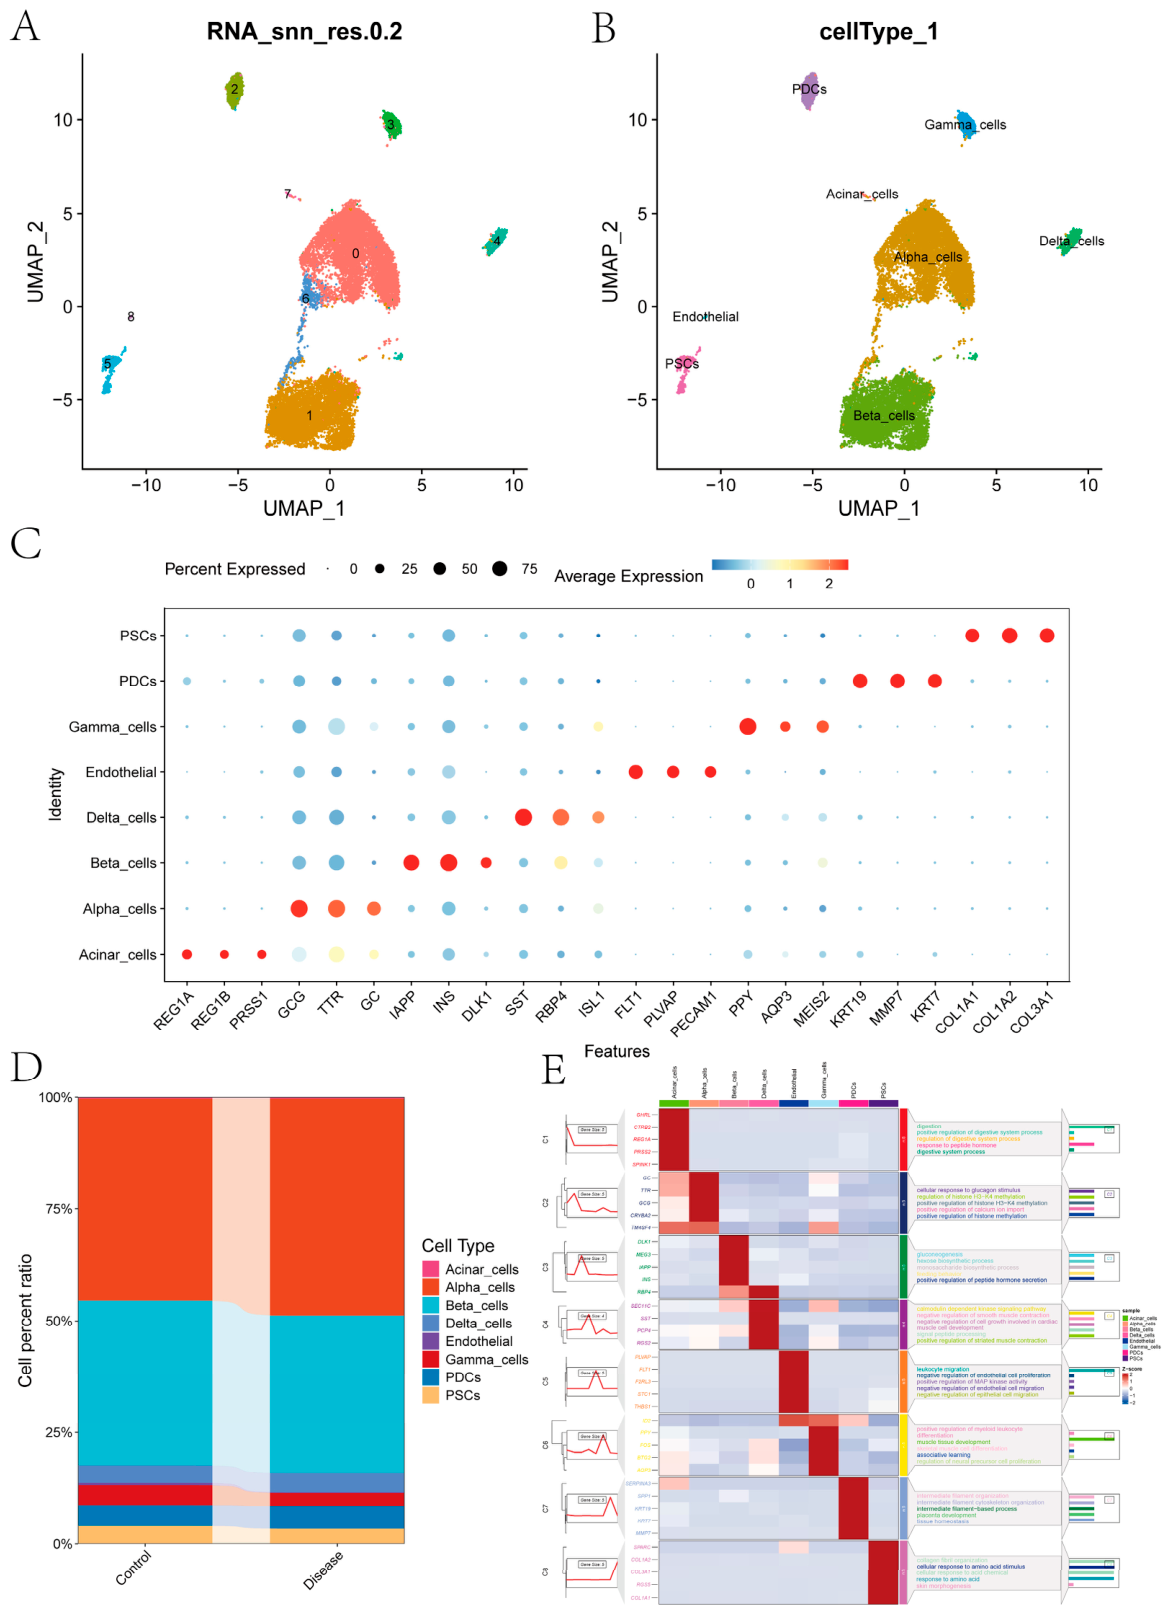
Figure 2.
Panorama of metabolite-mediated cell-cell communication (mCCC) in diabetes mellitus.(A) Distribution enrichment analysis of each cell type in the control group and the disease group. The line chart shows the correlation trend of cell expected values between the control group and the disease group.Disease association score (Ro/e) was calculated as a descriptive enrichment metric based on cell counts, without formal donor-level statistical testing.(B) Occurrence frequency of metabolite-mediated communication events participated by each cell type. The bar chart shows the total number of metabolite-mediated communication events involving each cell type as signal sender or receiver detected by the MEBOCOST algorithm.(C) Metabolite-sensor cell communication network. This network diagram shows the complex communication network predicted based on scRNA-seq data. Each node (dot) represents a cell type, distinguished by color; the size of the node is proportional to the total number of communication events between this cell type and other cells. Arrows indicate the direction of signal flow from sender cells to receiver cells, and the thickness of lines represents the frequency of detected metabolite-sensor communication pairs between the two types of cells. The line color represents the total communication score (calculated as the sum of –log10(FDR) of all communication pairs between the sender and the receiver).(D) Dot plot of metabolite-mediated communication between cell pairs. This figure shows the communication intensity of each pair of cell types in detail. The size of the dot represents the number of specific metabolite-sensor communication pairs detected between sender cells and receiver cells; the color depth of the dot represents the total communication score between the specific cell pair, reflecting the significance and intensity of communication.
Figure 2.
Panorama of metabolite-mediated cell-cell communication (mCCC) in diabetes mellitus.(A) Distribution enrichment analysis of each cell type in the control group and the disease group. The line chart shows the correlation trend of cell expected values between the control group and the disease group.Disease association score (Ro/e) was calculated as a descriptive enrichment metric based on cell counts, without formal donor-level statistical testing.(B) Occurrence frequency of metabolite-mediated communication events participated by each cell type. The bar chart shows the total number of metabolite-mediated communication events involving each cell type as signal sender or receiver detected by the MEBOCOST algorithm.(C) Metabolite-sensor cell communication network. This network diagram shows the complex communication network predicted based on scRNA-seq data. Each node (dot) represents a cell type, distinguished by color; the size of the node is proportional to the total number of communication events between this cell type and other cells. Arrows indicate the direction of signal flow from sender cells to receiver cells, and the thickness of lines represents the frequency of detected metabolite-sensor communication pairs between the two types of cells. The line color represents the total communication score (calculated as the sum of –log10(FDR) of all communication pairs between the sender and the receiver).(D) Dot plot of metabolite-mediated communication between cell pairs. This figure shows the communication intensity of each pair of cell types in detail. The size of the dot represents the number of specific metabolite-sensor communication pairs detected between sender cells and receiver cells; the color depth of the dot represents the total communication score between the specific cell pair, reflecting the significance and intensity of communication.
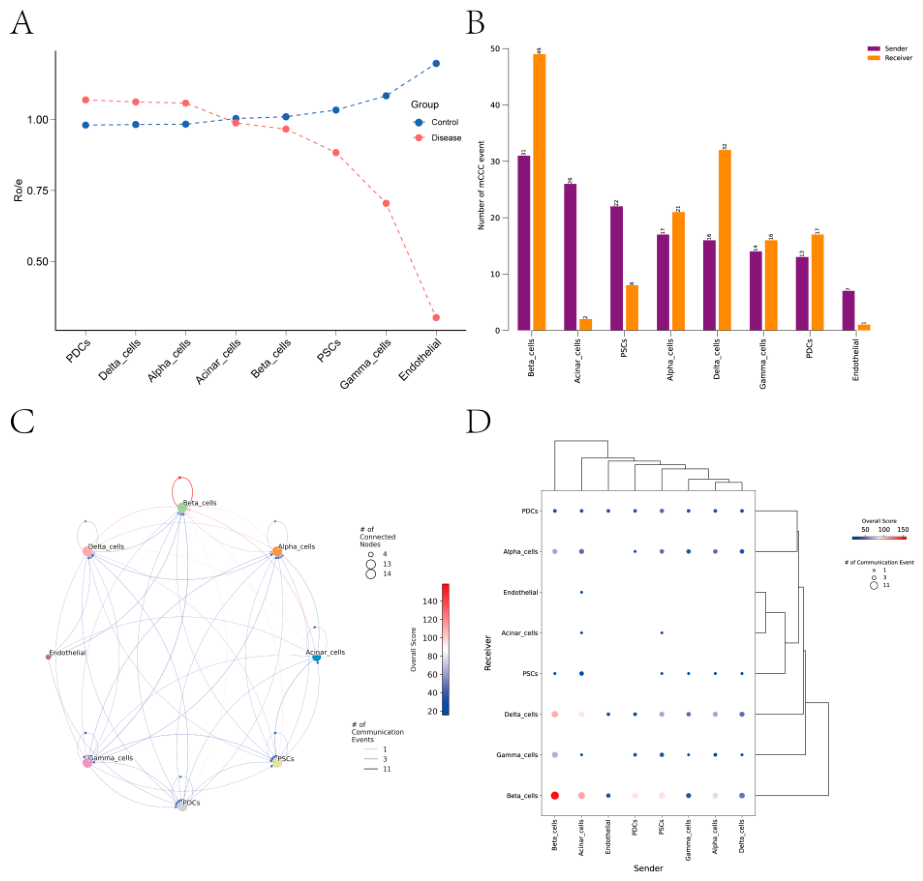
Figure 3.
Analysis of differential metabolites in Monascus fermentation and screening of core metabolites.(A-B) Volcano plot and heat map of differential metabolites. This group of figures shows the metabolomic differences between 18 fermented samples and 3 control samples. Using the limma package with screening criteria of nominal P < 0.05 and |log2FC| > 0.585, a total of 1044 candidate differential metabolites were identified(308 up-regulated, 736 down-regulated).(C) Intersection analysis of key metabolites. The intersection of experimentally detected differential metabolites and 20 metabolites predicted by MEBOCOST was taken, and 4 core key metabolites were finally identified.
Figure 3.
Analysis of differential metabolites in Monascus fermentation and screening of core metabolites.(A-B) Volcano plot and heat map of differential metabolites. This group of figures shows the metabolomic differences between 18 fermented samples and 3 control samples. Using the limma package with screening criteria of nominal P < 0.05 and |log2FC| > 0.585, a total of 1044 candidate differential metabolites were identified(308 up-regulated, 736 down-regulated).(C) Intersection analysis of key metabolites. The intersection of experimentally detected differential metabolites and 20 metabolites predicted by MEBOCOST was taken, and 4 core key metabolites were finally identified.
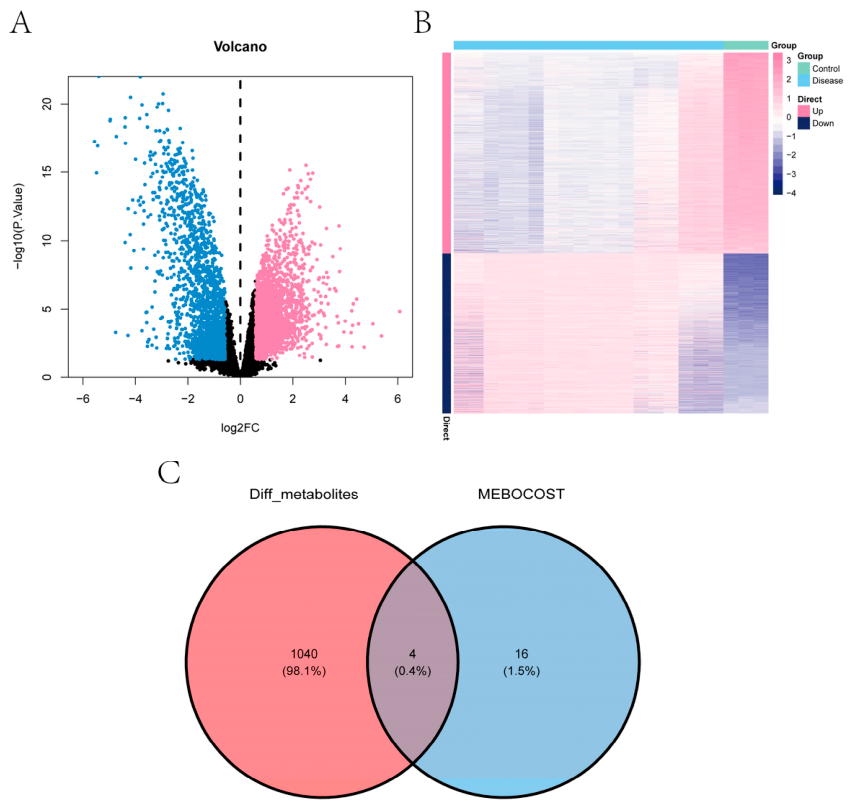
Figure 4.
Differences in secondary metabolite content between the parental strain MS-1 and the ΔMpclr4 mutant, and across fermentation time points.(A-D) Content differences of 4 key metabolites between the parental strain MS-1 and the ΔMpclr4 mutant.(E-H) Content differences of 4 key metabolites between different fermentation time points of the ΔMpclr4 strain.(I-L) Content differences of 4 key metabolites between different fermentation time points of the MS-1 strain.
Figure 4.
Differences in secondary metabolite content between the parental strain MS-1 and the ΔMpclr4 mutant, and across fermentation time points.(A-D) Content differences of 4 key metabolites between the parental strain MS-1 and the ΔMpclr4 mutant.(E-H) Content differences of 4 key metabolites between different fermentation time points of the ΔMpclr4 strain.(I-L) Content differences of 4 key metabolites between different fermentation time points of the MS-1 strain.
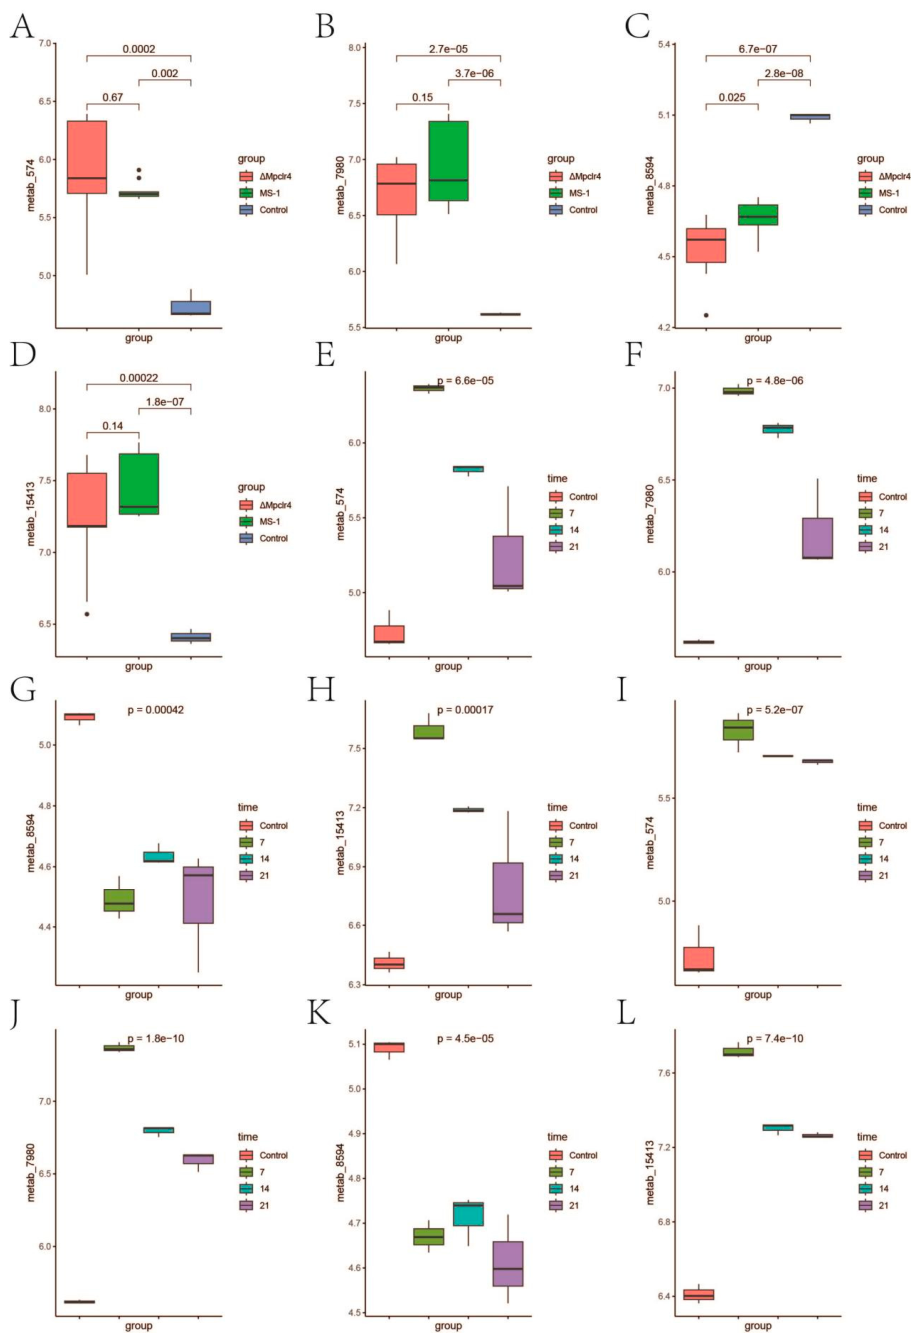
Figure 5.
Machine learning.(A) Network diagram of targets related to key metabolites retrieved from the SwissTargetPrediction database.(B) Venn diagram showing the intersection of metabolite-related targets and disease targets.(C) LASSO regression coefficient shrinkage path diagram, showing the weight changes when different features enter the model.(D) Ten-fold cross-validation results of LASSO regression, used to evaluate the model fitting effect. (E) When using SVM-RFE for feature selection, the model has the highest classification accuracy when 22 characteristic genes are retained.(F) Random forest screening results of characteristic genes, showing the top 10 genes in importance ranking.(G) Venn diagram showing the intersection of genes identified by LASSO and random forest (RF).
Figure 5.
Machine learning.(A) Network diagram of targets related to key metabolites retrieved from the SwissTargetPrediction database.(B) Venn diagram showing the intersection of metabolite-related targets and disease targets.(C) LASSO regression coefficient shrinkage path diagram, showing the weight changes when different features enter the model.(D) Ten-fold cross-validation results of LASSO regression, used to evaluate the model fitting effect. (E) When using SVM-RFE for feature selection, the model has the highest classification accuracy when 22 characteristic genes are retained.(F) Random forest screening results of characteristic genes, showing the top 10 genes in importance ranking.(G) Venn diagram showing the intersection of genes identified by LASSO and random forest (RF).
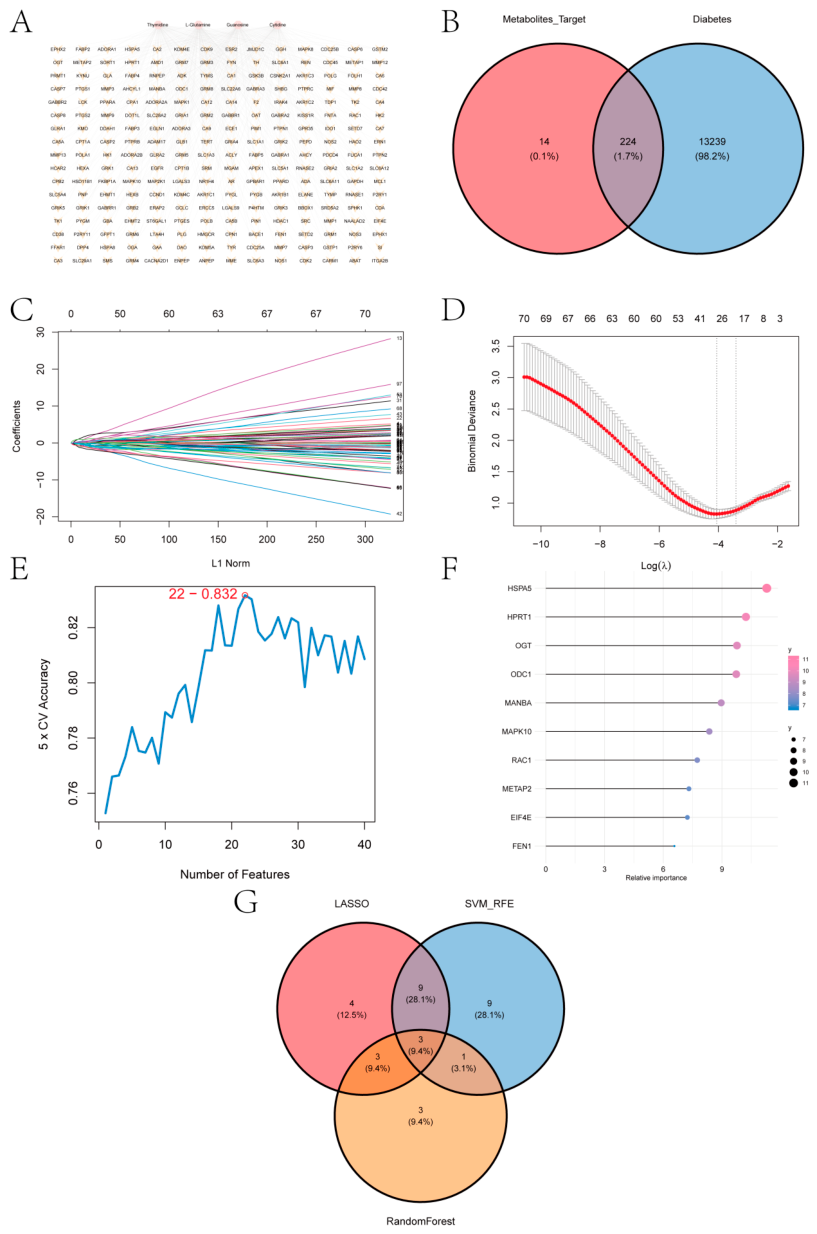
Figure 6.
GSEA and GSVA analysis of key genes.(A-C) KEGG signaling pathways that key genes participate in, as well as pathway regulation status and involved genes.(D-F) GSVA analysis of key genes. Blue represents signaling pathways related to high gene expression, and green represents signaling pathways related to low gene expression. The background gene set is hallmark.
Figure 6.
GSEA and GSVA analysis of key genes.(A-C) KEGG signaling pathways that key genes participate in, as well as pathway regulation status and involved genes.(D-F) GSVA analysis of key genes. Blue represents signaling pathways related to high gene expression, and green represents signaling pathways related to low gene expression. The background gene set is hallmark.
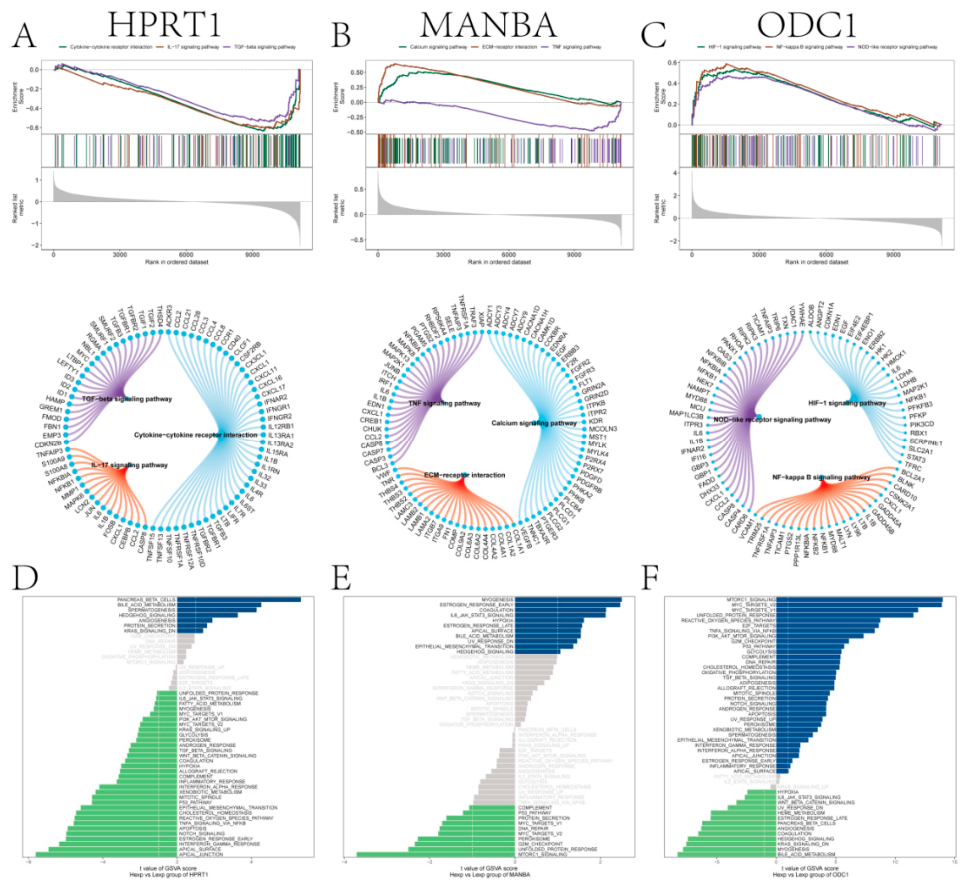
Figure 7.
Immune infiltration.(A) Relative proportion of immune cell subsets.(B) Correlation between immune cells; blue represents negative correlation, and red represents positive correlation.(C) Difference in immune cell abundance between the control group and the disease group.(D) Correlation between key genes and immune cells.(E-I) Correlation between key genes and various immune factors, including immunosuppressive factors, immunostimulatory factors, chemokines and receptors. For CIBERSORT-based comparisons, each bulk islet sample was treated as an independent biological sample.
Figure 7.
Immune infiltration.(A) Relative proportion of immune cell subsets.(B) Correlation between immune cells; blue represents negative correlation, and red represents positive correlation.(C) Difference in immune cell abundance between the control group and the disease group.(D) Correlation between key genes and immune cells.(E-I) Correlation between key genes and various immune factors, including immunosuppressive factors, immunostimulatory factors, chemokines and receptors. For CIBERSORT-based comparisons, each bulk islet sample was treated as an independent biological sample.
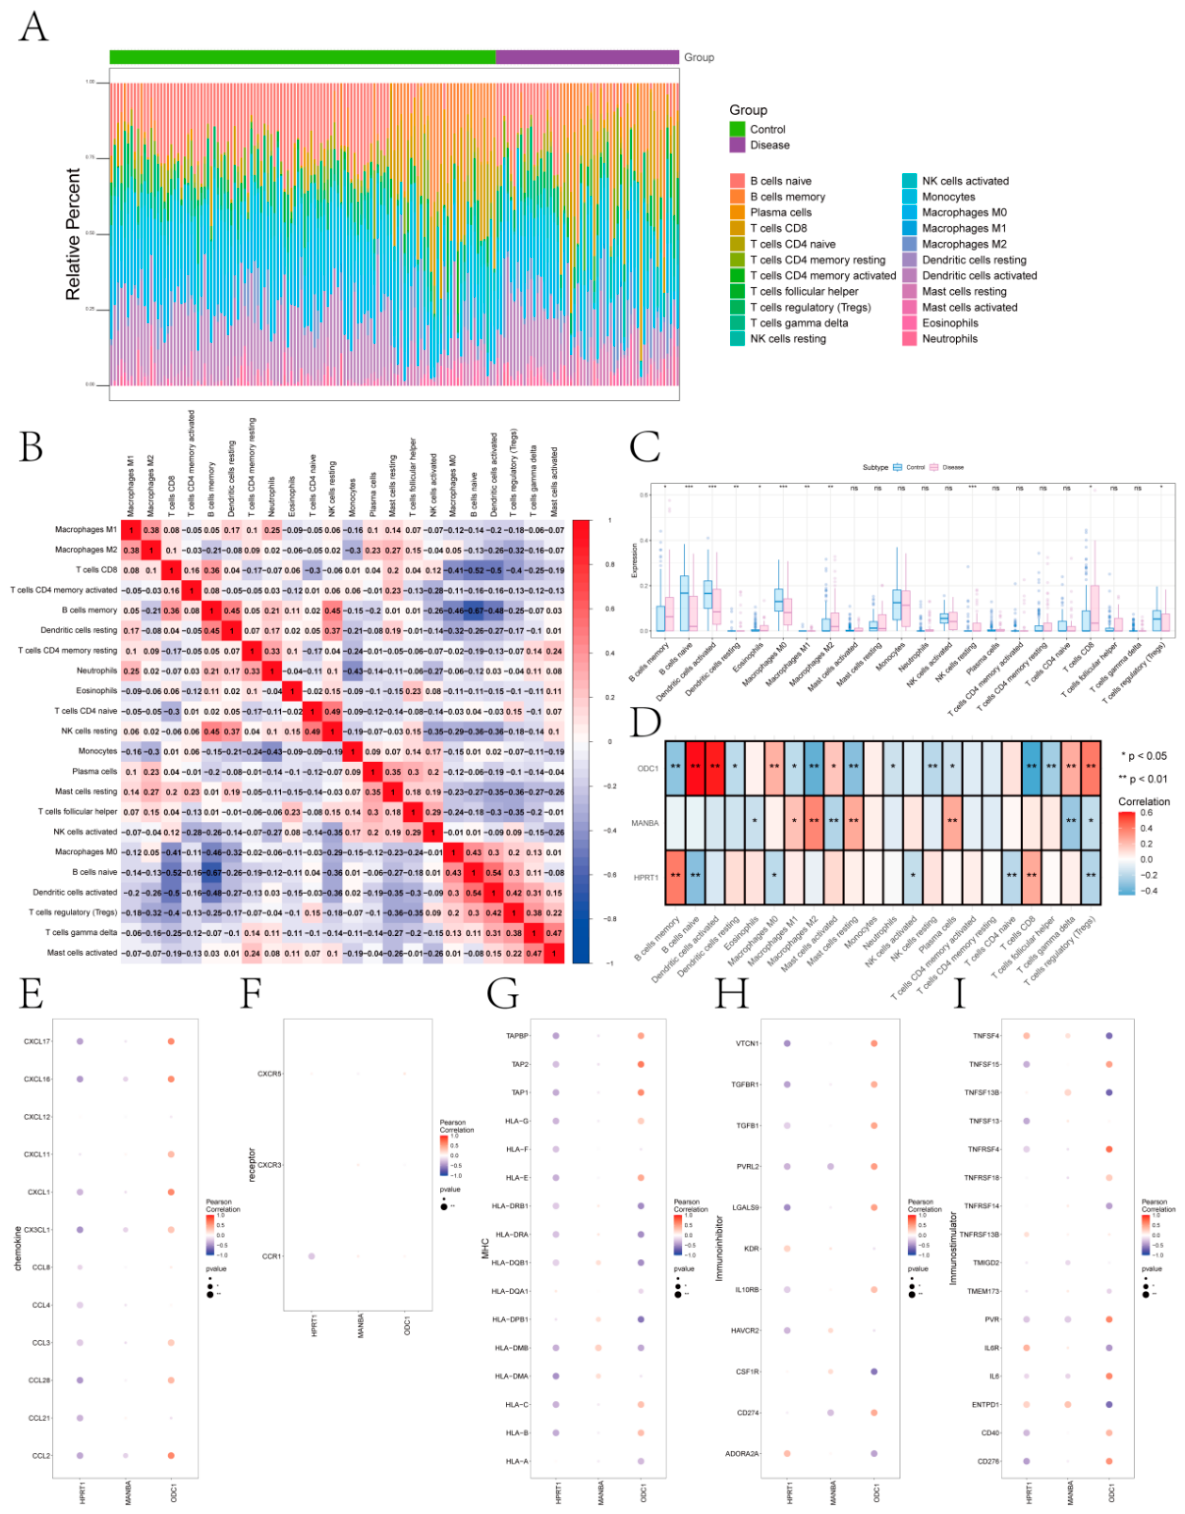
Figure 8.
Expression of key genes in single cells. (A) FeaturePlot shows the expression of key genes in single cells. (B) VlnPlot shows the expression of key genes in single cells.
Figure 8.
Expression of key genes in single cells. (A) FeaturePlot shows the expression of key genes in single cells. (B) VlnPlot shows the expression of key genes in single cells.
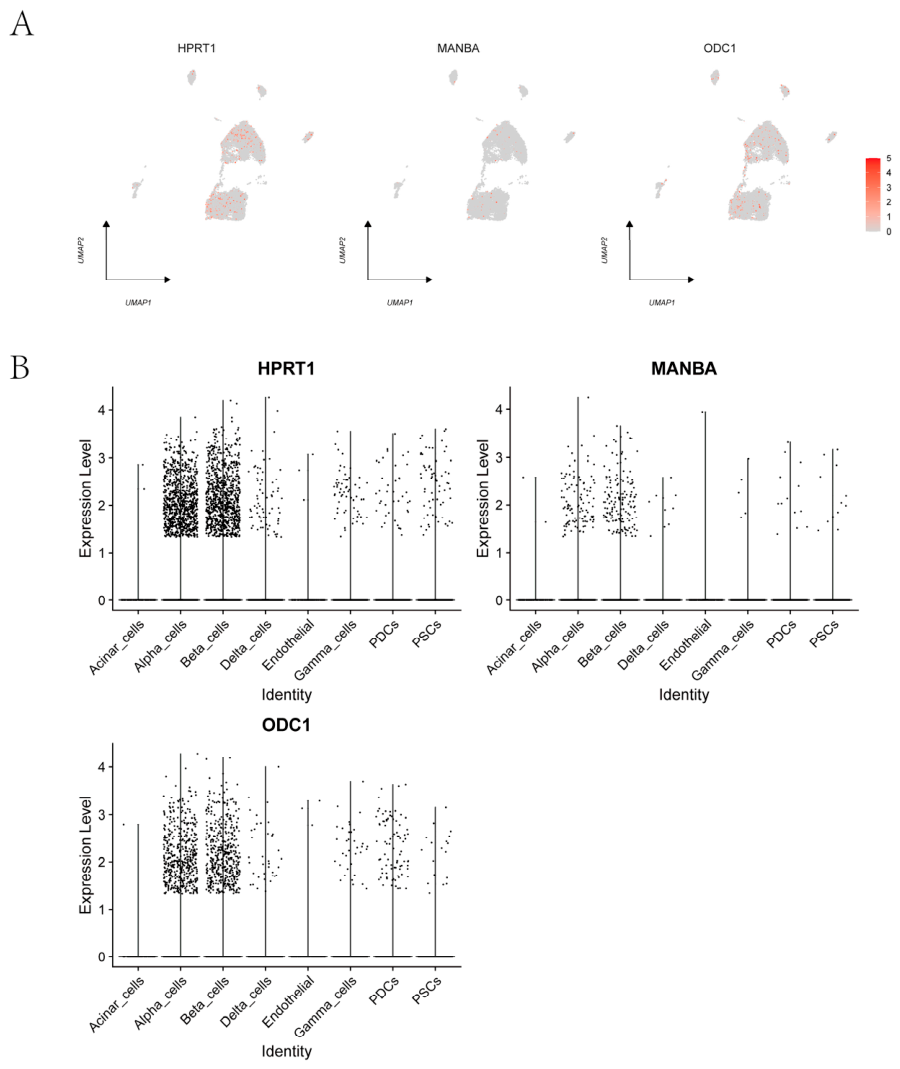
Figure 9.
Virtual knockout of key genes (scTenifoldKnk) and analysis of their transcriptional regulatory networks.(A-C) Analysis of regulatory effects of HPRT1 virtual knockout. The bar plot shows the top 20 most significantly affected target genes after HPRT1 deletion screened based on fold change (FC), as well as the results of GO functional enrichment and KEGG pathway analysis of the affected target genes.(D-F) Analysis of regulatory effects of MANBA virtual knockout. The bar plot shows the top 20 most significantly affected target genes after MANBA deletion screened based on fold change (FC), as well as the results of GO functional enrichment and KEGG pathway analysis of the affected target genes.(G-I) Analysis of regulatory effects of ODC1 virtual knockout. The bar plot shows the top 20 most significantly affected target genes after ODC1 deletion screened based on fold change (FC), as well as the results of GO functional enrichment and KEGG pathway analysis of the affected target genes.
Figure 9.
Virtual knockout of key genes (scTenifoldKnk) and analysis of their transcriptional regulatory networks.(A-C) Analysis of regulatory effects of HPRT1 virtual knockout. The bar plot shows the top 20 most significantly affected target genes after HPRT1 deletion screened based on fold change (FC), as well as the results of GO functional enrichment and KEGG pathway analysis of the affected target genes.(D-F) Analysis of regulatory effects of MANBA virtual knockout. The bar plot shows the top 20 most significantly affected target genes after MANBA deletion screened based on fold change (FC), as well as the results of GO functional enrichment and KEGG pathway analysis of the affected target genes.(G-I) Analysis of regulatory effects of ODC1 virtual knockout. The bar plot shows the top 20 most significantly affected target genes after ODC1 deletion screened based on fold change (FC), as well as the results of GO functional enrichment and KEGG pathway analysis of the affected target genes.
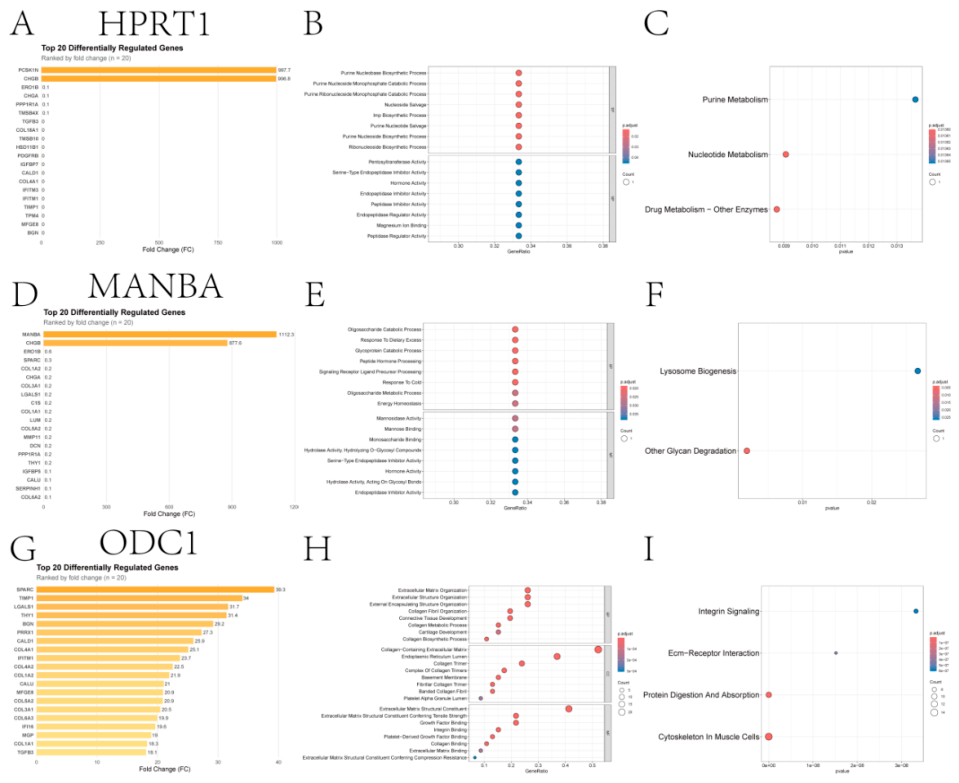
Figure 10.
Hypothetical computational model of potential associations between Monascus metabolites, PDCs, immune cells, and diabetes-related signaling pathways. This model is based entirely on integrated computational predictions and should be interpreted as hypothesis-generating, not as an experimentally validated mechanism. Monascus fermentation metabolites could influence the HPRT1/MANBA/ODC1 axis and thereby potentially modulate IL-17/TNF/NF-κB and mTORC1/HIF-1 signaling. In this model, these metabolites could potentially influence the pancreatic immune microenvironment by altering estimated CD8⁺ T-cell and memory B-cell proportions and by modulating the predicted metabolic communication functions of PDCs. These changes may in turn contribute to improved insulin sensitivity and β-cell protection, but this remains to be experimentally validated.
Figure 10.
Hypothetical computational model of potential associations between Monascus metabolites, PDCs, immune cells, and diabetes-related signaling pathways. This model is based entirely on integrated computational predictions and should be interpreted as hypothesis-generating, not as an experimentally validated mechanism. Monascus fermentation metabolites could influence the HPRT1/MANBA/ODC1 axis and thereby potentially modulate IL-17/TNF/NF-κB and mTORC1/HIF-1 signaling. In this model, these metabolites could potentially influence the pancreatic immune microenvironment by altering estimated CD8⁺ T-cell and memory B-cell proportions and by modulating the predicted metabolic communication functions of PDCs. These changes may in turn contribute to improved insulin sensitivity and β-cell protection, but this remains to be experimentally validated.
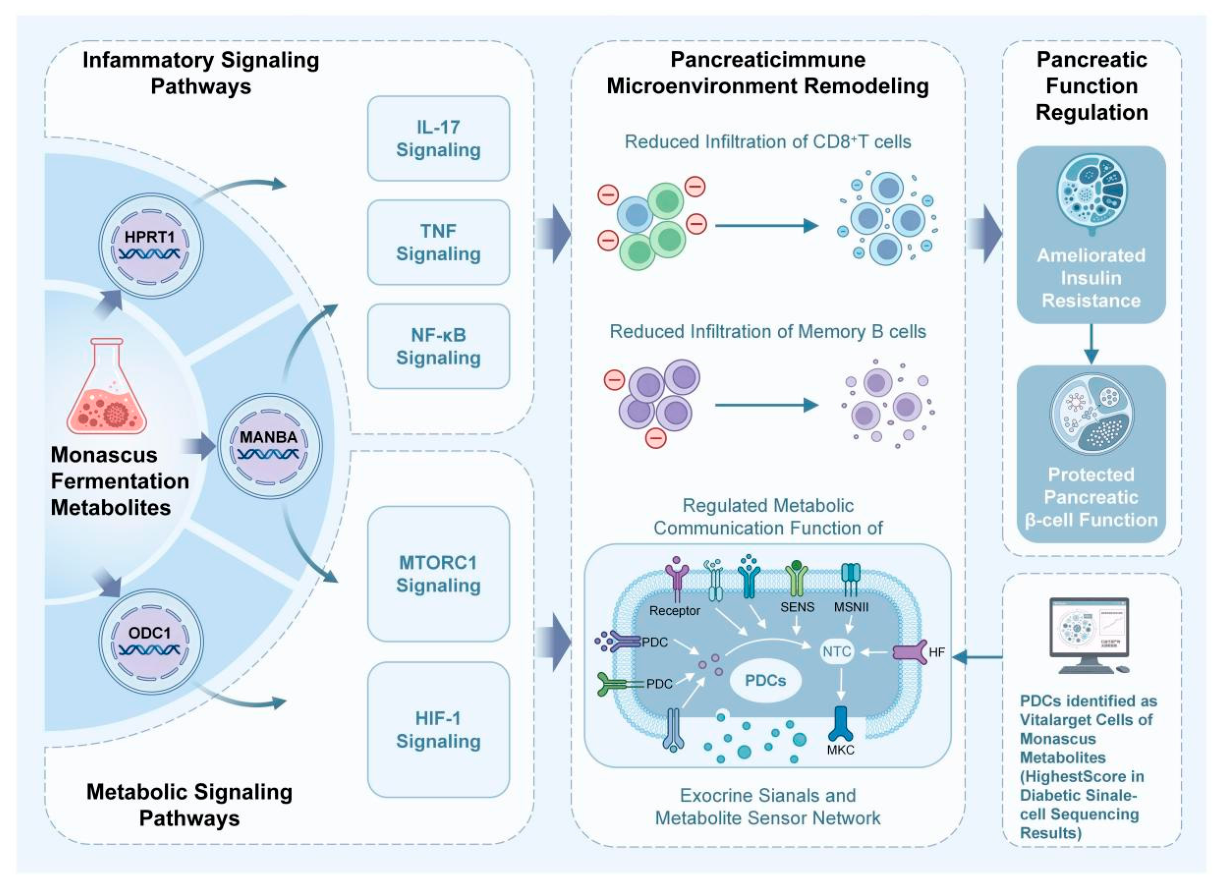
Disclaimer/Publisher’s Note: The statements, opinions and data contained in all publications are solely those of the individual author(s) and contributor(s) and not of MDPI and/or the editor(s). MDPI and/or the editor(s) disclaim responsibility for any injury to people or property resulting from any ideas, methods, instructions or products referred to in the content. |
© 2026 by the authors. Licensee MDPI, Basel, Switzerland. This article is an open access article distributed under the terms and conditions of the Creative Commons Attribution (CC BY) license (http://creativecommons.org/licenses/by/4.0/).
Copyright: This open access article is published under a Creative Commons CC BY 4.0 license, which permit the free download, distribution, and reuse, provided that the author and preprint are cited in any reuse.