
Submitted:
17 September 2026
Posted:
20 September 2026
You are already at the latest version
Abstract
Purpose: The usefulness of the Patient State Index (PSI), an electroencephalogram (EEG)-based tool recently introduced in pediatric critical care units (PICU) , and the clinical level of sedation has not been yet demonstrated in pediatric critical care patients. This study investigated the association between the Patient State Index (PSI) and the Richmond Agitation–Sedation Scale (RASS) in PICU patients to determine whether the PSI could serve as a reliable objective measure of sedation in critically ill children. Setting: a pediatric intensive care unit of a tertiary hospital. Methods: This prospective observational study continuously monitored PSI values using the SedLine® monitor (Masimo, Irvine, CA, USA). Monitoring began at the initiation of sedative therapy and continued for up to 2 hours after its discontinuation. PSI values were recorded immediately before each Richmond Agitation–Sedation Scale (RASS) assessment, which was performed by the attending physicians at the start of sedative therapy, at 6, 12, and 24 hours thereafter, and immediately before sedation withdrawal. Results: A total of 87 paired PSI and RASS measurements were obtained from 35 patients. The PSI showed a weak positive correlation with the RASS score (Spearman's rank correlation coefficient = 0.26; 95% confidence interval [CI], 0.049–0.467; p = 0.01). Agreement between the PSI and RASS was slight, with a Cohen's kappa coefficient of 0.14 (95% CI, 0.067–0.348; p = 0.09). PSI values did not differ significantly across RASS categories (Kruskal–Wallis test, p = 0.166). Receiver operating characteristic (ROC) curve analysis identified a PSI threshold of 39 for distinguishing light sedation (RASS ≥ −2) from deep sedation (RASS ≤ −3). The area under the ROC curve was 0.65 (95% CI, 0.534–0.766), with a sensitivity of 0.68 and a specificity of 2.38. Conclusions: The PSI showed only a weak correlation with the RASS in critically ill children. Therefore, it should be used cautiously as a standalone measure of sedation depth in the PICU. However, these findings do not negate its potential clinical value. Instead, the PSI should be interpreted as part of a multimodal neuromonitoring strategy, taking into account age-related EEG maturation, the clinical context, and the known limitations of EEG-derived indices in critically ill patients.
Keywords:
critically ill children
; pediatric intensive care unit
; patient state index
; Richmond agitation-sedation scale
; sedation
; Sedline
1. Introduction
Traditionally, continuous monitoring of critically ill patients in intensive care units has focused on haemodynamic and respiratory parameters, whereas neurological assessment—particularly in sedated or neuromuscularly blocked patients—has relied primarily on clinical examination and, less frequently, on neuroimaging. However, critically ill patients are highly vulnerable to acute brain injury and neurological complications, including seizures and cerebrovascular events, regardless of whether the primary illness is neurological in origin¹.
An optimal level of sedation (and analgesia) is crucial to manage unstable paediatric patients due to the many deleterious pathophysiological phenomena associated that might contribute to instability (such as tachycardia, tachypnoea, arterial hypertension, hyperglycaemia, vomiting and increased catabolism). In addition, appropriate analgesia can decrease stress and anxiety, facilitate device maintenance, contribute to nursing attention and enable adaptation to mechanical ventilation. When patients are comfortable, the risk of complications such as extubation, baro or volotrauma associated with mechanical ventilation, accidental loss of catheters or drains, decrease; thus contributing to reducing morbidity, mortality and length of hospital stay 2.
An optimal level of analgesia and sedation is crucial in the management of critically ill children, as inadequate control may exacerbate pathophysiological responses that contribute to clinical instability, including tachycardia, tachypnea, hypertension, hyperglycaemia, vomiting, and increased catabolism. Appropriate analgesia and sedation also reduce stress and anxiety, facilitate tolerance of invasive devices, improve nursing care, and enhance synchrony with mechanical ventilation. By maintaining patient comfort, the risk of complications such as accidental extubation, ventilator-induced barotrauma or volutrauma, and inadvertent dislodgement of catheters or drains is reduced, thereby contributing to lower morbidity, shorter hospital stays, and potentially improved survival².
Conversely, prolonged exposure to sedatives and analgesics is associated with a substantial risk of adverse effects, particularly iatrogenic withdrawal syndrome (IWS) and pediatric delirium (PD). The development of these complications is influenced by individual patient susceptibility but is also strongly associated with the type of sedative or analgesic used, cumulative dose, duration of therapy, and the rate or abruptness of drug discontinuation³. Younger children, especially infants, are at particularly high risk ⁴. The reported incidence of IWS varies widely, ranging from 17% to 57%, and may reach 64.6% in patients receiving continuous sedative therapy for five or more days⁵. Similarly, the reported incidence of PD ranges from 10% to 80%, reflecting differences in patient populations, clinical settings, and diagnostic methods⁶.
The Richmond Agitation–Sedation Scale (RASS) has recently been validated for use in pediatric patients and has also been translated and validated in Spanish⁷. The RASS classifies patients into 10 levels of agitation and sedation, ranging from −5 (unarousable) to +4 (combative)⁸.However, the RASS has several limitations. It is observer-dependent, requires intermittent bedside assessment, and may be difficult or impossible to apply accurately in patients receiving deep sedation or neuromuscular blockade⁹.
EEG provides continuous, non-invasive, real-time monitoring of brain activity and has become an important tool for neuromonitoring in critically ill patients¹⁰. However, interpretation of conventional EEG requires specialized expertise. SedLine® (Masimo, Irvine, CA, USA) is a processed EEG monitoring system that integrates EEG and electromyographic (EMG) signals to generate simplified indices of brain function, including the Patient State Index (PSI)¹⁰.
Sedative agents produce characteristic, dose-dependent changes in EEG activity. Purdon et al. demonstrated that light sedation is typically associated with increased alpha (8–12 Hz) and low-beta (12–20 Hz) activity, whereas deeper levels of sedation are characterized by the predominance of theta (4–8 Hz) and delta (0.5–4 Hz) oscillations. With profound anaesthesia, burst suppression may develop, eventually progressing to an isoelectric EEG under extreme conditions such as profound anaesthetic coma or brain death¹¹.
Overall, both intravenous and inhalational anaesthetic agents reduce the frequency and increase the amplitude of cortical electrical activity, reflecting progressive depression of cerebral function and decreasing levels of consciousness. Furthermore, anaesthetic-induced burst suppression has been associated with adverse clinical outcomes, including postoperative delirium and increased mortality¹²˒¹³. While paediatric evidence is limited, recent studies describe the potential applications of this emergent technology in PICU setting 14.
The SedLine® monitor provides continuous processed EEG recording and generates four numerical parameters using proprietary algorithms: the PSI, EMG activity , suppression ratio (SR), and spectral edge frequency (SEF). The PSI is a composite index derived from both EEG and non-EEG variables and ranges from 0 to 100. Lower values indicate deeper levels of sedation or hypnosis, whereas higher values reflect increasing levels of wakefulness.¹⁵
In adults, the following PSI ranges have been proposed to categorize sedation depth: >75, awake or minimally sedated; 50–75, light sedation; 25–49, moderate sedation; and <25, deep sedation or excessive hypnotic effect.¹⁶ However, these thresholds have not been validated in critically ill pediatric patients and should therefore be interpreted with caution¹⁷. Several factors may influence PSI values independently of sedation depth. For example, ketamine, nitrous oxide, and dexmedetomidine may increase PSI despite adequate or deep sedation because of their distinct effects on EEG activity¹⁸. In addition, EMG activity arising from the temporal muscles may introduce artefacts that artificially elevate PSI values, potentially reducing the accuracy of sedation assessment.
The SR represents the percentage of the preceding 60 seconds during which the EEG amplitude remains below 5 μV and is expressed as a value ranging from 0% to 100%.
Higher SR values indicate increasing degrees of burst suppression and have been associated with adverse neurological outcomes, including postoperative cognitive dysfunction and delirium¹⁹. The SEF95, defined as the frequency below which 95% of the EEG spectral power is contained, provides additional information on sedation depth.
Lower SEF95 values are associated with deeper levels of sedation, whereas values approaching 30 Hz are consistent with lighter sedation. Previous studies have demonstrated a correlation between PSI and SEF95, with PSI ranges of 60–80, 40–59, and 0–19 corresponding approximately to SEF95 values of 15–20 Hz, 6–14 Hz, and <5 Hz, respectively⁹. Because SEF95 is calculated independently for the right and left hemispheres, interhemispheric asymmetries can also be identified, potentially providing additional information on focal cerebral dysfunction. These limitations highlight the need to evaluate the clinical performance of the PSI in pediatric critical care before it can be routinely incorporated into sedation monitoring protocols. The present clinical study is the first to analize the correlation between the PSI and the RASS scale in PICU.
2. Objective
The primary objective of this prospective observational study was to evaluate the correlation and agreement between the PSI and the RASS for assessing sedation depth in critically ill children admitted to a PICU.
3. Material and Methods
3.1. Study Design
This single-centre, prospective observational study was conducted in the Pediatric Intensive Care Unit (PICU) of Virgen de las Nieves University Hospital, a tertiary referral center in Granada, Spain, between 1 June 2022 and 31 December 2023.
3.2. Study Setting
The study was conducted in an eight-bed medical–surgical PICU within a 1,370-bed tertiary university hospital. Patient care is provided by full-time pediatric intensivists and specialized PICU nurses. Sedation targets and overall patient management— ventilator weaning, spontaneous breathing trials, and extubation planning—are established during daily multidisciplinary team rounds.
Each PICU bed is equipped with a SedLine® brain function monitor (Masimo, Irvine, CA, USA). The PSI is derived from EEG signals recorded using a disposable forehead sensor. The sensor incorporates four recording electrodes positioned at Fp1, Fp2, F7, and F8 according to the International 10–20 EEG System (designated L1, L2, R1, and R2), together with a reference electrode and a ground electrode (Figure 1 Sedline sensor).
3.3. Study Population
The study population comprised children aged 6 months to 14 years who were admitted to the PICU during the study period and received continuous intravenous sedative therapy for at least 12 hours. Children younger than 6 months were excluded because of the immaturity of thalamocortical neural circuits and the absence of the frontal low-voltage alpha oscillations typically induced by most sedative agents, which limits the reliability of EEG-derived sedation indices in this age group¹⁷˒²⁰. Additional exclusion criteria included a history of seizures or epilepsy, pre-existing encephalopathy or other significant neurological disorders (including cerebrovascular disease), and the use of continuous neuromuscular blocking agents. In postoperative patients, EEG monitoring was initiated at least 6 hours after PICU admission to allow adequate recovery from the effects of neuromuscular blockade administered during surgery.
3.4. Research Commission
The study was approved by the Andalusian Ethics and Clinical Research Committee and by the Research Commission of the Virgen de las Nieves University Hospital in Granada.
3.5. Sedation Protocol
Sedative therapy was administered according to the recommendations of the 2020 Spanish Society of Pediatric Intensive Care. The protocol incorporates scheduled rotation of sedative agents to reduce the risk of IWS. Midazolam (0.05–0.18 mg/kg/h), propofol (1–4 mg/kg/h), and dexmedetomidine (0.2–0.7 μg/kg/h) were administered, either alone or in combination, according to the patient's clinical condition and sedation requirements.
3.6. Sample Size
Given the limited published evidence and the exploratory nature of this study, a convenience sample of consecutive eligible patients admitted to the PICU of a tertiary pediatric hospital in Granada was recruited according to the predefined inclusion and exclusion criteria.
3.7. General Information Source
Demographic and clinical data were collected for all patients, including age, sex, reason for PICU admission, underlying medical conditions, the need for mechanical ventilation, and the duration of continuous intravenous sedation and analgesia (days).
Sedation depth was assessed using the RASS. For the purposes of the analysis, RASS scores were categorized as deep sedation (RASS ≤ −3) and light sedation (RASS −2 to 0)²¹. RASS assessments were performed by the attending physicians at the initiation of continuous sedative therapy and at 6, 12, and 24 hours thereafter, as well as immediately before discontinuation of sedation. The target level of sedation was determined by the PICU team according to each patient's clinical condition, and sedative doses were adjusted accordingly.
PSI values were obtained using the SedLine® 2010 brain function monitoring module and the Root® patient monitoring platform (Masimo, Irvine, CA, USA). After placement of the disposable forehead sensor, electrode impedance was verified before monitoring commenced. PSI was recorded continuously throughout sedative therapy and for up to 2 hours after its discontinuation. In addition, PSI values were documented immediately before each RASS assessment
3.8. Statistical Analyses
Continuous variables are presented as medians with interquartile ranges (IQRs), and categorical variables as frequencies and percentages.
The distribution of PSI values was assessed using the Shapiro–Wilk test, which demonstrated that the data were not normally distributed. Accordingly, non-parametric statistical methods were used throughout the analysis. The association between PSI and RASS scores was evaluated using Spearman's rank correlation coefficient, interpreted as weak (<0.40), moderate (0.40–0.69), or strong (≥0.70). Differences in PSI values across RASS categories were assessed using the Kruskal–Wallis test.
Agreement between PSI- and RASS-based sedation assessments was evaluated using Cohen's kappa coefficient, interpreted as slight (<0.20), fair (0.21–0.40), moderate (0.41–0.60), substantial (0.61–0.80), or almost perfect (0.81–1.00).
For secondary analyses, RASS scores ≤ −3 (−3, −4, and −5) were classified as deep sedation, whereas RASS scores ≥ −2 were classified as light sedation. PSI values between these two groups were compared using the Mann–Whitney U test. Receiver operating characteristic (ROC) curve analysis was subsequently performed to determine the optimal PSI cut-off for discriminating between light and deep sedation. The optimal threshold was identified using the Youden index, and the area under the ROC curve (AUC), sensitivity, specificity, and corresponding 95% confidence intervals (CIs) were calculated.
All statistical tests were two-sided, with statistical significance defined as p < 0.05. Results are reported with 95% confidence intervals where appropriate. Statistical analyses were performed using Stata version 16.1 (StataCorp, College Station, TX, USA).
4. Results
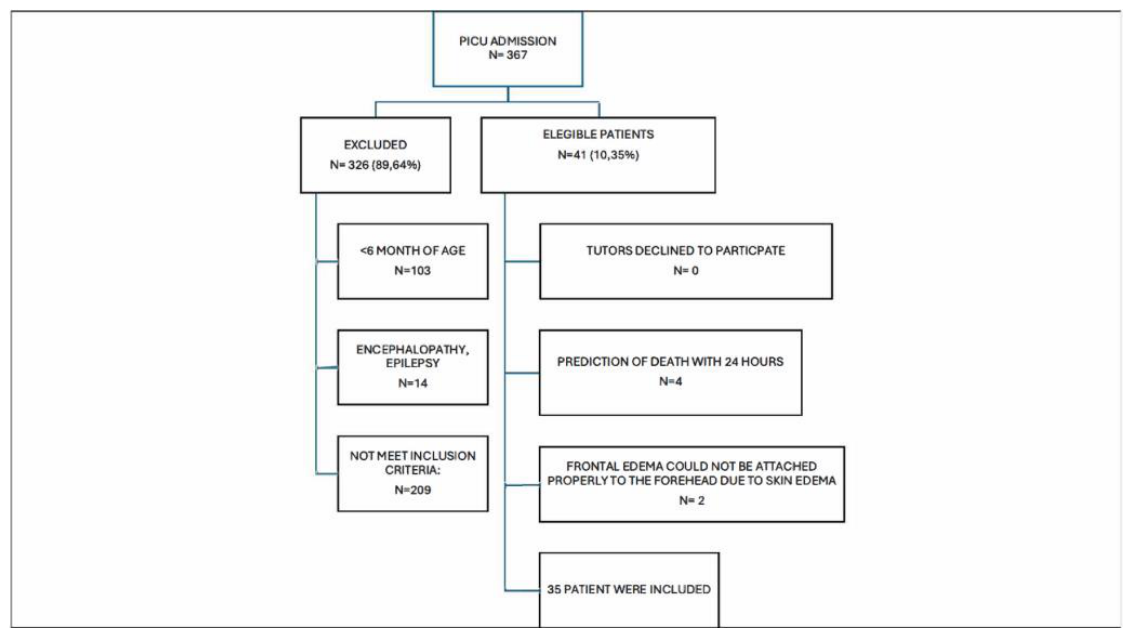
Between 1 June 2022 and 31 December 2023, 364 children were admitted to the PICU. Of these, 330 did not meet the inclusion criteria. Consequently, 37 consecutive patients were enrolled. Two patients were subsequently excluded because severe facial oedema prevented appropriate placement of the SedLine® forehead sensor (Figure 2).
One device-related adverse event was recorded: a single patient developed a mild pressure injury at the sensor application site. The demographic and clinical characteristics of the study population are summarized in Table 1.
Continuous sedative therapy included midazolam (0.05–0.18 mg/kg/h), propofol (1–4 mg/kg/h), and dexmedetomidine (0.2–0.7 μg/kg/h), administered either alone or in combination. Continuous analgesia was provided with fentanyl (0.5–2 μg/kg/h), remifentanil (0.05–2 μg/kg/min), or morphine (5–20 μg/kg/h).
A total of 87 paired PSI and RASS measurements were obtained from the study population. The distribution of PSI values according to RASS category is shown in Table 2.
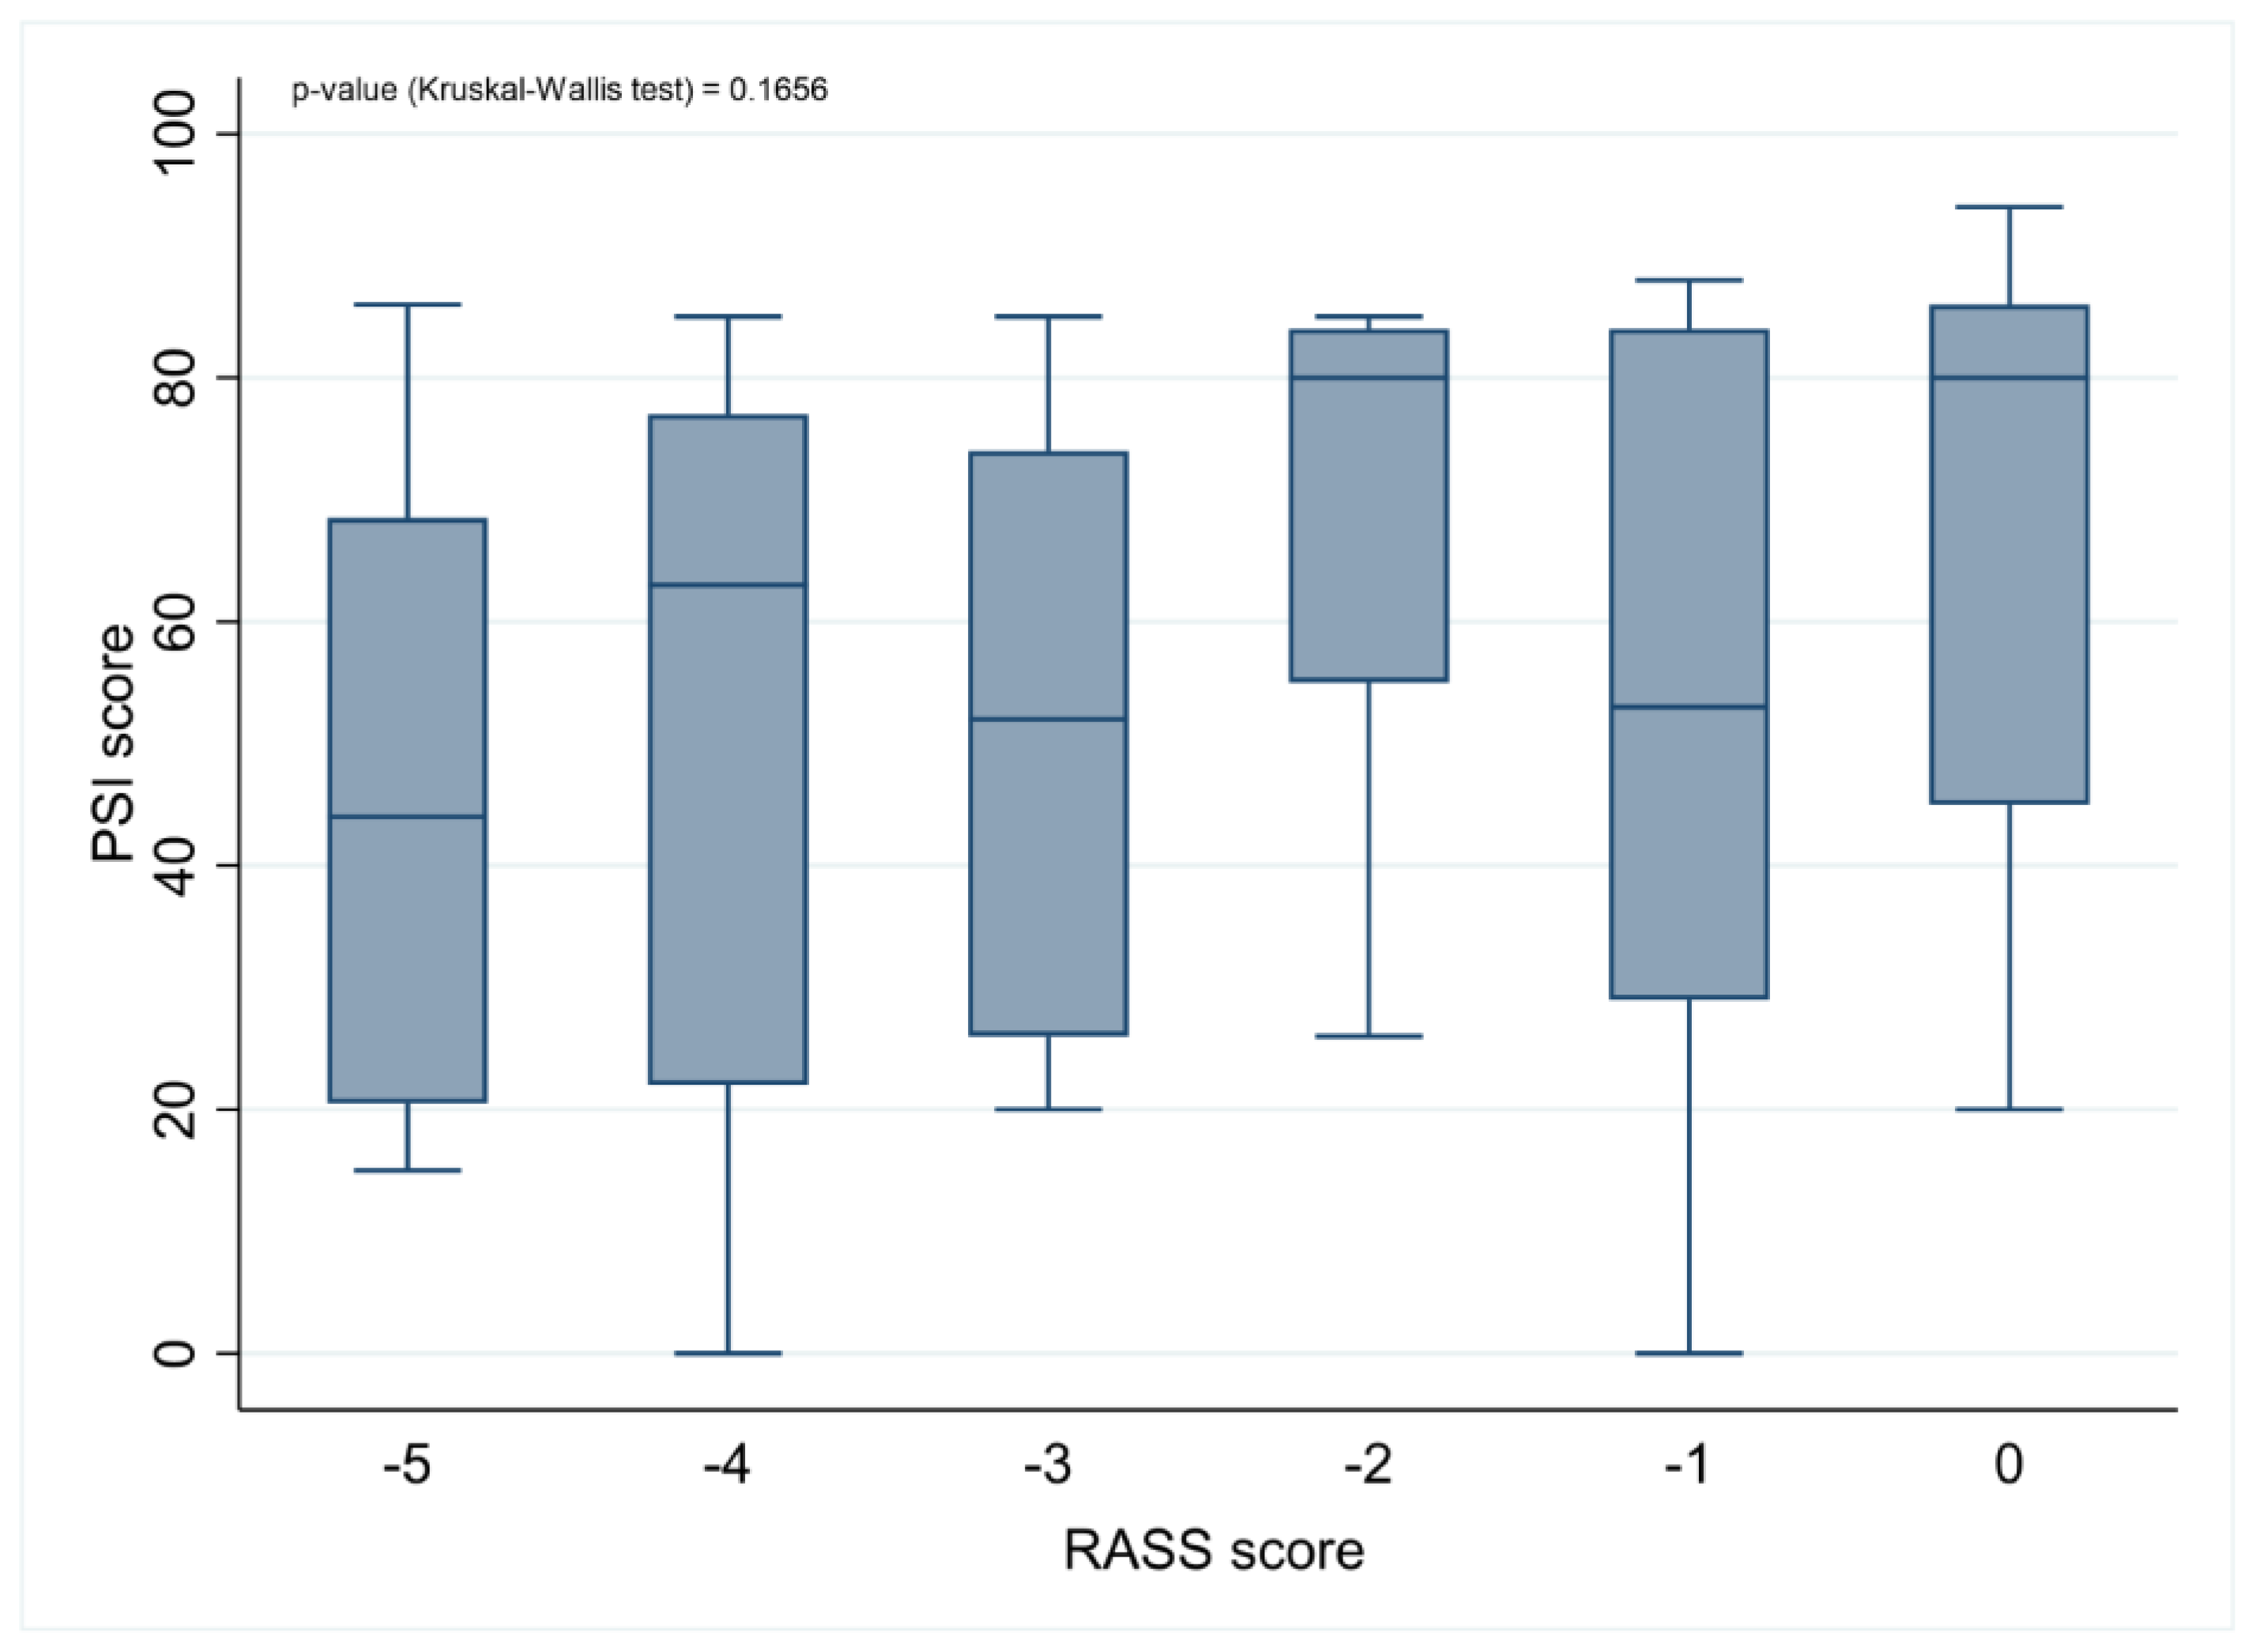
PSI showed a weak but statistically significant positive correlation with the RASS score (Spearman's rank correlation coefficient, r = 0.26; 95% confidence interval [CI], 0.049–0.467; p = 0.01). Agreement between PSI and RASS was slight (Cohen's κ = 0.14; 95% CI, −0.067 to 0.348; p = 0.09). The distribution of PSI values across RASS categories is illustrated in Figure 3.
When patients were classified as having light sedation (RASS ≥ −2) or deep sedation (RASS ≤ −3), PSI values differed significantly between groups. The median (IQR) PSI was 75 (51) in the light sedation group and 52 (49) in the deep sedation group (Mann–Whitney U test, p = 0.016).
Logistic regression analysis demonstrated a trend toward lower odds of deep sedation with increasing PSI values (odds ratio [OR], 0.984; 95% CI, 0.968–1.001). Receiver operating characteristic (ROC) curve analysis yielded an area under the curve (AUC) of 0.65 (95% CI, 0.534–0.766) for distinguishing light sedation (RASS ≥ −2) from deep sedation (RASS ≤ −3). The optimal PSI cut-off was 39 (95% CI, 14.5–63.5), corresponding to a sensitivity of 68% and a specificity of 28%.
5. Discussion
To our knowledge, this is the first clinical study to evaluate the relationship between the PSI and the RASS for assessing sedation depth in critically ill children admitted to a PICU. Most studies evaluating the PSI have focused on adults undergoing general anesthesia. Even in adult intensive care populations, however, evidence supporting the use of the PSI for sedation monitoring remains limited. In a recent prospective study including 382 paired PSI and RASS measurements from 50 critically ill adults, Idei et al. reported a positive correlation between the two measures despite the unique challenges of the ICU environment, including patient movement, muscle contraction, edema, and diaphoresis. They also found that the PSI showed good sensitivity for identifying deep sedation and suggested that preventing unnecessary oversedation through EEG-guided monitoring could improve clinically relevant outcomes, including shorter durations of mechanical ventilation and ICU length of stay²¹.
The interpretation of processed EEG indices in children is particularly challenging because the EEG undergoes profound developmental changes during infancy and childhood. By approximately 10–14 years of age, the EEG closely resembles that of adults, whereas in younger children—and especially in infants—the background activity is characterized by lower frequencies and lower power. In preterm neonates and young infants, periods of physiological EEG discontinuity and even isoelectric activity may occur during both wakefulness and sleep. Consequently, a normal EEG pattern in neonates or infants may resemble the EEG of an anesthetized older child or adult. As most proprietary EEG-derived indices, including the PSI, were developed and validated using adult EEG characteristics, their reliability in neonates and young infants is inherently limited.²² Age-dependent EEG maturation may therefore contribute to the reduced accuracy of EEG-based monitoring of sedation depth in pediatric patients²³.
Despite these limitations, processed EEG monitoring offers potential clinical advantages. Intraoperative EEG-guided anesthesia has been associated with lower anesthetic exposure, faster recovery, reduced intraoperative hypotension, and a lower risk of accidental awareness during anesthesia. These benefits may be particularly relevant in neonates, young infants, and children with cardiovascular disease, who are especially vulnerable to anesthetic-related respiratory and hemodynamic complications⁹. Whether similar benefits can be achieved in the PICU remains uncertain.
In critically ill patients, additional factors further complicate the interpretation of processed EEG. EEG signals are susceptible to interference from external electrical sources and EMG activity generated by spontaneous movement, shivering, or inadequate neuromuscular relaxation. Increased EMG activity may artificially elevate PSI values, resulting in overestimation of the level of consciousness despite adequate sedation²³.
Our findings are consistent with previous studies evaluating other processed EEG indices in pediatric critical care. The Bispectral Index (BIS), another EEG-derived monitor widely used during anesthesia, has not been reliably validated for assessing sedation depth in the PICU. Amigoni et al. reported only a weak correlation between BIS and clinical sedation scales in critically ill children. The authors suggested that this discrepancy may arise because clinical sedation scales evaluate the child's overall behavioral state—including pain, agitation, and comfort—whereas EEG-derived indices primarily quantify cortical electrical activity and do not account for these additional clinical dimensions²⁴.
Taken together, these findings suggest that several factors may explain the weak correlation and slight agreement observed between PSI and RASS in our study. These include developmental differences in EEG maturation, technical limitations related to signal acquisition in the ICU environment, susceptibility to EMG artefacts, and the fundamental conceptual differences between behavioral sedation scales and EEG-derived indices. Furthermore, current evidence supporting the use of processed EEG for sedation monitoring in critically ill children remains limited, particularly regarding clinically meaningful outcomes.
Accordingly, our results do not indicate that the PSI lacks clinical utility. Rather, they suggest that it should not be used as a standalone measure of sedation depth in the PICU. Instead, the PSI should be interpreted alongside validated clinical sedation scales and within the broader clinical context, taking into account the patient's age, neurological development, and the inherent limitations of EEG-derived monitoring.
Further multicenter studies with larger pediatric cohorts are needed to establish age-specific reference values, evaluate the performance of processed EEG across different sedative regimens, and determine whether multimodal neuromonitoring strategies combining processed EEG with complementary techniques, such as near-infrared spectroscopy, can improve neurological monitoring and patient outcomes in the PICU.²³
6. Conclusions
This is, to our knowledge, the first clinical study to evaluate the correlation and agreement between the Patient State Index (PSI) and the Richmond Agitation–Sedation Scale (RASS) for assessing sedation depth in critically ill children admitted to a pediatric intensive care unit (PICU).
The PSI showed only a weak correlation and slight agreement with the RASS. These findings suggest that the PSI should be interpreted with caution and should not be used as a standalone tool for assessing sedation depth in the PICU. However, our results do not imply that the PSI lacks clinical utility. Rather, it should be interpreted as part of a multimodal approach to sedation monitoring, integrating clinical assessment with consideration of age-related EEG maturation and the inherent limitations of EEG-derived indices in critically ill pediatric patients.
7. Limitations
This study has several limitations. First, children younger than 6 months were excluded. Although these patients are particularly vulnerable to both under- and oversedation, the immaturity of their EEG patterns limits the reliability of EEG-derived indices, thereby restricting the generalizability of our findings to infants.
Second, this was a single-center study conducted exclusively in a PICU , where a substantial proportion of patients were admitted following surgery. In these patients, baseline measurements immediately after admission were not included because of the residual effects of general anesthesia and intraoperative neuromuscular blockade, which could have influenced PSI measurements.
Third, because of the exploratory nature of the study and the limited number of eligible patients, a convenience sample of consecutive patients was recruited. Although this ap proach was appropriate for a pilot study, it may have introduced selection bias and limits the external validity of the findings. In addition, the relatively small sample size and the repeated measurements obtained from individual patients may have reduced the precision of the estimated associations.
Therefore, larger multicenter studies including diverse pediatric populations and clinical settings in which prolonged sedation is routinely administered are needed to further evaluate the clinical performance of processed EEG monitoring. Future research should also determine whether processed EEG indices such as the Patient State Index or direct interpretation of EEG spectrograms provides greater clinical utility for guiding sedation titration and improving patient outcomes in critically ill children.
Funding
This research was carried out with funding obtained from the 2022 Ruza Research Grant of the Spanish Society of Paediatric Intensive Care.
Informed Consent
Written informed consent was obtained from the legal guardians of all participants after they had received and understood the study information. In addition, children aged 12 years or older who were considered capable of understanding the study provided written assent using an age-appropriate assent form.
Acknowledgments
The authors thank the guardians of the patients for enabling their participation in the study. We also thank the Research Support Unit of the Virgen de las Nieves University Hospital in Granada for their collaboration.
Conflicts of Interest
The authors declare they have no conflict of interest regarding this study.
References
- Wainwright, M.S. Neurologic Complications in the Pediatric Intensive Care Unit. Contin. Lifelong Learn. Neurol. 2018, 24, 288–299. [Google Scholar] [CrossRef] [PubMed]
- Johnson, P.N.; Miller, J.L.; Hagemann, T.M. Sedation and Analgesia in Critically Ill Children. AACN Adv. Crit. Care 2012, 23, 415–434. [Google Scholar] [CrossRef] [PubMed]
- Mondardini, M.C.; Sperotto, F.; Daverio, M.; Caramelli, F.; Gregori, D.; Caligiuri, M.F.; et al. Efficacy and safety of dexmedetomidine for prevention of withdrawal syndrome in the pediatric intensive care unit: protocol for an adaptive, multicenter, randomized, double-blind, placebo-controlled, non-profit clinical trial. Trials 2019, 20, 710. [Google Scholar] [CrossRef] [PubMed]
- Anand, K.J.S.; Willson, D.F.; Berger, J.; Harrison, R.; Meert, K.L.; Zimmerman, J.; et al. Tolerance and Withdrawal From Prolonged Opioid Use in Critically Ill Children. Pediatrics 2010, 125, e1208–e1225. [Google Scholar] [CrossRef] [PubMed]
- Amigoni, A.; Mondardini, M.C.; Vittadello, I.; Zaglia, F.; Rossetti, E.; Vitale, F.; et al. Withdrawal Assessment Tool-1 Monitoring in PICU. Pediatr. Crit. Care Med. 2017, 18, e86–e91. [Google Scholar] [CrossRef] [PubMed]
- Han, Y.; Miao, M.; Li, P.; Yang, Y.; Zhang, H.; Zhang, B.; et al. EEG-Parameter-Guided Anesthesia for Prevention of Emergence Delirium in Children. Brain Sci. 2022, 12, 1195. [Google Scholar] [CrossRef] [PubMed]
- Rojas-Gambasica, J.A.; Valencia-Moreno, A.; Nieto-Estrada, V.H.; Méndez-Osorio, P.; Molano-Franco, D.; Jiménez-Quimbaya, Á.T.; et al. Validación transcultural y lingüística de la escala de sedación y agitación Richmond al español. Rev. Colomb. Anestesiol. 2016, 44, 218–223. [Google Scholar] [CrossRef]
- Smith, H.A.B.; Besunder, J.B.; Betters, K.A.; Johnson, P.N.; Srinivasan, V.; Stormorken, A.; et al. 2022 Society of Critical Care Medicine Clinical Practice Guidelines on Prevention and Management of Pain, Agitation, Neuromuscular Blockade, and Delirium in Critically Ill Pediatric Patients With Consideration of the ICU Environment and Early Mobility. Pediatr. Crit. Care Med. 2022, 23, e74–e110. [Google Scholar] [CrossRef] [PubMed]
- Yuan, I.; Xu, T.; Kurth, C.D. Using Electroencephalography (EEG) to Guide Propofol and Sevoflurane Dosing in Pediatric Anesthesia. Anesthesiol. Clin. 2020, 38, 709–725. [Google Scholar] [CrossRef] [PubMed]
- Marchant, N.; Sanders, R.; Sleigh, J.; Vanhaudenhuyse, A.; Bruno, M.-A.; Brichant, J.F.; et al. How Electroencephalography Serves the Anesthesiologist. Clin. EEG Neurosci. 2014, 45, 22–32. [Google Scholar] [CrossRef] [PubMed]
- Purdon, P.L.; Sampson, A.; Pavone, K.J.; Brown, E.N. Clinical Electroencephalography for Anesthesiologists. Anesthesiology 2015, 123, 937–960. [Google Scholar] [CrossRef] [PubMed]
- Fritz, B.A.; Kalarickal, P.L.; Maybrier, H.R.; Muench, M.R; Dearth, D.; Chen, Y.; et al. Intraoperative Electroencephalogram Suppression Predicts Postoperative Delirium. Anesth. Analg. 2016, 122, 234–242. [Google Scholar] [CrossRef] [PubMed]
- Soehle, M.; Dittmann, A.; Ellerkmann, R.K.; Baumgarten, G.; Putensen, C.; Guenther, U. Intraoperative burst suppression is associated with postoperative delirium following cardiac surgery: a prospective, observational study. BMC Anesthesiol. 2015, 15, 61. [Google Scholar] [CrossRef] [PubMed]
- Fahy, B.G.; Chau, D.F. The Technology of Processed Electroencephalogram Monitoring Devices for Assessment of Depth of Anesthesia. Anesth. Analg. 2018, 126, 111–117. [Google Scholar] [CrossRef] [PubMed]
- Pérez, G.A.; Pérez, J.A.M.; Álvarez, S.T.; Morales, J.A.R.; Fragoso, A.M.L. Modelling the PSI response in general anesthesia. J. Clin. Monit. Comput. 2021, 35, 1015–1025. [Google Scholar] [CrossRef] [PubMed]
- Goudra, B.; Singh, P.M.; Gouda, G.; Borle, A.; Carlin, A.; Yadwad, A. Propofol and non-propofol based sedation for outpatient colonoscopy-prospective comparison of depth of sedation using an EEG based SEDLine monitor. J. Clin. Monit. Comput. 2016, 30, 551–557. [Google Scholar] [CrossRef] [PubMed]
- Lee, J.M.; Akeju, O.; Terzakis, K.; Pavone, K.J.; Deng, H.; Houle, T.T.; et al. A Prospective Study of Age-dependent Changes in Propofol-induced Electroencephalogram Oscillations in Children. Anesthesiology 2017, 127, 293–306. [Google Scholar] [CrossRef] [PubMed]
- Hernández-González, S.; Perdomo-Perdomo, M.B.; Sánchez-Gamarro, R.; Ávila-Fuentes, S.; Hernández-Rodríguez, L.; Fernández-García, J. Electroencefalografía básica para monitores de profundidad anestésica. Rev. Mex. Anestesiol. 2023, 46, 125–132. [Google Scholar] [CrossRef] [PubMed]
- Shanker, A.; Abel, J.H.; Schamberg, G.; Brown, E.N. Etiology of Burst Suppression EEG Patterns. Front Psychol. 2021, 12. [Google Scholar] [CrossRef] [PubMed]
- Cornelissen, L.; Kim, S.-E.; Purdon, P.L.; Brown, E.N.; Berde, C.B. Age-dependent electroencephalogram (EEG) patterns during sevoflurane general anesthesia in infants. Elife 2015, 4. [Google Scholar] [CrossRef] [PubMed]
- Idei, M.; Seino, Y.; Sato, N.; Yoshida, T.; Saishu, Y.; Fukui, K.; et al. Validation of the patient State Index for monitoring sedation state in critically ill patients: a prospective observational study. J. Clin. Monit. Comput. 2023, 37, 147–154. [Google Scholar] [CrossRef] [PubMed]
- Tsuchida, T.N.; Wusthoff, C.J.; Shellhaas, R.A.; Abend, N.S.; Hahn, C.D.; Sullivan, J.E.; et al. American Clinical Neurophysiology Society Standardized EEG Terminology and Categorization for the Description of Continuous EEG Monitoring in Neonates. J. Clin. Neurophysiol. 2013, 30, 161–173. [Google Scholar] [CrossRef] [PubMed]
- Szentgyorgyi, L.; Howitt, S.H.; Iles-Smith, H.; Krishnamoorthy, B. Sedation management and processed EEG-based solutions during venovenous extracorporeal membrane oxygenation: a narrative review of key challenges and potential benefits. J. Artif. Organs 2025. [Google Scholar] [CrossRef] [PubMed]
- Amigoni, A.; Mozzo, E.; Brugnaro, L.; Gentilomo, C.; Stritoni, V.; Michelin, E.; et al. Assessing sedation in a pediatric intensive care unit using Comfort Behavioural Scale and Bispectral Index: these tools are different. Minerva Anestesiol. 2012, 78, 322–329. [Google Scholar] [PubMed]
Figure 1.
Flowchart of patient enrollment .
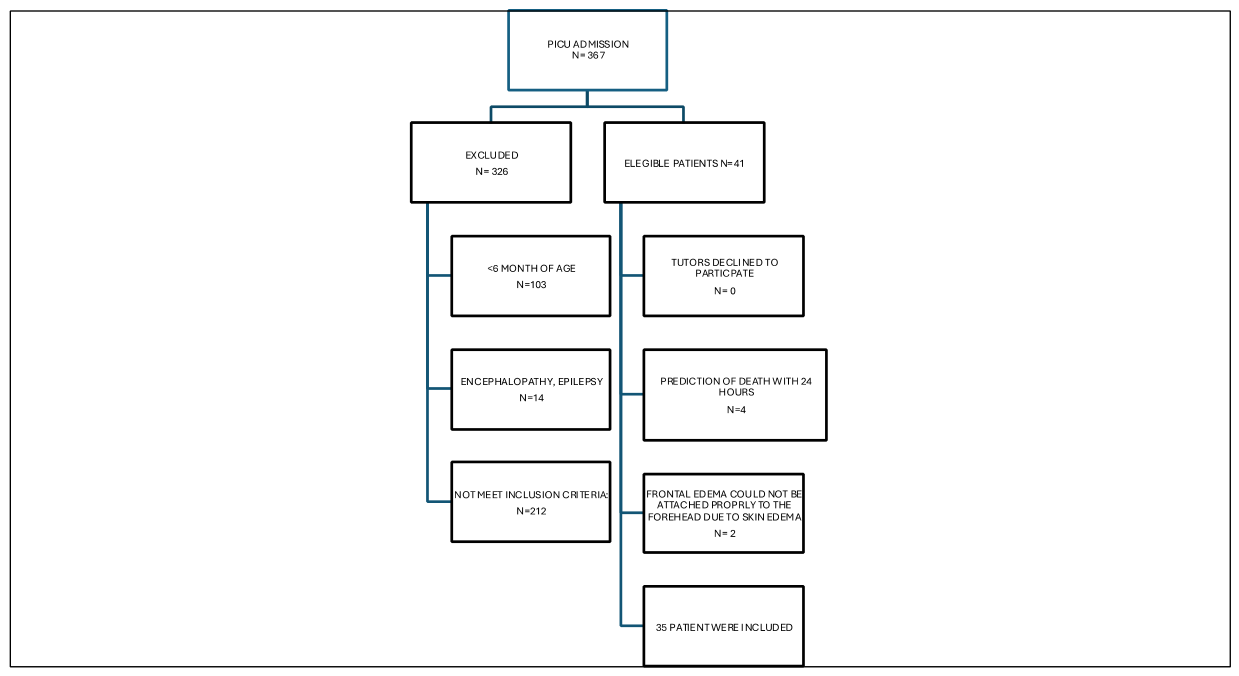

Table 1.
Patient Characteristics.
| Variable | n (%) |
|---|---|
| Male sex | 18 (51.43) |
| Cardiac surgery | 16 (45.71) |
| Maxillofacial surgery | 5 (14.29 ) |
| Neurosurgery | 4 (11.43 ) |
| Pneumonia | 4 (11.43 ) |
| Brain trauma | 2 (5.71 ) |
| Others | 4 (11,43) |
| Invasive mechanical ventilation at delivery | 28 (80.00) |
| Encephalopathy/Epilepsy | 0 (0) |
| Sedline ® electrode complications | 1 (2.85) |
| Median (IQR) | |
| Age (years) | 5.08 ( 8.3) |
| Length of PICU stay (days) | 9.81 ( 10) |
| Duration of sedative therapy (days) | 3.32 (3) |
| Duration of analgesic therapy (days) | 3.59 ( 3) |
PICU: Paediatric Intensive Care Unit. IQR: Interquartile Range.
Table 2.
p-value (Kruskal-Wallis test)=0.1656. RASS: Richmond Agitation-Sedation Scale.
| RASS | N | Median | IQR |
|---|---|---|---|
| -5 | 8 | 45,88 | 48 |
| -4 | 18 | 52 | 48 |
| -3 | 15 | 63 | 55 |
| -2 | 9 | 80 | 29 |
| -1 | 18 | 53 | 55 |
| 0 | 19 | 80 | 41 |
Disclaimer/Publisher’s Note: The statements, opinions and data contained in all publications are solely those of the individual author(s) and contributor(s) and not of MDPI and/or the editor(s). MDPI and/or the editor(s) disclaim responsibility for any injury to people or property resulting from any ideas, methods, instructions or products referred to in the content. |
© 2026 by the authors. Licensee MDPI, Basel, Switzerland. This article is an open access article distributed under the terms and conditions of the Creative Commons Attribution (CC BY) license (http://creativecommons.org/licenses/by/4.0/).
Copyright: This open access article is published under a Creative Commons CC BY 4.0 license, which permit the free download, distribution, and reuse, provided that the author and preprint are cited in any reuse.