
Submitted:
19 September 2026
Posted:
20 September 2026
You are already at the latest version
Abstract
Background: Bedaquiline (BDQ), delamanid (DLM), and linezolid (LZD) are core drugs for multidrug-resistant tuberculosis (MDR-TB) treatment. Comprehensive regional data on phenotypic susceptibility and genotypic resistance-associated mutations are essential to guide optimized therapy. This study aimed to characterize phenotypic and genotypic resistance in treatment-naïve MTBC isolates by determining MICs of BDQ, DLM, and LZD and identifying associated genetic mutations. Methods: Minimum inhibitory concentrations (MICs) of BDQ, DLM, and LZD were determined for 71 Mycobacterium tuberculosis isolates (30 fully drug-susceptible and 41 MDR-TB) collected in the Cukurova region of Southern Türkiye between 2021 and 2023 using the MGIT 960/EpiCenter system. Sequencing of resistance-associated genes was analyzed: atpE and Rv0678 for BDQ, ddn and fbiA for DLM, and rrl and rplC for LZD. Results: MICs ranged from ≤0.025–6.4 µg/mL for BDQ, 0.005–0.32 µg/mL for DLM, and 0.125–2 µg/mL for LZD. According to WHO breakpoints, resistance rates were 7.0% for BDQ, 4.2% for DLM, and 7% for LZD, all confined to MDR-TB isolates. Nine MDR-TB isolates (12.7%) harbored atpE mutations, including both previously reported and putatively novel substitutions. A single ddn mutation was detected in a DLM-susceptible isolate. No mutations were observed in Rv0678, fbiA, rrl, or rplC. Conclusion: BDQ, DLM and LZD showed strong activity against MDR-TB isolates. However, the presence of atpE variants in both resistant and susceptible isolates demonstrated genotype-phenotype discordance of resistance. These results underline the necessity of the combination of genetic and phenotypic testing for detection of resistance and guidance for treatment.
Keywords:
tuberculosis
; multidrug-resistant
; MDR-TB
; MIC
; resistance mutation
Introduction
Tuberculosis (TB) remains the leading cause of death among infectious diseases worldwide. According to the World Health Organization (WHO) Global TB Report, there were 10.7 million new TB cases and 1.23 million TB-related deaths in 2024 [1].
Every year, approximately half a million cases of multidrug-resistant tuberculosis (MDR-TB) or rifampicin-resistant tuberculosis (RR-TB) are reported globally [1].
Current MDR-TB and extensively drug-resistant TB (XDR-TB) regimens are lengthy, costly, and more toxic. With rising drug-resistant TB prevalence, new diagnostics and effective drug combinations, including linezolid, as well as novel agents with innovative mechanisms of action such as bedaquiline and delamanid, are urgently needed [2,3].
Bedaquiline (BDQ) is a diarylquinoline and WHO Group A drug that inhibits mycobacterial ATP synthase by blocking proton transport and is a core drug component of MDR/RR-TB regimens [4]. BDQ has a good safety profile, but may be less effective in patients previously treated with clofazimine (CFZ) due to Rv0678 mutations [5]. There is a growing emergence of resistance to BDQ, which is associated with worse treatment outcomes [6], and this is caused by mutations in atpE, the intergenic region of Rv0678–Rv0677c (MmpL5/MmpS5) and pepQ (Rv2535c), which can cause resistance to BDQ and CFZ [5,7].
Delamanid (DLM), a dihydro-nitroimidazooxazole derivative, inhibits mycolic acid synthesis in M. tuberculosis complex (MTBC) cell walls [8]. Although it does not exhibit cross-resistance with first-line drugs, its high spontaneous mutation rate may promote rapid resistance without effective combination therapy [9]. Key genes associated with resistance are involved in prodrug activation, particularly the F420-dependent nitroreductase ddn [10].
Linezolid (LZD) is an oxazolidinone antibacterial agent that can readily inhibit protein synthesis by binding to the ribosome at the peptidyl-transferase center, and resistance is associated with mutations in the genes for the 23S rRNA and the L3 ribosomal protein. The most common mechanisms of linezolid resistance are rrl and rplC mutation [11].
Although BDQ, DLM and LZD are of clinical importance, limited baseline phenotypic and genotypic resistance data are available. MIC distributions and resistance-associated mutations should be characterized in treatment-naïve populations to inform diagnostic thresholds, guide individualized treatment and distinguish transmitted from acquired resistance.
This study aimed to characterize phenotypic and genotypic resistance in treatment-naïve MTBC isolates by determining MICs of BDQ, DLM, and LZD and identifying associated genetic mutations. The findings provide guidance for the development and optimization of resistance detection for these key drugs.
Results
2.1. Phenotypic Drug Susceptibility Testing (DST) and Genotypic Analyses Were Performed for BDQ, DLM and LZD
2.1.1. Bedaquiline MIC Distribution
BDQ MICs ranged from 0.0125 to 0.8 µg/mL among fully drug-susceptible strains and 0.2 and 6.4 µg/mL among MDR-TB isolates. The H37Rv showed an MIC of 0.4 µg/mL (Figure 1). Using the WHO critical concentration (CC) of 1 µg/mL for MGIT [16], 66/71 (93.0%) isolates were classified as susceptible and 5/71 (7.0%) as resistant. All BDQ-resistant isolates were MDR-TB 5/41 (12.2%, 95% CI: 4.1–26.2%) (Table 1); 80% of the isolates were INH+RIF+PZA resistant, and the remaining 20% were INH+RIF+PZA+EMB resistant.
For BDQ, according to the EUCAST (European Committee for Antimicrobial Susceptibility Testing) clinical breakpoint (CB) of 0.25 µg/mL [16], 22/71 (31.0%) isolates were phenotypic wild-type (pWT) with MIC < 0.25 μg/ml, while 49/71 (69.0%) were non-wild-type with MIC ≥ 0.25 μg/ml. Among the non-wild-type isolates, 77.6% (38/49) were MDR-TB and 22.4% (11/49) were fully drug susceptible. BDQ MIC was significantly higher (p < 0.001) in MDR-TB isolates (0.50 µg/mL [IQR, 0.40–0.80]) compared to drug-susceptible isolates (0.20 µg/mL [IQR, 0.20–0.40]) with a higher MIC90 (2.0 vs 0.4 µg/mL) (Table 1).
2.1.2. Delamanid MIC Distribution
Delamanid MIC Distribution for Delamanid, MICs for fully drug-susceptible strains ranged from 0.005 to 0.06 µg/mL, whereas for MDR-TB isolates, MIC values ranged from 0.02 to 0.32 µg/mL (Figure 1). The H37Rv reference strain exhibited a MIC of 0.01 µg/mL. Using the WHO critical concentration (CC) of 0.06 µg/mL [16], 68/71 (95.8%) isolates were classified as susceptible, whereas 3/71 (4.2%) were classified as resistant. Of the 3 resistant isolates, 2/3 (66.7%) were MDR-TB, with 2/41 (4.9%, 95% CI: 0.6–16.5%) resistant (Table 1).; among these, 50% were INH+RIF+PZA, and 50% were INH+RIF+PZA+STR resistant. One-third (33.3%) of the DLM-resistant isolates were fully drug-susceptible strains (3.3%, 95% CI: 0.1–17.2%). The median MIC for delamanid was 0.01 µg/mL (IQR, 0.005–0.01) for drug-susceptible and 0.02 µg/mL (IQR, 0.02–0.05) for MDR-TB isolates. The MIC₉₀ was also higher in MDR-TB (0.05 µg/mL) than drug-susceptible (0.04 µg/mL) isolates, but the difference was statistically significant (p = 0.012) (Table 1).
2.1.3. Linezolid MIC Distribution
The MICs for LZD were 0.125 to 0.5 µg/mL for fully drug-susceptible strains and 0.125 to 2 µg/mL for MDR-TB strains (Figure 1). The MIC of the H37Rv strain was 0.5 µg/mL. Using the WHO critical concentration (CC) of 1 µg/mL [16], 66 of 71 (93.0%) strains were susceptible and 5 of 71 (7.0%) strains were resistant. All resistant isolates were resistant to INH and RIF (12.2%, 95% CI: 4.1–26.2) (Table 1), and 80% were also resistant to PZA. For drug-susceptible isolates, the median MIC for linezolid was 0.4 µg/mL (IQR, 0.25–0.50), and for MDR-TB isolates, it was 0.50 µg/mL (IQR, 0.25–0.50). The MIC 90 values were unchanged at 0.5 µg/mL in both groups. The difference was not significant statistically (p = 0.089) (Table 1).
Figure 1.
Heatmap of MGIT-based MIC distributions among fully drug-susceptible and multidrug-resistant tuberculosis (MDR-TB) Mycobacterium tuberculosis complex isolates. (A) MIC distributions among fully drug-susceptible MTBC isolates (n = 30); (B) MIC distributions among MDR-TB MTBC isolates (n = 41); and (C) drug concentration dilution series used for MIC determination for bedaquiline, delamanid, and linezolid. Drug concentrations are expressed in µg/mL.
Figure 1.
Heatmap of MGIT-based MIC distributions among fully drug-susceptible and multidrug-resistant tuberculosis (MDR-TB) Mycobacterium tuberculosis complex isolates. (A) MIC distributions among fully drug-susceptible MTBC isolates (n = 30); (B) MIC distributions among MDR-TB MTBC isolates (n = 41); and (C) drug concentration dilution series used for MIC determination for bedaquiline, delamanid, and linezolid. Drug concentrations are expressed in µg/mL.
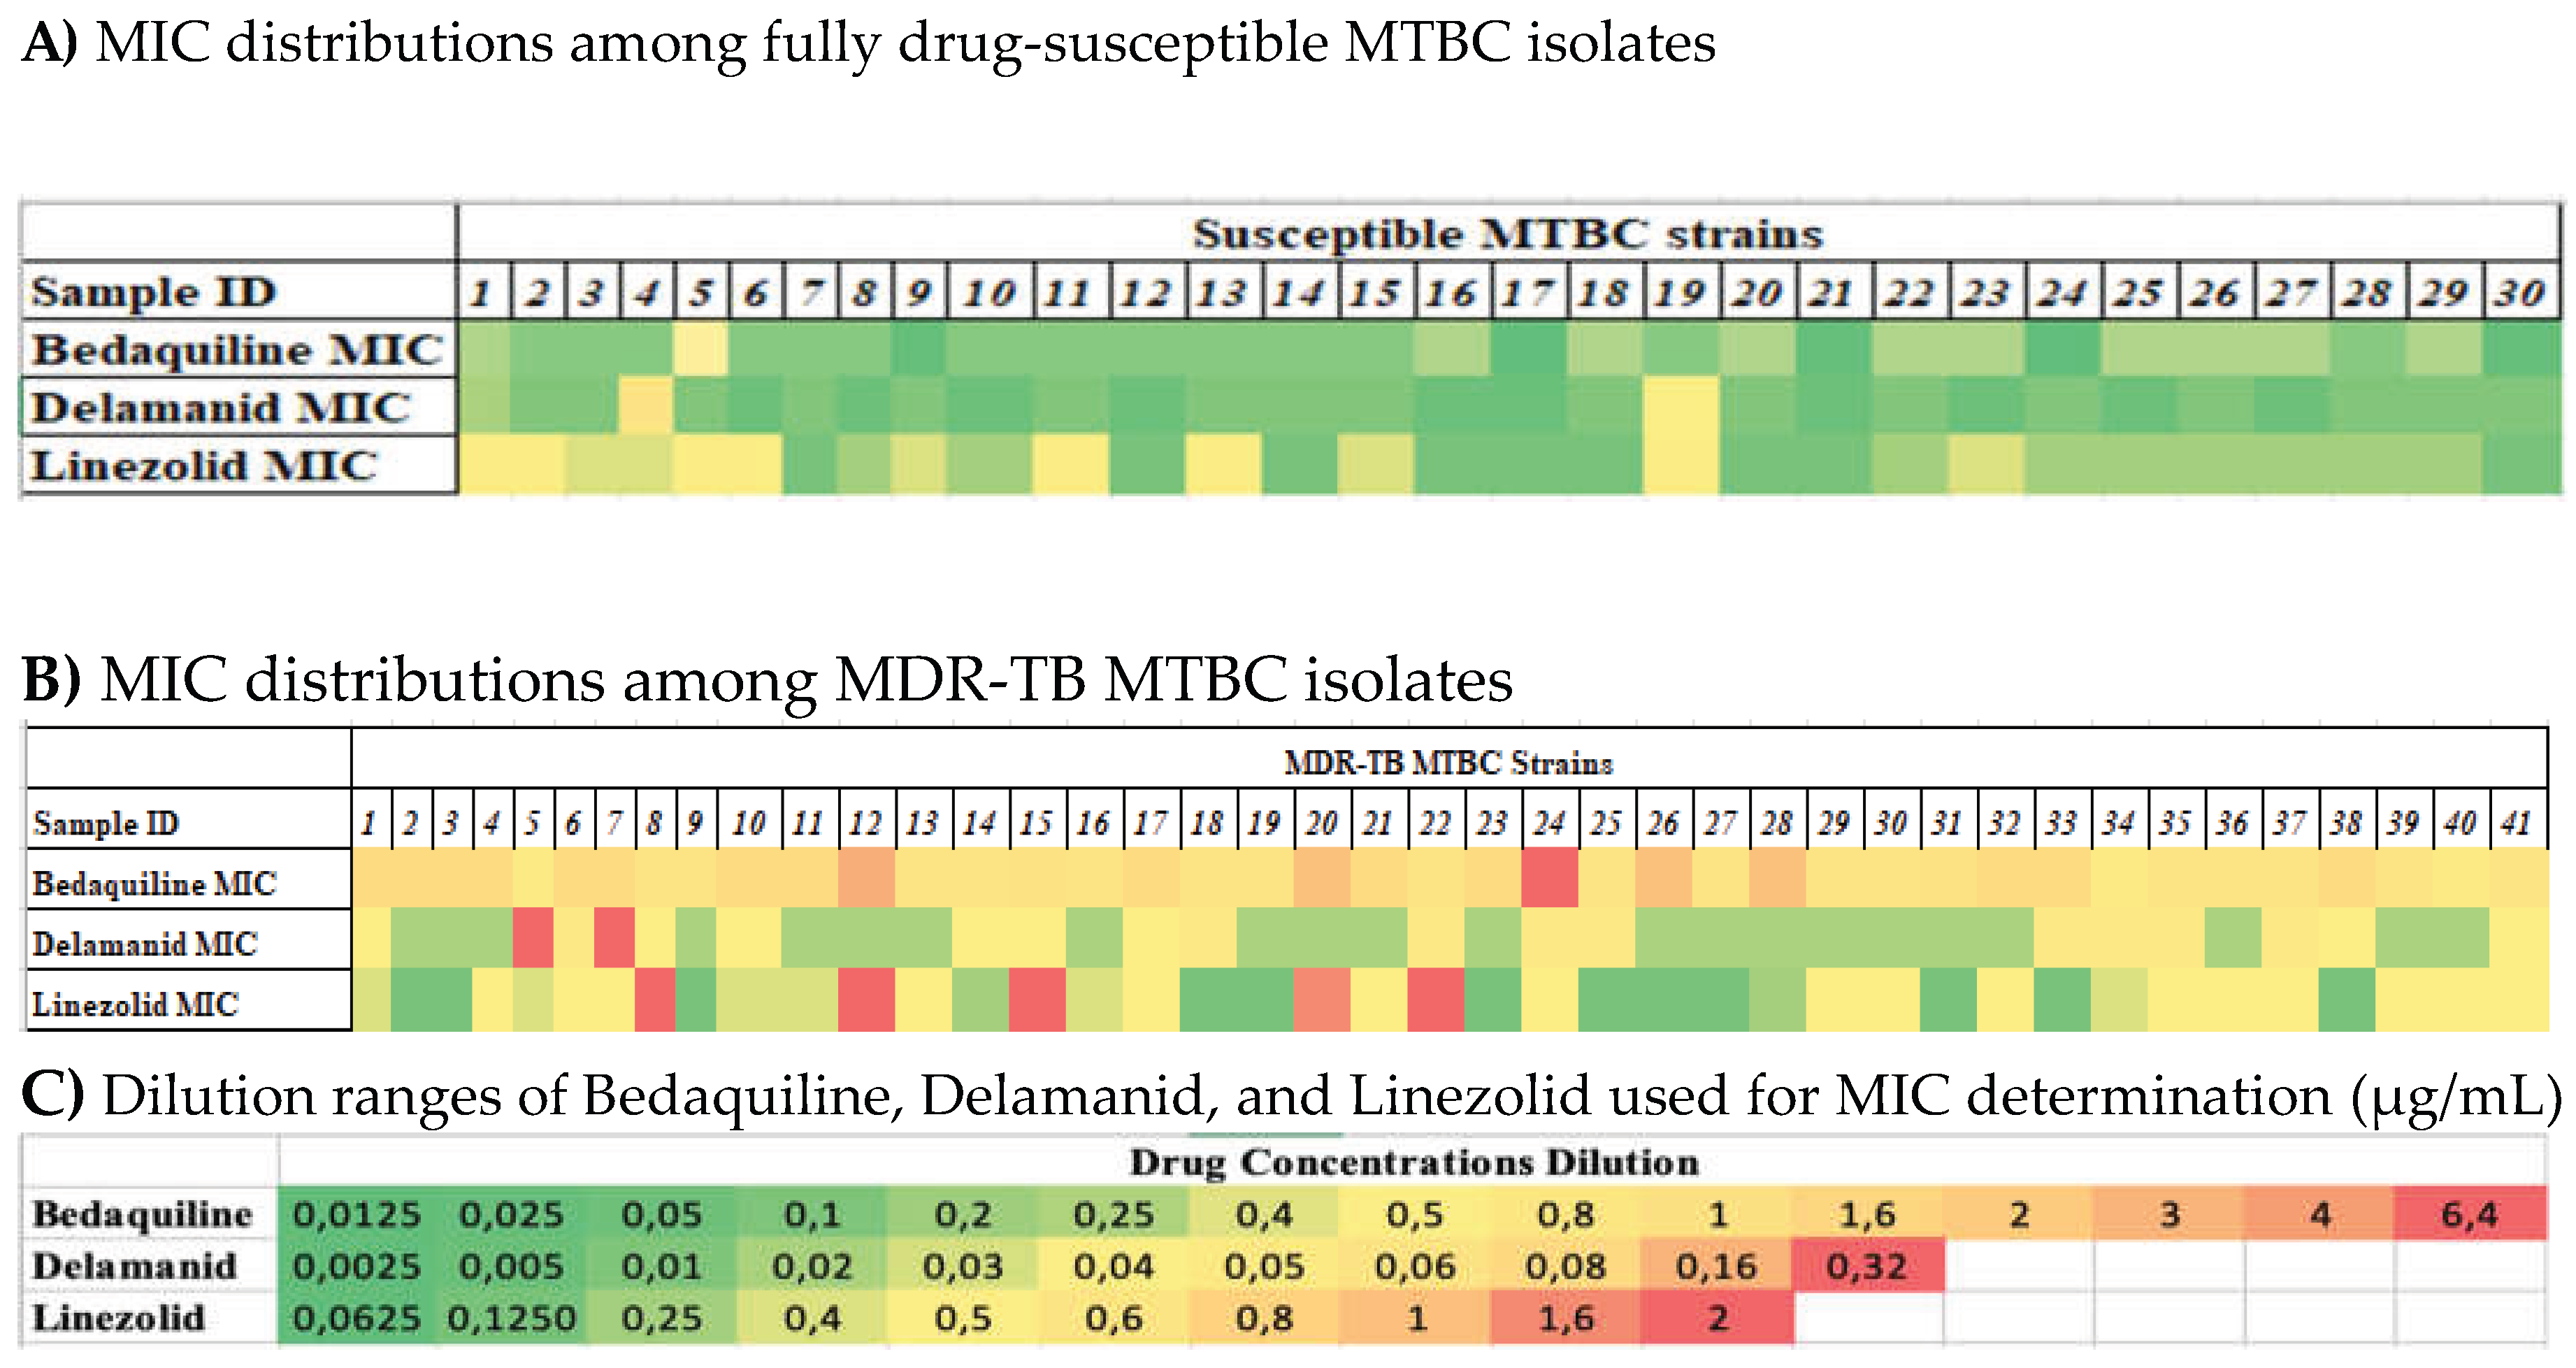

Table 1.
Comparative MIC distributions, resistance rates, and statistical analysis of bedaquiline, delamanid, and linezolid among Fully drug -susceptible and MDR-TB isolates.
Table 1.
Comparative MIC distributions, resistance rates, and statistical analysis of bedaquiline, delamanid, and linezolid among Fully drug -susceptible and MDR-TB isolates.
| Antibiotic | MTBC isolates (n=71) | MIC₅₀ (µg/mL) | IQR (µg/mL) | MIC₉₀ (µg/mL) | Resistant n (%) [95% CI] | p-value (MIC) |
|---|---|---|---|---|---|---|
| Bedaquiline | Fully drug -susceptible (n=30) | 0.2 | 0.2–0.4 | 0.4 | 0/30 (0%) [0–11.5] | <0.001 |
| MDR-TB (n=41) | 0.5 | 0.4–0.8 | 2 | 5/41 (12.2%) [4.1–26.2] | ||
| Delamanid | Fully drug -susceptible (n=30) | 0.01 | 0.005–0.01 | 0.04 | 1/30 (3.3%) [0.1–17.2] | 0.012 |
| MDR-TB (n=41) | 0.02 | 0.02–0.05 | 0.05 | 2/41 (4.9%) [0.6–16.5] | ||
| Linezolid | Fully drug -susceptible (n=30) | 0.4 | 0.25–0.5 | 0.5 | 0/30 (0%) [0–11.5] | 0.089 |
| MDR-TB (n=41) | 0.5 | 0.25–0.5 | 0.5 | 5/41 (12.2%) [4.1–26.2] |
IQR, interquartile range; CI, confidence interval. MIC values are expressed as median (MIC₅₀), IQR, and MIC₉₀. MIC₅₀ represents the median MIC; MIC₉₀ represents the concentration inhibiting 90% of isolates Resistance was defined according to WHO critical concentrations (bedaquiline: 1 µg/mL; delamanid: 0.06 µg/mL; linezolid: 1 µg/mL). P values for MIC distributions were calculated using the Mann–Whitney U test.
2.2. Genotypic Analysis of Drug Resistance-Associated Mutations
The atpE gene mutations were identified in nine of 71 (12.7%) isolates. All the mutant strains were multidrug-resistant TB, and no mutations have been identified in fully drug-susceptible isolates. All mutant isolates were from BDQ-naive patients and had MIC values >0.25 µg/mL (MIC range 0.5–6.4 µg/mL). Of these, 55.6% were phenotypically resistant and 44.4% susceptible. Sequence analysis of the 244-bp atpE gene revealed eight SNVs, but no insertions or deletions. The most frequent mutation identified was G73A (G25S) in five isolates, followed by C60G (G20G) and G61C (A21P). Additional variations were found in separate isolates G70C(A24P), C72G(A24P), A64C(I22L), C66G(I22M), and C228G(F76L). Four isolates presented complex mutation patterns with the following combined substitutions: G73A/C60G/G61C, G70C/C72G, C66G/G73A, and G61C/G73A. No mutations were detected in the Rv0678 gene (Table 2).
Regarding DLM genetic resistance, one fully drug-susceptible isolate harbored a single G242A (Gly81Asp) mutation in the ddn gene but remained phenotypically susceptible (MIC 0.04 µg/mL). No mutation was detected in the fbiA gene, rplC gene, and rrl gene in the 71 isolates for DLM and LZD, respectively (Table 2).
Discussion
This study presents detailed phenotypic and genotypic profiles of bedaquiline, delamanid, and linezolid susceptibility among MDR-TB and fully drug-susceptible isolates from southern Türkiye. Importantly, this is the first regional study to concurrently map MIC distributions and identify mutations linked with resistance for all three drugs among treatment-naive patients.
All batches of tests for bedaquiline showed satisfactory quality control of the MIC (0.4 µg/mL) for the reference strain M. tuberculosis H37Rv. Using the WHO critical concentration (CC) of 1 µg/mL [16], 5/71 (7.0%) of the isolates were bedaquiline-resistant; all of them were MDR-TB patients. The resistance rate is consistent with that of Wang et al. (7.16%) and Gu et al. (7.69%) [17,18], but exceeds Khosravi et al. (0%) [11], showing geographical variation. The MICs for MDR-TB isolates were significantly higher than for drug-susceptible strains (median: 0.50 vs. 0.20 µg/mL; MIC90: 2.0 vs. 0.4 µg/mL; p < 0.001). Showing reduced susceptibility in strains of MDR-TB [19].
Bedaquiline showed the largest difference in MIC between fully drug-susceptible and MDR-TB isolates. Based on the EUCAST ECOFF (0.25 µg/mL), 69% of isolates were non-wild-type despite low WHO-defined resistance [16], indicating a widespread low-level decrease in susceptibility. Non-wild-type isolates were mostly MDR-TB (77.6%) compared to fully drug-susceptible strains (22.4%), indicating early adaptive changes, intrinsic variability, or unrecognized cross-resistance. This suggests a large reservoir of clinically susceptible isolates with reduced susceptibility that can develop high-level resistance under treatment pressure.
Studies by Yang et al. in Korea and Villelas et al. in Belgium have shown that a high proportion of MDR-TB patients who have not been exposed to CFZ or BDQ have mutations in the Rv0678 gene [14,20]. In contrast, we did not find any Rv0678 mutations in any of the isolates; our results are consistent with those of studies by Gajavand et al., Khosravi et al., and Singh et al. from Iran and India, where Rv0678 mutation rates are similarly low or non-existent [5,11,21]. The absence of the necessary Rv0678 mutation in any of the bedaquiline-resistant isolates suggests the possibility of alternative resistance mechanisms, and such geographic heterogeneity serves as a reminder that regional surveillance is indispensable, as global resistance assumptions may not accurately reflect local realities.
Identification of atpE mutations in 12.7% of the MDR-TB isolates with no known exposure to bedaquiline suggests that these variants can arise in the absence of direct drug pressure, either through spontaneous genetic variation or indirect selection by other antimicrobials. Since atpE mutations are responsible for high level bedaquiline resistance, identification of these mutations in drug naïve patients is more likely to indicate transmission of resistant strains rather than de novo emergence, raising concerns about silent transmission of resistant variants. However, incomplete treatment histories or unrecognized bedaquiline exposure cannot be excluded. Our results underscore the need to correlate molecular surveillance with detailed clinical history and the need for routine bedaquiline susceptibility testing of all MTBC isolates.
atpE mutations were identified in 55.6% (5/9) of MDR-TB isolates resistant to BDQ and PZA, suggesting that exposure to anti-TB drugs other than CFZ may have driven the emergence of these mutations; naturally, this requires more experimental testing.
Eight atpE variants reveal a diverse and likely multifactorial resistance pattern that differs from well-characterized mechanisms. The most frequent mutation G73A (G25S), appeared in five isolates and was associated with variable MICs (0.5–2 µg/mL), which is consistent with previous evidence linking atpE mutations to bedaquiline resistance [22], suggesting a low-penetrance effect that may require additional genetic or physiological factors for full resistance expression, unlike the consistently high-level resistance reported for canonical mutations such as A63P [23]. The C228G (F76L) alteration had the largest effect (MIC 6.4 µg/mL), while C66G (I22M) was related to a mild MIC rise (2 µg/mL). In contrast, A64C (I22L) remained mostly susceptible, while proline-associated alterations (G61C/A21P and G70C/C72G/A24P) resulted in minor MIC shifts, but structural disruption was possible. Interestingly, these mutations are different from the known atpE resistance substitutions A63P, D28N, and A63V [23], which may suggest potentially novel mechanisms. Overall, these results highlight the complexity of the atpE-mediated response to bedaquiline and the importance of functional validation before clinical or diagnostic use.
Non-synonymous atpE mutations clustered near the anticipated transmembrane helix implicated in bedaquiline binding. Variants at codons 20-24 (I22M, I22L, A24P) had variable effects on MIC, suggesting a gradient of structural influence rather than homogeneous resistance. Synonymous mutations did not alter phenotype. The most resistant mutation, F76L at the distal site (MIC 6.4 µg/mL), is not implicated in the binding region, emphasizing the importance of long-range conformational mutations that can be a contributor to bedaquiline susceptibility beyond the direct binding site changes.
Notably, 44.4% (4/9) of atpE mutant isolates were still phenotypically susceptible with MIC values below the resistance breakpoint level, despite the presence of resistance-associated variations. The high genotype-phenotype discordance highlights that atpE mutations alone are not sufficient for bedaquiline resistance and support the role of additional genetic or compensatory mechanisms that affect drug susceptibility [6]. Other loci linked to bedaquiline resistance, such as pepQ and the Rv0678–Rv0677c intergenic region, were not assessed and could potentially explain the observed discordance.
DLM showed high in vitro efficacy with 95.8% of isolates classified as susceptible, these results are consistent with reports from China (4.5% and 2.9%) [15,24]. In contrast, the much higher resistance rate in Iran (27.5%) [11], indicating the large geographic variation in DLM susceptibility and the need for regional surveillance. With a cutoff value of 0.06 µg/mL, most of the susceptible isolates had MICs of 0.005-0.06 µg/mL Compared with previous reports [13,14], while resistant isolates usually had MICs of 0.32 µg/mL, which were lower than those reported previously [11,25], underlining the importance of individual drug susceptibility testing to guide DLM treatment decisions for MDR-TB patients to allow early detection of resistance and prevent transmission of resistant strains.
Delamanid showed a modest but significant rise in MIC in MDR-TB isolates (median: 0.01 vs 0.02 µg/mL; p = 0.012) indicating a slight reduction in susceptibility [13].
Consistent with Yang et al. [14], a ddn Gly81Asp mutation was detected in a phenotypically susceptible isolate; however, in their study, this mutation conferred a high level of resistance. This illustrates the complexity of resistance mechanisms to delamanid and suggests that not all ddn mutations are functionally relevant. Since we employed isolates that were likely never exposed to delamanid, we conclude that this is not a product of acquired resistance. No fbiA mutations were detected, which supporting the rare basic resistance, although Mook et al. [25], reported fbiA mutations in resistant isolates. Our analysis was limited to a subset of known resistance genes (ddn, fbiA), and we cannot exclude the possibility of mechanisms involving other loci, including F420 pathway genes (fgd1, fbiB, fbiC) or regulatory pathways [10].
Linezolid MICs were slightly higher for the MDR-TB isolates (median 0.4 µg/mL vs. 0.50 µg/mL; and MIC90 were 0.5 µg/mL for both groups; p = 0.089) without decreased susceptibility. This finding supports the continued use of linezolid as a treatment option for drug-resistant tuberculosis. 7.0% of MDR-TB isolates showed linezolid resistance without mutations in the classical resistance genes rplC and rrl, suggesting alternative resistance pathways. This prevalence is comparable to reports by Khosravi et al. and Hajizadeh et al. Linezolid resistance was found in 6.8% and 6.6% of isolates of Mycobacterium tuberculosis, respectively [11,26]. In contrast, a study from Ireland found linezolid susceptibility in all 195 phenotypic isolates [25]. All resistant isolates were MDR-TB, supporting previous data that drug-resistant populations have higher rates of linezolid resistance [27]. Since the molecular investigation only included canonical genes, other resistance mechanisms are possible. The phenotypic/genotypic discordance implicates non-ribosomal mechanisms such as regulatory efflux pumps or mutations in linezolid resistance and limits molecular testing to rplC and rrl. Our findings support routine linezolid susceptibility testing in MDR-TB and emphasize the need for more extensive genomic investigation in future studies.
Materials and Methods
4.1. Selection, Culture, Identification, and Drug Susceptibility Testing of MTBC Clinical Isolates
This study included a total of 71 MTBC isolates isolated from clinical samples of TB suspects sent to Cukurova University Tropical Disease Research and Application Center, Ministry of Health, Public Health Institution; and Adana Regional Tuberculosis Laboratory (THAUM), Türkiye, between January 2021 and January 2023; duplicate specimens were excluded. Only one isolate per patient was analyzed. Clinical specimens were processed according to the routine THAUM laboratory. Mycobacterial cultures were performed using the BACTEC MGIT 960 system (Becton Dickinson, Sparks, MD, USA). When an MGIT tube was flagged positive, a smear was prepared and examined by Ziehl–Neelsen staining to confirm the presence of acid-fast bacilli (AFB). Positive cultures were subsequently subjected to Mycobacterial identification. Where required, positive MGIT cultures were subcultured onto Löwenstein–Jensen (LJ) medium and incubated at 37 ± 1 °C for further confirmation and characterization.
All isolates included in the study were confirmed as MTBC by MPT64 antigen testing, with molecular analysis providing additional confirmation through detection of Mycobacterium- and MTBC-associated targets. A positive MPT64 antigen-based immunochromatographic card test was used for initial confirmation of MTBC. In parallel, genomic DNA was extracted from all 71 isolates using the Mickle mechanical disruption method. Molecular identification was performed using two PCR assays. Each PCR was conducted in a final reaction volume of 25 μL containing 12.5 μL of master mix, 0.25 μL each of forward and reverse primers, 6 μL of nuclease-free water, 1 μL of dimethyl sulfoxide (DMSO), and 5 μL of genomic DNA. Amplification was performed with an initial denaturation at 94°C for 5 min, followed by 30 cycles of denaturation at 94°C for 1 min, annealing at 63°C for 1 min, and extension at 72°C for 1 min, with a final extension at 72°C for 7 min. PCR products were resolved by agarose gel electrophoresis and visualized for the presence of the expected amplicons.
The first PCR targeted a specific region of the hsp65 gene using primers TB11 and TB12 for confirmation of Mycobacterium spp. A 441-bp amplicon was considered indicative of a Mycobacterium-positive isolate. Isolates positive for Mycobacterium spp. were subsequently tested by PCR targeting the IS6110 region using primers INS1 and INS2 for molecular confirmation of the Mycobacterium tuberculosis complex (MTBC). The presence of the expected 245-bp amplicon was considered positive for MTBC. Primer sequences, target regions, and expected amplicon sizes are provided in Supplementary File S1. Isolates lacking the IS6110 amplicon were not classified as MTBC. All isolates included in the present study were confirmed as MTBC by concordant MPT64 antigen detection and molecular identification based on Mycobacterium- and MTBC-associated targets. Species-level differentiation within the MTBC was not performed. Phenotypic drug susceptibility testing (DST) was carried out for streptomycin (STR), isoniazid (INH), rifampicin (RIF), ethambutol (EMB), and pyrazinamide (PZA) using the BACTEC MGIT960. Of the isolates, 30 were fully drug-susceptible MTBC isolates, and 41 were MDR-TB. M. tuberculosis H37Rv was utilized as a control in all phenotypic and genotypic analyses.
4.2. Drug Susceptibility Testing (DST)
As pure powders were unavailable, commercial tablet formulations of bedaquiline (SIRTURO®, 100 mg; Janssen, Belgium), delamanid (Deltyba®, 50 mg; Otsuka, Japan), and linezolid (600 mg; Koçak, Türkiye) were used. According to the manufacturers’ product information, each tablet contained the active ingredient and the corresponding excipients and was finely powdered and dissolved in the appropriate solvent. Commercial tablet formulations may affect the results due to the presence of excipients; however, a standardized preparation minimizes this variability, and reliable susceptibility results were reported.
4.3. Testing for Phenotypic Drug Susceptibility and MIC
Quantitative DST was performed using the semi-automated MGIT 960 system with EpiCenter software and the TB eXiST module according to the WHO Critical Drug Concentrations Guidelines [12,13]. Because analytical-grade drug powders were not available, bedaquiline (BDQ), delamanid (DLM), and linezolid (LZD) were prepared from commercially available pharmaceutical formulations. The tablets were finely powdered before preparation of the stock solutions. Stock solutions were prepared based on the labeled active ingredient content and subsequently diluted to obtain the working solutions required for susceptibility testing. All prepared solutions were aliquoted and stored at −70°C until use.
Drug concentrations were calculated from the labeled active ingredient content and prepared using a standardized approximately 84-fold dilution factor to achieve the desired final concentrations in the MGIT tubes. For BDQ, 100 mg of labeled active BDQ (equivalent to 100 mg BDQ base according to the manufacturer's product information) was dissolved in 25 mL of sterile DMSO to obtain a stock solution at 4,000 µg/mL. This solution was subsequently diluted with DMSO to 800 µg/mL and then to a working concentration of 84 µg/mL [12]. BDQ was tested over a final concentration range of 0.0125–6.4 µg/mL.
For DLM, 50 mg of labeled active DLM (equivalent to 50 mg of DLM base according to the manufacturer's product information) was dissolved in 12.5 mL of sterile DMSO to obtain a 1,000 µg/mL stock solution. The stock solution was diluted 1:10 with sterile distilled water to obtain a 100 µg/mL intermediate solution, which was subsequently diluted to a working concentration of 5 µg/mL [12]. DLM was tested at final concentrations ranging from 0.0025 to 0.32 µg/mL.
For LZD, 600 mg of LZD fumarate salt (equivalent to 600 mg of LZD base according to the manufacturer's product information) was dissolved in 600 mL of sterile DMSO to obtain a 1,000 µg/mL solution (Solution A). Subsequently, 4 mL of Solution A was diluted to a final volume of 5 mL with SDW, yielding an 800 µg/mL solution (Solution B). Then, 1.05 mL of Solution B was added to 8.95 mL of SDW to obtain the 84 µg/mL working solution [12]. LZD was tested at final concentrations ranging from 0.0625 to 2 µg/mL.
For DST, 0.8 mL of oleic acid–albumin–dextrose–catalase (OADC) supplement, 0.1 mL of the appropriate drug solution, and 0.5 mL of bacterial suspension were added to 7.0 mL of MGIT medium, resulting in a total volume of approximately 8.4 mL. Under these conditions, the final DMSO concentration was approximately 2.4% (v/v), and the drug solutions were diluted approximately 84-fold in the MGIT tubes. Drug-free growth-control tubes were prepared by diluting the bacterial suspension 1:100 in sterile saline and inoculating 0.5 mL of the diluted suspension into MGIT tubes.
MGIT tubes were incubated at 37°C and monitored using the MGIT 960 system. Testing was considered valid when the growth-control tube reached a growth unit (GU) value of 400 within 28 days. For drug-containing tubes, a GU value ≥100 was interpreted as resistant, whereas a GU value <100 was interpreted as susceptible [13]. Phenotypic susceptibility was determined according to the WHO critical concentrations [12], and the distribution of MICs was analyzed with EUCAST the epidemiological cutoff (ECOFF) value is the MIC that identifies the top limit for the wild-type population [13].
4.4. Genotypic Drug Susceptibility Testing and DNA Sequencing
Genotypic data were obtained from genomic DNA extracted from 71 MTBC isolates using the Mickle mechanical disruption method. DNA was quantified and stored at −20°C
Until analysis.PCR was used to amplify resistance-associated genes: atpE (Rv1305) and Rv0678 for BDQ; ddn (Rv3547) and fbiA (Rv3261) for DLM; and rrl (23S rRNA) and rplC for LZD, following WHO molecular resistance guidelines [14,15]. PCR amplification was performed under standard conditions: initial denaturation at 95°C for 5 min; 35 cycles of denaturation at 95°C for 30–60 s, locus-specific annealing (53.8–59°C, 30–60 s), and extension at 72°C for 30–60 s; followed by a final extension at 72°C for 10 min (Table 3). PCR products were verified by agarose gel electrophoresis. Amplicons were either sequenced immediately or stored at −20 °C until analysis. Sanger sequencing was performed using the BigDye Terminator v3.1 Cycle Sequencing Kit and an ABI Prism 310 Genetic Analyzer. Sequence data were analyzed using the Basic Local Alignment Search Tool (BLAST) (http://www.ncbi.nlm.nih.gov/BLAST) against the M. tuberculosis H37Rv reference genome (GenBank accession AL123456.3). SNV and other mutations identified from sequence alignments. Representative nucleotide sequences generated in this study have been provided as Supplementary File S1 for review purposes.
4.5. Statistical Analysis
MIC distributions were summarized as MIC₅₀, IQR, and MIC₉₀. Differences in MIC values between fully drug-susceptible and MDR-TB isolates were compared using the Mann–Whitney U test. Resistance proportions were expressed as percentages with 95% confidence intervals (CIs). A two-sided P < 0.05 was considered statistically significant.
Conclusion
This study provides crucial regional data on bedaquiline, delamanid, and linezolid resistance, supporting integrated phenotypic-genotypic surveillance for effective treatment.
Supplementary Materials
The following supporting information can be downloaded at the website of this paper posted on Preprints.org. Supplementary File S1: Nucleotide sequences generated in this study in FASTA format The sequences have been submitted to GenBank, and accession numbers will be added upon completion of processing.
Author Contributions
Dr. H.A. and Dr. H.G. contributed equally to this work. Dr. H.A. contributed to the conceptualization, methodology, data collection, and drafting of the manuscript. Dr. H.G. contributed to the methodology and data validation. Dr. G.Y. contributed to the experimental work, and manuscript preparation. Prof. Dr. F.K. contributed to the study design, methodology, supervision, and critical revision of the manuscript. H.S. and G.S.A. contributed to data validation and writing, review, and editing. F.M.A. and M.A.S. contributed to data curation and statistical analysis. All authors reviewed and critically revised the manuscript, approved the final version for publication, and agreed to be accountable for all aspects of the work.
Funding
This work was funded by Çukurova University Scientific Research Projects Coordination Unit (Project No. 13749).
Institutional Review Board Statement
The study was conducted in accordance with the Declaration of Helsinki and approved by the Ethics Committee of Çukurova University Faculty of Medicine (Protocol No. 109-05.03.2021).
Informed Consent Statement
Not applicable.
Data Availability Statement
The Representative nucleotide sequences generated in this study are provided as Supplementary File S1 for review purposes. The sequences are being submitted to GenBank, and the corresponding accession numbers will be added to the manuscript once the submission has been successfully processed. The original contributions presented in this study are included in the article. Further inquiries can be directed to the corresponding authors.
Acknowledgments
The authors extend their appreciation to the Deanship of Research and Graduate Studies at King Khalid University, KSA, for funding this work through the Large Research Group under the grant number (RGP.2/174/47). And also, they appreciate Çukurova University Tropical Diseases Research and Biotechnology Research Centers for hosting the study and supporting molecular analyses, and their staff for technical assistance.
Conflicts of Interest
The authors declare no conflicts of interest. The funders had no role in study design; data collection, analysis, and interpretation; the writing of the manuscript; or the decision to submit the manuscript.
References
- World Health Organization. Report of the WHO consultation on asymptomatic tuberculosis, Geneva, Switzerland, 14–15 October 2024. Geneva: World Health Organization; 2025. ISBN: 978-92-4-010693-2.Accessed 5 Jun 2026.
- Vishwakarma D, Gaidhane A, Sahu S, Rathod AS. Multi-drug resistance tuberculosis (MDR-TB) challenges in India: A review. Cureus. 2023;15(12):e50222. [CrossRef]
- Hatami H, Sotgiu G, Bostanghadiri N, Abadi SSD, Mesgarpour B, Goudarzi H, et al. Bedaquiline-containing regimens and multidrug-resistant tuberculosis: a systematic review and meta-analysis. J Bras Pneumol. 2022;48(2):e20210384. [CrossRef]
- Espinosa-Pereiro J, Sánchez-Montalvá A, Aznar ML, Espiau M. MDR tuberculosis treatment. Medicina (Kaunas). 2022;58(2):188. [CrossRef]
- Ghajavand H, Kargarpour Kamakoli M, Khanipour S, Pourazar Dizaji S, Masoumi M, Rahimi Jamnani F, et al. High prevalence of bedaquiline resistance in treatment-naive tuberculosis patients and verapamil effectiveness. Antimicrob Agents Chemother. 2019;63(3): e02530-18. [CrossRef]
- Zimenkov DV, Nosova EY, Kulagina EV, Antonova OV, Arslanbaeva LR, Isakova AI, et al. Examination of bedaquiline- and linezolid-resistant Mycobacterium tuberculosis isolates from the Moscow region. J Antimicrob Chemother. 2017;72(7):1901–6. [CrossRef]
- Almeida D, Ioerger T, Tyagi S, Li SY, Mdluli K, Andries K, et al. Mutations in pepQ confer low-level resistance to bedaquiline and clofazimine in Mycobacterium tuberculosis. Antimicrob Agents Chemother. 2016;60(8):4590–9. [CrossRef]
- Nasiri MJ, Zangiabadian M, Arabpour E, Amini S, Khalili F, Centis R, et al. Delamanid-containing regimens and multidrug-resistant tuberculosis: A systematic review and meta-analysis. Int J Infect Dis. 2022;124:S90–103. [CrossRef]
- Chandramohan Y, Padmanaban V, Bethunaickan R, Tripathy S, Swaminathan S, Ranganathan UD. In vitro interaction profiles of the new antitubercular drugs bedaquiline and delamanid with moxifloxacin against clinical Mycobacterium tuberculosis isolates. J Glob Antimicrob Resist. 2019;19:348–53. [CrossRef]
- Yu X, Gao X, Li C, Luo J, Wen S, Zhang T, et al. In vitro activities of bedaquiline and delamanid against nontuberculous mycobacteria isolated in Beijing, China. Antimicrob Agents Chemother. 2019;63(8):e00031-19. [CrossRef]
- Ahmad Khosravi N, Khosravi AD, Hashemzadeh M, Savari M, Saki M. Investigation of delamanid, bedaquiline, and linezolid resistance rates and related gene mutations in multidrug-resistant Mycobacterium tuberculosis in regional tuberculosis reference laboratories of Iran. BMC Microbiol. 2025;25(1):509. [CrossRef]
- World Health Organization. Technical manual for drug susceptibility testing of medicines used in the treatment of tuberculosis. Geneva: World Health Organization; 2018. WHO/CDS/TB/2018.24. ISBN: 978-92-4-151484-2. Accessed 5 Jun 2026.
- Keller PM, Hömke R, Ritter C, Valsesia G, Bloemberg GV, Böttger EC. Determination of MIC distribution and epidemiological cutoff values for bedaquiline and delamanid in Mycobacterium tuberculosis using the MGIT 960 system equipped with TB eXiST. Antimicrob Agents Chemother. 2015;59(7):4352. [CrossRef]
- Yang JS, Kim KJ, Choi H, Lee SH. Delamanid, bedaquiline, and linezolid minimum inhibitory concentration distributions and resistance-related gene mutations in multidrug-resistant and extensively drug-resistant tuberculosis in Korea. Ann Lab Med. 2018;38(6):563–8. [CrossRef]
- Zheng H, He W, Jiao W, Xia H, Sun L, Wang S, et al. Molecular characterization of multidrug-resistant tuberculosis against levofloxacin, moxifloxacin, bedaquiline, linezolid, clofazimine, and delamanid in southwest China. BMC Infect Dis. 2021;21(1):330. [CrossRef]
- World Health Organization. Technical report on critical concentrations for drug susceptibility testing of medicines used in the treatment of drug-resistant tuberculosis. Geneva: World Health Organization; 2018. WHO/CDS/TB/2018.5. Accessed 5 Jun 2026.
- Wang G, Jiang G, Jing W, Zong Z, Yu X, Chen S, et al. Prevalence and molecular characterizations of seven additional drug resistance among multidrug-resistant tuberculosis in China: A subsequent study of a national survey. J Infect. 2021;82(3):371–7. [CrossRef]
- Guo Y, Yang J, Wang W, Wu X, Wan B, Wang H, et al. Bedaquiline, delamanid, linezolid, clofazimine, and capreomycin MIC distributions for drug-resistant Mycobacterium tuberculosis in Shanghai, China. Infect Drug Resist. 2023;16:7587–95. [CrossRef]
- Kaniga K, Hasan R, Jou R, Vasiliauskienė E, Chuchottaworn C, Ismail N, et al. Bedaquiline drug resistance emergence assessment in multidrug-resistant tuberculosis (MDR-TB): a 5-year prospective in vitro surveillance study of bedaquiline and other second-line drug susceptibility testing in MDR-TB isolates. J Clin Microbiol. 2022;60(1):e02919-20. [CrossRef]
- Villellas C, Coeck N, Meehan CJ, Lounis N, de Jong B, Rigouts L, Andries K. Unexpected high prevalence of resistance-associated Rv0678 variants in MDR-TB patients without documented prior use of clofazimine or bedaquiline. J Antimicrob Chemother. 2017;72(3):684–90. [CrossRef]
- Singh BK, Soneja M, Sharma R, Chaubey J, Kodan P, Jorwal P, et al. Mutation in atpE and Rv0678 genes associated with bedaquiline resistance among drug-resistant tuberculosis patients: A pilot study from a high-burden setting in Northern India. Int J Mycobacteriol. 2020;9(2):212–7. doi: 10.4103/ijmy.ijmy_30_20.
- Ismail N, Rivière E, Limberis J, Huo S, Metcalfe JZ, Warren RM, Van Rie A. Genetic variants and their association with phenotypic resistance to bedaquiline in Mycobacterium tuberculosis: a systematic review and individual isolate data analysis. Lancet Microbe. 2021;2(11):e604–16. [CrossRef]
- . Kadura S, King N, Nakhoul M, Zhu H, Theron G, Köser CU, Farhat M. Systematic review of mutations associated with resistance to the new and repurposed Mycobacterium tuberculosis drugs bedaquiline, clofazimine, linezolid, delamanid and pretomanid. J Antimicrob Chemother. 2020;75(8):2031–43. [CrossRef]
- He, W., Liu, C., Liu, D., Ma, A., Song, Y., He, P., ... & Zhao, Y.: Prevalence of Mycobacterium tuberculosis resistant to bedaquiline and delamanid in China. Journal of global antimicrobial resistance, (2021);26, 241-248. [CrossRef]
- Mok S, Roycroft E, Flanagan PR, Wagener J, Fitzgibbon MM. Investigation of genomic mutations and their association with phenotypic resistance to new and repurposed drugs in Mycobacterium tuberculosis complex clinical isolates. J Antimicrob Chemother. 2023;78(11):2637–44. [CrossRef]
- Hajizadeh M, Hekmatpour N, Rahimlou B, Eskandari A, Zamani MS, Ferdosnejad K, et al. Prevalence and genetic insights of linezolid resistance in tuberculosis: A study of sensitive and resistant clinical isolates. Diagn Microbiol Infect Dis. 2025;111(3):116719.10.1016/j.diagmicrobio.2025.116719.
- Gavali D, Aring B, Mullan S, Nathanmetha AA, Dave AB. Evaluation of sensitivity and resistance of linezolid in pre-extensively drug-resistant tuberculosis and extensively drug-resistant tuberculosis at a tertiary care hospital, Jamnagar, Gujarat, India. J Clin Diagn Res. 2019;13(11). [CrossRef]
Table 2.
Molecular Characterization of Bedaquiline, Delamanid, and Linezolid Resistance-associated genetic variants and Their Corresponding MIC values in MTBC isolates (n = 71).
Table 2.
Molecular Characterization of Bedaquiline, Delamanid, and Linezolid Resistance-associated genetic variants and Their Corresponding MIC values in MTBC isolates (n = 71).
| Antibiotic | Gene | Nucleotide change | Codon No. | Codon Change | Amino Acid Change | Strains (n) | Sample ID | MIC (µg/mL) |
|---|---|---|---|---|---|---|---|---|
| Bedaquiline | atpE | G73A | 25 | GGT →AGT | Gly→Ser (G25S) | 5 | 4,15,20,26,28 | 0.5–2 |
| C60G | 20 | GGC → GGG | Gly → Gly (G20G) | 2 | 4,12 | 0.8–3 | ||
| G61C | 21 | GCC → CCC | Ala → Pro (A21P) | 2 | 4,28 | 0.8-2 | ||
| C228G | 76 | TTC → TTG | Phe → Leu (F76L) | 1 | 24 | 6.4 | ||
| C66G | 22 | ATC → ATG | Ile → Met(I22M) | 1 | 20 | 2 | ||
| G70C | 24 | GCC → CCG | Ala → Pro (A24P) | 1 | 11 | 0.8 | ||
| C72G | 24 | GCC → CCG | Ala → Pro (A24P) | 1 | 11 | 0.8 | ||
| A64C | 22 | ATC → CTC | Ile → Leu (I22L) | 1 | 31 | 0.5 | ||
| Rv0678 | - | - | - | - | - | - | - | |
| Delamanid | ddn* | G242A | 81 | GGC → GAC | Gly → Asp (G81D) | 1 | 19 | 0.04 |
| fbiA | - | - | - | - | ||||
| Linezolid | rplC | - | - | - | - | - | - | - |
| rrl | - | - | - | - | - | - | - |
*Except for ddn, all variants were detected among MDR-TB isolates.
Table 3.
PCR primers, annealing temperatures, and amplicon sizes for resistance-associated genes.
| Antibiotic | Primer | Sequence (5´to3´) | Annealing temperature (oC) | Amplicon size (bp) |
|---|---|---|---|---|
| Bedaquiline | atpE | F-GGACCCCACTATCGCTGCCGGCG | 58 | 244 |
| R-TTACTTGACGGGTGTAGCGAA | ||||
| Rv0678 | F-TGAAGTTCACGCCGGTCTGG | 58 | 724 | |
| R-CAGCGAACCGGAGAGGACGACTGA | ||||
| Delamanid | fbiA | F-GGCCAGTTTGCTGCCAATTC | 53.8 | 727 |
| R-TGGAATCCACCCCGATAACC | ||||
| ddn | F-CCGCTCAGCGACTTCTTTATC | 54 | 299 | |
| R-GCGGTAAGGTCCAGCACTT | ||||
| Linezolid | rrl | F-TACCAAGGCGTACGAGAT | 59 | 576 |
| R-GGGTTCGAGGTTAGATGCCC | ||||
| 2rrl | F-GGGCATCTAACCTCGAACCC | 59 | 503 | |
| R-GTGCACCAGAGGTTCGTCC | ||||
| rplC | F- AACAGAGTAGTACCGGTGACC | 59 | 589 | |
| R-TCTCACCTCGTTTGATCGCA |
Disclaimer/Publisher’s Note: The statements, opinions and data contained in all publications are solely those of the individual author(s) and contributor(s) and not of MDPI and/or the editor(s). MDPI and/or the editor(s) disclaim responsibility for any injury to people or property resulting from any ideas, methods, instructions or products referred to in the content. |
© 2026 by the authors. Licensee MDPI, Basel, Switzerland. This article is an open access article distributed under the terms and conditions of the Creative Commons Attribution (CC BY) license.
Copyright: This open access article is published under a Creative Commons CC BY 4.0 license, which permit the free download, distribution, and reuse, provided that the author and preprint are cited in any reuse.