
Submitted:
18 September 2026
Posted:
20 September 2026
You are already at the latest version
Abstract
Drebrin (DBN1) is an F-actin side-binding protein previously implicated in myoblast differentiation, but the signaling mechanisms linking DBN1-dependent actin organization to myogenic state transitions remain unclear. Here, we combined transcriptomic prioritization with C2C12 loss-of-function analyses to address this question. DBN1 depletion reduced filamentous actin and shifted actin-associated readouts toward a more monomeric state. This was accompanied by reduced nuclear MRTFA and SRF, lower CArG-dependent SMYD1 reporter activity, and decreased expression of SRF-responsive genes. DBN1 knockdown also altered YAP1 abundance and phosphorylation, reduced EdU incorporation and cell-cycle protein expression, and increased G0/G1 accumulation. During differentiation, DBN1 depletion attenuated MyoD, MyoG, and MyHC expression and impaired myotube formation. Public skeletal-muscle datasets further showed that DBN1 was preferentially associated with a myogenic rather than an atrophy-related transcriptional program, although its regulation varied across aging and muscle-wasting contexts. Together, these findings identify DBN1-dependent actin organization as a link to MRTFA–SRF transcription during myogenic progression and associate altered YAP1 signaling with impaired precursor proliferation after DBN1 depletion.
Keywords:
drebrin
; DBN1
; actin cytoskeleton
; MRTFA
; serum response factor
; YAP1
; myoblast proliferation
; myogenic differentiation
1. Introduction
Skeletal muscle supports locomotion, posture, and whole-body metabolic balance and constitutes a substantial share of body mass [1]. Its preservation depends on coordinated control of growth and atrophy programs [2,3]. Myogenesis is a stepwise process in which proliferating myoblasts leave the cell cycle, commit to the muscle lineage, and fuse into multinucleated myotubes [4,5]. Successive waves of MyoD, Myf5, myogenin, MRF4, MEF2, and serum response factor (SRF) drive these transitions [6]. Actin remodeling supplies both the structural basis for elongation and fusion and a source of regulatory signals [7,8]. Disruption of these processes contributes to inherited and acquired neuromuscular disease [9].
Actin network remodeling is not incidental to myogenesis but obligatory [10,11]. Actin exists in two interconverting states, a soluble globular monomer (G-actin) and an assembled filamentous polymer (F-actin), and the rate at which subunits pass between them sets how dynamic the cytoskeleton is at any moment [12]. This balance is set by a large repertoire of actin-binding proteins (ABPs) that nucleate, sever, cap, branch, or stabilize filaments, and the mechanical consequences of these activities have been reviewed in detail [13]. Several ABPs have been shown to control myogenesis, including twinfilin-1 [14] and cofilin-2 [15]. The spectrin–actin binding protein 4.1R likewise promotes C2C12 differentiation by stabilizing myogenin [16]. Individual ABPs therefore act on the same differentiation program through mechanistically distinct routes, and the specific contribution of any given filament regulator cannot be inferred from the class as a whole.
Actin dynamics are coupled to transcription through myocardin-related transcription factor A (MRTFA) [17]. Free G-actin binds MRTFA and limits its nuclear accumulation, whereas incorporation of G-actin into filaments releases MRTFA to coactivate SRF [18,19]. Mechanical stimulation can consequently alter MRTFA redistribution in myoblasts [20]. MRTFA–SRF activity is required for skeletal myogenic differentiation [21], and SRF supports satellite-cell fusion by maintaining actin architecture [22]. Related work links MRTF cofactors to cytoskeletal gene control [23] and establishes the broader importance of SRF in muscle [24]. Among its relevant outputs, SMYD1 is an SRF-responsive myogenic regulator required for normal differentiation [25,26]. A parallel actin-responsive input is provided by the Hippo effector YAP1 [27,28]. YAP-mediated mechanotransduction operates in skeletal muscle [29]. In C2C12 cells, YAP1 helps maintain the proliferative myoblast state [30], and related functions have been demonstrated in satellite cells [31,32]. These pathways provide distinct routes through which actin organization can influence proliferation and differentiation.
Drebrin (DBN1) belongs to a class of regulators that act on the filament itself rather than by nucleating new polymer. Drebrin decorates the lateral surface of F-actin, alters filament twist, and retards subunit exchange [33]. It also competes with cofilin and other filament-binding proteins for occupancy and protects filaments from ADF/cofilin-mediated severing and depolymerization [33,34]. This side-binding mode positions drebrin to influence the balance between stable filamentous actin and the soluble monomer pool. Importantly, a skeletal-muscle role is already established. Mancini et al. showed that drebrin is induced during differentiation downstream of p38 MAPK and MyoD and that drebrin depletion or pharmacological inhibition impairs myogenic differentiation and myotube formation in C2C12 cells and primary myoblasts [35]. Thus, whether drebrin participates in myogenesis is not the unresolved question; rather, the downstream actin-responsive signaling mechanisms that connect drebrin-dependent filament organization to transcriptional control remain insufficiently defined.
One candidate mechanism is the MRTFA–SRF pathway. G-actin directly binds MRTFA and limits its nuclear accumulation, so a shift from filamentous toward monomeric actin would be expected to restrain MRTFA–SRF transcription [17,18,19,20]. Actin organization also influences YAP1 signaling [27,28,29], providing a second, potentially parallel readout relevant to proliferating myoblasts. These pathways do not need to replace the previously described p38/MyoD framework. p38/MyoD can regulate DBN1 expression upstream [35], whereas drebrin-dependent actin organization could, in turn, influence MRTFA–SRF output and other downstream mechanosensitive pathways. Public muscle transcriptomes provide an independent way to place DBN1 within myogenic and atrophy-associated transcriptional states before testing these downstream relationships in cells.
In this study, we combined transcriptomic prioritization with mechanistic experiments in C2C12 myoblasts. We compared eight actin-remodeling candidates by their correlations with myogenesis/regeneration and atrophy/proteolysis programs, examined DBN1/Dbn1 regulation across aging and atrophy datasets, and then tested whether drebrin depletion alters the cellular actin pool, MRTFA–SRF signaling, YAP1 abundance and phosphorylation, proliferation, cell-cycle progression, and myotube formation. We used a second independent siRNA to reproduce selected downstream phenotypes. The study was designed to extend, rather than re-establish, the known requirement for drebrin in myogenic differentiation [35] by testing an actin-responsive transcriptional mechanism and by defining the limits of that interpretation.
2. Results
2.1. Transcriptomic Prioritization Identifies DBN1 as a Candidate Linked to Myogenic Programs
To nominate an actin regulator for mechanistic analysis, we calculated a program-separation score for eight candidates by subtracting each gene's Spearman correlation with the atrophy program, defined by the prespecified atrophy/proteolysis score, from its correlation with the myogenesis/regeneration program (Figure 1A). DBN1 had the highest score (+0.56), followed by PFN1 (+0.49). The DBN1 value arose from a positive association with the myogenesis/regeneration score across human skeletal muscle samples (ρ = 0.274, P = 0.0441; Figure 1B) and an inverse association with the atrophy program (ρ = −0.286, P = 0.0267; Figure 1C). Thus, under this scoring framework, DBN1 tracked the myogenic program positively and the atrophy program inversely. We used these associations to prioritize candidates rather than as evidence that DBN1 is a diagnostic or disease-specific marker.
We next examined DBN1/Dbn1 expression across aging and muscle-wasting contexts. In mouse gastrocnemius, Dbn1 was reduced at 11 months relative to 2 months (log2 fold change = −0.18, FDR = 0.010), whereas the smaller reduction at 25 months did not meet the prespecified FDR threshold (log2 fold change = −0.15, FDR = 0.077; Figure 1D). Human presarcopenia and sarcopenia, denervated myonuclei, starved myotubes, and most immobilization comparisons also showed negative point estimates, but one 14-day immobilization probe increased, and the changes were not uniformly significant (Figure 1E). DBN1/Dbn1 therefore does not behave as a uniform marker of muscle loss. Instead, its preferential association with the myogenic program, together with context-dependent regulation across wasting models, supported its selection for downstream mechanistic analysis.
2.2. Drebrin Is Expressed in Myoblasts and Induced During Differentiation
We first established the cellular and tissue expression pattern of drebrin. Immunoblotting detected drebrin in C2C12 myoblasts and in all mouse tissues examined, with the strongest signal in brain (Figure 2A). Because housekeeping proteins vary across tissues, the survey was evaluated against Ponceau S staining rather than a single reference protein. During five days of C2C12 differentiation, MyoD declined, MyoG increased and peaked around day 3, and MyHC accumulated from day 3 onward (Figure 2B,C). Drebrin was present before differentiation and rose to approximately 1.9-fold at day 3 before remaining above the day-0 level through day 5. This temporal profile places drebrin in both proliferating myoblasts and the differentiation period.
2.3. Drebrin Depletion Shifts the Actin Pool and Alters MRTFA–SRF and YAP1 Signaling
Two siRNAs directed against different DBN1 sequences reduced drebrin protein to approximately 40% of the scrambled RNA (scRNA) control (siDBN1-1, p = 0.002; siDBN1-2, p = 0.003; Figure 3A). Because siDBN1-1 produced more consistent depletion, we used it for the detailed pathway experiments and refer to it below as siDBN1. FITC-phalloidin fluorescence decreased to approximately 60% of control after drebrin depletion (p = 0.02; Figure 3B). In parallel, the distribution of Alexa Fluor 488-DNase I (DNase I-A488) fluorescence shifted to the right in siDBN1-treated cells (Figure 3C), consistent with an increase in the G-actin pool. Together, the microscopy and flow-cytometric measurements indicate that loss of drebrin shifts cellular actin away from the filamentous state. Because the DNase I histogram was not calibrated to absolute actin content, these data do not constitute a direct biochemical measurement of the F-actin/G-actin ratio.
The actin-pool shift was accompanied by increased cytoplasmic MRTFA and reduced nuclear MRTFA and nuclear SRF (Figure 3D,E). α-Tubulin and Lamin B2 were confined predominantly to the cytoplasmic and nuclear fractions, respectively, supporting the quality of the fractionation. YAP1 abundance decreased in both compartments, while the cytoplasmic pYAP1/YAP1 ratio increased (Figure 3D,F). The nuclear YAP1 decrease therefore cannot be assigned solely to altered nuclear translocation because the cytoplasmic pool also declined. The results instead indicate reduced YAP1 abundance, along with enhanced inhibitory phosphorylation, in the cytoplasmic compartment. Overall, drebrin depletion was associated with impaired MRTFA–SRF signaling and reduced YAP1 availability, although these measurements do not establish that either pathway alone mediates the downstream phenotype.
2.4. Drebrin Depletion Suppresses SRF-Dependent Transcription
We next asked whether the reduction in nuclear MRTFA was accompanied by lower SRF-dependent transcription. Drebrin knockdown reduced activity of a luciferase reporter driven by a CArG-containing SMYD1 promoter fragment to approximately 68% of control (p < 0.001), whereas activity from the promoterless pGL3 vector was unchanged (Figure 4A,B). SRF, vinculin, and SMYD1 transcripts were also reduced (p = 0.003, p < 0.001, and p < 0.001, respectively; Figure 4C). The independent siDBN1-2 duplex produced a similar reduction in SMYD1 reporter activity (p < 0.001) without altering the promoterless control (Figure S1). The agreement between the reporter and endogenous target-gene measurements supports reduced MRTFA–SRF transcriptional output after drebrin depletion.
2.5. Drebrin Depletion Restricts Myoblast Proliferation and Cell-Cycle Progression
EdU-positive nuclei decreased from approximately 64% in scRNA cells to 36% after drebrin depletion (p < 0.001; Figure 5A,B). Proliferating cell nuclear antigen (PCNA), cyclin B1 (CCNB1), and cyclin D1 (CCND1) proteins fell to approximately one-half of control (Figure 5C,D). siDBN1-2 independently reduced PCNA (p = 0.001), CCNB1 (p < 0.001), and CCND1 (p < 0.001; Figure S2). DNA-content analysis showed an increase in G0/G1 cells from 64.17 ± 0.5% to 69.29 ± 0.8% (p = 0.003), accompanied by decreases in S phase from 12.12 ± 0.6% to 9.96 ± 0.8% (p = 0.04) and G2/M from 23.58 ± 0.5% to 20.46 ± 0.8% (p = 0.01; Figure 5E,F). Thus, drebrin depletion restricts C2C12 proliferation and cell-cycle progression under the conditions tested.
2.6. Drebrin Depletion Attenuates the Myogenic Protein Program
To assess the differentiation program, scRNA- and siDBN1-transfected cells were switched to differentiation medium and collected on days 0, 3, and 5. Drebrin remained suppressed throughout the experiment (Figure 6A,B). MyoD was lower after knockdown at days 0 and 3 and showed the same direction at day 5, although the day-5 comparison did not reach significance (p = 0.06). MyoG and MyHC were significantly reduced at days 3 and 5. These changes demonstrate impaired induction and maintenance of the myogenic protein program after drebrin depletion.
2.7. Drebrin Is Required for Efficient Myotube Formation
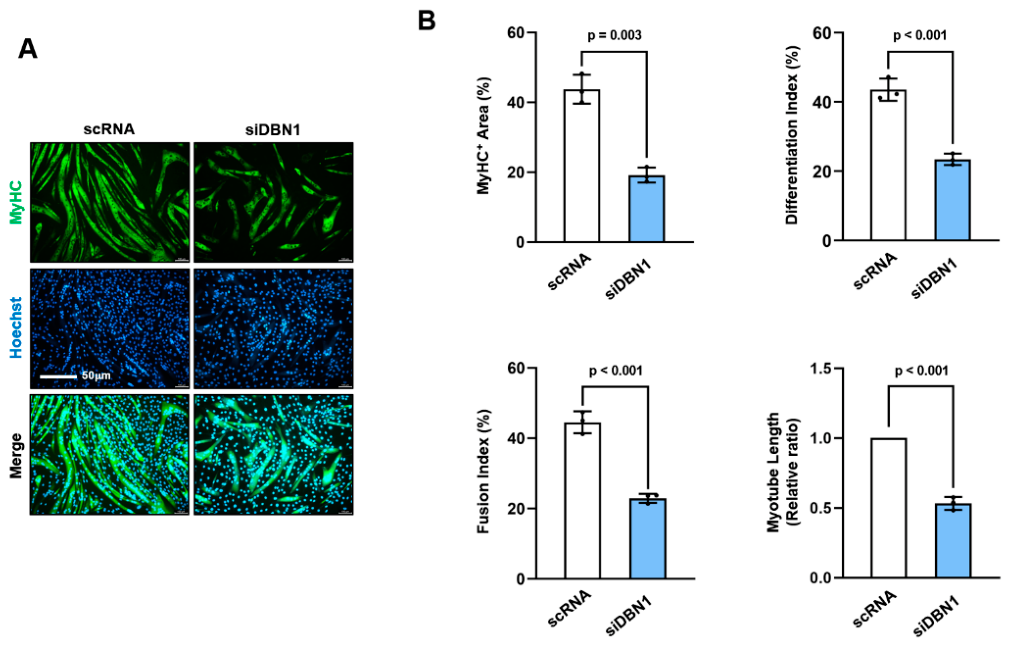
After five days of differentiation, drebrin-depleted cultures contained fewer and shorter MyHC-positive myotubes than control cultures (Figure 7A). MyHC-positive area, differentiation index, fusion index, and relative myotube length were all reduced (Figure 7B). The second DBN1-directed duplex reproduced each morphological outcome: MyHC-positive area and differentiation index decreased (both p = 0.001), and fusion index and relative myotube length were likewise reduced (both p < 0.001; Figure S3). The differentiation phenotype is therefore evident at both molecular and morphological levels and is reproduced with an independent siRNA sequence.
3. Discussion
This study aimed to extend the established role of drebrin in skeletal myogenesis rather than re-demonstrate that DBN1 depletion impairs differentiation. Earlier work showed that drebrin is induced during myoblast differentiation downstream of p38 MAPK and MyoD and that genetic or pharmacological interference with drebrin reduces myogenic marker expression and myotube formation [35]. The present results add a distinct mechanistic layer. Transcriptomic prioritization placed DBN1 toward the myogenesis-associated end of an actin-regulator panel, and DBN1 loss shifted actin-associated readouts toward a more monomeric state, reduced nuclear MRTFA and SRF, suppressed CArG-dependent reporter activity and endogenous SRF-responsive genes, and impaired both precursor expansion and differentiation. A second siRNA reproduced selected cell-cycle, reporter, and myotube phenotypes, reducing the likelihood that all downstream effects arise from a single sequence-specific off-target event.
DBN1 is mechanistically distinct from factors that primarily nucleate or branch new filaments. It binds along pre-existing F-actin, alters filament conformation, and opposes cofilin-mediated severing [33,34]. The combination of reduced phalloidin fluorescence and a rightward shift in DNase I fluorescence after DBN1 knockdown (Figure 3) is therefore consistent with redistribution of actin from a filamentous toward a monomeric pool. These assays are complementary but do not provide a biochemical F-actin/G-actin ratio, nor do they distinguish impaired filament assembly from accelerated disassembly. Resolving those alternatives would require direct biochemical fractionation of actin pools and live measurements of filament turnover.
The MRTFA–SRF findings provide the most coherent downstream chain identified here. G-actin binding restricts MRTFA nuclear accumulation, whereas actin polymerization releases MRTFA to coactivate SRF [18,19]. Drebrin depletion reduced nuclear MRTFA and SRF, decreased activity of a CArG-containing SMYD1 reporter, and lowered SRF, vinculin, and SMYD1 transcripts. The concordance among localization, reporter, and endogenous-target readouts supports attenuation of MRTFA–SRF transcriptional output on the basis of convergent evidence. Because MRTF cofactors and SRF contribute to skeletal-muscle differentiation and fusion [21,22,24], reduced activity of this axis provides a plausible mechanistic link between altered actin organization and the subsequent reduction in MyoD, MyoG, MyHC, and myotube formation.
These results should be interpreted alongside, not in place of, the previously described p38/MyoD–DBN1 relationship. Mancini et al. positioned DBN1 downstream of p38 MAPK and MyoD and showed that drebrin loss compromises differentiation [35]. Our data do not test whether DBN1 depletion alters p38 activity, and therefore do not exclude reciprocal or parallel signaling through p38 or other pathways. A parsimonious model is that p38/MyoD-dependent induction establishes drebrin expression, whereas drebrin-dependent actin organization helps maintain an intracellular state permissive for MRTFA–SRF transcription. The reduction in MyoD after DBN1 knockdown also raises the possibility of feedback, because SRF-dependent control of MyoD and the linkage between MyoD and myogenin provide precedent for transcriptional coupling [36,37]. Time-resolved perturbation and rescue experiments will be needed to distinguish feed-forward regulation from secondary consequences of delayed differentiation.
The YAP1 findings are most relevant to proliferating myoblasts but should be interpreted more cautiously than the MRTFA–SRF data. DBN1 knockdown increased the cytoplasmic pYAP1/YAP1 ratio, reduced YAP1 abundance in both cytoplasmic and nuclear fractions (Figure 3), decreased EdU incorporation and cell-cycle proteins, and shifted the population toward G0/G1 (Figure 5). Because both YAP1 pools declined, the nuclear result cannot be attributed solely to altered nuclear translocation. The data instead support an association between DBN1 depletion, reduced YAP1 availability, enhanced inhibitory phosphorylation in the cytoplasmic compartment, and reduced proliferation. This is biologically compatible with established actin-dependent YAP/TAZ mechanotransduction [38,39] and with the role of YAP1 in maintaining myoblast proliferation [30,31,32], but the present experiments do not establish YAP1 as the sole mediator of the proliferation phenotype.
An important point of context is that the proliferation phenotype is not identical to that reported previously. Mancini et al. observed a modest increase in BrdU incorporation after drebrin depletion in primary mouse myoblasts [35], whereas we observed reduced EdU incorporation, lower PCNA/CCNB1/CCND1 abundance, and greater G0/G1 accumulation in C2C12 cells. The difference may reflect cell type, culture conditions, timing, knockdown strategy, or the extent of drebrin depletion; the present data cannot distinguish among these possibilities. We therefore interpret the proliferation result as context-dependent and limit its interpretation to the experimental conditions tested here. The public transcriptomic analysis likewise provides biological context but does not support a specific claim regarding sarcopenia. DBN1 showed the largest separation between myogenesis/regeneration and atrophy/proteolysis correlations among the eight candidates, but DBN1/Dbn1 fold changes were not consistent across sarcopenia, aging, denervation, starvation, and immobilization datasets. This heterogeneity does not support classification of DBN1 as a universal biomarker of sarcopenia.
Several limitations define the scope of the conclusions. siDBN1-1 was used for the complete pathway analysis, whereas siDBN1-2 independently reproduced the expression of selected cell-cycle proteins, CArG-reporter activity, and myotube phenotypes. Concordant effects of two duplexes reduce but do not eliminate concern about sequence-specific off-target activity. An siRNA-resistant DBN1 rescue expressed near endogenous levels would provide the most stringent additional test of on-target causality. Conventional high-level overexpression is not an ideal substitute for such a rescue because drebrin is an F-actin side-binding protein whose abundance can alter filament occupancy and actin-regulatory interactions [33,34]. Nevertheless, this mechanistic consideration does not diminish the value of a quantitatively controlled rescue experiment. Rescue of MRTFA or YAP1 alone would test pathway sufficiency but would not establish DBN1 on-target specificity. Such rescue could also be incomplete because altered actin organization can influence several signaling systems simultaneously. In addition, the study measures steady-state actin-associated readouts and does not directly assess filament turnover. C2C12 cells also do not reproduce the cellular heterogeneity or mechanical environment of regenerating adult muscle. Future studies using primary cells and in vivo models will further define the physiological relevance of the DBN1-dependent mechanisms identified here.
4. Materials and Methods
4.1. Public Transcriptomic Datasets and Integrative Analysis
Public skeletal-muscle datasets representing human sarcopenia (GSE226151; healthy aged, presarcopenia, and sarcopenia, n = 20 per group), mouse aging (GSE136266; 2, 11, and 25 months, n = 6 per group), denervation (GSE183802), starvation-induced C2C12 myotube atrophy (GSE1776), and human limb immobilization (GSE14901) were analyzed. RNA-seq counts were converted to counts per million and log2-transformed, whereas processed microarray intensities were analyzed on the log2 scale. For GSE183802, myonuclear counts were aggregated for each animal before comparison of control and denervated muscles to avoid pseudoreplication. In GSE226151, myogenesis/regeneration scores were calculated from MYOD1, MYOG, MEF2C, MYMK, MYMX, MYH3, MYH8, and PAX7, and atrophy/proteolysis scores from FBXO32, TRIM63, FOXO3, GADD45A, and KLF15. Each score was the mean of gene-wise standardized expression values. Spearman correlations were calculated between candidate-gene expression and each program score across the 60 participants, and the program-separation score was defined as ρ (myogenesis/regeneration) – ρ (atrophy/proteolysis). Differential-expression estimates are reported as log2 fold changes relative to the corresponding control. Benjamini–Hochberg correction was applied where multiple testing was performed, with FDR < 0.05 considered significant. Cross-dataset estimates were interpreted descriptively and were not combined by meta-analysis because of differences in platform, tissue, cell population, and experimental design.
4.2. Animals and Tissue Preparation
Male C57BL/6 mice (8 weeks old) were housed under standard conditions and euthanized by cervical dislocation, and tissues were harvested for protein analysis. All animal procedures were approved by the Institutional Animal Care and Use Committee of Dongguk University (Approval No. IACUC-2021-009) and performed according to its guidelines. Excised tissues were washed in ice-cold saline to clear residual blood and disrupted with a mechanical homogenizer (Omni International, Kennesaw, GA, USA). For the tissue expression survey, we analyzed 10 µg of lysate per sample by immunoblotting using the appropriate antibodies listed in Table S1.
4.3. Cell Culture and Induction of Differentiation
C2C12 myoblasts (CRL-1772; ATCC, Manassas, VA, USA) were propagated in growth medium (GM): DMEM (Gibco, Carlsbad, CA, USA) containing 10% fetal bovine serum and 100 U/mL penicillin-streptomycin (Gibco). For differentiation experiments, cells were plated in 35 mm dishes at approximately 1.3 × 10⁵ cells per dish and grown to about 90% confluence, at which point GM was exchanged for differentiation medium (DM): DMEM with 2% horse serum (Gibco). Differentiation was continued for up to 5 days, and DM was refreshed daily.
4.4. siRNA Transfection
For knockdown, myoblasts were plated at 1.3 × 10⁵ cells per 35 mm dish and transfected at 40–50% confluence with Lipofectamine 2000 (Invitrogen, Waltham, MA, USA) and 200 nM non-targeting scRNA, siDBN1-1, or siDBN1-2. Both siRNAs were screened for drebrin depletion. siDBN1-1, designated siDBN1 in the detailed pathway experiments, was used for actin-pool analysis, subcellular fractionation, proliferation, differentiation-marker, and myotube experiments. siDBN1-2 was used as an independent validation reagent for cell-cycle proteins, SMYD1 reporter activity, and myotube morphology. After 4 h in serum-free medium, cells were returned to growth medium for 48 h or switched to differentiation medium. Duplex sequences are shown in Table S1.
4.5. Cytoplasmic and Nuclear Fractionation
Compartment-resolved extracts were obtained 48 h post-transfection using NE-PER reagents (Thermo Fisher Scientific, Waltham, MA, USA) following the supplier's protocol. Washed pellets were allowed to swell in CER I on ice for 30 min before CER II was introduced; clarification at 15,000 rpm for 15 min at 4 °C yielded a cytosolic supernatant, and the residual pellet was re-extracted in NER to release nuclear protein. Loading was equalized across the two compartments prior to electrophoresis, and fraction identity was confirmed by probing for α-tubulin (cytosol) and Lamin B2 (nucleus).
4.6. Immunoblotting
Whole-cell protein was released in PBS supplemented with 2% Triton X-100, 0.2 mM PMSF, and 1% phosphatase inhibitor cocktail II (Sigma-Aldrich, St. Louis, MO, USA), and concentrations were determined by Bradford assay. Aliquots of 20 µg were resolved on SDS-polyacrylamide gels and electrotransferred onto nitrocellulose (Amersham Biosciences, Piscataway, NJ, USA). Membranes were saturated with 5% non-fat milk in TBST (TBS with 0.5% Tween-20), held with primary antibody overnight at 4 °C, rinsed, and exposed to HRP-coupled secondary antibody at 1:10,000. Chemiluminescence was raised with TOPview ECL Femto substrate (Enzynomics, Daejeon, Republic of Korea), and band densities were read in Fusion Solo software. For the cross-tissue comparison in Figure 2A, 10 µg of protein was loaded per lane and Ponceau S staining of the membrane was used for normalization, because housekeeping proteins such as β-actin, α-tubulin, and GAPDH differ markedly among tissues. Antibody details are given in Table S1.
4.7. F-Actin and G-Actin Analysis
Filamentous actin was visualized with FITC-conjugated phalloidin (Cytoskeleton, Inc., Denver, CO, USA), and nuclei were counterstained with Hoechst 33342. Images were acquired under the same exposure conditions. Total phalloidin fluorescence within each field was measured in ImageJ and normalized to the number of Hoechst-positive nuclei to account for differences in cell number. The monomeric actin pool was examined by flow cytometry after staining with Alexa Fluor 488-conjugated DNase I (D12371, Invitrogen), which binds G-actin. Samples were analyzed on a CytoFLEX instrument (Beckman Coulter, Brea, CA, USA), and overlaid fluorescence distributions are presented in Figure 3C. This histogram provides a distributional comparison and was not used as a direct biochemical measurement of the cellular F-actin/G-actin ratio. Total β-actin abundance was assessed by immunoblotting in parallel.
4.8. Immunocytochemistry and Morphometric Analysis
Monolayers were preserved in 4% paraformaldehyde, made permeable with 0.3% Triton X-100, and saturated with 3% BSA. Anti-MyHC antibody was applied at 1:100 overnight at 4 °C, followed by Alexa Fluor 488-coupled secondary antibody (Invitrogen) and a Hoechst 33342 nuclear counterstain. Five randomly chosen fields per sample were captured on a Leica fluorescence microscope (Mannheim, Germany), and myogenic indices were derived in ImageJ following the scheme we described previously [14]. The differentiation index was taken as the proportion of nuclei within MyHC-positive cells relative to all nuclei, and the fusion index as the percentage of nuclei residing in myotubes containing three or more nuclei; myotube length and MyHC-positive area were measured on the same images. All morphometric analyses were performed on at least three independent cultures.
4.9. Cell Proliferation and Cell-Cycle Analysis
For EdU analysis, transfected myoblasts received a 4 h pulse of 10 µM EdU before fixation in 4% paraformaldehyde, permeabilization, and development with a Click-iT reaction cocktail (Invitrogen). EdU-labeled nuclei were counted relative to Hoechst 33342-stained nuclei in five randomly selected fields per culture. For cell-cycle profiling, transfected cultures were fixed in 70% ethanol, stained with propidium iodide, and analyzed by flow cytometry. G0/G1, S, and G2/M fractions were derived from DNA-content histograms.
4.10. SRF Reporter Assay
SRF transcriptional activity was measured with a luciferase reporter driven by the SMYD1 promoter region containing the SRF-binding CArG box; a promoterless construct served as the negative control. Myoblasts were co-transfected with the reporter, a Renilla luciferase normalization plasmid, and scRNA or siDBN1, and firefly and Renilla activities were recorded with a dual-luciferase assay 48 h after transfection. Firefly values were normalized to Renilla, and reporter activity was expressed relative to the scRNA control, set to one. Cloning oligonucleotides are listed in Table S3.
4.11. RNA Isolation and RT-qPCR
RNA was recovered on silica columns and quantified spectrophotometrically, and equal input amounts were reverse-transcribed. Amplification used SYBR Green chemistry with every sample run in triplicate, and relative abundance was derived by the 2−ΔΔCt method against GAPDH. Primer sequences and cycling conditions are given in Table S4.
4.12. Statistical Analysis
Cell-culture values are reported as mean ± SEM from three independent experiments unless otherwise indicated. Comparisons between two groups were made using two-tailed Student’s t tests, and comparisons involving more than two groups were performed using one-way ANOVA followed by Tukey’s multiple-comparisons test. Exact p-values are shown where available, and p < 0.05 was considered statistically significant. Transcriptomic statistical analyses are described in Section 4.1.
5. Conclusions
Drebrin-dependent actin organization is associated with MRTFA–SRF transcriptional competence during C2C12 myogenic progression. DBN1 depletion shifts actin-associated readouts toward a more monomeric state, reduces nuclear MRTFA and SRF, suppresses CArG-dependent transcription, restricts cell-cycle progression, and impairs myogenic protein induction and myotube formation. Changes in YAP1 abundance and phosphorylation accompany the proliferation phenotype but are not sufficient to establish a single causal pathway. Together, these findings extend earlier work establishing drebrin as a myogenic regulator by identifying an actin-sensitive MRTFA–SRF signaling layer, while leaving p38/MyoD-dependent and other DBN1-responsive mechanisms compatible with the model.
Supplementary Materials
The following supporting information accompanies this article: Figure S1-S3 and Table S1-S4.
Author Contributions
Conceptualization, W.L.; investigation, T.H.P.N., T.Q.G. and W.L.; writing—original draft preparation, T.H.P.N., T.Q.G. and W.L.; writing—review and editing, W.L.; visualization, T.H.P.N., T.Q.G. and W.L.; supervision, W.L.; project administration, W.L.; funding acquisition, W.L. All authors have read and agreed to the published version of the manuscript.
Funding
This study was supported by the National Research Foundation of Korea (NRF), which is funded by the Korean government (grant no. RS-2026-25480711).
Institutional Review Board Statement
The animal study protocol was approved by the Institutional Animal Care and Use Committee of Dongguk University (Approval No. IACUC-2021-009).
Data Availability Statement
Public transcriptomic data are available from the Gene Expression Omnibus under accessions GSE226151, GSE136266, GSE183802, GSE1776, and GSE14901. Experimental data generated in this study are available from the corresponding author on reasonable request.
Acknowledgments
During the preparation of this manuscript, the authors used OpenAI ChatGPT (5.6, accessed September 2026) for language editing, structural revision, and internal-consistency checks. The authors reviewed and edited all AI-assisted output and take full responsibility for the content of the publication.
Conflicts of Interest
The authors declare no conflicts of interest.
References
- Brooks, S.V.; Guzman, S.D.; Ruiz, L.P. Skeletal muscle structure, physiology, and function. Handb. Clin. Neurol. 2023, 195, 3–16. [Google Scholar] [CrossRef]
- Sartori, R.; Romanello, V.; Sandri, M. Mechanisms of muscle atrophy and hypertrophy: implications in health and disease. Nat. Commun. 2021, 12, 330. [Google Scholar] [CrossRef]
- Schiaffino, S.; Dyar, K.A.; Ciciliot, S.; Blaauw, B.; Sandri, M. Mechanisms regulating skeletal muscle growth and atrophy. FEBS J. 2013, 280, 4294–4314. [Google Scholar] [CrossRef]
- Chal, J.; Pourquié, O. Making muscle: skeletal myogenesis in vivo and in vitro. Development 2017, 144, 2104–2122. [Google Scholar] [CrossRef]
- Feng, L.T.; Chen, Z.N.; Bian, H. Skeletal muscle: molecular structure, myogenesis, biological functions, and diseases. MedComm (2020) 2024, 5, e649. [Google Scholar] [CrossRef]
- Buckingham, M.; Rigby, P.W.J. Gene regulatory networks and transcriptional mechanisms that control myogenesis. Dev. Cell 2014, 28, 225–238. [Google Scholar] [CrossRef]
- Jaalouk, D.E.; Lammerding, J. Mechanotransduction gone awry. Nat. Rev. Mol. Cell Biol. 2009, 10, 63–73. [Google Scholar] [CrossRef]
- Harris, A.R.; Jreij, P.; Fletcher, D.A. Mechanotransduction by the actin cytoskeleton: converting mechanical stimuli into biochemical signals. Annu. Rev. Biophys. 2018, 47, 617–631. [Google Scholar] [CrossRef]
- Benarroch, L.; Bonne, G.; Rivier, F.; Hamroun, D. The 2020 version of the gene table of neuromuscular disorders (nuclear genome). Neuromuscul. Disord. 2019, 29, 980–1018. [Google Scholar] [CrossRef]
- Guerin, C.M.; Kramer, S.G. Cytoskeletal remodeling during myotube assembly and guidance: coordinating the actin and microtubule networks. Commun. Integr. Biol. 2009, 2, 452–457. [Google Scholar] [CrossRef]
- Nowak, S.J.; Nahirney, P.C.; Hadjantonakis, A.K.; Baylies, M.K. Nap1-mediated actin remodeling is essential for mammalian myoblast fusion. J. Cell Sci. 2009, 122, 3282–3293. [Google Scholar] [CrossRef]
- Dominguez, R.; Holmes, K.C. Actin structure and function. Annu. Rev. Biophys. 2011, 40, 169–186. [Google Scholar] [CrossRef]
- Vakhrusheva, A.V.; Murashko, A.V.; Trifonova, E.S.; Efremov, Y.M.; Timashev, P.S.; Sokolova, O.S. Role of actin-binding proteins in the regulation of cellular mechanics. Eur. J. Cell Biol. 2022, 101, 151241. [Google Scholar] [CrossRef]
- Nguyen, M.T.; Won, Y.H.; Kwon, T.W.; Lee, W. Twinfilin-1 is an essential regulator of myogenic differentiation through the modulation of YAP in C2C12 myoblasts. Biochem. Biophys. Res. Commun. 2022, 599, 17–23. [Google Scholar] [CrossRef]
- Nguyen, M.T.; Min, K.H.; Kim, D.; Park, S.Y.; Lee, W. CFL2 is an essential mediator for myogenic differentiation in C2C12 myoblasts. Biochem. Biophys. Res. Commun. 2020, 533, 710–716. [Google Scholar] [CrossRef]
- Huang, S.C.; Zhou, A.; Nguyen, D.T.; Zhang, H.S.; Benz, E.J., Jr. Protein 4.1R influences myogenin protein stability and skeletal muscle differentiation. J. Biol. Chem. 2016, 291, 25591–25607. [Google Scholar] [CrossRef]
- Olson, E.N.; Nordheim, A. Linking actin dynamics and gene transcription to drive cellular motile functions. Nat. Rev. Mol. Cell Biol. 2010, 11, 353–365. [Google Scholar] [CrossRef]
- Miralles, F.; Posern, G.; Zaromytidou, A.I.; Treisman, R. Actin dynamics control SRF activity by regulation of its coactivator MAL. Cell 2003, 113, 329–342. [Google Scholar] [CrossRef]
- Mouilleron, S.; Langer, C.A.; Guettler, S.; McDonald, N.Q.; Treisman, R. Structure of a pentavalent G-actin·MRTF-A complex reveals how G-actin controls nucleocytoplasmic shuttling of a transcriptional coactivator. Sci. Signal. 2011, 4, ra40. [Google Scholar] [CrossRef]
- Montel, L.; Sotiropoulos, A.; Henon, S. The nature and intensity of mechanical stimulation drive different dynamics of MRTF-A nuclear redistribution after actin remodeling in myoblasts. PLoS ONE 2019, 14, e0214385. [Google Scholar] [CrossRef]
- Selvaraj, A.; Prywes, R. Megakaryoblastic leukemia-1/2, a transcriptional co-activator of serum response factor, is required for skeletal myogenic differentiation. J. Biol. Chem. 2003, 278, 41977–41987. [Google Scholar] [CrossRef]
- Randrianarison-Huetz, V.; Papaefthymiou, A.; Herledan, G.; Noviello, C.; Faradova, U.; Collard, L.; Pincini, A.; Schol, E.; Decaux, J.F.; Maire, P.; et al. Srf controls satellite cell fusion through the maintenance of actin architecture. J. Cell Biol. 2018, 217, 685–700. [Google Scholar] [CrossRef]
- Medjkane, S.; Perez-Sanchez, C.; Gaggioli, C.; Sahai, E.; Treisman, R. Myocardin-related transcription factors and SRF are required for cytoskeletal dynamics and experimental metastasis. Nat. Cell Biol. 2009, 11, 257–268. [Google Scholar] [CrossRef]
- Coletti, D.; Daou, N.; Hassani, M.; Li, Z.; Parlakian, A. Serum response factor in muscle tissues: from development to ageing. Eur. J. Transl. Myol. 2016, 26, 6008. [Google Scholar] [CrossRef]
- Li, D.; Niu, Z.; Yu, W.; Qian, Y.; Wang, Q.; Li, Q.; Yi, Z.; Luo, J.; Wu, X.; Wang, Y.; et al. SMYD1, the myogenic activator, is a direct target of serum response factor and myogenin. Nucleic Acids Res. 2009, 37, 7059–7071. [Google Scholar] [CrossRef]
- Nagandla, H.; Lopez, S.; Yu, W.; Rasmussen, T.L.; Tucker, H.O.; Schwartz, R.J.; Stewart, M.D. Defective myogenesis in the absence of the muscle-specific lysine methyltransferase SMYD1. Dev. Biol. 2016, 410, 86–97. [Google Scholar] [CrossRef]
- Moujaber, O.; Stochaj, U. The cytoskeleton as regulator of cell signaling pathways. Trends Biochem. Sci. 2020, 45, 96–107. [Google Scholar] [CrossRef]
- Dupont, S. Role of YAP/TAZ in cell-matrix adhesion-mediated signalling and mechanotransduction. Exp. Cell Res. 2016, 343, 42–53. [Google Scholar] [CrossRef]
- Fischer, M.; Rikeit, P.; Knaus, P.; Coirault, C. YAP-mediated mechanotransduction in skeletal muscle. Front. Physiol. 2016, 7, 41. [Google Scholar] [CrossRef]
- Watt, K.I.; Judson, R.; Medlow, P.; Reid, K.; Kurth, T.B.; Burniston, J.G.; Ratkevicius, A.; De Bari, C.; Wackerhage, H. Yap is a novel regulator of C2C12 myogenesis. Biochem. Biophys. Res. Commun. 2010, 393, 619–624. [Google Scholar] [CrossRef]
- Judson, R.N.; Tremblay, A.M.; Knopp, P.; White, R.B.; Urcia, R.; De Bari, C.; Zammit, P.S.; Camargo, F.D.; Wackerhage, H. The Hippo pathway member Yap plays a key role in influencing fate decisions in muscle satellite cells. J. Cell Sci. 2012, 125, 6009–6019. [Google Scholar] [CrossRef]
- Sun, C.; De Mello, V.; Mohamed, A.; Ortuste Quiroga, H.P.; Garcia-Munoz, A.; Al Bloshi, A.; Tremblay, A.M.; von Kriegsheim, A.; Collie-Duguid, E.; Vargesson, N.; et al. Common and distinctive functions of the Hippo effectors Taz and Yap in skeletal muscle stem cell function. Stem Cells 2017, 35, 1958–1972. [Google Scholar] [CrossRef]
- Grintsevich, E.E.; Galkin, V.E.; Orlova, A.; Ytterberg, A.J.; Mikati, M.M.; Kudryashov, D.S.; Loo, J.A.; Egelman, E.H.; Reisler, E. Mapping of drebrin binding site on F-actin. J. Mol. Biol. 2010, 398, 542–554. [Google Scholar] [CrossRef]
- Grintsevich, E.E.; Reisler, E. Drebrin inhibits cofilin-induced severing of F-actin. Cytoskeleton 2014, 71, 472–483. [Google Scholar] [CrossRef]
- Mancini, A.; Sirabella, D.; Zhang, W.; Yamazaki, H.; Shirao, T.; Krauss, R.S. Regulation of myotube formation by the actin-binding factor drebrin. Skelet. Muscle 2011, 1, 36. [Google Scholar] [CrossRef]
- L'Honore, A.; Lamb, N.J.; Vandromme, M.; Turowski, P.; Carnac, G.; Fernandez, A. MyoD distal regulatory region contains an SRF binding CArG element required for MyoD expression in skeletal myoblasts and during muscle regeneration. Mol. Biol. Cell 2003, 14, 2151–2162. [Google Scholar] [CrossRef]
- Deato, M.D.E.; Marr, M.T.; Sottero, T.; Inouye, C.; Hu, P.; Tjian, R. MyoD targets TAF3/TRF3 to activate myogenin transcription. Mol. Cell 2008, 32, 96–105. [Google Scholar] [CrossRef]
- Dupont, S.; Morsut, L.; Aragona, M.; Enzo, E.; Giulitti, S.; Cordenonsi, M.; Zanconato, F.; Le Digabel, J.; Forcato, M.; Bicciato, S.; et al. Role of YAP/TAZ in mechanotransduction. Nature 2011, 474, 179–183. [Google Scholar] [CrossRef]
- Aragona, M.; Panciera, T.; Manfrin, A.; Giulitti, S.; Michielin, F.; Elvassore, N.; Dupont, S.; Piccolo, S. A mechanical checkpoint controls multicellular growth through YAP/TAZ regulation by actin-processing factors. Cell 2013, 154, 1047–1059. [Google Scholar] [CrossRef]
Figure 1.
Transcriptomic prioritization and cross-context expression of DBN1. (A) Actin-remodeling candidate prioritization using program-separation scores calculated as Spearman ρ (myogenesis/regeneration) − ρ (atrophy program); the atrophy program corresponds to the prespecified atrophy/proteolysis score. Positive values indicate preferential association with the myogenic program. (B) DBN1 tracks the myogenic program: relationship between normalized DBN1 expression and the myogenesis/regeneration score across healthy aged (HA), presarcopenia (PS), and sarcopenia (S) human skeletal-muscle samples. (C) DBN1 inversely tracks the atrophy program: relationship between normalized DBN1 expression and the atrophy program score across the same samples. Solid lines in (B,C) show the overall trend for visualization; we evaluated associations using Spearman rank correlation. (D) Aging-associated Dbn1 regulation in mouse gastrocnemius at 2, 11, and 25 months. (E) Cross-context evidence is directionally heterogeneous: DBN1/Dbn1 log2 fold-change estimates across human sarcopenia and experimental atrophy datasets. Segments in (E) connect point estimates to zero and are not confidence intervals. Separate probes are shown where applicable. *FDR < 0.05.
Figure 1.
Transcriptomic prioritization and cross-context expression of DBN1. (A) Actin-remodeling candidate prioritization using program-separation scores calculated as Spearman ρ (myogenesis/regeneration) − ρ (atrophy program); the atrophy program corresponds to the prespecified atrophy/proteolysis score. Positive values indicate preferential association with the myogenic program. (B) DBN1 tracks the myogenic program: relationship between normalized DBN1 expression and the myogenesis/regeneration score across healthy aged (HA), presarcopenia (PS), and sarcopenia (S) human skeletal-muscle samples. (C) DBN1 inversely tracks the atrophy program: relationship between normalized DBN1 expression and the atrophy program score across the same samples. Solid lines in (B,C) show the overall trend for visualization; we evaluated associations using Spearman rank correlation. (D) Aging-associated Dbn1 regulation in mouse gastrocnemius at 2, 11, and 25 months. (E) Cross-context evidence is directionally heterogeneous: DBN1/Dbn1 log2 fold-change estimates across human sarcopenia and experimental atrophy datasets. Segments in (E) connect point estimates to zero and are not confidence intervals. Separate probes are shown where applicable. *FDR < 0.05.
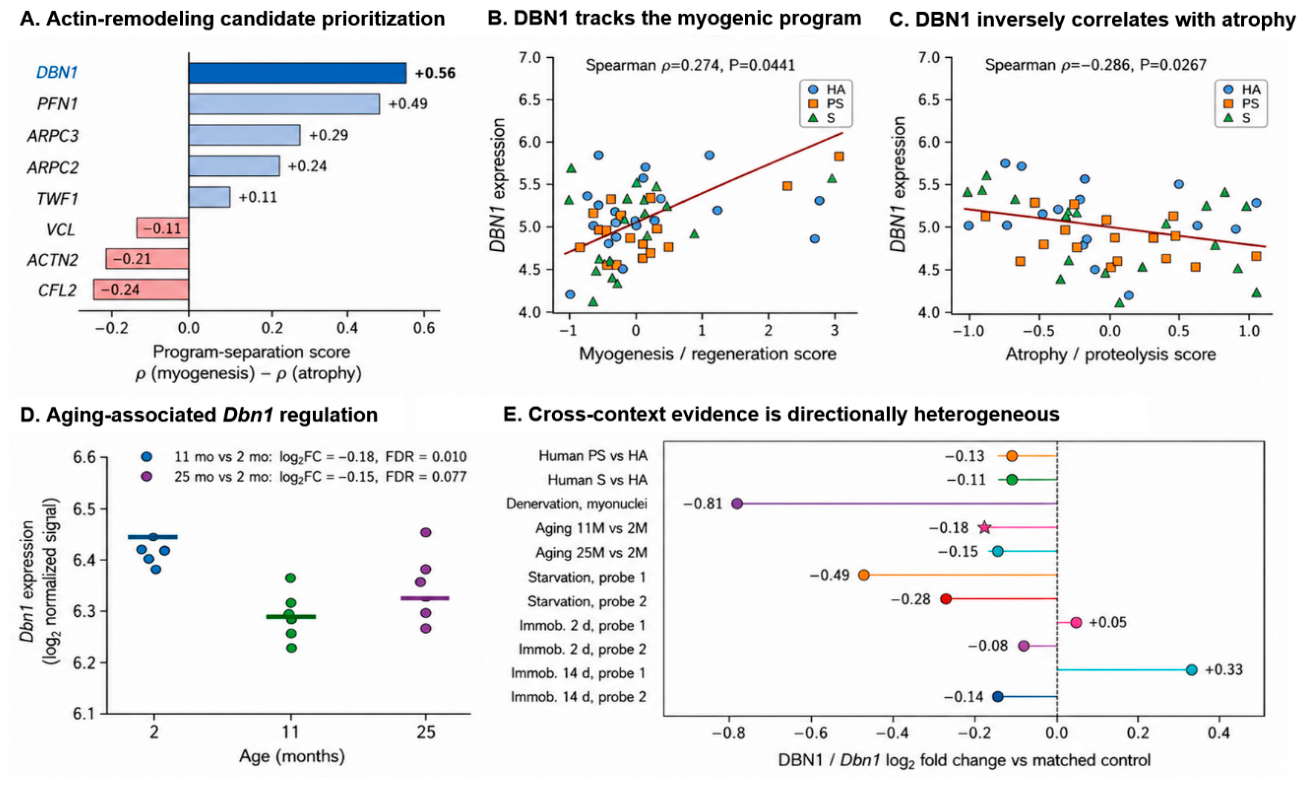
Figure 2.
Drebrin expression across tissues and during C2C12 differentiation. (A) Representative immunoblot of drebrin in proliferating C2C12 myoblasts and the indicated mouse tissues. We show Ponceau S staining of transferred protein because commonly used housekeeping proteins differ substantially among tissues. (B) Representative immunoblots of MyoD, MyoG, MyHC, and drebrin during C2C12 differentiation from day 0 to day 5. β-Actin served as the loading control for the cell-culture time course. (C) Densitometric quantification normalized to β-Actin. Relative expression ratios were calculated against the following baseline time points: Day 0 for MyoD and DBN1, Day 1 for MyoG, and Day 3 for MyHC. Data are mean ± SEM from three independent experiments. Comparisons were made against the indicated baseline time point using one-way ANOVA followed by Tukey’s multiple-comparisons test. *p < 0.05, **p < 0.01, ***p < 0.001; ns, not significant.
Figure 2.
Drebrin expression across tissues and during C2C12 differentiation. (A) Representative immunoblot of drebrin in proliferating C2C12 myoblasts and the indicated mouse tissues. We show Ponceau S staining of transferred protein because commonly used housekeeping proteins differ substantially among tissues. (B) Representative immunoblots of MyoD, MyoG, MyHC, and drebrin during C2C12 differentiation from day 0 to day 5. β-Actin served as the loading control for the cell-culture time course. (C) Densitometric quantification normalized to β-Actin. Relative expression ratios were calculated against the following baseline time points: Day 0 for MyoD and DBN1, Day 1 for MyoG, and Day 3 for MyHC. Data are mean ± SEM from three independent experiments. Comparisons were made against the indicated baseline time point using one-way ANOVA followed by Tukey’s multiple-comparisons test. *p < 0.05, **p < 0.01, ***p < 0.001; ns, not significant.
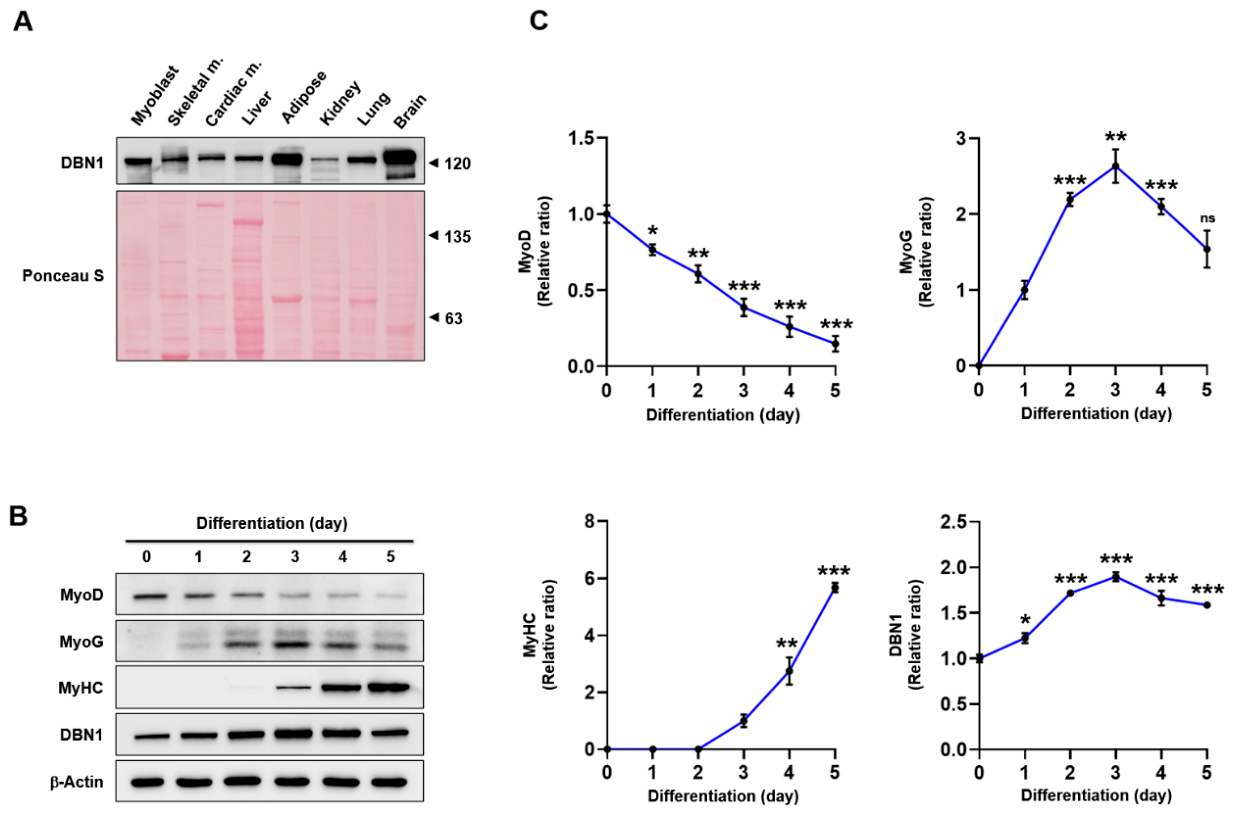
Figure 3.
Drebrin depletion redistributes the cellular actin pool and is associated with altered MRTFA–SRF and YAP1 signaling. (A) Representative immunoblot and quantification of drebrin after transfection with two independent DBN1-targeting siRNAs. (B) F-actin visualized by FITC-phalloidin microscopy and quantified after normalization to Hoechst-positive nuclei; scale bar, 25 µm. (C) Representative flow-cytometric distributions of Alexa Fluor 488-conjugated DNase I labeling (DNase I-A488), used as a readout of G-actin, in scRNA- and siDBN1-transfected cells. The histogram is interpreted as a distributional comparison, not a direct biochemical F-actin/G-actin ratio. (D–F) Representative immunoblots (D) and quantification of MRTFA and SRF (E) and YAP1 and pYAP1 (F) in cytoplasmic and nuclear fractions. α-Tubulin and Lamin B2 indicate cytoplasmic and nuclear fraction identity, respectively. Different exposure times were used to visualize MRTFA in the two fractions. Data are mean ± SEM from three independent experiments; exact p-values are shown.
Figure 3.
Drebrin depletion redistributes the cellular actin pool and is associated with altered MRTFA–SRF and YAP1 signaling. (A) Representative immunoblot and quantification of drebrin after transfection with two independent DBN1-targeting siRNAs. (B) F-actin visualized by FITC-phalloidin microscopy and quantified after normalization to Hoechst-positive nuclei; scale bar, 25 µm. (C) Representative flow-cytometric distributions of Alexa Fluor 488-conjugated DNase I labeling (DNase I-A488), used as a readout of G-actin, in scRNA- and siDBN1-transfected cells. The histogram is interpreted as a distributional comparison, not a direct biochemical F-actin/G-actin ratio. (D–F) Representative immunoblots (D) and quantification of MRTFA and SRF (E) and YAP1 and pYAP1 (F) in cytoplasmic and nuclear fractions. α-Tubulin and Lamin B2 indicate cytoplasmic and nuclear fraction identity, respectively. Different exposure times were used to visualize MRTFA in the two fractions. Data are mean ± SEM from three independent experiments; exact p-values are shown.
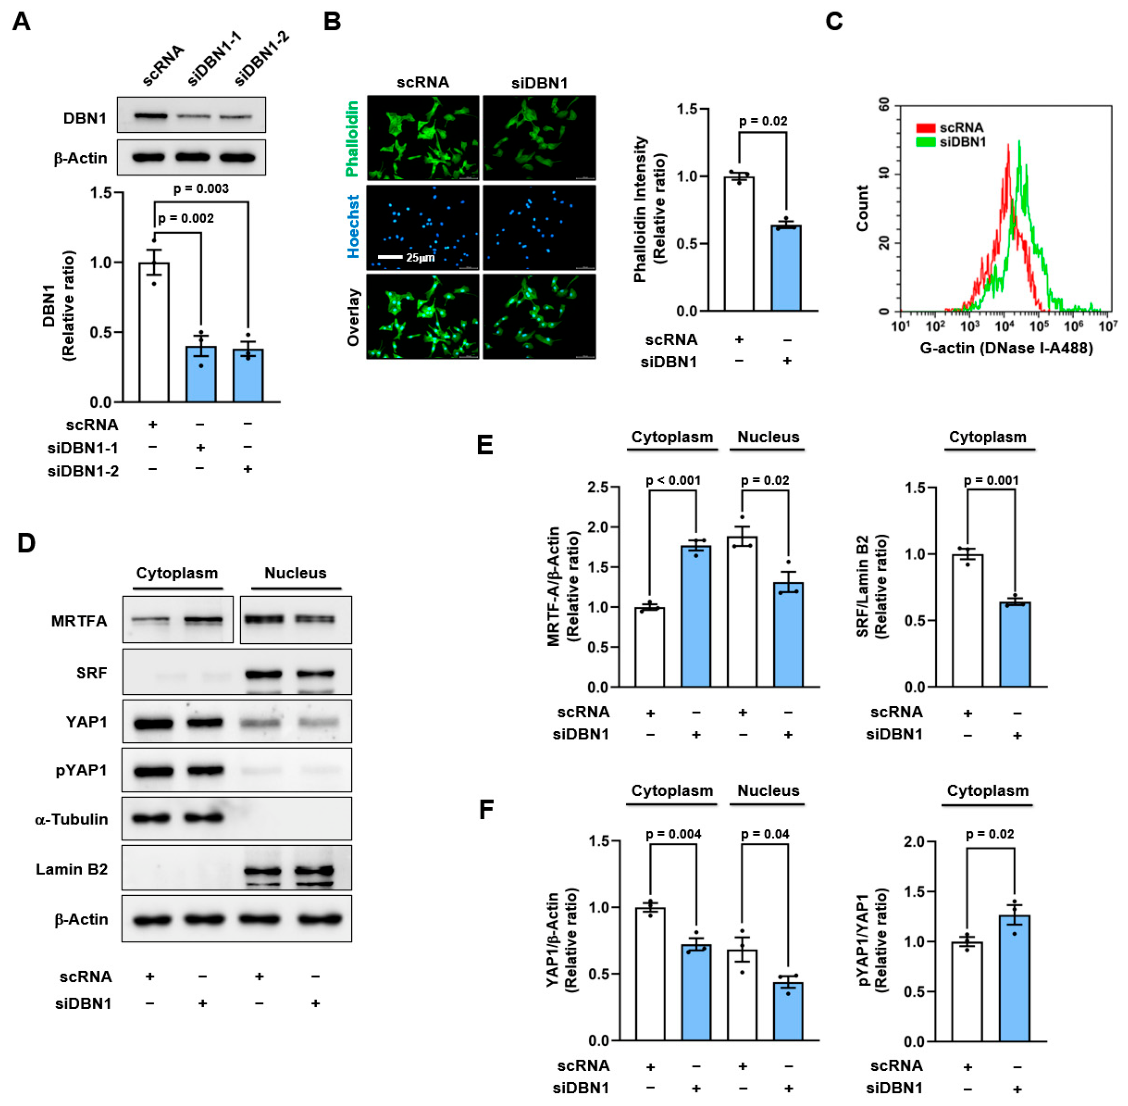
Figure 4.
Drebrin depletion reduces CArG-dependent transcriptional output. (A) Schematic of the SMYD1 promoter reporter containing the SRF-binding CArG element and the promoterless pGL3 control. (B) Dual-luciferase activity after transfection with scRNA or siDBN1. Firefly luciferase activity was normalized to Renilla luciferase and expressed relative to the corresponding control. (C) Relative SRF, vinculin, and SMYD1 mRNA abundance normalized to GAPDH. Data are mean ± SEM from three independent experiments; exact p-values are shown; ns, not significant.
Figure 4.
Drebrin depletion reduces CArG-dependent transcriptional output. (A) Schematic of the SMYD1 promoter reporter containing the SRF-binding CArG element and the promoterless pGL3 control. (B) Dual-luciferase activity after transfection with scRNA or siDBN1. Firefly luciferase activity was normalized to Renilla luciferase and expressed relative to the corresponding control. (C) Relative SRF, vinculin, and SMYD1 mRNA abundance normalized to GAPDH. Data are mean ± SEM from three independent experiments; exact p-values are shown; ns, not significant.
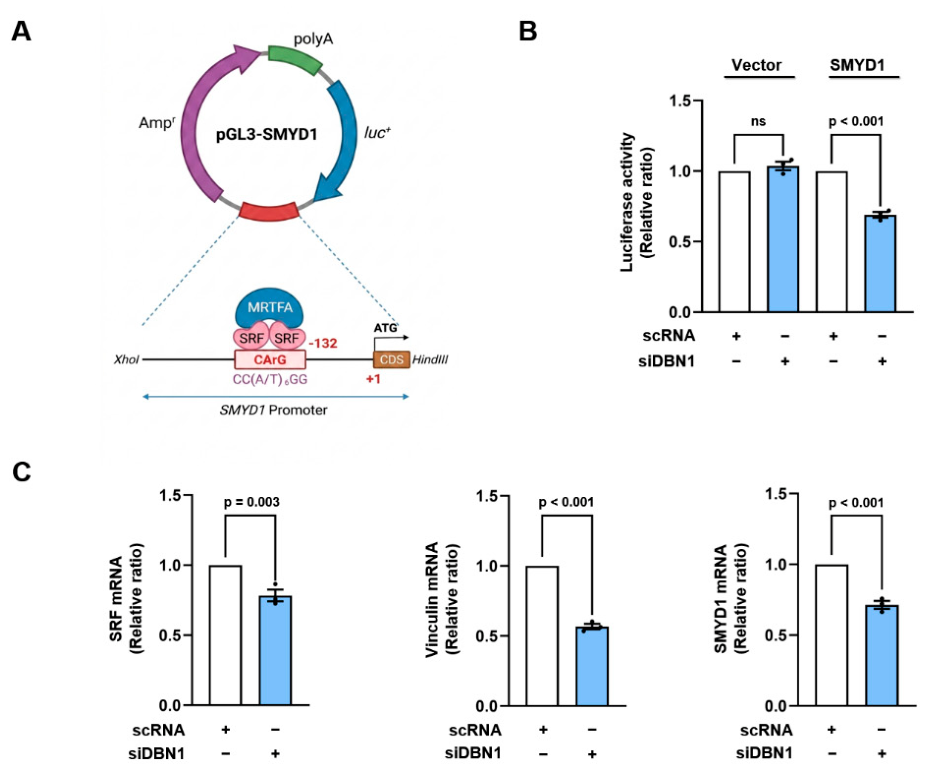
Figure 5.
Drebrin depletion restricts C2C12 myoblast proliferation and cell-cycle progression. (A) Representative EdU incorporation images after scRNA or siDBN1 transfection; Hoechst 33342 marks nuclei; scale bar, 50 µm. (B) Percentage of EdU-positive nuclei. (C,D) Representative immunoblots (C) and densitometric quantification (D) of PCNA, CCNB1, and CCND1, normalized to β-actin. (E) Representative DNA-content histograms. (F) Quantification of the G0/G1, S, and G2/M fractions. Data are mean ± SEM from three independent experiments; exact p-values are shown.
Figure 5.
Drebrin depletion restricts C2C12 myoblast proliferation and cell-cycle progression. (A) Representative EdU incorporation images after scRNA or siDBN1 transfection; Hoechst 33342 marks nuclei; scale bar, 50 µm. (B) Percentage of EdU-positive nuclei. (C,D) Representative immunoblots (C) and densitometric quantification (D) of PCNA, CCNB1, and CCND1, normalized to β-actin. (E) Representative DNA-content histograms. (F) Quantification of the G0/G1, S, and G2/M fractions. Data are mean ± SEM from three independent experiments; exact p-values are shown.
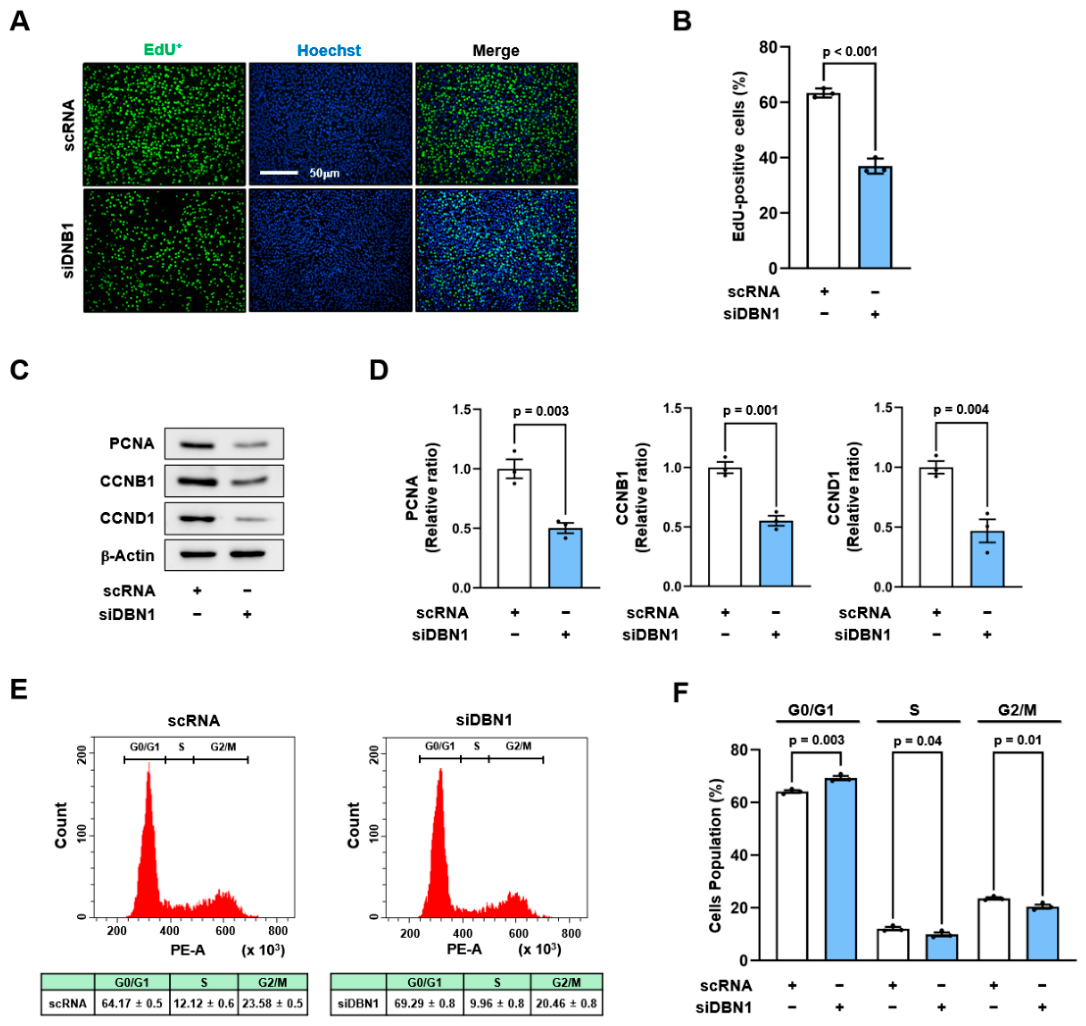
Figure 6.
Drebrin depletion attenuates the myogenic protein program. (A) Representative immunoblots of drebrin, MyoD, MyoG, and MyHC in scRNA- and siDBN1-transfected C2C12 cells collected on differentiation days 0, 3, and 5. β-Actin served as the loading control. (B) Densitometric quantification relative to the corresponding scRNA condition at each time point. Data are mean ± SEM from three independent experiments; exact p-values are shown.
Figure 6.
Drebrin depletion attenuates the myogenic protein program. (A) Representative immunoblots of drebrin, MyoD, MyoG, and MyHC in scRNA- and siDBN1-transfected C2C12 cells collected on differentiation days 0, 3, and 5. β-Actin served as the loading control. (B) Densitometric quantification relative to the corresponding scRNA condition at each time point. Data are mean ± SEM from three independent experiments; exact p-values are shown.
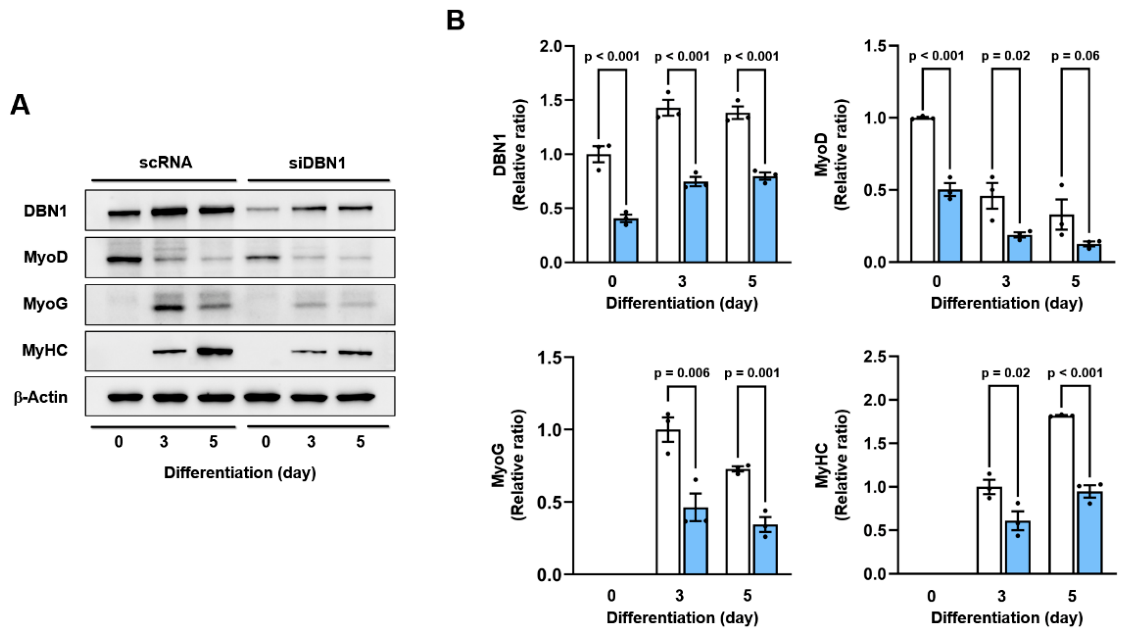
Figure 7.
Drebrin depletion impairs C2C12 myotube formation. (A) Representative MyHC immunocytochemistry after five days of differentiation in scRNA- and siDBN1-transfected cultures. Hoechst 33342 marks nuclei; scale bar, 50 µm. (B) Quantification of MyHC-positive area, differentiation index, fusion index, and relative myotube length. Five randomly selected fields were analyzed per culture, with at least three independent cultures included in the analysis. Data are mean ± SEM; exact p-values are shown.
Figure 7.
Drebrin depletion impairs C2C12 myotube formation. (A) Representative MyHC immunocytochemistry after five days of differentiation in scRNA- and siDBN1-transfected cultures. Hoechst 33342 marks nuclei; scale bar, 50 µm. (B) Quantification of MyHC-positive area, differentiation index, fusion index, and relative myotube length. Five randomly selected fields were analyzed per culture, with at least three independent cultures included in the analysis. Data are mean ± SEM; exact p-values are shown.
Disclaimer/Publisher’s Note: The statements, opinions and data contained in all publications are solely those of the individual author(s) and contributor(s) and not of MDPI and/or the editor(s). MDPI and/or the editor(s) disclaim responsibility for any injury to people or property resulting from any ideas, methods, instructions or products referred to in the content. |
© 2026 by the authors. Licensee MDPI, Basel, Switzerland. This article is an open access article distributed under the terms and conditions of the Creative Commons Attribution (CC BY) license (http://creativecommons.org/licenses/by/4.0/).
Copyright: This open access article is published under a Creative Commons CC BY 4.0 license, which permit the free download, distribution, and reuse, provided that the author and preprint are cited in any reuse.