

Submitted:
17 September 2026
Posted:
20 September 2026
You are already at the latest version
Abstract
Perovskite solar cells (PSCs) represent a promising alternative to conventional crystal-line silicon photovoltaics (Si PV), but their commercialization requires simultaneous consideration of environmental performance, operational lifetime, end-of-life (EoL) management, and technology-development priorities. This study develops an inte-grated life-cycle and decision-support assessment of PSC and Si PV systems. Life Cycle Assessment (LCA) models were developed in OpenLCA on a functional basis of 1 m² of PV system, considering production, use, and EoL stages and applying ReCiPe 2016 Midpoint (H) and CML-IA Baseline. The environmental results were further integrated into a multi-criteria decision-support framework using cost-criterion normalization, Simple Additive Weighting, and scenario-based sensitivity analysis. PSC exhibited substantially lower climate-related impacts than Si PV, with reductions of 57.04% for global warming–human health (ReCiPe) and 57.35% for GWP100a (CML-IA), together with 48.53–53.41% lower fossil-resource-related impacts. However, pronounced trade-offs were identified, including higher stratospheric ozone depletion (+132.50%), mineral resource scarcity (+22.06%), land use (+754.03%), photochemical oxidation (+5747.52%), and terrestrial ecotoxicity (+731.95%). Under equal weighting, Si PV achieved higher Decision-Support Scores (DSS) for both ReCiPe (78.88 vs. 67.33) and CML-IA (67.05 vs. 62.75). Sensitivity analysis showed stable ordering under all ReCiPe scenarios, whereas the CML-IA ordering reversed under climate- and resource-priority scenarios, demonstrating the influence of environmental priorities on aggregated technology assessment. Although PSCs offer important opportunities associated with lower-energy manufacturing, their sustainable commercialization depends on extend-ing operational lifetime, reducing material- and toxicity-related hotspots, implement-ing scalable and resource-efficient manufacturing, and developing effective recycling and material-recovery systems. The proposed framework demonstrates how LCA combined with multi-criteria decision support can provide a transparent basis for evaluating environmental trade-offs and guiding the sustainable development of emerging photovoltaic technologies.
Keywords:
Perovskite solar cells
; Life Cycle Assessment
; photovoltaic systems
; silicon photovoltaics
; multi-criteria decision analysis
; decision support
; end-of-life management
; circular economy
; sustainable manufacturing
; sensitivity analysis
1. Introduction
The transition toward low-carbon energy systems has intensified the development and deployment of photovoltaic (PV) technologies as a central component of global decarbonization strategies [1]. Although crystalline silicon (c-Si) photovoltaics currently dominate the commercial PV market, their manufacturing involves energy-intensive processes and substantial material requirements [2,3]. These characteristics have stimulated research into emerging PV technologies capable of combining high conversion efficiency with lower material and energy demands [4,5].
Perovskite solar cells (PSCs) have emerged as one of the most promising next-generation PV technologies [6]. Their rapid technological development is associated with high power-conversion efficiencies, tunable optoelectronic properties, compatibility with thin-film architectures, and the possibility of employing comparatively low-temperature manufacturing processes [7]. These characteristics offer potential environmental and economic advantages over conventional silicon-based PVs, particularly if scalable manufacturing technologies can retain the performance achieved at laboratory scale [8].
However, high conversion efficiency alone does not ensure the sustainability or commercial viability of an emerging PV technology [9]. A comprehensive evaluation must account for environmental burdens throughout the life cycle, including raw-material extraction, energy consumption, manufacturing, use, and end-of-life (EoL) management [10,11]. This is particularly relevant for PSCs, whose potentially lower manufacturing energy requirements are accompanied by challenges related to operational stability, limited lifetime, hazardous constituents such as lead, and the lack of mature recycling infrastructure [7,12]. Life Cycle Assessment (LCA) provides a systematic framework for quantifying these burdens and identifying environmental hotspots across the PV life cycle [13].
Nevertheless, environmental performance alone cannot determine the long-term sustainability of an emerging PV technology. For PSCs, production cost, conversion efficiency, operational lifetime, stability, manufacturing scalability, and EoL management collectively influence the transition from laboratory-scale performance to commercial deployment [14]. In particular, environmental benefits achieved through less energy-intensive manufacturing may be diminished by a short operational lifetime, frequent module replacement, or inadequate recovery of hazardous and valuable materials [15]. Conversely, improvements in durability, scalable manufacturing, and material recovery could reinforce both the environmental performance and economic competitiveness of PSC technologies [16].
This interdependence highlights an important limitation of assessments based exclusively on individual environmental indicators [17,18]. Strategic decisions regarding emerging production systems require the simultaneous interpretation of multiple environmental criteria together with technical, economic, and circularity considerations [19,20]. Digital decision-support approaches can facilitate this process by transforming heterogeneous sustainability indicators into structured information that can be used to compare technological alternatives and investigate how different strategic priorities affect technology selection [21,22].
In this context, the present study develops an integrated assessment of perovskite and conventional silicon PV systems based on detailed life cycle modelling and complementary techno-economic considerations. LCA models were developed in OpenLCA using a functional basis of 1 m² of PV system. Environmental impacts were assessed using both the ReCiPe 2016 Midpoint (H) and CML-IA Baseline methodologies. The analysis includes manufacturing, use, and EoL considerations and incorporates material-management pathways including recycling, reuse, recovery, and disposal. The dataset used in this study contains separate life-cycle inventories for the production of 1 m² of PSC and silicon PV, use-phase data, quantitative EoL material distributions, and aggregate environmental results for both LCIA methodologies.
Beyond the comparative LCA, this study proposes a digital decision-support framework that converts the calculated environmental indicators into normalized performance scores and evaluates the robustness of technology selection under alternative decision-maker priorities. Techno-economic factors, including production cost, efficiency, lifetime, stability, reliability, and commercialization maturity, are incorporated as complementary considerations, reflecting the availability and maturity of the underlying data.
Therefore, the objectives of this study are to: (i) quantify and compare the life-cycle environmental impacts of perovskite and silicon PV systems; (ii) identify the environmental categories in which PSCs provide advantages or potential trade-offs; (iii) evaluate EoL management and circularity considerations for both technologies; (iv) examine the principal techno-economic factors affecting the transition of PSCs toward commercial deployment; and (v) develop an LCA-driven digital decision-support framework for translating environmental results into strategic technology-selection information.
The novelty of the study lies in moving beyond a conventional comparative LCA toward an integrated decision-oriented assessment. Rather than considering environmental impacts, EoL management, and commercialization constraints independently, the proposed framework links LCA outputs with alternative sustainability priorities and complementary techno-economic considerations, thereby supporting strategic decision-making for the development of more sustainable PV production systems.
2. Materials and Methods
2.1. Research Design
The methodological approach adopted in this study combines comparative LCA, EoL evaluation, techno-economic considerations, and multi-criteria digital decision support. Two PV technologies were evaluated: a perovskite PV system and a conventional silicon PV system.
The methodology consisted of four interconnected stages: (i) construction of the life-cycle inventories (LCIs) and environmental models; (ii) comparative LCIA using two complementary impact-assessment methods; (iii) assessment of EoL and techno-economic considerations; and (iv) transformation of the environmental results into a digital decision-support structure based on normalization, weighting, aggregation, and sensitivity analysis.
2.2. Goal, Scope and Functional Unit
The goal of the LCA was to comparatively evaluate the environmental performance of perovskite and conventional silicon PV systems and identify environmental advantages and trade-offs relevant to future sustainable PV manufacturing.
The functional basis adopted for the inventory analysis was: 1 m² of PV system. This basis enables direct comparison of material and manufacturing requirements between the two PV technologies. The LCI developed for the present study contains separate production inventories for 1 m² of perovskite and silicon PV systems, together with corresponding use-phase and EoL information. Table 1 summarizes the main methodological characteristics and assumptions adopted for the comparative assessment of perovskite and conventional silicon photovoltaic systems.
2.3. System Boundaries
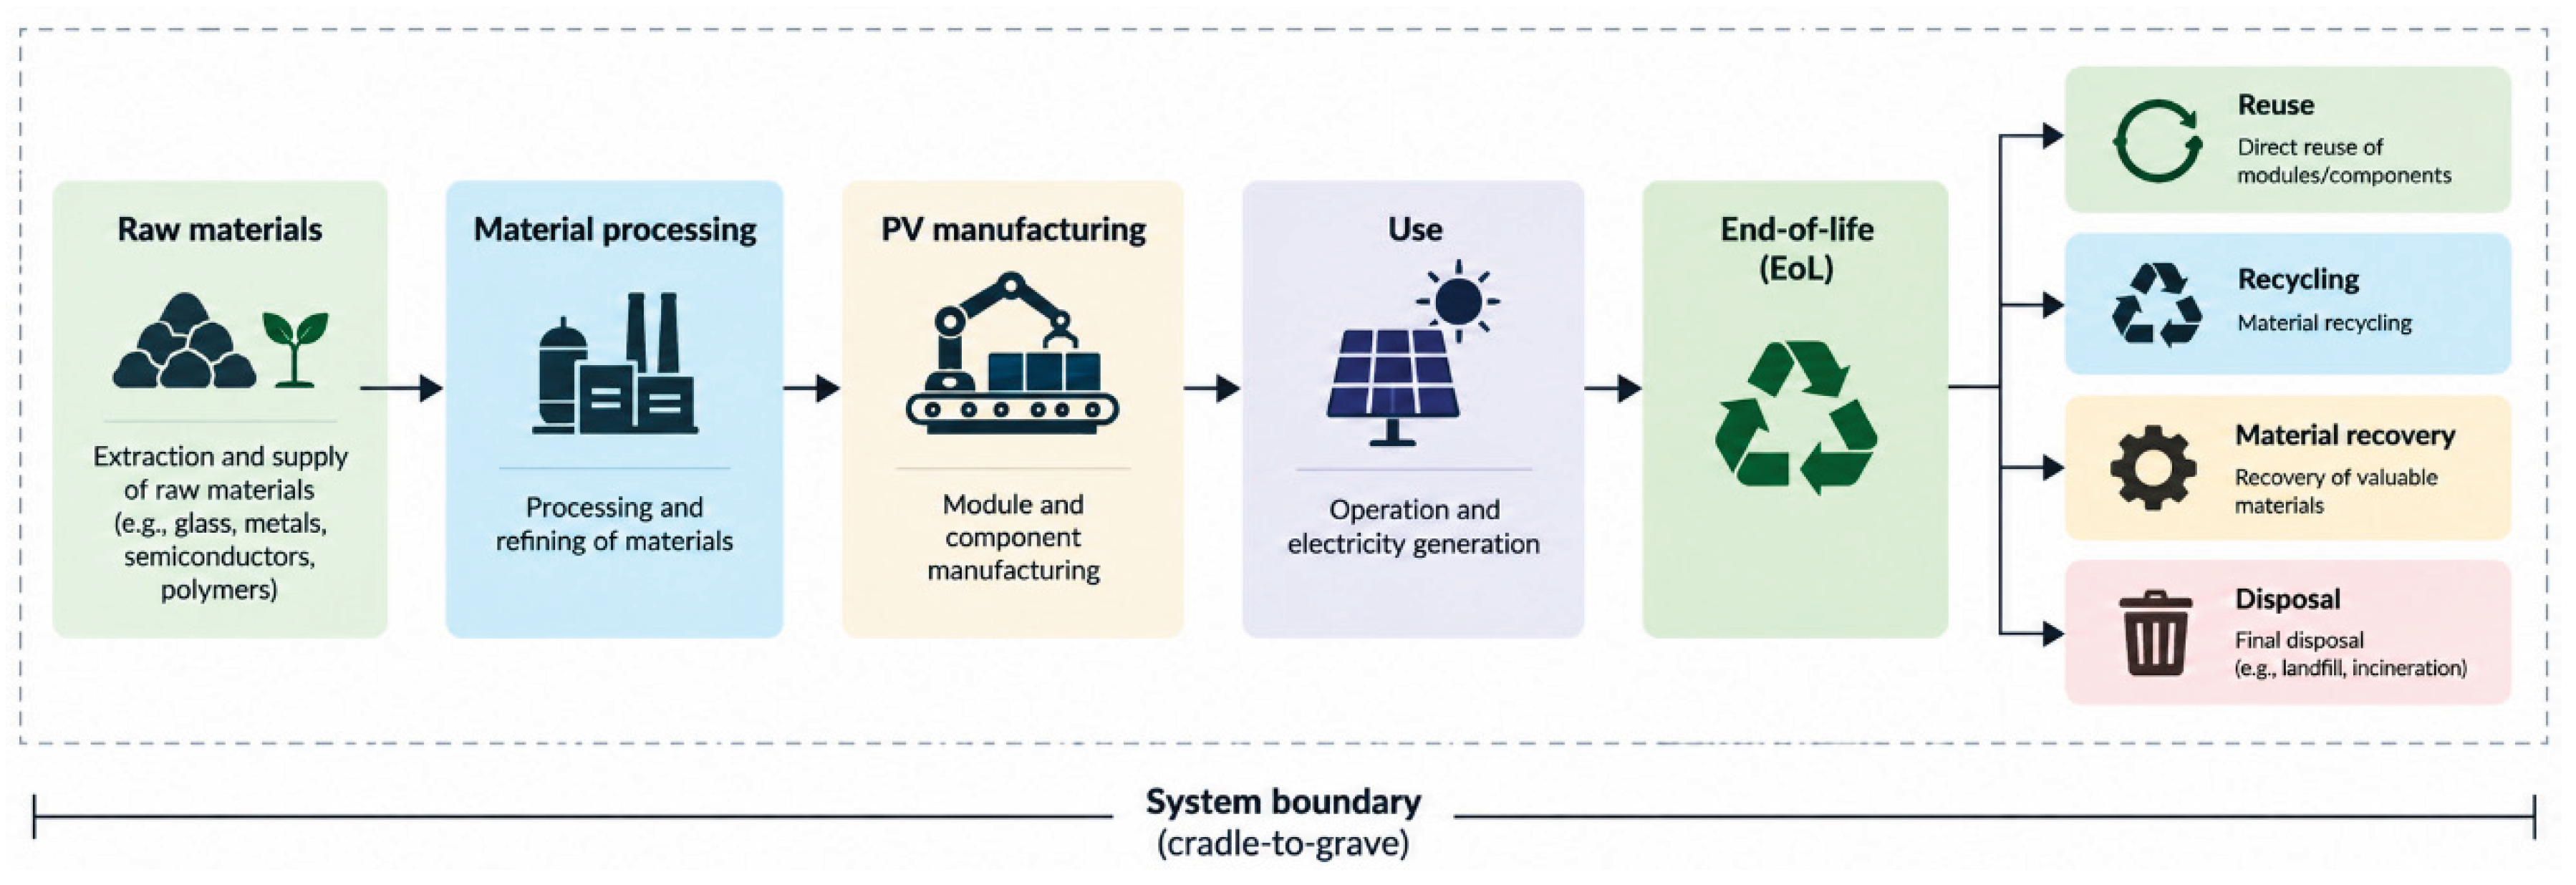
The system boundary encompasses the principal life-cycle stages associated with the two PV technologies, including raw-material requirements, module manufacturing, operation, and EoL management. For the production stage, the analysis includes the material and energy inputs represented in the respective inventories. The use phase accounts for the available operational data per square metre, while the EoL stage considers the quantitative distribution of module materials among the applicable management routes.
Figure 1.
System boundaries considered in the comparative life cycle assessment of the PSC and conventional Si PV systems.
Figure 1.
System boundaries considered in the comparative life cycle assessment of the PSC and conventional Si PV systems.
2.4. Life Cycle Inventory
The LCI was developed separately for the PSC and conventional silicon (Si) PV systems to ensure a consistent comparison between the two technologies. The inventory was established on a functional basis of 1 m² of PV system and included the material and energy inputs associated with module production, production-related outputs and waste streams, the main operational parameters during the use phase, and the material flows considered at EoL [23,24].
For solid layers and components whose inventory quantities were derived from their physical characteristics, the material mass per unit area was calculated according to Equation (1):
where m is the material mass, A is the surface area (1 m²), t is the layer thickness, and ρ is the material density. This calculation approach was applied to the active and supporting layers of the PV systems, together with literature-derived inventory data and manufacturing assumptions [25,26].
m = A × t × ρ,
Overall, the two inventories reflect fundamentally different manufacturing profiles. The silicon PV system is characterized by comparatively larger quantities of bulk structural and semiconductor materials and higher electricity consumption during production, whereas the PSC system relies on substantially thinner active layers but involves a broader range of precursor chemicals and organic solvents, as well as lead-containing compounds. These differences in inventory composition form the basis for the subsequent comparative LCIA [25,27,28].
2.4.1. PSC Production Inventory
For the PSC system, the mass of the perovskite active layer was estimated using a representative layer thickness of 500 nm and a density of 4.16 × 10⁶ g m⁻³ [25,27]. For an area of 1 m², this resulted in a calculated active-layer mass of (Equation 2):
m = 1 × (500 × 10−9) × 4.16 × 106 = 2.08 gm−2,
The masses of the remaining solid layers were determined following the same area–thickness–density principle where applicable. The PSC production inventory additionally accounted for the use of solvents and auxiliary chemicals required during cell fabrication. This consideration is particularly relevant for solution-based deposition processes, where the quantity of solvent introduced during processing can substantially exceed the amount ultimately retained in the deposited layer. Laboratory-scale processes, such as spin coating, may involve high material and solvent losses, whereas industrial-scale deposition is expected to achieve substantially lower losses through improved material utilization [23,25,29].
The resulting PSC inventory includes the conductive and protective glass substrates, encapsulation material, metallic electrode, precursor chemicals, charge-transport materials, solvents, electricity consumption, atmospheric solvent emissions, and production-related solid and chemical waste streams. The complete foreground inventory used in the OpenLCA model is reported in Table S1 [27,28].
2.4.2. Silicon PV Production Inventory
The silicon PV inventory was developed using the same area-based approach. For the silicon wafer, an initial mass was estimated using a representative thickness of 180 μm and a silicon density of 2.33 × 10⁶ g m⁻³ (Equation 3) [26,30].
m = 1 × (180 × 10−6) × 2.33 × 106 = 419.4 gm−2,
For the OpenLCA inventory, a value of 450 g m⁻² was adopted to account for additional manufacturing losses. Material losses associated with silicon PV production were also considered, particularly those generated during wafer cutting. Such kerf-related losses increase the amount of silicon required relative to the quantity ultimately incorporated into the finished PV module [26,30].
The silicon PV production inventory includes solar glass, the aluminium frame, EVA encapsulation, polymer backsheet, solar-grade silicon, silver and aluminium contacts, auxiliary processing materials, electricity consumption, and production-related waste streams. The complete inventory used in the OpenLCA model is provided in Table S2 [31,32].
2.4.3. Use-Phase Inventory
Operational data were incorporated into the LCI to account for differences in conversion efficiency, expected service life, and electricity generation between the two technologies. Both systems were evaluated assuming annual solar irradiation of 1700 kWh m⁻² year⁻¹. Conversion efficiencies of 22% for PSC and 21% for Si PV resulted in annual electricity generation values of 374 and 357 kWh m⁻² year⁻¹, respectively. The assumed operational lifetimes were 15 years for PSC and 30 years for Si PV, corresponding to lifetime electricity generation of 5610 and 10,710 kWh m⁻², respectively (Table 2) [33,34,35,36].
Neither system was assumed to consume fuel or generate direct emissions during operation, while maintenance requirements were considered low. Electricity generation during the use phase was therefore primarily determined by solar irradiation, conversion efficiency, and the assumed operational lifetime [32].
2.4.4. End-of-Life Inventory
EoL inventories were developed separately for the two PV technologies to reflect differences in material composition and applicable management pathways. The inventories specify the quantitative distribution of constituent materials and their assigned treatment routes, including recycling, reuse, material recovery, and disposal where applicable [33,34,35,36]. The complete EoL inventories incorporated into the models are provided in Table S3 and Table S4 for PSC and Si PV, respectively.
2.5. Life Cycle Impact Assessment
Environmental impacts were calculated in OpenLCA using two Life Cycle Impact Assessment (LCIA) methodologies: ReCiPe 2016 Midpoint (H) and CML-IA Baseline. The use of two methodologies was intended to provide complementary perspectives on the environmental performance of the PV systems and to assess whether the comparative conclusions remained consistent across different impact-assessment approaches. The ReCiPe results include global warming–human health, fossil resource scarcity, stratospheric ozone depletion, mineral resource scarcity, and land use; the CML results include GWP100a, photochemical oxidation, terrestrial ecotoxicity, abiotic depletion–fossil fuels, and freshwater aquatic ecotoxicity. The LCIA methods, selected impact categories, and corresponding units used in the environmental assessment are summarized in Table S5 (Supplementary Materials).
2.6. End-of-Life Assessment
The EoL assessment considered material-specific management pathways for the constituent materials of the PSC and conventional Si PV systems. The modeled pathways included recycling, material recovery, energy recovery, specialized treatment, and recovery/disposal, depending on the characteristics and potential recoverability of each material. Such material-specific modelling is important in PV LCA because the treatment of glass, metals, semiconductor materials, and polymeric components can substantially influence the environmental performance attributed to the EoL stage [13].
The material quantities considered at EoL were derived from the corresponding production inventories, assuming that the modeled module constituents enter the EoL stage at the end of the assumed service life. Consequently, the EoL inventories were defined consistently with the material composition adopted for the production stage rather than being introduced as an independent material inventory.
For the PSC system, particular attention was given to the management of the lead-containing fraction because appropriate EoL treatment is required to limit potential lead release and enable recovery of valuable module constituents [33,34,35,36]. Glass was assigned to recycling, Au and TiO₂ to material recovery, EVA to recovery/disposal, PbI₂ to specialized treatment, and Spiro-OMeTAD to specialized waste management. For the conventional Si PV system, glass and Al were assigned to recycling, Si and Ag to material recovery, EVA to recovery/disposal, and the Tedlar/PET backsheet to energy recovery. The principal material quantities and EoL management routes considered in the models are summarized in Table 4. The complete EoL inventories and rationale for the assigned management routes are provided in Table S3 and Table S4 of the Supplementary Materials.
2.7. Techno-Economic Considerations
The comparative evaluation considered key parameters relevant to the technological and commercial viability of the two PV technologies, including conversion efficiency, operational lifetime, production cost, stability and reliability, manufacturing maturity, recycling requirements, and commercial scalability. The parameters considered in the techno-economic comparison are summarized in Table 5. Because these indicators were derived from heterogeneous literature sources and were not based on a harmonized cost model, they were used to contextualize the LCA findings rather than being integrated into the quantitative environmental scoring.
2.8. Multi-Criteria Environmental Decision-Support Framework
To complement the LCA results and facilitate an integrated comparison of the two PV technologies, a Multi-Criteria Decision Analysis (MCDA) framework was applied. The integration of LCA and MCDA provides a structured approach for comparing alternatives when their environmental performance differs across multiple impact categories, while normalization and weighting enable indicators expressed in different units to be combined within a common decision framework [37,38,39]. Normalization is particularly important in multi-attribute decision models because the criteria may be expressed using different units and numerical scales [37,40].
In the present study, the alternatives were PSC and crystalline Si PV systems, while the environmental impact indicators obtained from the LCIA constituted the decision criteria. Because the selected environmental indicators represent burdens rather than benefits, all criteria were treated as cost criteria, for which lower values indicate better environmental performance. A linear normalization approach was therefore applied. For each alternative i and environmental criterion j, the normalized performance was calculated as [Eq.4]:
where rᵢⱼ is the normalized performance of alternative i for criterion j, xᵢⱼ is its original LCIA result, and xⱼ,min is the minimum value observed among the alternatives for criterion j. With this formulation, the alternative exhibiting the lowest environmental burden for a given criterion receives a normalized value of 1, whereas alternatives with higher impacts receive values below 1. This type of linear normalization for cost criteria is established in MCDA applications and enables indicators with different units to be transformed to a dimensionless and comparable scale [41].
rᵢⱼ = xⱼ,min / xᵢⱼ,
The normalized environmental performances were subsequently aggregated using a Simple Additive Weighting (SAW) approach. SAW is one of the established multi-attribute decision-making approaches and combines normalized criterion values with their respective weights through additive aggregation [37,41]. Pizzol et al. [37] specifically identify SAW as a widely used multi-attribute decision approach in the context of LCA weighting.
Because no stakeholder-derived, policy-based, or empirically elicited preference structure was available for assigning different levels of importance to the selected environmental criteria, an equal-weight baseline was adopted. Equal weighting is an established weighting option in LCA and decision-support applications, but it represents a value choice and should therefore be explicitly reported [37,38]. The JRC Environmental Footprint weighting work has also applied equal weighting following characterization and normalization, assigning the same importance to each environmental impact category [38].
Accordingly, the weight assigned to each criterion was calculated as (Eq. 5):
where wⱼ is the weight assigned to criterion j and n is the total number of environmental criteria included in the decision analysis. The weights therefore satisfy (Eq.6):
wⱼ = 1 / n,
Σⱼ₌₁ⁿ wⱼ = 1,
The overall environmental performance score of each alternative was then calculated through weighted additive aggregation (Eq.7):
where Sᵢ is the aggregated environmental performance score of alternative i. Higher values of Sᵢ indicate better overall relative environmental performance because higher normalized values correspond to lower environmental burdens. Weighted summation is consistent with the SAW principle, in which the normalized performances of an alternative are multiplied by criterion weights and subsequently summed to obtain an overall preference score [37,41].
Sᵢ = Σⱼ₌₁ⁿ wⱼrᵢⱼ,
For ease of interpretation and communication, the resulting score was finally expressed on a 0-100 scale:
where DSSᵢ is the environmental Decision-Support Score of alternative i. A higher DSS therefore represents a more favorable overall environmental profile under the selected criteria and weighting assumptions. The DSS is intended as a decision-support indicator rather than a replacement for the disaggregated LCIA results, since normalization and weighting can influence the interpretation and ranking of alternatives and necessarily involve methodological and/or value choices [37,38,39,40]. Consequently, the individual LCIA results remain the primary basis for identifying environmental trade-offs between the PSC and Si PV systems.
DSSᵢ = 100 × Sᵢ,
To examine the robustness of the resulting ranking, a sensitivity analysis was performed by varying the weighting assumptions and recalculating the aggregated scores. Sensitivity testing of weighting and normalization assumptions is recommended because alternative weighting schemes or normalization procedures may influence MCDA rankings [40,41]. In the present study, the sensitivity analysis focused specifically on the weighting structure, while the normalization procedure was maintained unchanged across all scenarios. The stability of the ranking across the tested scenarios was used to evaluate whether the comparative conclusion depended strongly on the adopted weighting structure.
2.9. Decision Scenarios and Sensitivity Analysis
To evaluate whether the comparative environmental performance of the PSC and Si PV systems was robust to changes in decision priorities, a scenario-based sensitivity analysis was incorporated into the decision-support framework. This analysis examined how alternative assumptions regarding the relative importance of environmental criteria influenced the aggregated Decision-Support Score (DSS) and the resulting ranking of the two PV technologies. Sensitivity analysis is particularly relevant when weighting is applied, since weighting factors reflect value choices and changes in their relative magnitude may affect the ranking of alternatives [37,38,39].
Four decision-priority scenarios (SCs) were defined (Table 6). SC1 represents a balanced environmental perspective in which all five selected impact criteria receive equal weights. The remaining scenarios represent hypothetical shifts in environmental priorities. SC2 places greater emphasis on climate-related impacts, SC3 prioritizes resource-related impacts, and SC4 gives greater importance to pollution- and ecosystem-related impacts. These scenarios are not intended to represent empirically elicited stakeholder preferences. Rather, they constitute hypothetical decision-priority scenarios developed specifically to test the sensitivity and robustness of the comparative assessment. This approach is consistent with the recognition that weighting in LCA reflects value choices and may vary according to the objectives and priorities of the decision context [37,38,39].
For SC1, equal weighting was applied according to Equation (5), such that each of the five environmental criteria received a weight of 0.20. Equal weighting provides a transparent baseline against which the effects of alternative priority structures can be evaluated [37,38].
For SC2–SC4, the baseline weight of each criterion associated with the corresponding strategic priority was increased by 50%, while the baseline weights of the remaining criteria were retained. The resulting weights were subsequently renormalized so that their sum remained equal to 1. A 50% perturbation was selected as a moderate sensitivity case within the range of weighting perturbations previously applied in environmental MCDM sensitivity analysis [40]. The scenario-specific normalized weights were calculated according to Equation (9):
where w*ⱼ,ₛ is the normalized weight assigned to criterion j under scenario s, wⱼ is the baseline weight of criterion j, and αⱼ,ₛ is the scenario-specific perturbation factor. A value of αⱼ,ₛ = 1.5 was assigned to criteria belonging to the corresponding priority group, whereas αⱼ,ₛ = 1.0 was assigned to all remaining criteria. The complete criterion-to-scenario allocation and resulting weights for both LCIA methods are provided in Table S8 of the Supplementary Materials.
w*ⱼ,ₛ = (αⱼ,ₛ wⱼ) / Σₖ₌₁ⁿ (αₖ,ₛ wₖ),
The underlying LCIA results, normalization procedure, and aggregation method were maintained unchanged across all scenarios. Thus, only the weighting structure was varied to examine the influence of alternative environmental priorities on the resulting DSS values. ReCiPe 2016 and CML-IA Baseline were evaluated independently, consistent with the methodological approach described in Section 2.8.
For each scenario s, the scenario-specific Decision-Support Score was calculated according to Equation (10):
where DSSᵢ,ₛ is the Decision-Support Score of technology i under scenario s, w*ⱼ,ₛ is the normalized weight assigned to criterion j under scenario s, and rᵢⱼ is the normalized environmental performance calculated according to Equation (4).
DSSᵢ,ₛ = 100 × Σⱼ₌₁ⁿ w*ⱼ,ₛrᵢⱼ,
Sensitivity was assessed by comparing the resulting DSS values and the relative ranking of PSC and conventional Si PV across the four scenarios. Particular attention was given to ranking stability, i.e., whether changes in environmental priorities altered the relative ordering of the two technologies. This approach enables assessment of whether the comparative outcome remains stable under alternative weighting assumptions rather than relying exclusively on the equal-weight baseline [37,38,39].
3. Results
3.1. Comparative Environmental Performance of PSC and Si PV
The comparative LCIA results obtained for the PSC and conventional Si PV systems are presented in Table 7. The assessment revealed substantial differences between the two technologies, with the magnitude and direction of the differences depending on the environmental impact category considered. Under ReCiPe 2016, the PSC system exhibited lower impacts for global warming-human health and fossil resource scarcity, whereas higher impacts were obtained for stratospheric ozone depletion, mineral resource scarcity, and land use. The complete ReCiPe 2016 results are provided in Table S6 of the Supplementary Materials and additionally show lower impacts for PSC than for Si PV in several other categories, including freshwater ecotoxicity, freshwater eutrophication, human toxicity, ionizing radiation, terrestrial acidification, and water consumption.
A similar mixed pattern was observed using CML-IA Baseline. The PSC system showed substantially lower impacts for global warming potential, abiotic depletion of fossil fuels, and freshwater aquatic ecotoxicity. Conversely, considerably higher impacts were observed for photochemical oxidation and terrestrial ecotoxicity. The complete CML-IA Baseline results are provided in Table S7 of the Supplementary Materials. Overall, the results indicate that the environmental advantages of PSCs are particularly pronounced for energy- and climate-related indicators, while trade-offs remain for specific toxicity-, resource-, and other environmental impact categories.
For a direct quantitative comparison, the relative difference between PSC and Si PV was calculated according to Equation (11):
where Δⱼ represents the percentage difference for impact category j. Negative values indicate a lower environmental impact for PSC relative to Si PV, whereas positive values indicate a higher impact.
Δⱼ = [(ImpactPSC,j − ImpactSi,j) / ImpactSi,j] × 100,
The selected ReCiPe 2016 indicators reveal substantial differences between the two technologies. PSC exhibited 57.04% and 48.53% lower impacts for global warming–human health and fossil resource scarcity, respectively. Conversely, higher impacts were observed for stratospheric ozone depletion (+132.50%), mineral resource scarcity (+22.06%), and particularly land use (+754.03%).
The CML-IA Baseline results showed a similar combination of environmental advantages and trade-offs. PSC exhibited 57.35% lower global warming potential, 53.41% lower abiotic depletion of fossil fuels, and 54.02% lower freshwater aquatic ecotoxicity than conventional Si PV. In contrast, photochemical oxidation was substantially higher for PSC (+5747.52%), while terrestrial ecotoxicity increased by 731.95%. Therefore, neither LCIA method indicates a uniform environmental advantage for one photovoltaic technology across all selected impact categories. Instead, the results demonstrate category-specific trade-offs that require consideration when interpreting the overall environmental performance.
To facilitate comparison across impact categories with different units and numerical scales, Figure 2 expresses the PSC results relative to conventional Si PV, which was set to 100% within each impact category.
3.2. Environmental Hotspots and Life-Cycle Contributions
The comparative LCIA results reveal distinct environmental hotspots for the two photovoltaic technologies. For PSC, the principal environmental trade-offs among the selected indicators were associated with photochemical oxidation, terrestrial ecotoxicity, land use, stratospheric ozone depletion, and mineral resource scarcity. Conversely, conventional Si PV exhibited substantially higher impacts for climate- and fossil-resource-related indicators. These differences reflect the contrasting energy and material requirements incorporated into the life-cycle inventories of the two technologies.
The lower climate-related impact of PSC was consistently identified by both LCIA methods. Global warming–human health under ReCiPe 2016 was 57.04% lower for PSC, while GWP100a under CML-IA was 57.35% lower. This result is consistent with the substantially lower manufacturing electricity requirement considered in the PSC inventory (35 kWh m⁻²) compared with conventional Si PV production (85 kWh m⁻²). Energy consumption during PV manufacturing can substantially influence life-cycle greenhouse gas emissions, particularly for energy-intensive material-processing and manufacturing stages [42].
A similar pattern was observed for fossil-resource-related impacts. PSC exhibited a 48.53% lower fossil resource scarcity impact under ReCiPe 2016 and a 53.41% lower abiotic depletion of fossil fuels under CML-IA. The consistency of this result across the two LCIA methods indicates that the different energy requirements of the modeled production systems constitute an important factor in their comparative environmental performance. The lower electricity demand incorporated into the PSC production inventory reduces the associated upstream energy-related resource requirements.
However, the lower energy-related burdens of PSC were accompanied by pronounced environmental trade-offs in other impact categories. Under ReCiPe 2016, land use represented the largest relative disadvantage among the selected indicators, with the PSC impact being 754.03% higher than that of conventional Si PV. PSC also exhibited higher impacts for stratospheric ozone depletion (+132.50%) and mineral resource scarcity (+22.06%). These results demonstrate that improvements in energy-related indicators do not necessarily result in superior performance across resource- and ecosystem-related impact categories.
The CML-IA results revealed particularly pronounced differences for photochemical oxidation and terrestrial ecotoxicity. The photochemical oxidation impact of PSC was 0.401954 kg C₂H₄ eq compared with 0.00687392 kg C₂H₄ eq for Si PV, corresponding to an increase of 5747.52%. Terrestrial ecotoxicity was also substantially higher for PSC (+731.95%). These categories therefore represent important environmental hotspots requiring further consideration in the environmental optimization of PSC manufacturing.
The composition of the PSC production inventory provides important context for interpreting these results. In addition to glass and metallic constituents, PSC manufacturing involves PbI₂, MAI, Spiro-OMeTAD, and TiO₂, together with solvents such as chlorobenzene, DMF, DMSO, and IPA. Previous environmental assessments of perovskite photovoltaics have identified material selection, solvent use, electrode materials, and the presence of lead-containing compounds as potentially important contributors to their environmental performance [11].
Nevertheless, the present analysis does not quantitatively allocate the observed impacts to individual inventory inputs. Consequently, the higher photochemical oxidation, terrestrial ecotoxicity, land use, and ozone-depletion results should not be attributed to any single material or process without a dedicated contribution analysis.
The complete LCIA profiles reported in Table S6 and Table S7 further demonstrate that the comparative environmental performance extends beyond the indicators selected for the decision-support framework. Under ReCiPe 2016, PSC exhibited lower impacts for most of the assessed categories, including fine particulate matter formation, freshwater ecotoxicity, freshwater eutrophication, global-warming-related ecosystem impacts, human carcinogenic and non-carcinogenic toxicity, ionizing radiation, marine ecotoxicity, terrestrial acidification, terrestrial ecotoxicity, and water consumption. Higher PSC impacts were observed for marine eutrophication, ozone formation, land use, mineral resource scarcity, and stratospheric ozone depletion. Similarly, the complete CML-IA profile showed lower PSC impacts for most categories, while photochemical oxidation and terrestrial ecotoxicity constituted notable exceptions.
Overall, the hotspot assessment identifies a trade-off between the lower energy-related burdens of PSC manufacturing and higher impacts in specific environmental categories. The reduced manufacturing electricity demand contributes to the favorable performance of PSC in climate- and fossil-resource-related indicators, whereas its material and chemical requirements warrant particular attention in categories where higher impacts were observed. Further environmental optimization of PSC technology should therefore address not only manufacturing energy demand but also material selection, solvent management, resource requirements, and the management and recovery of potentially hazardous or valuable constituents.
3.3. End-of-Life and Circularity Implications
The EoL assessment highlights important differences between the two PV technologies in terms of material recovery potential and waste-management requirements. For the PSC system, the modeled EoL routes include recycling of the glass fraction, material recovery of Au and TiO₂, recovery or disposal of EVA, and specialized treatment of PbI₂ and Spiro-OMeTAD (Table S3). For conventional Si PV, the modeled routes include recycling of glass and aluminum, material recovery of silicon and silver, recovery or disposal of EVA, and energy recovery from the polymeric backsheet (Table S4). These pathways reflect the different material compositions of the two systems and consequently their different requirements for circular end-of-life management.
For the PSC system, glass represents the largest material fraction considered at EoL (5000 g m⁻²) and was assigned to recycling. The recovery of valuable constituents, particularly the metallic electrode material, also represents an opportunity for reducing losses of high-value resources. However, the presence of PbI₂ introduces an additional environmental management requirement. Although its mass contribution is relatively small (1.8 g m⁻²), the lead-containing fraction requires controlled treatment to avoid potential releases during dismantling, recycling, or disposal. Appropriate collection and treatment systems are therefore particularly important for translating the potential environmental advantages of PSC technology into improved life-cycle performance.
The conventional Si PV system presents a different EoL profile. Its principal material fractions include glass (7500 g m⁻²), aluminum (1200 g m⁻²), EVA (1100 g m⁻²), silicon (450 g m⁻²), backsheet material (350 g m⁻²), and silver (8 g m⁻²). Glass and aluminum were assigned to recycling, while silicon and silver were considered for material recovery. Compared with emerging PSC technologies, conventional Si PV benefits from more established recycling approaches and a material composition dominated by fractions for which recovery routes are comparatively well developed [43].
The comparison also illustrates that circularity cannot be assessed solely on the basis of the total quantity of material potentially recoverable. The environmental relevance of individual fractions depends on their material value, resource criticality, potential toxicity, and treatment requirements. For PSCs, recovery strategies should therefore simultaneously address valuable materials and the safe management of lead-containing components. Recycling approaches reported for perovskite photovoltaics increasingly focus on recovering substrates and electrode materials, managing Pb-containing fractions, and enabling reuse or recycling of selected module constituents [44].
These EoL considerations are particularly relevant when interpreting the environmental results presented in Section 3.1 and Section 3.2. The lower climate- and fossil-resource-related impacts observed for PSC cannot be considered independently of the EoL system required to manage its material composition. Inadequate treatment of lead-containing and organic fractions could introduce environmental burdens that are not adequately represented by considering manufacturing impacts alone. Conversely, effective recovery and recycling could reduce demand for virgin materials and support more circular material flows in future PSC production.
The EoL comparison indicates that PSC commercialization should be accompanied by the development of dedicated collection, separation, recovery, and safe-treatment strategies. While conventional Si PV can rely on comparatively established recycling pathways for major fractions such as glass, aluminum, silicon, and silver, PSC technology requires EoL systems adapted to its specific material composition, particularly its lead-containing and organic constituents. Consequently, the long-term environmental performance of PSC technology will depend not only on improvements in manufacturing efficiency and operational stability but also on the development of effective circular management strategies that retain valuable materials while preventing the release of hazardous constituents.
3.4. Techno-Economic and Commercialization Implications
The environmental performance of the two PV technologies should be interpreted in conjunction with the technological and commercial parameters summarized in Table 5. Although PSC exhibited advantages in several environmental impact categories, particularly those associated with climate change and fossil-resource use, these benefits must be considered alongside operational lifetime, stability, reliability, manufacturing maturity, recycling requirements, and scalability. The present assessment does not constitute a full techno-economic analysis; rather, these parameters are used to place the environmental findings within the broader context of technological development and potential commercialization.
The modeled PSC system exhibited a slightly higher conversion efficiency than conventional Si PV, at 22% compared with 21%. Under the irradiation conditions considered in this study (1700 kWh m⁻² year⁻¹), the corresponding annual electricity generation was 374 kWh m⁻² year⁻¹ for PSC and 357 kWh m⁻² year⁻¹ for Si PV. However, the assumed operational lifetime differed substantially between the two systems. Based on lifetimes of 15 years for PSC and 30 years for Si PV, cumulative electricity generation was estimated at 5610 kWh m⁻² and 10,710 kWh m⁻², respectively. Thus, the slightly higher conversion efficiency assumed for PSC does not compensate for its shorter modeled service life in terms of cumulative electricity generation.
Operational lifetime consequently emerges as an important parameter in the transition of PSC technology toward commercial deployment. Extending module lifetime while maintaining high conversion efficiency would increase the amount of electricity generated over the service life and distribute the environmental burdens associated with module production over a larger cumulative energy output. Improvements in long-term stability and durability are therefore closely linked to both the environmental and commercial performance of PSC technology [45].
Technological maturity further differentiates the two systems. Conventional Si PV is characterized by established manufacturing processes, demonstrated long-term reliability, large-scale production capacity, and comparatively mature recycling pathways. PSC technology remains at an earlier stage of industrial development, with long-term stability, reliability, manufacturing scale-up, and EoL management continuing to influence its progression toward widespread commercial application [46]. The environmental advantages identified for PSC in selected impact categories should therefore be interpreted in relation to the technological development still required to achieve durable and reliable operation at industrial scale.
Production cost represents an additional consideration for the commercialization of PSC technology. PSCs may offer cost-reduction potential through comparatively low-temperature processing, reduced material requirements, and manufacturing routes compatible with scalable production [47]. However, reported cost estimates vary considerably depending on production scale, device architecture, manufacturing route, system boundaries, and assumptions regarding technological maturity. As a detailed cost inventory was not developed within the present study, production costs were not quantified or incorporated into the comparative assessment. They are therefore considered only qualitatively as part of the broader commercialization context.
EoL requirements introduce an additional commercialization consideration. Conventional Si PV can draw on comparatively established recovery routes for major material fractions, whereas PSC requires recycling strategies capable of combining material recovery with appropriate management of Pb-containing and organic constituents. Development of technically effective and scalable recycling systems will therefore be necessary alongside advances in module stability and manufacturing scale-up [48].
Taken together, the comparison highlights operational lifetime as a particularly influential parameter for PSC development. Under the assumptions applied in this study, the 15-year PSC system generates 5610 kWh m⁻² over its modeled lifetime, corresponding to approximately 52.4% of the 10,710 kWh m⁻² generated by the 30-year Si PV system. This difference is primarily attributable to the assumed service lives rather than conversion efficiency, as PSC exhibits a slightly higher efficiency (22%) than Si PV (21%). The comparison therefore illustrates the importance of extending PSC operational lifetime: improvements in durability would allow its higher conversion efficiency to be maintained over a longer period and would distribute production-related environmental burdens over a greater cumulative electricity output. Consequently, advances in service life, together with improved stability, scalable manufacturing, and effective EoL management, are important for translating the environmental advantages identified for PSC in climate- and fossil-resource-related impact categories into life-cycle benefits under commercially relevant operating conditions.
3.5. Environmental Decision-Support and Sensitivity Analysis
The normalized environmental performance of PSC and conventional Si PV under the baseline equal-weighting scenario (SC1) is presented in Table 8. ReCiPe 2016 and CML-IA Baseline were evaluated independently, with five selected environmental criteria considered within each LCIA method. According to the cost-criterion normalization applied in Equation (4), the technology exhibiting the lower environmental burden in each criterion received a normalized value of 1, while the alternative received a value below 1.
Under ReCiPe 2016, PSC achieved the maximum normalized performance for global warming–human health and fossil resource scarcity, whereas conventional Si PV achieved the maximum value for stratospheric ozone depletion, mineral resource scarcity, and land use. The particularly low normalized PSC value for land use (0.1171) reflects the pronounced difference between the two technologies observed for this impact category. Under equal weighting, the resulting DSS was 67.33 for PSC and 78.88 for conventional Si PV.
Under CML-IA Baseline, PSC achieved the maximum normalized performance for global warming potential, abiotic depletion of fossil fuels, and freshwater aquatic ecotoxicity. Conventional Si PV performed better for photochemical oxidation and terrestrial ecotoxicity, resulting in normalized PSC values of only 0.0171 and 0.1202, respectively. Despite PSC exhibiting the lower environmental burden in three of the five selected CML-IA criteria, its baseline DSS was 62.75, compared with 67.05 for conventional Si PV. This result demonstrates that the aggregated score reflects not only the number of criteria favoring each technology but also the relative magnitude of the normalized differences.
The sensitivity analysis was subsequently applied using the four decision-priority scenarios defined in Section 2.9. Table 9 presents the resulting DSS values. The complete criterion-specific weighting factors used in these calculations are reported in Table S8.
The ReCiPe 2016 assessment exhibited stable ordering across all four scenarios. Conventional Si PV retained the higher DSS under the balanced scenario and under each alternative priority structure. Increasing the importance of climate-related impacts reduced the difference between the technologies, with the PSC score increasing from 67.33 to 70.30 and the Si PV score decreasing from 78.88 to 75.62. Resource prioritization also improved the relative position of PSC, although Si PV retained the higher score. In contrast, the pollution- and ecosystem-priority scenario increased the separation between the technologies, producing DSS values of 60.67 for PSC and 82.40 for Si PV.
A different response was observed under CML-IA Baseline. The relatively small baseline difference between PSC (62.75) and Si PV (67.05) was reversed when greater importance was assigned to climate-related impacts. Under SC2, PSC achieved a DSS of 66.13 compared with 64.83 for Si PV. Resource prioritization produced a similar reversal, with DSS values of 66.13 and 65.19, respectively. In contrast, SC4 strongly favored the environmental profile of conventional Si PV within the selected criteria, with its DSS increasing to 70.50 while the PSC score decreased to 57.01.
The variation in DSS values across the four decision-priority scenarios is illustrated in Figure 3. The figure highlights the stability of the ReCiPe 2016 ordering and the greater sensitivity of the CML-IA Baseline results, for which the relative ordering of the two technologies changes under the climate- and resource-priority scenarios.
These results demonstrate that the decision-support outcome is more sensitive to weighting assumptions under CML-IA Baseline than under ReCiPe 2016. The ReCiPe ordering remained unchanged across the tested scenarios, whereas the CML-IA ordering changed under both climate and resource priorities. The result is particularly relevant because it shows that the aggregated comparison cannot be interpreted independently of the environmental priorities represented by the weighting structure. PSC becomes comparatively more favorable when greater emphasis is placed on the climate- and fossil-resource-related categories in which it exhibits lower impacts, whereas greater emphasis on pollution-, toxicity-, and ecosystem-related criteria strengthens the relative performance of conventional Si PV.
4. Discussion
4.1. Environmental Performance and Key Trade-Offs
The comparative assessment demonstrates that the environmental performance of PSC technology cannot be characterized by a uniform advantage or disadvantage relative to conventional Si PV. Instead, the results reveal a distinct trade-off between lower impacts in energy- and climate-related categories and higher burdens in selected resource-, toxicity-, and pollution-related categories. This finding is consistent with previous life-cycle studies showing that the environmental performance of perovskite photovoltaics is strongly dependent on device architecture, material composition, manufacturing energy requirements, operational lifetime, and the specific impact category considered [49,50]. In particular, early comprehensive LCA studies of perovskite photovoltaics identified their low manufacturing-energy requirements as an important environmental opportunity while simultaneously emphasizing the contribution of material selection, precious metals, and device lifetime to their life-cycle performance [49].
A particularly consistent result of the present assessment is the advantage of PSC in climate-related indicators. PSC exhibited a 57.04% lower impact for global warming–human health under ReCiPe 2016 and a 57.35% lower GWP100a under CML-IA Baseline. The close agreement between the two LCIA methods strengthens the interpretation that the modeled PSC system has a lower climate-related burden than the conventional Si PV system under the assumptions adopted in this study. This result can be principally related to differences in the production inventories, particularly the lower manufacturing electricity requirement considered for PSC (35 kWh m⁻²) compared with Si PV (85 kWh m⁻²). Previous LCA research has similarly identified the comparatively low energy demand of solution-processed perovskite technologies as a potential environmental advantage and has reported favorable energy-payback characteristics relative to established PV technologies [49].
The fossil-resource indicators reinforce this interpretation. PSC showed 48.53% lower fossil resource scarcity under ReCiPe 2016 and 53.41% lower abiotic depletion of fossil fuels under CML-IA Baseline. The consistency in both direction and magnitude across the two methods indicates that the modeled manufacturing-energy profile is an important differentiating factor between the technologies. Nevertheless, these advantages should be interpreted in relation to the assumed system configuration and electricity requirements rather than considered intrinsic properties of all PSC technologies. Published LCAs have demonstrated that PSC environmental performance can vary considerably according to device architecture, electrode selection, deposition route, material utilization, and production scale [49,50].
The results also demonstrate why climate-related indicators alone are insufficient for evaluating the sustainability of emerging PV technologies. PSC exhibited higher impacts for several selected ReCiPe categories, including stratospheric ozone depletion (+132.50%), mineral resource scarcity (+22.06%), and particularly land use (+754.03%). Under CML-IA, the differences were even more pronounced for photochemical oxidation (+5747.52%) and terrestrial ecotoxicity (+731.95%). The magnitude of these differences indicates that reductions in manufacturing energy demand do not automatically result in environmental improvement across all impact mechanisms. Previous sustainability assessments of PSCs have similarly emphasized that their environmental profile depends not only on energy consumption but also on the selection of active-layer materials, electrodes, solvents, transport layers, and other processing chemicals [11,49].
This consideration is particularly relevant to the PSC inventory evaluated here, which contains PbI₂, MAI, Spiro-OMeTAD, TiO₂, metallic electrode material, and several organic solvents, including chlorobenzene, DMF, DMSO, and IPA. Such inputs distinguish PSC manufacturing from the bulk-material and energy-intensive profile of conventional Si PV. Lead-containing perovskites warrant particular attention because the relatively small mass of Pb present in a module does not eliminate concerns regarding potential toxicity and release throughout the life cycle. The literature therefore emphasizes containment, encapsulation, recycling, and appropriate EoL management as important elements of environmentally responsible PSC development [11,51].
At the same time, the higher PSC impacts observed for individual categories should not be directly assigned to PbI₂, solvents, or any other specific inventory input without a process-level contribution analysis. The present study identifies environmental hotspots at the impact-category level but does not quantify the percentage contribution of each individual material or manufacturing process. Consequently, the pronounced photochemical oxidation and terrestrial ecotoxicity results should be regarded as priorities for further investigation rather than evidence that a particular chemical is solely responsible for the observed impacts. Future process-level contribution and uncertainty analyses would be valuable for determining which inventory flows dominate these categories and therefore where material substitution or process optimization could deliver the greatest environmental improvement.
The complete LCIA profiles further indicate that the selected indicators capture only part of the environmental comparison. PSC showed lower impacts than conventional Si PV in most of the complete ReCiPe 2016 and CML-IA categories evaluated, while a smaller number of categories exhibited substantial disadvantages. This combination is important because it demonstrates the distinction between the frequency and the magnitude of environmental advantages. A technology may perform better in a larger number of impact categories while still exhibiting pronounced burdens in a smaller number of categories. This pattern also helps explain the decision-support results obtained in Section 3.5, where equal weighting did not automatically favor the technology with the lowest impact in the greatest number of individual categories.
The use of two LCIA methods therefore provides an important methodological perspective. ReCiPe 2016 and CML-IA Baseline both identify clear PSC advantages for climate- and fossil-resource-related impacts, providing cross-method support for this aspect of the comparison. However, differences in the remaining impact categories demonstrate that conclusions regarding environmental superiority are sensitive to the environmental mechanism being considered and to the structure of the selected LCIA method. The environmental case for PSC should consequently be framed not as a universal reduction in life-cycle impacts, but as an opportunity to retain its lower-energy manufacturing profile while addressing material-, toxicity-, resource-, and pollution-related hotspots through targeted technological development.
4.2. Role of Lifetime, Stability, and End-of-Life Management
The environmental advantages associated with the comparatively low manufacturing-energy requirements of PSCs must be considered together with operational lifetime and long-term stability. In the present assessment, the PSC system was modeled with an operational lifetime of 15 years, compared with 30 years for conventional Si PV. Although the assumed PSC conversion efficiency was slightly higher (22% compared with 21%), the difference in service life resulted in substantially different cumulative electricity generation, corresponding to 5610 kWh m⁻² for PSC and 10,710 kWh m⁻² for Si PV. Consequently, improvements in PSC durability could substantially strengthen the life-cycle benefits associated with its lower manufacturing burden by distributing production-related impacts over a greater amount of electricity generated during the module lifetime. Previous assessments have similarly identified operational lifetime as a critical parameter governing the environmental and economic competitiveness of PSC technology [49,51].
Long-term stability therefore remains closely connected to the sustainability of PSC commercialization. Unlike conventional Si PV, for which long-term field operation and industrial manufacturing are well established, PSCs remain sensitive to degradation mechanisms associated with environmental and operational stressors. Exposure to moisture, oxygen, heat, and illumination, together with intrinsic processes such as ion migration and interfacial degradation, can adversely affect long-term device performance [51,52]. Recent reviews consequently identify stability improvement and lifetime extension as central requirements for the transition of PSCs from high-efficiency laboratory devices toward commercially viable photovoltaic modules [51].
The relevance of lifetime extends beyond technical reliability. From a life-cycle perspective, changes in system lifetime and the resulting need for replacement can alter material and production requirements and, consequently, the overall environmental profile. More generally, comparative LCA studies demonstrate the importance of consistently defined system assumptions when evaluating alternative technological pathways [53]. For PV specifically, operational lifetime is a critical parameter because premature module replacement increases the production and material requirements associated with providing electricity over an equivalent long-term period [49,50,51].The assumed 15-year lifetime used in the present model should therefore not be interpreted as a fixed characteristic of PSC technology but as a scenario assumption representing the modeled system. Continued improvements in encapsulation, material composition, interfaces, and device architecture could extend operational stability and consequently alter the comparative environmental performance reported here. This relationship also highlights the importance of incorporating updated lifetime data into future PSC LCAs as the technology progresses toward industrial-scale production [51].
Lifetime extension, however, does not eliminate the need for effective EoL management. The material composition of PSCs creates specific circularity challenges and opportunities that differ from those of conventional Si PV. In the present model, the PSC EoL system includes recycling of glass, recovery of Au and TiO₂, and specialized management of PbI₂ and Spiro-OMeTAD. The lead-containing fraction is particularly important because inappropriate disposal or module damage may create pathways for Pb release. Accordingly, recent lifecycle reviews emphasize that stability, encapsulation, Pb-leakage mitigation, and recycling should be considered together when evaluating the long-term sustainability of PSC technologies [51].
At the same time, the presence of Pb should not be interpreted exclusively as an EoL liability, since appropriate recovery processes can transform a potentially hazardous waste fraction into a recoverable material stream. Binek et al. [34] demonstrated the selective dismantling of MAPbI₃-based PSCs and the recovery of PbI₂ for reuse in new devices. The same study also demonstrated repeated reuse of the conductive FTO/glass substrate without deterioration in device performance, illustrating the potential for recycling strategies to simultaneously reduce hazardous waste generation and preserve valuable module components [34]. Such approaches are particularly relevant for PSCs because circularity strategies can address both environmental-risk management and resource conservation.
More recent research has expanded this concept from the recovery of individual components toward closed-loop recycling of PSCs. Current approaches investigate recovery of transparent conductive substrates, metal electrodes, perovskite constituents, charge-transport layers, and processing solvents, with the objective of returning recovered materials to subsequent device production [54]. Closed-loop strategies could therefore reduce dependence on virgin materials and limit the generation of hazardous waste. Nevertheless, PSC recycling remains substantially less mature than the recycling infrastructure associated with conventional Si PV, and challenges remain regarding collection, separation, solvent use, recovery efficiency, scalability, and the economic feasibility of recycling processes [51,54].
The conventional Si PV system considered in this study presents a different circularity profile. Its major EoL fractions such as glass, aluminum, silicon, and silver, were assigned to recycling or material recovery, while the polymeric fractions were assigned to recovery/disposal or energy recovery. The comparatively mature status of Si PV provides an advantage in terms of established material-management pathways, whereas PSC technologies require recycling systems adapted to their multilayer architecture and specific chemical composition. Nevertheless, the relatively small quantities of several functional materials in PSCs do not diminish their importance, because EoL priorities depend not only on material mass but also on toxicity, economic value, resource availability, and recovery potential.
The interaction between lifetime and EoL management is therefore particularly important for the environmental development of PSC technology. Extending service life reduces the frequency of module replacement, while effective recovery can retain valuable materials and prevent uncontrolled release of hazardous constituents when modules ultimately reach EoL. These two strategies should not be considered independently: longer-lived modules with inadequate EoL management would not fully address the circularity challenge, while highly recyclable modules with insufficient operational stability could still require frequent replacement and additional manufacturing. Future PSC development should consequently pursue durability, encapsulation, material recovery, and recycling concurrently rather than treating them as separate technological objectives.
4.3. Implications of the Decision-Support and Sensitivity Analysis
The integration of the LCIA results within the decision-support framework provides an additional perspective on the environmental comparison of PSC and conventional Si PV. While the disaggregated LCIA results identify category-specific advantages and trade-offs, the DSS enables these heterogeneous indicators to be interpreted within a common multi-criteria structure. The purpose of this aggregation is not to replace the individual environmental indicators, but to examine how the comparative assessment changes when different environmental priorities are introduced. This distinction is important because normalization and weighting can influence the interpretation of LCA results and necessarily introduce methodological and value-based choices into the aggregation process [37,38]. Pizzol et al. [37], in particular, emphasize that weighting can support interpretation of multidimensional LCA results but that the underlying assumptions should be explicitly reported and considered when interpreting aggregated outcomes.
Under the equal-weight baseline scenario, conventional Si PV achieved a higher DSS than PSC under both LCIA methods. However, this result should not be interpreted as evidence of universal environmental superiority. As demonstrated by the individual LCIA results, PSC performs better in several categories, particularly those associated with climate change and fossil-resource consumption, whereas Si PV performs better in other categories. The aggregated DSS therefore reflects the combined effect of the normalized differences across the five selected criteria and the weights assigned to them. This illustrates one of the principal advantages of integrating LCA with MCDA: alternatives characterized by conflicting environmental performances can be evaluated within a transparent structure while retaining the possibility of examining the underlying criteria individually [40,41]. Similar LCA-MCDM frameworks have been applied in sustainability assessments to translate multiple environmental indicators into structured comparative information [40].
The sensitivity analysis provides a particularly important insight into the robustness of these aggregated results. Under ReCiPe 2016, conventional Si PV retained the higher DSS across all four scenarios, indicating that the relative ordering of the two technologies was stable under the tested +50% priority-weight perturbation. Nevertheless, the magnitude of the difference changed substantially according to the weighting structure. Prioritizing climate-related impacts reduced the difference between the technologies, while the resource-security scenario also improved the relative position of PSC. Conversely, emphasizing pollution- and ecosystem-related impacts increased the separation in favor of Si PV. The ReCiPe results can therefore be considered robust in terms of ordering under the specific weighting scenarios tested, although the relative distance between the alternatives remains sensitive to environmental priorities.
A different pattern emerged under CML-IA Baseline. The equal-weight scenario produced only a relatively small DSS difference between PSC and Si PV, and the ordering was reversed when climate-related impacts were prioritized. PSC achieved a DSS of 66.13 under SC2 compared with 64.83 for Si PV. A similar reversal occurred under the resource-security scenario, with corresponding DSS values of 66.13 and 65.19. In contrast, prioritization of pollution-, toxicity-, and ecosystem-related criteria produced a substantially higher DSS for Si PV. The CML-IA comparison is therefore more sensitive to changes in weighting assumptions than the ReCiPe comparison, demonstrating that the aggregated outcome depends not only on the environmental performance data but also on the decision priorities applied to those data.
This sensitivity has an important methodological implication. A single aggregated environmental score can conceal the trade-offs that determine the comparative performance of competing technologies. In the present case, PSC has pronounced advantages in climate- and fossil-resource-related indicators but substantial disadvantages in selected pollution- and toxicity-related categories. Changing the relative importance assigned to these criteria consequently changes the aggregated outcome under CML-IA. The reversals observed under SC2 and SC3 should therefore not be interpreted as inconsistencies in the environmental assessment; rather, they demonstrate the effect of explicitly changing the decision priorities applied to a multi-dimensional environmental problem. Previous MCDA studies similarly show that weighting structures can influence technology rankings and therefore use sensitivity analysis to assess whether conclusions remain stable when criterion priorities change [40,41].
The sensitivity analysis also strengthens the interpretation of the equal-weight baseline. Equal weighting provides a transparent reference case when no empirically elicited stakeholder preference structure is available, but it does not imply that all environmental impacts are intrinsically of equal importance [37,38]. The alternative scenarios demonstrate how the assessment changes when particular environmental objectives receive greater emphasis. In this sense, the DSS framework is better interpreted as a conditional decision-support tool than as an absolute sustainability ranking: its results indicate which technology presents the more favorable aggregated environmental profile under a specified set of criteria, normalization rules, and weighting priorities.
The use of a 50% weighting perturbation provides a moderate test of this conditionality. Sensitivity analyses in environmental MCDM have similarly examined the robustness of rankings by systematically modifying criterion weights and renormalizing the resulting weighting structures. For example, Ige et al. [40] tested weight perturbations of ±25%, ±50%, and ±75% in an integrated LCA–MCDM assessment, demonstrating how ranking stability can be evaluated across alternative weighting conditions. The present analysis applies the same general sensitivity principle through targeted environmental-priority scenarios rather than random perturbation of all criteria. This enables the sensitivity results to be interpreted in relation to explicit decision contexts—climate mitigation, resource security, and pollution and ecosystem protection.
The different behavior of the ReCiPe 2016 and CML-IA results further supports the decision to evaluate the two LCIA methods independently rather than combining their indicators into a single score. Although both methods consistently identify advantages for PSC in climate- and fossil-resource-related impacts, they represent environmental mechanisms through different sets of indicators. Combining the two sets could therefore introduce overlapping environmental information and make the resulting score more difficult to interpret. Maintaining separate DSS calculations preserves the methodological identity of each LCIA approach and, importantly, allows the sensitivity analysis to reveal whether the decision-support conclusion is consistent across alternative environmental assessment structures.
From a practical perspective, these findings suggest that technology development decisions should be linked explicitly to the environmental objectives being pursued. If climate mitigation and reduction of fossil-resource dependence constitute dominant priorities, the lower impacts of PSC in these categories become increasingly influential in the comparative assessment. If greater importance is assigned to pollution, toxicity, and ecosystem-related impacts, the environmental hotspots associated with the modeled PSC system become more influential. The decision-support framework therefore does not identify a universally preferable PV technology; instead, it makes explicit how the comparative environmental outcome depends on the priorities applied by the decision context. This transparency is particularly valuable for emerging technologies such as PSCs, for which technological development may progressively alter both the magnitude and distribution of life-cycle impacts.
4.4. Implications for PSC Commercialization and Sustainable Scale-Up
The transition of PSC technology from laboratory-scale devices to commercial PV modules will depend on whether its environmental advantages can be maintained as manufacturing is scaled up. The present results indicate that PSCs can offer substantial reductions in climate- and fossil-resource-related impacts under the modeled production conditions. However, commercialization requires simultaneous progress in operational stability, manufacturing reproducibility, material utilization, process safety, and EoL management. These requirements are closely interconnected because modifications introduced to improve efficiency or stability may also affect material demand, energy consumption, toxicity, production cost, and recyclability [51,55,56].
Manufacturing scale-up represents a particularly important opportunity for improving the environmental profile of PSCs. Laboratory fabrication frequently relies on processes such as spin coating, which can involve inefficient utilization of precursor solutions and solvents and may not be representative of future industrial production. Commercial development is instead expected to require scalable deposition techniques capable of producing large-area, uniform layers with high material utilization and reproducibility. Techniques including slot-die coating, blade coating, spray-based deposition, and printing have therefore received considerable attention as potential routes toward large-area PSC manufacturing [56]. The transition toward such processes could reduce material losses and improve production throughput, although the environmental benefits will ultimately depend on the specific process conditions, energy requirements, solvent systems, and achievable module performance [56,57]. More broadly, the life-cycle optimization of industrial processes requires consideration of material and energy efficiency, waste minimization, and opportunities for resource recovery and circular material flows [58]. These principles are particularly relevant to the scale-up of PSC manufacturing, where process design can influence both environmental performance and resource efficiency.
Material selection is equally important for sustainable scale-up. The present LCA indicates that the comparatively low manufacturing-energy requirement of the modeled PSC system does not prevent substantial burdens from arising in selected impact categories. Future process optimization should therefore consider environmental performance alongside PV efficiency when selecting electrodes, transport layers, perovskite precursors, solvents, and encapsulation materials. Previous assessments have shown that the environmental profile of PSCs can be strongly affected by specific functional materials and manufacturing choices [49,50]. More broadly, sustainable industrial development increasingly requires the identification of alternative material sources [59]. Within the PV sector, analogous circular-material strategies, including improved material utilization, recovery of valuable constituents, and reduced dependence on virgin resources, could contribute to more resource-efficient manufacturing.
Solvent management is particularly relevant because solution processing is one of the technological characteristics that enables comparatively low-temperature PSC fabrication but can simultaneously introduce environmental and occupational concerns. Commonly employed solvents, including DMF and chlorobenzene, have motivated research into alternative solvent systems and greener processing strategies for perovskite fabrication [58]. Sustainable industrialization should therefore seek to reduce solvent consumption, improve solvent recovery and recycling, and, where technically feasible, replace problematic solvents with safer alternatives [60]. Such improvements could be particularly relevant to the photochemical-oxidation and toxicity-related hotspots identified in the present assessment, although dedicated process-contribution analysis would be required before attributing these impacts quantitatively to individual solvents.
Commercial scale-up must also address the relationship between efficiency and stability. High conversion efficiency is commercially valuable only if performance can be maintained over sufficiently long operating periods. The present comparison illustrates this point directly: although the modeled PSC efficiency was slightly higher than that of Si PV, the shorter assumed lifetime resulted in substantially lower cumulative electricity generation per square metre. Recent progress in PSC stability and module development is encouraging, but translating laboratory performance into durable large-area modules remains a major requirement for commercialization [51,57]. Improvements in encapsulation, interface engineering, compositional stability, and module architecture are therefore relevant not only to technical reliability but also to environmental performance because longer service life distributes production-related burdens over a greater cumulative energy output.
A sustainable commercialization strategy should additionally incorporate EoL considerations during technology and module design rather than addressing recycling only after large-scale deployment. Design-for-recycling principles could facilitate separation of module layers, recovery of substrates and valuable electrode materials, and controlled management of Pb-containing fractions. The recovery and reuse approaches discussed in Section 4.2 demonstrate that several PSC constituents can potentially be retained within circular material flows [34,54]. Integrating such considerations during module development could reduce future waste-management challenges and avoid technological lock-in to device architectures that are difficult to dismantle or recycle.
The comparison with conventional Si PV provides an important benchmark in this context. Si PV combines industrial-scale manufacturing, established supply chains, long operational lifetimes, demonstrated reliability, and increasingly developed EoL pathways. PSC technology does not need to reproduce the manufacturing architecture of Si PV, but its potential advantages must ultimately be demonstrated under conditions representative of commercial production and operation. Environmental comparisons based on laboratory or pre-commercial inventories should therefore be progressively updated as industrial data become available. In particular, future assessments should incorporate measured material utilization, industrial energy demand, production yields, module degradation, service life, recycling efficiencies, and recovery yields.
The decision-support analysis further indicates that sustainable scale-up should not focus exclusively on minimizing a single environmental indicator. Prioritizing climate and fossil-resource performance strengthens the comparative position of PSC, whereas greater emphasis on pollution-, toxicity-, and ecosystem-related impacts can alter the aggregated assessment. Commercialization strategies should therefore seek to preserve the low-energy manufacturing characteristics of PSC technology while simultaneously reducing the environmental hotspots that currently limit its performance under broader sustainability priorities. This multi-objective perspective is particularly relevant during technology scale-up, when material systems and manufacturing routes remain sufficiently flexible to incorporate environmental improvements before industrial processes become established.
The commercialization pathway for PSCs can therefore be viewed as a process of environmental performance retention and hotspot reduction. The lower manufacturing-energy requirements identified in the present study represent a potentially valuable starting point, but their long-term significance will depend on advances in durability, scalable processing, safer material and solvent systems, efficient resource use, and circular EoL management. Incorporating LCA and decision-support tools during this development process can help identify whether technological improvements genuinely reduce life-cycle burdens or merely shift impacts between environmental categories.
4.5. Limitations and Future Research
The findings of this study should be interpreted in light of several methodological and data-related limitations. First, the comparative LCA was conducted using a functional basis of 1 m² of PV system. This basis enables direct comparison of the material and manufacturing requirements of PSC and conventional Si PV technologies but does not fully harmonize their delivered energy service because the two systems were modeled with different operational lifetimes and slightly different conversion efficiencies. In particular, the assumed lifetimes of 15 years for PSC and 30 years for Si PV resulted in substantially different cumulative electricity generation. Since operational lifetime is a major determinant of the life-cycle performance of photovoltaic technologies, future assessments should complement the area-based comparison with an electricity-based functional unit, such as 1 kWh of electricity delivered over the module lifetime, using consistently defined irradiation, degradation, performance-ratio, and lifetime assumptions [49,50,51].
A second limitation concerns the maturity and representativeness of the PSC inventory. Unlike conventional Si PV, for which industrial production data and established supply chains are comparatively well documented, PSC technology remains under rapid technological development. The inventory used in the present assessment therefore represents a specific PSC configuration and should not be interpreted as representative of all perovskite compositions, architectures, or future commercial manufacturing systems. Material utilization, solvent consumption, production yield, electricity demand, deposition technology, and module architecture may change substantially during the transition from laboratory to industrial-scale manufacturing [12,50,56]. Future LCAs should consequently incorporate primary industrial or pilot-scale data as these become available and evaluate alternative device architectures and scalable manufacturing routes.
The interpretation of the environmental hotspots is also constrained by the level of analysis performed. The present study identifies categories in which substantial differences occur between PSC and Si PV but does not conduct a detailed process- or material-level contribution analysis. Consequently, the comparatively high PSC impacts observed for photochemical oxidation, terrestrial ecotoxicity, land use, and stratospheric ozone depletion cannot be quantitatively attributed to individual solvents, precursors, electrodes, or manufacturing operations. Future work should include contribution analysis at the inventory-flow and process levels to identify the principal drivers of these impacts. This could be complemented by uncertainty and parameter-sensitivity analyses addressing uncertain inventory quantities, manufacturing losses, electricity supply, lifetime, and other influential assumptions.
The EoL assessment is subject to similar limitations. The management pathways considered for PSC and Si PV represent modeled treatment routes based on the material composition of the respective systems and available recycling approaches rather than measured recovery efficiencies from a common industrial recycling process. This distinction is particularly relevant for PSCs, for which recycling technologies remain under development despite substantial recent progress in material recovery, substrate reuse, aqueous recycling, remanufacturing, and closed-loop approaches [33,34,44,48,54]. Future studies should incorporate experimentally demonstrated recovery efficiencies, secondary-material quality, process energy and chemical requirements, avoided virgin-material production, and recycling losses. Such data would allow alternative EoL scenarios to be compared quantitatively rather than treating recycling and recovery primarily as assigned management routes.
The techno-economic component represents an additional limitation. Production cost, stability, reliability, manufacturing maturity, recycling requirements, and commercial scalability were included as contextual parameters, but a harmonized techno-economic model was not developed. Consequently, the present study does not estimate levelized cost of electricity, payback period, capital expenditure, operating expenditure, or industrial-scale production cost. This choice avoids combining heterogeneous economic data with the quantitative environmental scoring but limits the ability to evaluate environmental and economic trade-offs simultaneously. Future work could integrate LCA with a harmonized techno-economic assessment using common assumptions regarding manufacturing scale, production yield, module lifetime, efficiency, degradation, and recycling. Such an approach would be particularly valuable as industrially representative PSC manufacturing data become available [47,50].
The decision-support framework also involves methodological assumptions that should be considered when interpreting the DSS results. Five environmental criteria were selected independently from each LCIA method, and all were treated as cost criteria. Equal weighting was adopted as the baseline because no stakeholder-derived or policy-based preference structure was available, while the sensitivity analysis applied a 50% increase to the weights associated with the three alternative environmental-priority scenarios. Although this provides a transparent means of testing the influence of changing priorities, the resulting scenarios remain hypothetical and do not represent empirically elicited preferences [37,38,39,40]. Future applications could derive weighting structures through stakeholder consultation, expert elicitation, policy priorities, or established weighting methods and compare the resulting decision outcomes.
Furthermore, the sensitivity analysis varied the weighting structure while retaining the normalization procedure unchanged. The results therefore demonstrate sensitivity to the tested environmental-priority weights but do not establish robustness to alternative normalization methods or aggregation procedures. This distinction is particularly important because methodological choices in MCDA can influence the relative scores and ordering of alternatives [37,39,41]. Future research should extend the robustness assessment by comparing alternative normalization techniques, weighting approaches, and potentially different MCDA aggregation methods. Such analysis would determine whether the observed stability of the ReCiPe ordering and the CML-IA reversals remain consistent under broader methodological assumptions.
Finally, the environmental and decision-support results represent the technologies under the assumptions and datasets adopted in the present study rather than fixed characteristics of PSC and Si PV technologies. PSC performance is evolving rapidly in terms of efficiency, stability, scalable fabrication, material selection, solvent systems, and recycling [44,55,60]. The framework developed here should therefore be regarded as adaptable rather than static. Updating the underlying LCI, lifetime, EoL, and techno-economic data as PSC technology approaches commercial-scale production would allow the same decision-support structure to track whether technological advances translate into genuine reductions in life-cycle environmental burdens.
Future research should consequently focus on integrating industrially representative production data, energy-normalized functional units, experimentally validated recycling inventories, process-level contribution and uncertainty analyses, and harmonized techno-economic information. Incorporating empirically derived stakeholder preferences and broader MCDA sensitivity testing would further strengthen the decision-support component. Such developments would enable the framework to evolve from a comparative assessment of current technological configurations toward a dynamic tool for evaluating alternative PSC manufacturing, durability, and circularity strategies as the technology progresses toward commercialization.
5. Conclusions
This study developed an integrated framework combining comparative LCA, EoL assessment, techno-economic considerations, and multi-criteria decision support to evaluate PSC and conventional Si PV systems. The results revealed clear environmental trade-offs. Under the modeled conditions, PSC showed approximately 57% lower climate-related impacts and 49–53% lower fossil-resource-related impacts, consistent with its lower manufacturing electricity requirement. However, substantially higher impacts were identified for selected categories, particularly land use, photochemical oxidation, and terrestrial ecotoxicity, demonstrating that lower-energy manufacturing does not ensure superior performance across all environmental dimensions. Operational lifetime remains a critical factor in realizing the environmental potential of PSCs. Despite the slightly higher modeled efficiency of PSC (22% vs. 21%), its shorter assumed lifetime (15 vs. 30 years) resulted in considerably lower cumulative electricity generation. Sustainable commercialization therefore requires improvements in durability and stability alongside scalable manufacturing, safer material and solvent systems, efficient resource use, and effective recovery and recycling of valuable and Pb-containing fractions. The decision-support analysis further demonstrated that aggregated environmental performance depends on the priorities applied. While Si PV achieved higher DSS values under equal weighting, the CML-IA ordering reversed under climate- and resource-priority scenarios, whereas the ReCiPe ordering remained stable. Thus, aggregated scores should be interpreted together with the underlying LCIA indicators rather than as absolute measures of sustainability. Future research should incorporate industrial-scale production data, electricity-based functional units, experimentally validated recycling efficiencies, process-level contribution and uncertainty analyses, and harmonized techno-economic data. Integrating these developments with transparent decision-support approaches can support the transition of PSCs toward more durable, scalable, and circular photovoltaic production.
Supplementary Materials
The following supporting information can be downloaded at the website of this paper posted on Preprints.org, Table S1: Complete production life cycle inventory for 1 m² of perovskite photovoltaic system; Table S2: Complete production LCI for 1 m² Si PV system; Table S3–S4: End-of-life material inventories and management routes; Table S5: LCIA methodologies, impact categories, and characterization units; Table S6–S7: Complete ReCiPe 2016 Midpoint (H) and CML-IA Baseline LCIA results; Table S8: Criterion allocation and normalized weighting factors applied under the four decision-priority scenarios.
Author Contributions
Conceptualization, K.K.; methodology, K.K. and I.K.; software, K.K. and I.K.; validation, M.P., N.G. and C.D.; formal analysis, K.K. and N.L.; investigation, K.K., I.K. and N.G.; resources, G.P. and D.N.; data curation, M.P., G.P. and D.N.; writing—original draft preparation, K.K. and I.K.; writing—review and editing, K.K., C.D., N.L. and D.N.; visualization, K.K.; supervision, G.P. and D.N.; project administration, G.P. and D.N.; funding acquisition, G.P. and D.N. All authors have read and agreed to the published version of the manuscript.
Funding
This research received no external funding.
Data Availability Statement
All data supporting the findings of this study are provided within the article and its Supplementary Materials. The Supplementary Materials include the detailed life-cycle inventories, end-of-life data, LCIA results, and decision-support weighting scenarios used in the analysis.
Acknowledgments
During the preparation of this manuscript, a Generative Artificial Intelligence tool (ChatGPT, v.5.5) was used solely to assist with language refinement, text editing, and translation. The authors reviewed and edited the output and take full responsibility for the content of this publication.
Conflicts of Interest
The authors declare no conflicts of interest.
Abbreviations
The following abbreviations are used in this manuscript:
| Au | Gold |
| CML-IA | CML Life Cycle Impact Assessment |
| DMF | N,N-Dimethylformamide |
| DMSO | Dimethyl sulfoxide |
| DSS | Decision-Support Score |
| EoL | End-of-Life |
| EVA | Ethylene-Vinyl Acetate |
| FTO | Fluorine-Doped Tin Oxide |
| GWP | Global Warming Potential |
| GWP100a | Global Warming Potential over a 100-year time horizon |
| IPA | Isopropyl Alcohol |
| ITO | Indium Tin Oxide |
| LCA | Life Cycle Assessment |
| LCI | Life Cycle Inventory |
| LCIA | Life Cycle Impact Assessment |
| MAI | Methylammonium Iodide |
| MAPbI₃ | Methylammonium Lead Iodide |
| MCDA | Multi-Criteria Decision Analysis |
| MCDM | Multi-Criteria Decision Making |
| Pb | Lead |
| PbI₂ | Lead Iodide |
| PSC | Perovskite Solar Cell |
| PV | Photovoltaic |
| SAW | Simple Additive Weighting |
| SC | Decision-Priority Scenario |
| Si | Silicon |
| Si PV | Silicon Photovoltaic |
| Spiro-OMeTAD | 2,2′,7,7′-Tetrakis[N,N-di(4-methoxyphenyl)amino]-9,9′-spirobifluorene |
| TiO₂ | Titanium Dioxide |
References
- Li, J.; Wang, C.; Guo, J.; Xin, Y.; Zhang, N.; Liu, X.; Feng, K. Promoting Sustainable Development Goals by Optimizing City-Level Solar Photovoltaic Deployment in China. Environ. Sci. Technol. 2024, 58, 5196–5209. [Google Scholar] [CrossRef] [PubMed]
- Psomopoulos, C.S.; Kalkanis, K.; Chatzistamou, E.D.; Kiskira, K.; Ioannidis, G.C.; Kaminaris, S.D. End of life treatment of photovoltaic panels. Expected volumes up to 2045 in E.U. AIP Conf. Proc. 2022, 2437, 020084. [Google Scholar] [CrossRef]
- Ballif, C.; Haug, F.J.; Boccard, M.; Verlinden, P.J.; Hahn, G. Status and Perspectives of Crystalline Silicon Photovoltaics in Research and Industry. Nat. Rev. Mater. 2022, 7, 597–616. [Google Scholar] [CrossRef]
- Pecunia, V.; Silva, S.R.P.; Phillips, J.D.; Artegiani, E.; Romeo, A.; Shim, H.; Park, J.; Kim, J.H.; Yun, J.S.; Welch, G.C.; et al. Roadmap on Energy Harvesting Materials. J. Phys. Mater. 2023, 6, 042501. [Google Scholar] [CrossRef] [PubMed]
- Kiskira, K.; Kalkanis, K.; Coelho, F.; Plakantonaki, S.; D’onofrio, C.; Psomopoulos, C.S.; Priniotakis, G.; Ioannidis, G.C. Life Cycle Assessment of Organic Solar Cells: Structure, Analytical Framework, and Future Product Concepts. Electronics 2025, 14, 2426. [Google Scholar] [CrossRef]
- Njema, G.G.; Kibet, J.K. A Review of Chalcogenide-Based Perovskites as the Next Novel Materials: Solar Cell and Optoelectronic Applications, Catalysis and Future Perspectives. Next Nanotechnol. 2025, 7, 100102. [Google Scholar] [CrossRef]
- Kiskira, K. Sustainable Innovation in Perovskite Solar Modules: Life Cycle Assessment and End-of-Life Management for Commercial Viability. Energies 2026, 19, 3320. [Google Scholar] [CrossRef]
- Liu, P.; Wang, H.; Niu, T.; Yin, L.; Du, Y.; Lang, L.; Zhang, Z.; Tu, Y.; Liu, X.; Chen, X.; Wang, S.; Wu, N.; Qin, R.; Wang, L.; Yang, S.; Zhang, C.; Pan, X.; Liu, S.; Zhao, K. Ambient Scalable Fabrication of High-Performance Flexible Perovskite Solar Cells. Energy Environ. Sci. 2024, 17, 7069–7080. [Google Scholar] [CrossRef]
- Machín, A.; Márquez, F. Advancements in Photovoltaic Cell Materials: Silicon, Organic, and Perovskite Solar Cells. Materials 2024, 17, 1165. [Google Scholar] [CrossRef] [PubMed]
- Kiskira, K.; Lalopoulou, A.; Kalkanis, K.; Vokas, G. Closing the Loop on Solar: A Sustainability Assessment of Photovoltaic Recycling in Greece. Energies 2025, 18, 6314. [Google Scholar] [CrossRef]
- Goetz, K.P.; Taylor, A.D.; Hofstetter, Y.J.; Vaynzof, Y. Sustainability in Perovskite Solar Cells. ACS Appl. Mater. Interfaces 2021, 13, 1–17. [Google Scholar] [CrossRef] [PubMed]
- Yan, J.; Savenije, T.J.; Mazzarella, L.; Isabella, O. Progress and Challenges on Scaling up of Perovskite Solar Cell Technology. Sustain. Energy Fuels 2022, 6, 243–266. [Google Scholar] [CrossRef]
- Kiskira, K.; Gerolimos, N.; Priniotakis, G.; Nikolopoulos, D. Life-Cycle Assessment of Innovative Industrial Processes for Photovoltaic Production: Process-Level LCIs, Scale-Up Dynamics, and Recycling Implications. Appl. Sci. 2026, 16, 501. [Google Scholar] [CrossRef]
- Wang, Y.; Lee, S.; Li, C.; et al. Techno-Economic Evaluation of Solar Photovoltaic Power Production in China for Sustainable Development and the Environment. In Environ. Dev. Sustain.; 2024. [Google Scholar] [CrossRef]
- Wang, Q.; Phung, N.; Di Girolamo, D.; Vivo, P.; Abate, A. Enhancement in lifespan of halide perovskite solar cells. Energy Environ. Sci. 2019, 12, 865–886. [Google Scholar] [CrossRef]
- Mohsen, A.A.; Allam, N. Bridging the Stability Gap in Perovskite Solar Cells: Mechanisms, Mitigation Strategies, and Commercial Perspectives. Energy Adv. 2026. [Google Scholar] [CrossRef]
- Francis, A.; Thomas, A. A Framework for Dynamic Life Cycle Sustainability Assessment and Policy Analysis of Built Environment through a System Dynamics Approach. Sustain. Cities Soc. 2022, 76, 103521. [Google Scholar] [CrossRef]
- Sun, H.; Huang, M.; Lin, H.; Ge, Y.; Zhu, D.; Gong, D.; Altan, O. Spatiotemporal Dynamics of Ecological Environment Quality in Arid and Sandy Regions with a Particular Remote Sensing Ecological Index: A Study of the Beijing-Tianjin Sand Source Region. Geo-Spat. Inf. Sci. 2026, 29, 733–752. [Google Scholar] [CrossRef]
- Setyadi, A.; Pawirosumarto, S.; Damaris, A. Rethinking Sustainable Operations: A Multi-Level Integration of Circularity, Localization, and Digital Resilience in Manufacturing Systems. Sustainability 2025, 17, 6929. [Google Scholar] [CrossRef]
- Pereira, R.B.; Salvador, R.; De Francisco, A.C. The Circular Strategic Tool: Coupling Strategic Decision Making and the Circular Economy. Manag. Decis. 2026, 64, 3939–3960. [Google Scholar] [CrossRef]
- Muhammad, J.; Badi, I.; Haruna, A.A.; Mohammed, I.A. Selecting the Best Municipal Solid Waste Management Techniques in Nigeria Using Multi Criteria Decision Making Techniques. Rep. Mech. Eng. 2021, 2, 180–189. [Google Scholar] [CrossRef]
- Abo-Zahhad, E.M.; Rashwan, A.; Salameh, T.; Hamid, A.K.; Faragalla, A.; El-Dein, A.Z.; Chen, Y.; Abdelhameed, E.H. Evaluation of Solar PV-Based Microgrids Viability Utilizing Single and Multi-Criteria Decision Analysis. Renew. Energy 2024, 221, 119713. [Google Scholar] [CrossRef]
- Hauschild, M.Z.; Rosenbaum, R.K.; Olsen, S.I. (Eds.) Life Cycle Assessment: Theory and Practice; Springer: Cham, Switzerland, 2018. [Google Scholar] [CrossRef]
- International Organization for Standardization (ISO). ISO 14040:2006 Environmental Management—Life Cycle Assessment—Principles and Framework; ISO. Geneva, Switzerland, 2006. Available online: https://www.iso.org/standard/37456.html (accessed on 1 September 2026).
- Celik, I.; Phillips, A.B.; Song, Z.; Yan, Y.; Ellingson, R.J.; Heben, M.J.; Apul, D. Environmental Analysis of Perovskites and Other Relevant Solar Cell Technologies in a Tandem Configuration. Energy Environ. Sci. 2017, 10, 1874–1884. [Google Scholar] [CrossRef]
- Jungbluth, N.; Stucki, M.; Flury, K.; Frischknecht, R.; Büsser, S. Life Cycle Inventories of Photovoltaics, Version 2012; ESU-services Ltd.: Uster, Switzerland, 2012; Prepared on behalf of the Swiss Federal Office of Energy (SFOE). Available online: https://esu-services.ch/fileadmin/download/publicLCI/jungbluth-2012-LCI-Photovoltaics.pdf (accessed on 2 September 2026).
- Zhang, J.; Gao, X.; Deng, Y.; Zha, Y.; Yuan, C. Life Cycle Assessment of Perovskite Solar Cell Technology. Nat. Sustain. 2021, 4, 334–343. [Google Scholar] [CrossRef]
- Li, B.; et al. Environmental Impacts of Emerging Perovskite Photovoltaic Technologies. Renew. Sustain. Energy Rev. 2021, 111089. [Google Scholar] [CrossRef]
- Correa-Baena, J.-P.; Saliba, M.; Buonassisi, T.; Grätzel, M.; Abate, A.; Tress, W.; Hagfeldt, A. Promises and Challenges of Perovskite Solar Cells. Science 2017, 358, 739–744. [Google Scholar] [CrossRef] [PubMed]
- Fthenakis, V.M.; Kim, H.C. Photovoltaics: Life-Cycle Analyses. Renew. Sustain. Energy Rev. 2011, 15, 1609–1628. [Google Scholar] [CrossRef]
- de Wild-Scholten, M.M. Energy Payback Time and Carbon Footprint of Commercial Photovoltaic Systems. Sol. Energy Mater. Sol. Cells 2013, 119, 296–305. [Google Scholar] [CrossRef]
- International Energy Agency Photovoltaic Power Systems Programme (IEA PVPS), Task 12. Life Cycle Assessment of Photovoltaic Electricity Generation; IEA PVPS: 2022. Available online: https://iea-pvps.org/key-topics/life-cycle-assessment/ (accessed on 1 September 2026).
- Wu, Z.; Sytnyk, M.; Zhang, J.; Babayeva, G.; Kupfer, C.; Hu, J.; Arnold, S.; Hauch, J.; Brabec, C.; Peters, I.M. Closing the loop: Recycling of MAPbI3 perovskite solar cells. Energy Environ. Sci. 2024, 17, 4248–4262. [Google Scholar] [CrossRef]
- Binek, A.; Petrus, M.L.; Huber, N.; Bristow, H.; Hu, Y.; Bein, T.; Docampo, P. Recycling perovskite solar cells to avoid lead waste. ACS Appl. Mater. Interfaces 2016, 8, 12881–12886. [Google Scholar] [CrossRef] [PubMed]
- Wu, X.; Zhang, D.; Wang, X.; Jiang, X.; Liu, B.; Li, B.; Li, Z.; Gao, D.; Zhang, C.; Wang, Y.; Zhu, Z. Eco-friendly perovskite solar cells: From materials design to device processing and recycling. EcoMat 2023, 5, e12352. [Google Scholar] [CrossRef]
- Tian, C.; Wu, T.; Zhou, X.; Zhao, Y.; Li, B.; Han, X.; Li, K.; Hou, C.; Li, Y.; Wang, H.; Zhang, Q. Air-processed efficient perovskite solar cells with full lifecycle management. Adv. Mater. 2025, 37, 2411982. [Google Scholar] [CrossRef] [PubMed]
- Pizzol, M.; Laurent, A.; Sala, S.; Weidema, B.; Verones, F.; Koffler, C. Normalisation and weighting in life cycle assessment: Quo vadis? Int. J. Life Cycle Assess. 2017, 22, 853–866. [Google Scholar] [CrossRef]
- Sala, S.; Cerutti, A.K.; Pant, R. Development of a Weighting Approach for the Environmental Footprint; Publications Office of the European Union: Luxembourg, 2018; p. EUR 28562. ISBN 978-92-79-68042-7. [Google Scholar] [CrossRef] [PubMed]
- Askham, C.; Arendt, R.; Bachmann, T.M.; et al. Review of weighting methods for life cycle impact assessment under GLAM. Int. J. Life Cycle Assess. 2025, 30, 2691–2724. [Google Scholar] [CrossRef]
- Ige, O.E.; Moloi, K.; Kabeya, M. Sustainability assessment of cement types via integrated life cycle assessment and multi-criteria decision-making methods. Sci 2025, 7, 85. [Google Scholar] [CrossRef]
- Elavarasan, R.M.; Nadarajah, M.; Shafiullah, G.M. Multi-criteria decision analysis of clean energy technologies for envisioning Sustainable Development Goal 7 in Australia: Is solar energy a game-changer? Energy Convers. Manag. 2024, 321, 119007. [Google Scholar] [CrossRef]
- Kolahchian Tabrizi, M.; Famiglietti, J.; Bonalumi, D.; Campanari, S. The Carbon Footprint of Hydrogen Produced with State-of-the-Art Photovoltaic Electricity Using Life-Cycle Assessment Methodology. Energies 2023, 16, 5190. [Google Scholar] [CrossRef]
- Gerold, E.; Antrekowitsch, H. Advancements and Challenges in Photovoltaic Cell Recycling: A Comprehensive Review. Sustainability 2024, 16, 2542. [Google Scholar] [CrossRef]
- Xiao, X.; Xu, N.; Tian, X.; et al. Aqueous-based recycling of perovskite photovoltaics. Nature 2025, 638, 670–675. [Google Scholar] [CrossRef] [PubMed]
- Thakur, A.; Raj, M.; Deupa, M.; Surapaneni, R.; Gupta, S.; Goel, N. Review and perspectives of perovskite solar cells: Toward environmentally sustainable and efficient photovoltaics. Energy Fuels 2025, 39, 24012–24044. [Google Scholar] [CrossRef]
- Park, N.-G. Discovery and progress of solid-state perovskite solar cells. Acc. Chem. Res. 2026, 59, 40–51. [Google Scholar] [CrossRef] [PubMed]
- Kajal, P.; Verma, B.; Vadaga, S.G.R.; Powar, S. Costing analysis of scalable carbon-based perovskite modules using bottom up technique. Glob. Chall. 2022, 6, 2100070. [Google Scholar] [CrossRef] [PubMed]
- Bogachuk, D.; van der Windt, P.; Wagner, L.; Martineau, D.; Narbey, S.; Verma, A.; Lim, J.; Zouhair, S.; Kohlstädt, M.; Hinsch, A.; Stranks, S.D.; Würfel, U.; Glunz, S.W. Remanufacturing perovskite solar cells and modules—A holistic case study. ACS Sustain. Resour. Manag. 2024, 1, 417–426. [Google Scholar] [CrossRef] [PubMed]
- Gong, J.; Darling, S.B.; You, F. Perovskite photovoltaics: Life-cycle assessment of energy and environmental impacts. Energy Environ. Sci. 2015, 8, 1953–1968. [Google Scholar] [CrossRef]
- Martulli, A.; Rajagopalan, N.; Gota, F.; Meyer, T.; Paetzold, U.W.; Claes, S.; Salone, A.; Verboven, J.; Malina, R.; Vermang, B.; Lizin, S. Towards market commercialization: Lifecycle economic and environmental evaluation of scalable perovskite solar cells. Prog. Photovolt. Res. Appl. 2023, 31, 180–194. [Google Scholar] [CrossRef]
- Kim, H.J.; Han, G.S.; Jung, H.S. Managing the lifecycle of perovskite solar cells: Addressing stability and environmental concerns from utilization to end-of-life. eScience 2024, 4, 100243. [Google Scholar] [CrossRef]
- Li, H.; Yan, Z.; Li, M.; Wen, X.; Deng, S.; Liu, S.; Choy, W.C.H.; Li, L.; Li, M.-Y.; Lu, H. Probing the stability of perovskite solar cell under working condition through an ultra-thin silver electrode: Beyond the halide ion diffusion and metal diffusion. Chem. Eng. J. 2023, 458, 141405. [Google Scholar] [CrossRef]
- Psomopoulos, C.S.; Kiskira, K.; Kalkanis, K. Comparative life cycle assessment of composting and anaerobic digestion technologies in the Greek context: Focus on energy and environmental impacts. Biomass Bioenergy 2026, 214, 109493. [Google Scholar] [CrossRef]
- Xu, C.; Wang, Y.; Wang, Z.; Lei, W.; Zhang, H. Closed-loop recycling of spent perovskite solar cells. Chem. Eng. J. 2025, 170035. [Google Scholar] [CrossRef]
- Li, N.; Niu, X.; Chen, Q.; Zhou, H. Towards commercialization: The operational stability of perovskite solar cells. Chem. Soc. Rev. 2020, 49, 8235–8286. [Google Scholar] [CrossRef] [PubMed]
- Saki, Z.; Byranvand, M.M.; Taghavinia, N.; Kedia, M.; Saliba, M. Solution-processed perovskite thin-films: The journey from lab- to large-scale solar cells. Energy Environ. Sci. 2021, 14, 5690–5722. [Google Scholar] [CrossRef]
- Kwon, N.; Lee, J.; Ko, M.J.; et al. Recent progress of eco-friendly manufacturing process of efficient perovskite solar cells. Nano Converg. 2023, 10, 28. [Google Scholar] [CrossRef] [PubMed]
- Kiskira, K.; Plakantonaki, S.; Gerolimos, N.; Kalkanis, K.; Sfyroera, E.; Coelho, F.; Priniotakis, G. Life Cycle Optimization of Circular Industrial Processes: Advances in By-Product Recovery for Renewable Energy Applications. Clean Technol. 2026, 8, 5. [Google Scholar] [CrossRef]
- Plakantonaki, S.; Stergiou, M.; Panagiotatos, G.; Kiskira, K.; Priniotakis, G. Regenerated cellulosic fibers from agricultural waste. AIP Conf. Proc. 2022, 2430, 080006. [Google Scholar] [CrossRef]
- Shen, H.; Wu, P.; Heo, J.H.; Zhang, F. Green solvent engineering for sustainable perovskite solar cells. Mater. Chem. Front. 2026. [Google Scholar] [CrossRef]
Figure 2.
Relative environmental impacts of the PSC system compared with conventional Si PV for the selected ReCiPe 2016 Midpoint (H) and CML-IA Baseline impact categories. Conventional Si PV was set to 100% within each impact category. Values below 100% indicate lower impacts for PSC, whereas values above 100% indicate higher impacts.
Figure 2.
Relative environmental impacts of the PSC system compared with conventional Si PV for the selected ReCiPe 2016 Midpoint (H) and CML-IA Baseline impact categories. Conventional Si PV was set to 100% within each impact category. Values below 100% indicate lower impacts for PSC, whereas values above 100% indicate higher impacts.
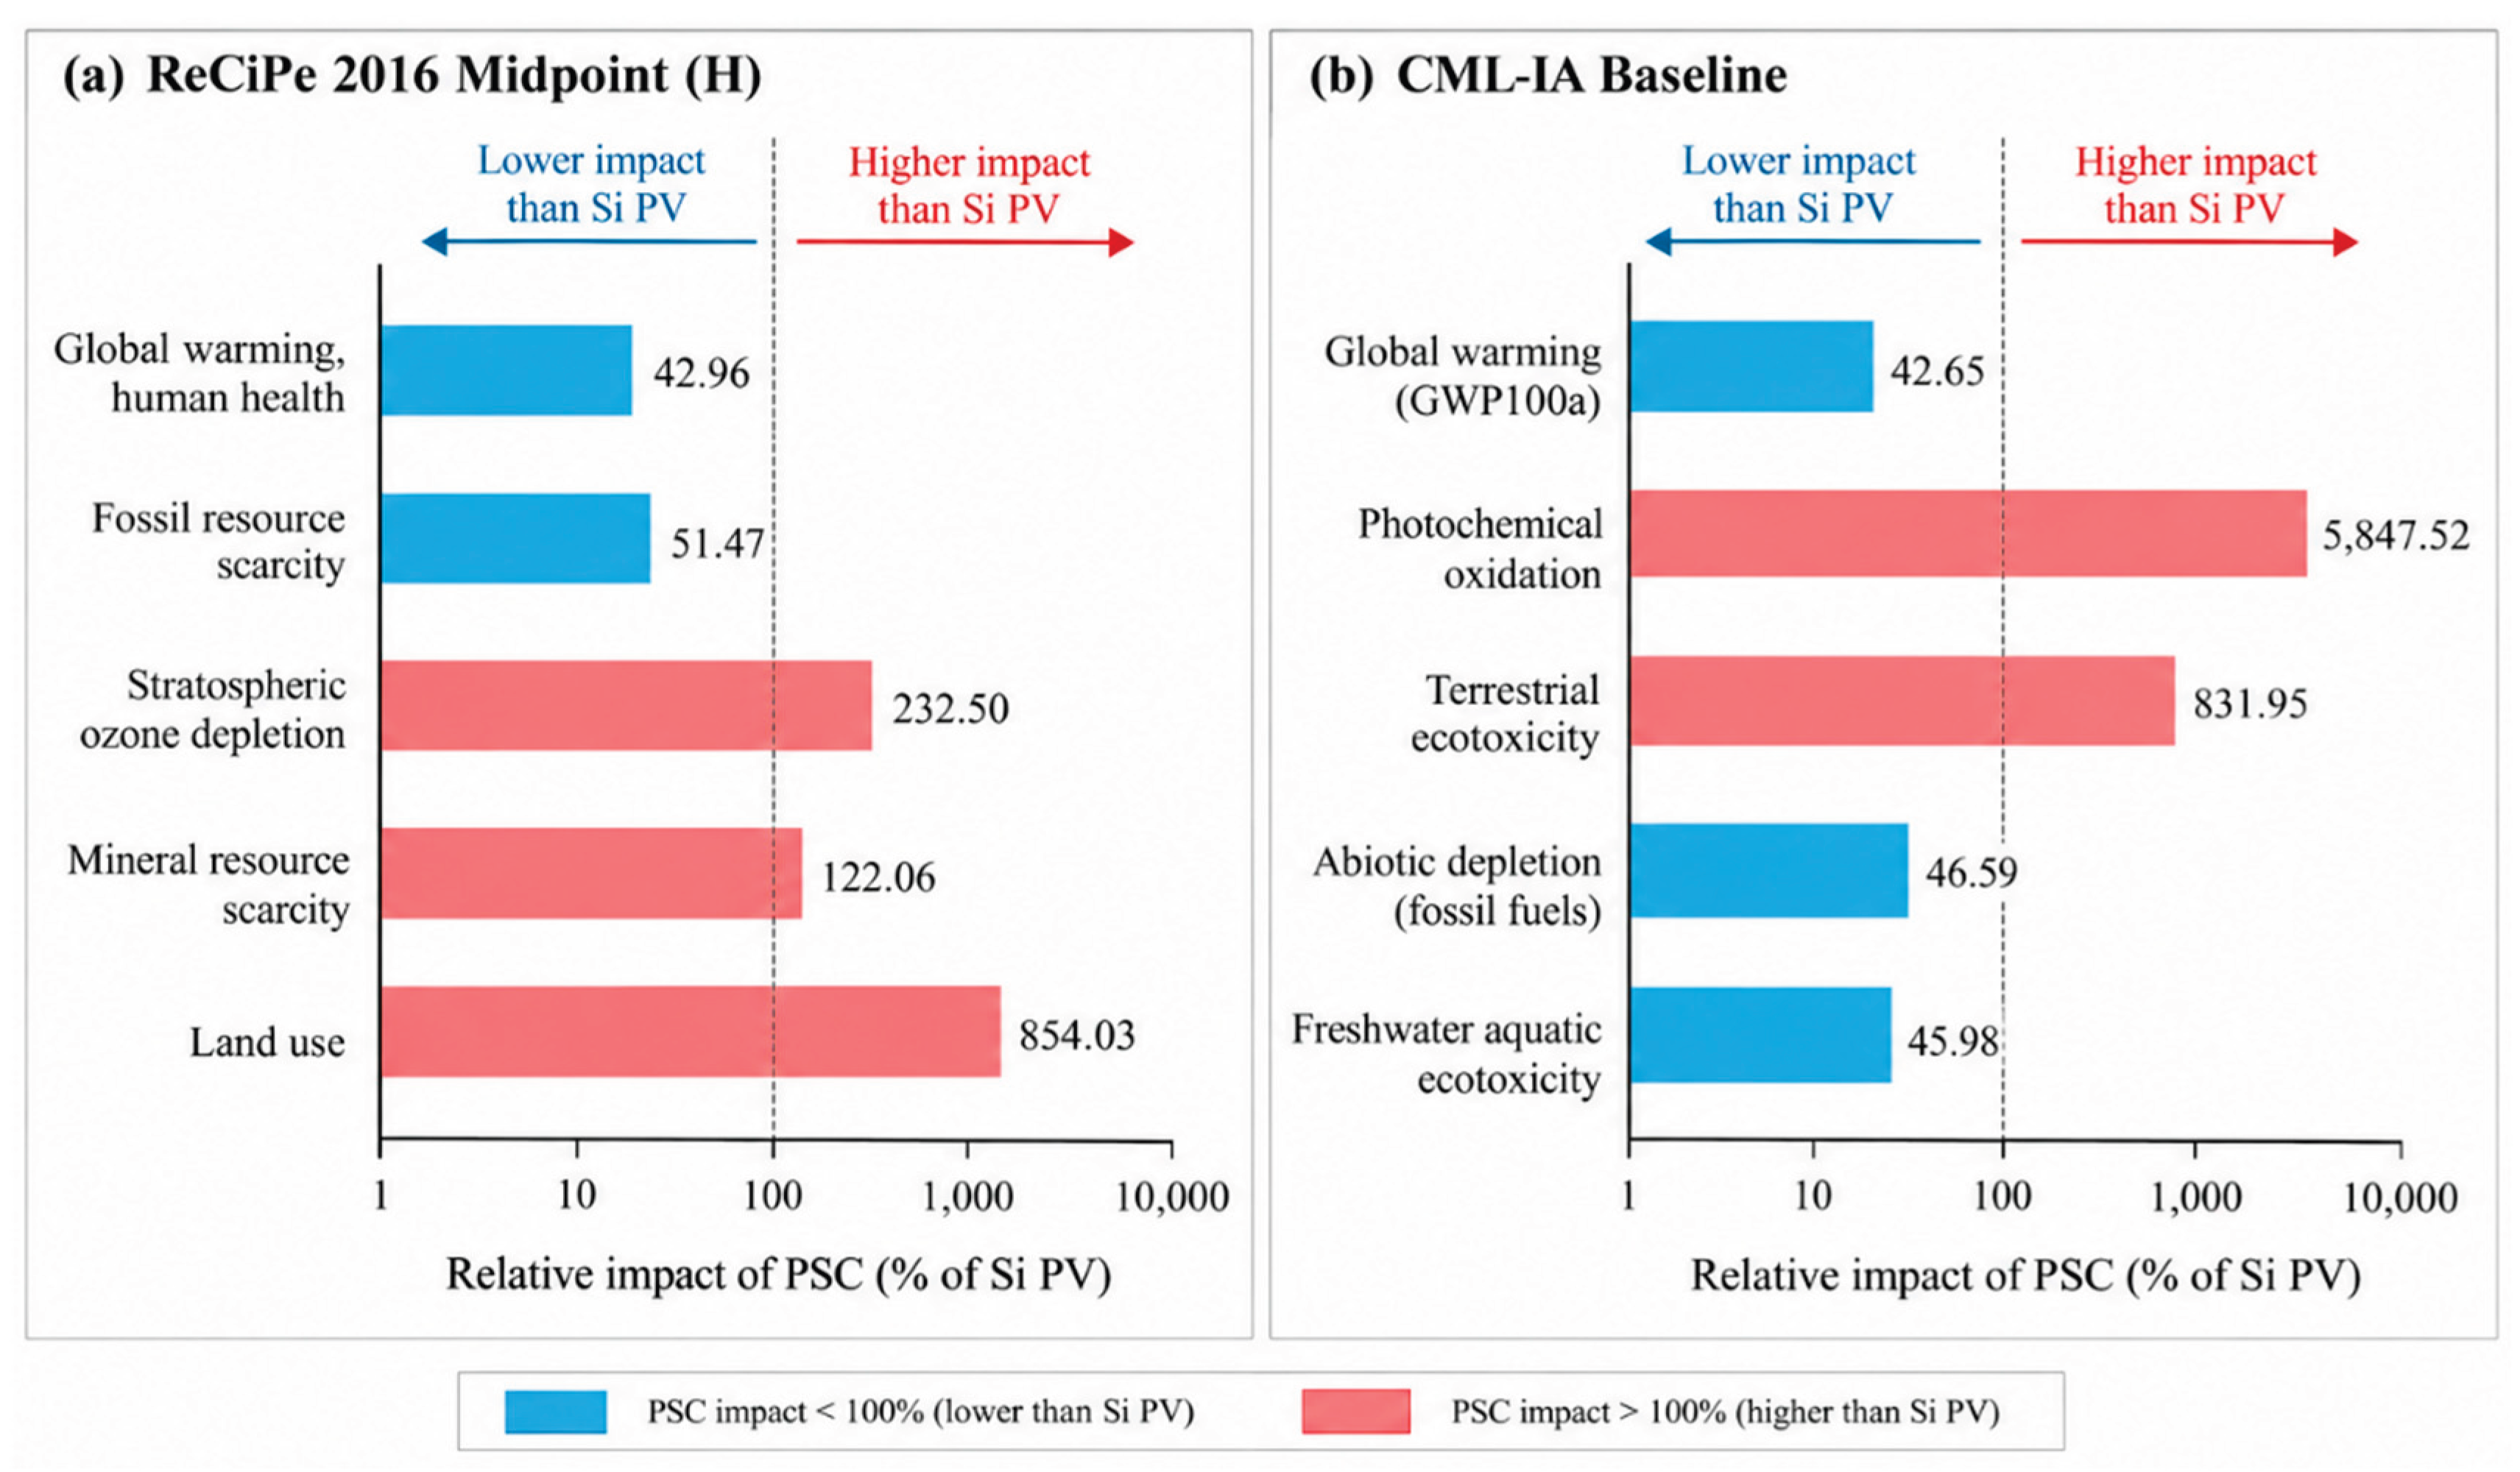
Figure 3.
Decision-Support Scores (DSS) of PSC and conventional Si PV under the four environmental-priority scenarios for (a) ReCiPe 2016 and (b) CML-IA Baseline. SC1 represents balanced environmental performance, SC2 climate priority, SC3 resource security, and SC4 pollution and ecosystem protection. Higher DSS values indicate a more favorable relative environmental performance under the selected criteria and scenario-specific weighting structure.
Figure 3.
Decision-Support Scores (DSS) of PSC and conventional Si PV under the four environmental-priority scenarios for (a) ReCiPe 2016 and (b) CML-IA Baseline. SC1 represents balanced environmental performance, SC2 climate priority, SC3 resource security, and SC4 pollution and ecosystem protection. Higher DSS values indicate a more favorable relative environmental performance under the selected criteria and scenario-specific weighting structure.
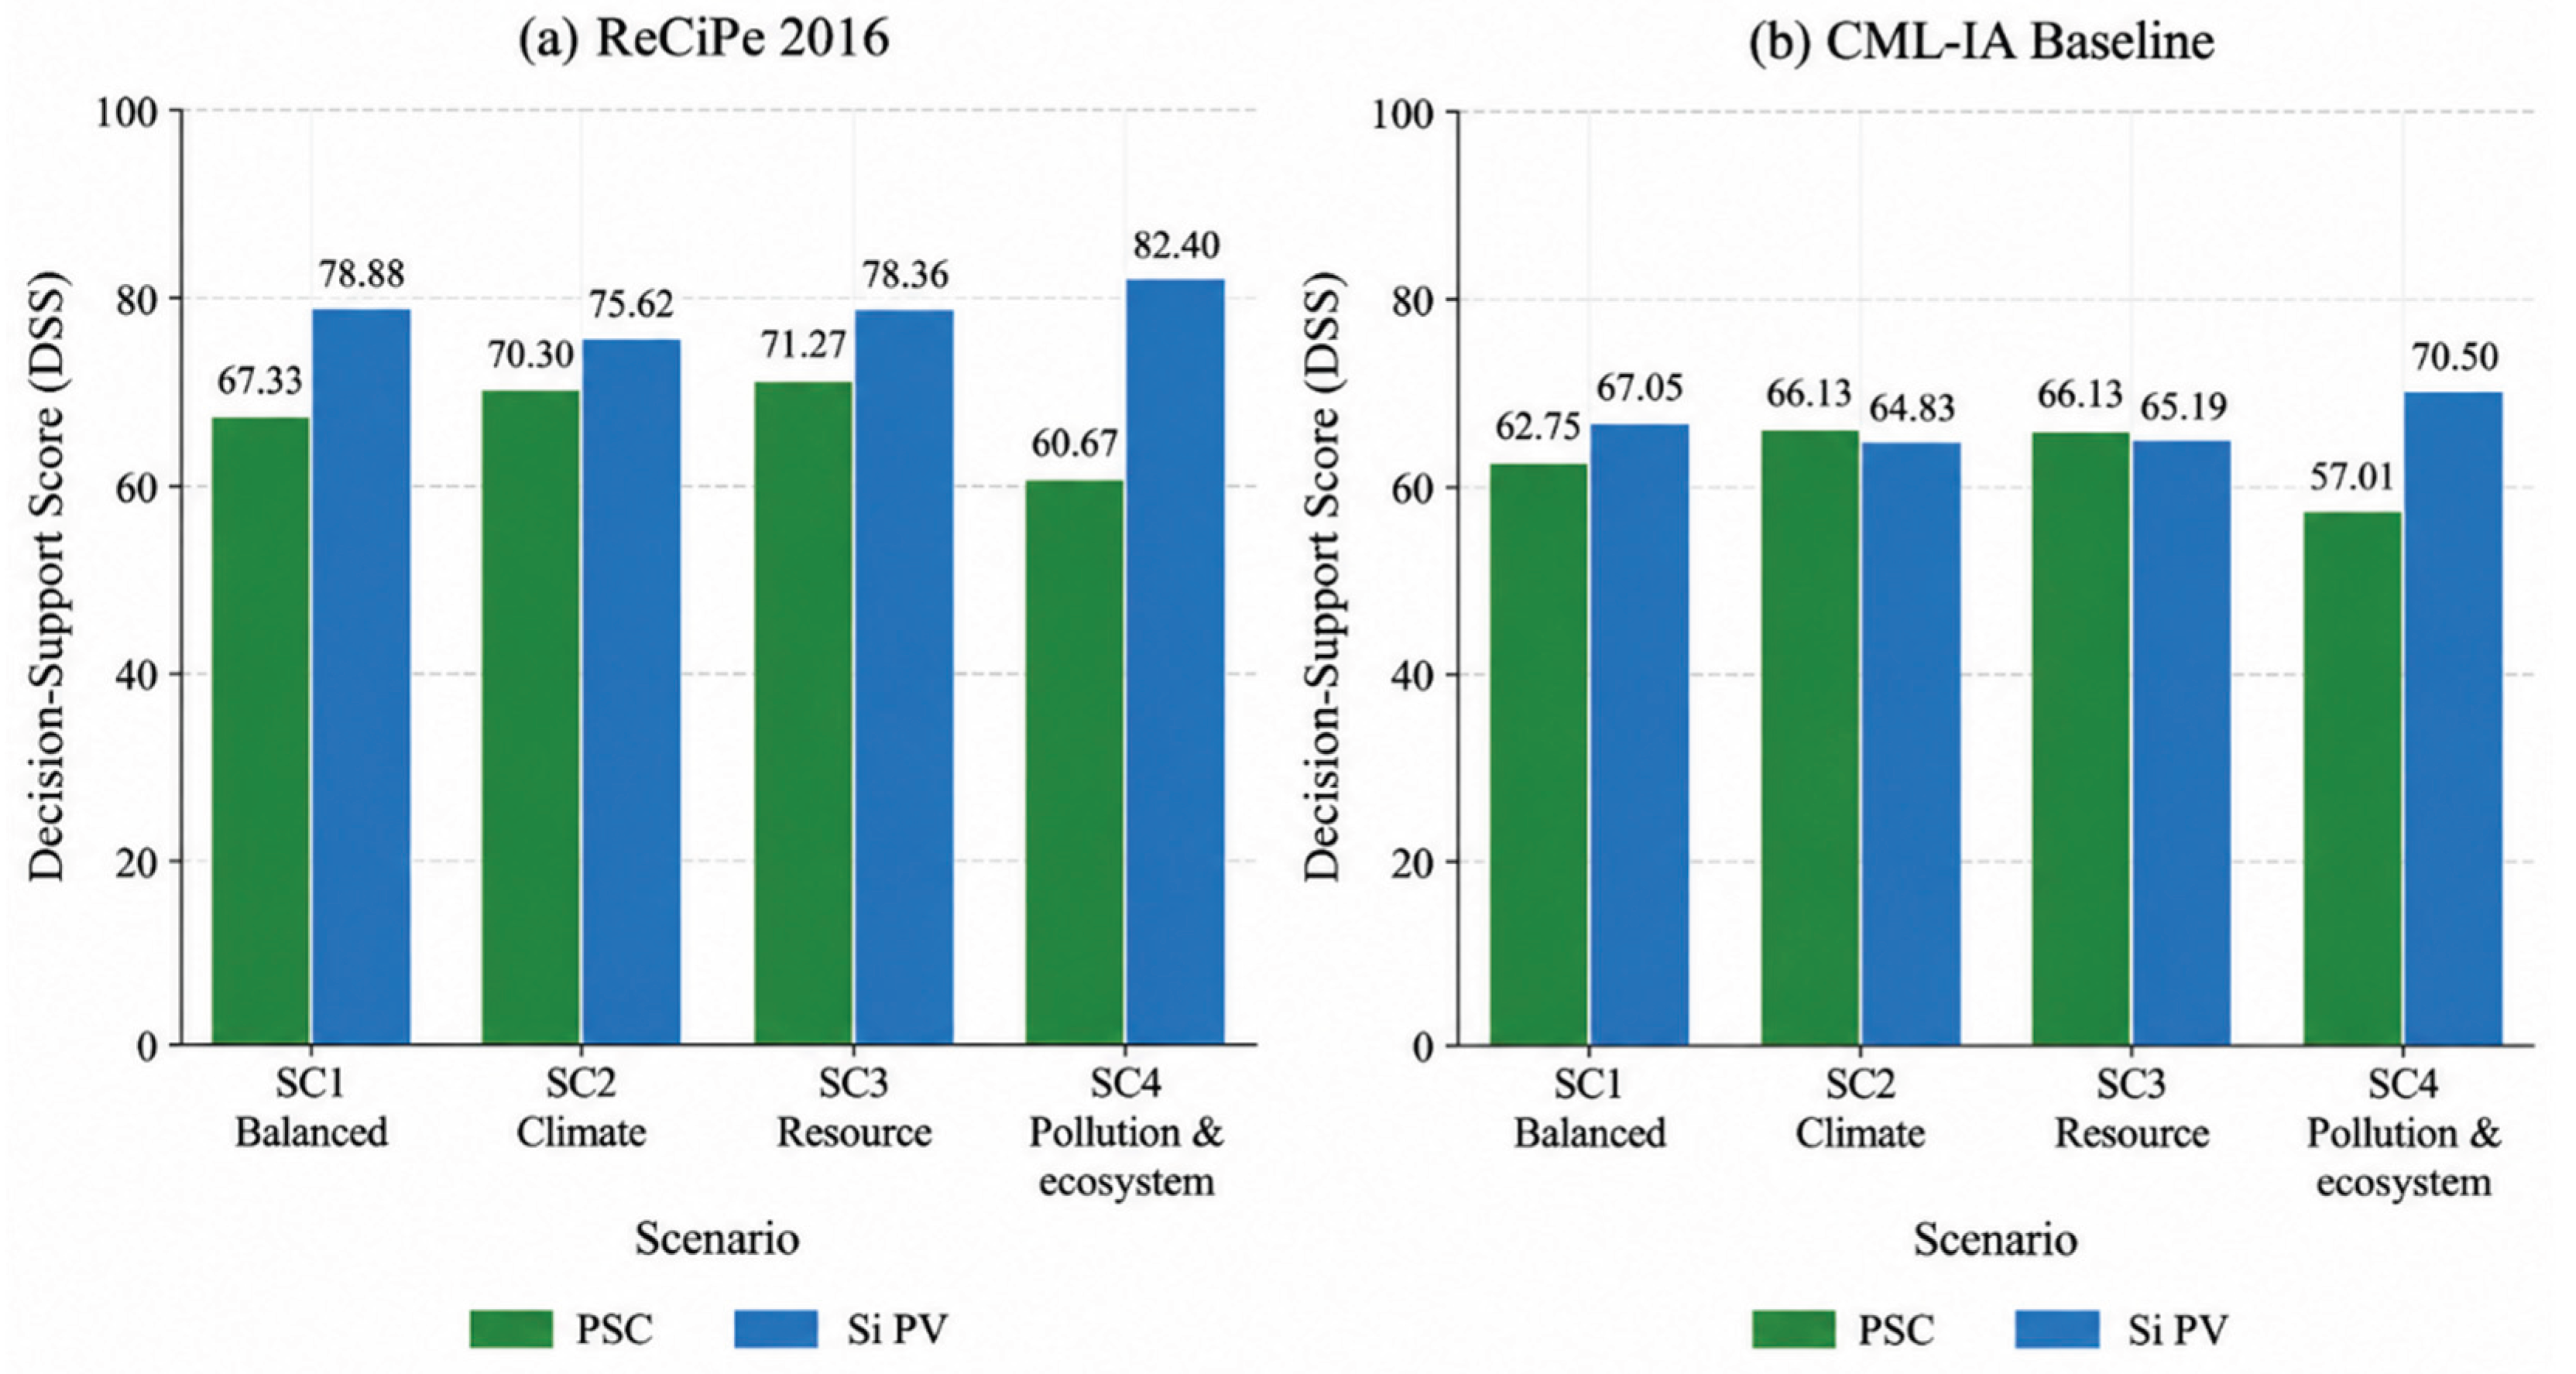

Table 1.
Goal and scope definition.
| Parameter | Description |
| Study type | Comparative LCA |
| Technologies | Perovskite PV and silicon PV |
| Functional basis | 1 m² photovoltaic system |
| LCA software | OpenLCA |
| LCIA methods | ReCiPe 2016 Midpoint (H); CML-IA Baseline |
| Life-cycle stages | Production, use, EoL |
| EoL options | Recycling, reuse, recovery, disposal |
| Decision-support approach | Normalization, weighting and sensitivity analysis |
Table 2.
Operational parameters adopted for the PSC and Si PV systems.
| Parameter | Unit | PSC | Si PV |
| Functional basis | m² | 1 | 1 |
| Assumed operational lifetime | years | 15 | 30 |
| Conversion efficiency | % | 22 | 21 |
| Annual solar irradiation | kWh m⁻² year⁻¹ | 1700 | 1700 |
| Annual electricity generation1 | kWh m⁻² year⁻¹ | 374 | 357 |
| Lifetime electricity generation2 | kWh m⁻² | 5610 | 10,710 |
| Fuel consumption during operation | - | 0 | 0 |
| Direct operational emissions | - | 0 | 0 |
| Maintenance requirements | - | Low | Low |
1 Annual electricity generation was calculated from the product of annual solar irradiation and the assumed conversion efficiency. 2 Lifetime electricity generation was calculated by multiplying annual electricity generation by the corresponding operational lifetime.
Table 4.
EoL material quantities and management routes considered for the PSC and conventional Si PV systems.
Table 4.
EoL material quantities and management routes considered for the PSC and conventional Si PV systems.
| Material/component1 | PSC quantity (g m⁻²) | PSC EoL route | Si PV quantity (g m⁻²) | Si PV EoL route |
| Glass | 5,000 | Recycling | 7,500 | Recycling |
| Gold (Au) | 2.5 | Material recovery | — | — |
| Silver (Ag) | — | — | 8 | Material recovery |
| Aluminum (Al) | — | — | 1,200 | Recycling |
| Silicon (Si) | — | — | 450 | Material recovery |
| EVA | 700 | Recovery/disposal | 1,100 | Recovery/disposal |
| Lead iodide (PbI₂) | 1.8 | Specialized treatment | — | — |
| Titanium dioxide (TiO₂) | 0.2 | Material recovery | — | — |
| Spiro-OMeTAD | 0.6 | Specialized waste management | — | — |
| Backsheet (Tedlar/PET) | — | — | 350 | Energy recovery |
Table 5.
Techno-economic and technological parameters considered in the comparative assessment of PSC and conventional Si PV systems.
Table 5.
Techno-economic and technological parameters considered in the comparative assessment of PSC and conventional Si PV systems.
| Parameter | PSC | Conventional Si PV | Assessment relevance |
| Conversion efficiency (%) | 22 | 21 | Electricity-generation performance |
| Assumed operational lifetime (years) | 15 | 30 | Long-term energy generation and durability |
| Production cost | Literature-based/qualitative | Literature-based/qualitative | Manufacturing economics |
| Stability | Lower/under development | High/established | Long-term performance |
| Reliability | Developing | Established | Commercial deployment |
| Manufacturing maturity | Emerging | Commercially mature | Scale-up potential |
| Recycling requirements | Specialized management, particularly for Pb-containing fractions | Established material-recovery pathways | EoL feasibility |
| Commercial scalability | Developing | Established | Market readiness |
Table 6.
Decision-priority scenarios considered in the sensitivity analysis.
| Scenario | Strategic priority | Weighting principle |
| SC1 | Balanced environmental performance | Equal weighting of all selected environmental criteria |
| SC2 | Climate priority | Increased weighting of the climate-related criterion |
| SC3 | Resource security | Increased weighting of the fossil- and mineral-resource-related criteria available within each LCIA indicator set |
| SC4 | Pollution and ecosystem protection | Increased weighting of pollution-, toxicity-, and land-related criteria available within each LCIA indicator set |
Table 7.
Comparative LCIA results for the PSC and conventional Si PV systems.
| LCIA method | Impact category | Unit | PSC | Si PV | Difference, Δ (%)1 |
| ReCiPe 2016 | Global warming, human health | DALY | 1.60082 × 10⁻⁵ | 3.72673 × 10⁻⁵ | −57.04 |
| ReCiPe 2016 | Fossil resource scarcity | USD2013 | 6.51900 × 10⁻¹ | 1.26663 | −48.53 |
| ReCiPe 2016 | Stratospheric ozone depletion | DALY | 2.49728 × 10⁻⁸ | 1.07412 × 10⁻⁸ | +132.50 |
| ReCiPe 2016 | Mineral resource scarcity | USD2013 | 9.85922 × 10⁻³ | 8.07730 × 10⁻³ | +22.06 |
| ReCiPe 2016 | Land use | species·yr | 6.70029 × 10⁻⁸ | 7.84547 × 10⁻⁹ | +754.03 |
| CML-IA | Global warming (GWP100a) | kg CO₂ eq | 1.69065 × 10¹ | 3.96355 × 10¹ | −57.35 |
| CML-IA | Photochemical oxidation | kg C₂H₄ eq | 4.01954 × 10⁻¹ | 6.87392 × 10⁻³ | +5747.52 |
| CML-IA | Terrestrial ecotoxicity | kg 1,4-DB eq | 4.45317 × 10⁻¹ | 5.35266 × 10⁻² | +731.95 |
| CML-IA | Abiotic depletion (fossil fuels) | MJ | 1.18921 × 10² | 2.55241 × 10² | −53.41 |
| CML-IA | Freshwater aquatic ecotoxicity | kg 1,4-DB eq | 1.11193 × 10¹ | 2.41809 × 10¹ | −54.02 |
1 Difference (%) was calculated relative to conventional Si PV according to Equation (11); negative values indicate lower impacts for PSC and positive values indicate higher impacts for PSC.
Table 8.
Normalized environmental performance and baseline Decision-Support Scores (SC1) for PSC and conventional Si PV.
Table 8.
Normalized environmental performance and baseline Decision-Support Scores (SC1) for PSC and conventional Si PV.
| Impact criterion | PSC raw value | Si PV raw value | PSC normalized | Si PV normalized |
| Panel A. ReCiPe 2016 | ||||
| Global warming, human health | 1.60082 × 10⁻⁵ | 3.72673 × 10⁻⁵ | 1.0000 | 0.4296 |
| Fossil resource scarcity | 6.51900 × 10⁻¹ | 1.26663 | 1.0000 | 0.5147 |
| Stratospheric ozone depletion | 2.49728 × 10⁻⁸ | 1.07412 × 10⁻⁸ | 0.4301 | 1.0000 |
| Mineral resource scarcity | 9.85922 × 10⁻³ | 8.07730 × 10⁻³ | 0.8193 | 1.0000 |
| Land use | 6.70029 × 10⁻⁸ | 7.84547 × 10⁻⁹ | 0.1171 | 1.0000 |
| DSS (SC1) | 67.33 | 78.88 | ||
| Panel B. CML-IA Baseline | ||||
| Global warming (GWP100a) | 1.69065 × 10¹ | 3.96355 × 10¹ | 1.0000 | 0.4265 |
| Photochemical oxidation | 4.01954 × 10⁻¹ | 6.87392 × 10⁻³ | 0.0171 | 1.0000 |
| Terrestrial ecotoxicity | 4.45317 × 10⁻¹ | 5.35266 × 10⁻² | 0.1202 | 1.0000 |
| Abiotic depletion (fossil fuels) | 1.18921 × 10² | 2.55241 × 10² | 1.0000 | 0.4659 |
| Freshwater aquatic ecotoxicity | 1.11193 × 10¹ | 2.41809 × 10¹ | 1.0000 | 0.4598 |
| DSS (SC1) | 62.75 | 67.05 | ||
Note: Raw LCIA values and corresponding units are reported in Table 7. Normalized values were calculated according to Equation (4). Under SC1, each criterion was assigned an equal weight of 0.20.
Table 9.
Decision-Support Scores under alternative environmental-priority scenarios.
| LCIA method | Scenario | Strategic priority | PSC DSS | Si PV DSS | Higher-scoring technology | Ordering vs. SC1 |
| ReCiPe 2016 | SC1 | Balanced environmental performance | 67.33 | 78.88 | Si PV | Baseline |
| ReCiPe 2016 | SC2 | Climate priority | 70.30 | 75.62 | Si PV | Unchanged |
| ReCiPe 2016 | SC3 | Resource security | 71.27 | 78.36 | Si PV | Unchanged |
| ReCiPe 2016 | SC4 | Pollution and ecosystem protection | 60.67 | 82.40 | Si PV | Unchanged |
| CML-IA Baseline | SC1 | Balanced environmental performance | 62.75 | 67.05 | Si PV | Baseline |
| CML-IA Baseline | SC2 | Climate priority | 66.13 | 64.83 | PSC | Reversed |
| CML-IA Baseline | SC3 | Resource security | 66.13 | 65.19 | PSC | Reversed |
| CML-IA Baseline | SC4 | Pollution and ecosystem protection | 57.01 | 70.50 | Si PV | Unchanged |
Disclaimer/Publisher’s Note: The statements, opinions and data contained in all publications are solely those of the individual author(s) and contributor(s) and not of MDPI and/or the editor(s). MDPI and/or the editor(s) disclaim responsibility for any injury to people or property resulting from any ideas, methods, instructions or products referred to in the content. |
© 2026 by the authors. Licensee MDPI, Basel, Switzerland. This article is an open access article distributed under the terms and conditions of the Creative Commons Attribution (CC BY) license (http://creativecommons.org/licenses/by/4.0/).
Copyright: This open access article is published under a Creative Commons CC BY 4.0 license, which permit the free download, distribution, and reuse, provided that the author and preprint are cited in any reuse.