

Submitted:
17 September 2026
Posted:
18 September 2026
You are already at the latest version
Abstract
Suppose three things come true. Everyone has thinking machines better than the best human expert in every field, running for about the cost of the electricity. Every household can build the physical goods of modern life from raw materials. Rooftop and backyard solar supplies the power for both. This paper works out who still gets paid in that world. Anything that can be produced by thinking alone becomes cheap, because anyone can make their own copy. Money keeps flowing to three kinds of things that thinking cannot produce: physical stuff that one person's use takes away from another (land, minerals, energy, water); permission granted by law (licenses, approvals, the right to connect to the grid or a payment system); and wanting a specific human being. Five results follow. Income from selling thinking disappears. A company can shrink to one person while still controlling huge physical assets. App stores lose their business of selling tools but keep their business of connecting people and granting permission. A household can make only what its own land, sunlight, water, and materials allow. And the income that thinking used to earn moves to whoever owns the land, materials, and permissions. Rules about who may enter, connect, and operate therefore become the main thing that decides who benefits. A calculation with U.S. data sizes the land that still binds. At today's farm yields and national energy use, feeding and powering a household of 2.5 people on a vegan diet takes about one acre, roughly five times the median lot of a new single-family house sold in 2024. Better technology shrinks that requirement, and the paper shows by how much it must shrink: one median lot is enough once the land needed for food falls about tenfold and energy use falls by about half.
Keywords:
artificial intelligence
; economic rent
; land
; scarcity
; political economy
; governance
; scenario analysis
1. The Question
If thinking becomes free, who still gets paid?
Business writers call a lasting advantage that keeps competitors away from a company’s customers a moat, after the water-filled ditch around a castle. For many businesses today the moat is expertise: they sell thinking that their customers cannot do for themselves. The title asks what happens to that moat when anyone can have the thinking for the cost of electricity.
To make the question precise, the paper assumes three conditions are true and then follows the consequences.
Condition 1. Every person has thinking machines better than the best human in every field that pays, at a running cost close to the cost of the electricity. That includes the ability to train and adjust their own machines.
Condition 2. A household-sized fabrication system can make the physical goods of modern life, as long as it has enough raw material, energy, space, and time.
Condition 3. Household solar panels can power Conditions 1 and 2, as long as the household has enough surface area facing enough sunlight.
These conditions are deliberately extreme. Extreme assumptions make the logic easy to see, the same way a physics problem that ignores friction shows the basic motion clearly. The paper assigns no date and no probability to these conditions. It asks what follows if they hold.
Notice what the conditions leave out. Condition 2 says a fabricator can make a phone. It says nothing about whether a given household has the land, the sunlight, or the gallium (a metal used in computer chips) to make one. Condition 2 also covers building robots to carry out designs, but the robots still need matter, energy, a place to work, and legal permission to operate. The word “free” in the title means that thinking costs only the electricity it uses.
Every claim below depends on these three conditions. Once they are granted, the results follow directly, so the paper states them directly.
The question matters now because of how much money is being spent to build toward Condition 1. Five large technology companies spent more than $400 billion on capital investment in 2025 and were expected to raise that by roughly 75 percent in 2026, and broader estimates put global AI-related investment above $1 trillion for the year [1,2]. It is worth asking what that spending buys if it fully succeeds.
Most economic research on AI studies the path along the way: which jobs get automated and how the split of income between workers and owners shifts [3,4]. Closer to this paper, Papadogiannis [5] separates cheap technology from cheap living and lists the shortages that remain, and Yang et al. [6] apply to digital platforms Henry George’s nineteenth-century argument that the gains from progress flow to whoever owns the land. This paper goes to the endpoint itself and asks three things. Which kinds of income survive? How do companies change shape? And how much physical endowment does a household need before cheap intelligence actually makes it self-sufficient?
The companies building toward this endpoint face a trap. A company that stops building loses to a competitor that keeps going. A company that keeps building destroys the scarcity its own profits depend on. Each year, each company chooses the distant loss over the immediate one. Each choice makes sense on its own. Together, the choices can end the business model.
For everyone who does not own those companies, this is mostly good news. The rest of the paper works out how good, where the limits are, and who ends up holding power.
2. How the Argument Works
The paper assumes the three conditions and then examines every kind of income one at a time. The thing being examined is a claim: any right to be paid, such as a software license, a patent, a medical license, a deed to land, or a share of stock. For each claim the paper asks two questions.
- 1.
- Can a buyer use Condition 1 to make something that does the same job, on their own, without buying it?
- 2.
- If so, can anyone legally or physically stop them from using it?
If the answer to the first question is yes and the answer to the second is no, the claim stops earning money. If either answer goes the other way, some income survives, and the paper asks where it goes.
The U.S. food-and-energy calculation in Section 11 checks the size of one thing a household still needs, namely land. It uses real public data, and every step of the arithmetic is shown in Appendix A.
If the paper’s mechanism is already starting to operate, several things should be visible before the endpoint arrives. These are the paper’s predictions for the transition period:
- Prices for work that machines can do should fall relative to the prices of land, energy, and materials.
- The number of employees a company needs should track less closely with the value of the assets it controls.
- Investment and acquisitions should shift toward land, power generation, minerals, grid connections, payment systems, and licenses.
- The prices of those assets should rise in anticipation, before the endpoint arrives.
- The value of a license should rise where the licensing gate stays tight, and fall where people can easily do the work privately or move to another jurisdiction.
3. Two Kinds of Things
Rival and non-rival
Some things get used up. If I farm an acre, you cannot farm the same acre at the same time. If a surgeon spends an hour on my operation, that hour is gone for you. Economists call these things rival: my use takes them away from you. Land, sunlight falling on a particular roof, a surgeon’s hour, and the gallium in a particular piece of ore are all rival.
Other things do not get used up. A mathematical proof works just as well for a million people as for one. So does a design, the structure of a molecule, or a piece of software. These things are non-rival: any number of people can use them without taking anything away from each other.
Rivalry alone does not set a price. Two more facts matter. First, can someone make their own substitute? Second, can anyone stop them from using it? A thing is excludable when its owner can actually stop others from using it, whether by a lock, by technology, or by law. A patent, for example, is legal exclusion: it lets the patent holder stop you from selling a drug even if you invented the same drug yourself. And a rival thing can still be free when there is far more of it than anyone wants, like air.
Generable outputs
Call an output generable when a buyer can use Condition 1 to make something that does the same job on their own. A legal memo, a piece of software, a drug design, and a tutoring session are all generable under Condition 1. Generable describes the ability to make a working substitute. The buyer does not need to copy anyone’s protected work or learn anyone’s secret.
Making a substitute on your own still costs something. The cost has two parts. Write the total as
Here is each piece of Equation (1).
- x(“ex”).
- A label for one particular product or service, such as “a contract review” or “a phone app.” Every symbol with a small x attached refers to that one product.
- (“c sub x, A-I”).
- The total cost for a buyer to make their own substitute for product x using Condition 1. The letter c stands for cost. The small x below says which product. The small above says the substitute is made with artificial intelligence rather than bought from a seller. It is the buyer’s do-it-yourself price.
- (“epsilon sub x”).
- The cost of the computing itself, which under Condition 1 is essentially the electricity bill for the machine while it works on product x. The Greek letter epsilon is traditionally used for a small quantity, and this cost is small.
- (“m sub x”).
- Every other cost that the buyer cannot avoid, even with perfect machines. The letter m is a reminder of materials, but it covers four things: (1) rival physical inputs, such as the metal in a device or the energy to run a factory; (2) a physical body to do the work, such as a robot or an instrument; (3) someone who takes legal responsibility for the result, such as an inspector who signs off; and (4) any license or permission the law requires. Thinking cannot produce any of these four.
- What Equation (1) says. Making your own version of anything costs the electricity for the thinking plus whatever physical stuff, responsibility, and permission the job still requires.
- Why it matters. It splits the cost of every product into the part that intelligence makes nearly free () and the part that intelligence leaves alone (). The rest of the paper follows what happens to each part.
What competition does to price
Now suppose a seller offers product x. If the law allows anyone to make a substitute, or if nobody can actually catch people doing it privately, then no seller can charge much more than . A buyer facing a higher price would make their own. Competition among sellers therefore pushes the price down toward that do-it-yourself cost:
Here is each piece of Equation (2).
- (“p sub x”). The price a seller charges for product x. The letter p stands for price.
- ⟶ (“is pushed toward”). The arrow means that competition drives the quantity on the left toward the quantity on the right over time. It describes a direction of movement.
- (“c sub x, A-I”). The buyer’s do-it-yourself cost from Equation (1).
What Equation (2) says. No seller can keep charging more than it would cost the buyer to make the thing themselves.
Why it follows. A buyer who can make a working substitute for does so whenever a seller asks for more, so sellers who want customers compete their prices down to that level.
Why it matters. It puts a ceiling on every price. The next step asks how much of what sits under that ceiling pays for thinking.
Equation (1) says what is made of. Replacing with gives , and subtracting from both sides gives
Here is each piece of Equation (3).
- (“m sub x”).
- The same unavoidable non-thinking costs defined above: materials, a physical body to do the work, legal responsibility, and permission.
- (“p sub x minus m sub x”).
- What is left of the price after paying for those unavoidable costs. This is the part of the price that pays for the thinking: the expertise, the analysis, the design work.
- (“epsilon sub x”).
- The electricity cost of the computing, as defined above.
What Equation (3) says. The part of any price that pays for thinking gets pushed down to the electricity bill.
Why it matters. It tells you which prices collapse and which survive. If is tiny, as with a legal memo or an app, the whole price collapses toward the electricity cost. If is large, as with surgery or a mine, a large price survives, but the money now pays for the materials, the energy, the responsibility, and the permission.
Many costs that look like operations already sit close to today. Copying a file, storing it, sending it, formatting it, keeping records, and processing a transaction cost a computer a tiny amount of electricity. They look expensive only because people currently do the judgment work around them. Condition 1 moves that judgment work to as well. So anything that is information all the way down, with no rival matter, legal responsibility, or permission inside it, has a do-it-yourself cost of and nothing else.
One more term is needed. Scarcity rent, or simply rent, is the extra money a seller collects because buyers cannot easily get the thing anywhere else. It is the part of the price above the cost of producing it. A landlord’s rent includes some of this; so does the premium a famous lawyer charges. Equation (3) says the scarcity rent on thinking goes to zero.
Result 1. Under Condition 1, wherever the law allows people to make their own substitutes, or cannot catch them doing it, the money earned by selling thinking disappears. Payment continues only for the parts of a product that thinking cannot supply and for gates that the law can actually enforce.
The condition in Result 1 about the law is important. Copyright and trade secrets lose their force when someone makes a substitute independently, without copying anyone’s work or stealing a secret. Patents and professional licenses keep their force: a patent still forbids selling an independently invented drug, and a medical license is still required to practice medicine, however capable the machine. Whether those rules survive depends on whether anyone can see the violation and enforce against it. Where the law keeps a gate, what the buyer pays for is permission.
Everything that follows builds on Result 1. Copies stop being scarce. Physical inputs and enforceable permissions stay scarce. Each remaining section applies that split to a different part of the economy.
4. What Loses Its Protection
Result 1 sorts sources of income, not whole industries. Medicine, law, and software all keep existing. The question for each industry is which of its inputs cannot be generated.
Physical work needs careful handling, because the intuitive answer is wrong. It is tempting to think that hands-on work, such as surgery, nursing, mining, or welding, is protected because it is physical. It is not. A machine that performs surgery is a design built out of matter and powered by energy. Under Condition 1, the design can be generated. The matter and the energy are rival. The authority to operate the machine comes from law. So physical work breaks down into the same leftover pieces as everything else. A surgeon’s hands carry no special protection as hands. Whatever scarcity attaches to an operation attaches to the instruments, the energy that runs them, and the license that permits the operation.
The paper sorts those leftover pieces into three types.
Type M: matter and energy. Rival physical inputs: chemical elements, raw materials, land and sites, water, sunlight, and the physical body of any machine.
Type P: permission. A right to operate granted by law or by an institution: a professional license, a drug approval, accreditation, the right to appear in court, code signing that lets software run on a device, and any similar government-granted right.
Type H: a specific human. Value that depends on a particular person or on relative position: someone’s identity, their consent, their relationships, membership in a group, their attention, or ranking above others.
Type H cannot be generated by any machine. How much money it carries is a question for data. A degree is valuable partly because other people lack it. A deal requires the consent of the particular person on the other side. A firm’s relationships with particular judges, regulators, and counterparties are Type H as well; the old line that a good lawyer knows the law and a great lawyer knows the judge describes an advantage no machine can copy. Some patients will want a human doctor, the way some buyers want a hand-thrown pot. Each of these is a preference or a position, and a machine’s ability has no bearing on it.
Table 1 sorts major industries by these three types.
Two rows show how the split plays out.
The university does four jobs: teaching, research, choosing who gets in, and granting degrees. Teaching can be generated. Under Condition 1, every student has a tutor better than the best professor, endlessly patient, for pennies. Theoretical and computer-based research can be generated the same way.
A degree today bundles three different things. The first is information: it tells an employer that the holder learned something, and it carries weight because earning one is costly and the university’s name vouches for it [7]. The second is position: a degree is worth more when fewer people have one. The third is membership: it admits the holder to a network of classmates and alumni, and it can mark the family money that paid for it.
Condition 1 strips out the first. A machine can test directly and reliably what a person knows and can do, and designing, running, and scoring that test is more thinking. Once anyone can take a trustworthy test, the university’s name adds nothing to what the result says, and the university loses its hold on credentialing. Position survives, and it attaches to the test result: a top score is still scarce, because ranking above others is Type H, and that scarcity belongs to the person who earned the score. Membership survives too, and it is what the university keeps: its network and its class of graduates, which are Type H. It also keeps accreditation where the law requires a degree for a license, which is Type P, and its physical labs, which are Type M. The university loses its income from teaching, credentialing, and research design, and keeps its labs and its funders only as long as funders see no cheaper way to buy research.
Academic publishing loses its copy business more cleanly than any other industry in the table. Authors write the papers for free, reviewers evaluate them for free, and the public often paid for the research. The publisher then charges readers to see the result. Copying, formatting, storage, and distribution already cost close to from Equation (1), the electricity bill. Condition 1 moves the rest of the work there too: reviewing, selecting which papers matter, keeping records of who wrote what, and long-term archiving. So the do-it-yourself cost of publishing a paper, and of reviewing and archiving it, goes to . What remains of a journal’s name is thin. Its reputation rests on the quality of its selection, and machines select as well as any editor, so trust in the name becomes a commodity. What stays scarce is Type H: the limited attention of readers. A journal can still be paid for the attention it commands, if it commands any, the way a social network is: as a place people use to reach other specific people, which Section 6 shows is the kind of business that survives.
How long permission lasts
Type P carries most of the professional income that survives. How long it lasts depends on enforcement, on whether people can do the work privately, and on whether they can leave.
A license gate holds while licensed work is at least as good as unlicensed work. The government is then just certifying quality, and following the rule costs citizens nothing in results. The gate weakens once the unlicensed option is clearly better. The government must then force its own citizens to accept worse outcomes, and citizens who can travel will go somewhere that does not. Medical tourism already shows this happening. People travel abroad today for cheaper or faster care. The gap this scenario describes, between a licensed human and a clearly better machine, is far larger than those differences, so the pull to leave would be far stronger. A license keeps out competitors inside the country. People who can cross a border to get a better result are outside its reach.
This makes permission income uneven over time. It is likely highest early, while machine performance is still disputed and a licensing board can credibly say it is protecting the public. It likely falls as machines pull clearly ahead, because the same rule then looks like a requirement to receive worse care. The professions’ defense is strongest when they need it least and weakest when they need it most.
Type M lasts, and Section 7 develops it. Type H lasts too, and is small.
The overall pattern is consistent. Where income came from controlling something that can be reproduced, whether mental or physical work, the income collapses. Where income came from rival matter, an enforceable permission, or demand for a specific person, a smaller business survives. The work itself continues. What disappears is the money that came from the scarcity of thinking. Owners of the scarce leftovers can capture part of the productivity gain, but they collect it as owners of land, materials, or permission.
Which locations keep their value
Real estate shows how uneven the sorting is. Land is rival, so it always stays Type M. But most of a location’s price comes from what can happen there, and Condition 1 changes what can happen. Two kinds of location keep their value: places that people’s bodies have to reach, and places that sit behind a physical or legal gate. Land whose value came from a business that can now be generated or bypassed loses much of it. Several kinds of property sort differently once they are run through the three types.
Corner stores and neighborhood restaurants. These keep their value most clearly. A busy neighborhood corner with a convenience store or a fast-food restaurant sits where people already travel for food, and that traffic marks where people live and eat. Such a site is a natural last-mile node for storing food and dispatching delivery machines to the homes around it. Its value rests on the location, cold storage, power, and permission to operate, and Section 7 describes the network these sites belong to.
Cell towers. A tower sells height, a zoning permit, and space for radios on licensed frequencies. Neighborhood mesh networks, in which home radios pass signals from one to the next, are a weak substitute, because the useful frequencies are licensed and every mesh still needs a path to the wider network. Satellites that connect directly to phones are the stronger threat, because they bypass the tower altogether. The height and the permit are thinner protection than they look.
Data centers. The computing in Condition 1 has to run in buildings somewhere, so data centers keep a business. The particular site matters little: a data center goes wherever power is cheap and a grid connection is available. Its value sits in the power contract and the grid connection, which are scarce while connection queues run years long and grow less scarce as grids expand. A data center where many networks physically connect to one another is a different case. It is a place that different networks have to reach in order to reach one another, and it keeps its value for the same reason that connections to specific people keep theirs in Section 6.
Shopping malls. The mall as a business declines as households make more of their own goods. The land underneath can keep its value: a large parcel with road access near dense population is a natural site for the grocery-scale depots described in Section 7, or for housing and mixed use.
Self-storage. Storage sites have good access to where people live, which helps. Home fabrication pulls the other way: people who make things on demand and recycle them own less to store.
Casinos. A regional casino in a place people would otherwise avoid rests on its gaming license and little else. A destination such as the Las Vegas Strip combines a place people travel to on purpose with some of the tightest permission gates in the economy, Type H and Type P together.
Senior housing and medical buildings. Senior housing charges mostly for care, and care is work that machines take over; the land under it is ordinary. Medical buildings near dense population, in places where a new facility needs a government permit, keep more.
Land with oil and water rights. Oil royalties are exposed to electrification. Water rights in a dry region are about as rival as a claim gets.
The pattern matches the rest of the paper. The part of a location’s value that came from thinking, or from a business that can now be generated, loses its scarcity. The part that came from bodies that must arrive, or from a gate someone controls, keeps it. Electricity splits the same way: generation spreads onto roofs, while the network that moves bulk power between places stays a gate.
5. A Company of One That Owns a Mine
Why do companies exist at all? The classic answer is that doing everything through the open market is expensive. You have to find partners, negotiate, write contracts, check the work, and enforce the deal. Inside a company, a manager can simply tell people what to do, which replaces some of those costs with the cost of managing [8]. Condition 1 makes both kinds of cost cheap, because machines can search, negotiate, draft, monitor, and manage. So cheaper deal-making alone does not settle where companies end.
The useful split is between inputs a company can generate and inputs it has to obtain from someone else. A programmer, an analyst, a database query, a legal draft, or a software license can all be generated without dealing with anyone. A parcel of land, a mineral right, a grid connection, a slot at a port, an insurer’s capital, or a specific person’s agreement cannot. When an invention becomes available to everyone, the value tends to go to whoever owns these hard-to-get supporting assets [9].
Result 2. Wherever machines supply the thinking, the coordination, and the supervision, the number of people a company needs can fall toward one. The amount of rival physical assets one company controls does not have to fall with it, and may grow.
This clears up an apparent contradiction. Under the three conditions, a mining company needs very few people, and it still controls an enormous ore body, a railroad, a port, and a set of permits. A one-person company can run a large organization made of machines. “Company size” therefore splits into two separate numbers: how many people work there, and how many assets it controls. Free intelligence shrinks the first number. By itself, it leaves the second number alone.
A popular prediction says corporations will dissolve once intelligence is cheap. Corporations survive. For companies whose only advantage was being smart, the outcome is worse than that prediction: their business disappears. A corporation that holds a mineral right, a grid connection, a radio spectrum license, a payment network, or a port survives Result 1, and its bargaining power may grow as its competitors lose their intellectual edge.
6. The App Store Empties
The main business built on selling copies is the platform, such as an app store. Picture it as a network. Users sit on one side and developers on the other. Mathematicians draw a network as dots joined by lines. The dots are called nodes, and the lines are called edges. The word comes from geometry, where an edge is the line where two faces of a solid meet; in a network, an edge is the line where two parties meet. Here the nodes are users and developers. Each time a user gets something from a developer through the platform, that connection is an edge, and the platform charges a fee on it.
There are two kinds of edges, and they behave differently under Condition 1.
- A tool edge is a user getting something that can be generated, such as an app, a template, or a filter, from a developer.
- A coordination edge is a user reaching another specific person: paying them, buying from them, being read by them, getting their agreement, or relying on who they are.
Write the platform’s revenue as
Here is each piece of Equation (4).
- V
- (“vee”). The platform’s total revenue, in dollars per year. The letter V stands for value collected.
- (“E sub U-D”). The set of all tool edges. E stands for edges. The subscript means “user to developer.”
- (“the number of tool edges”). The vertical bars mean “count the members of the set.” So is how many times per year users obtain a tool through the platform.
- (“kappa sub U-D”). The average fee the platform charges on each tool edge. Kappa is the Greek letter k, used here for the toll.
- (“E sub U-U”). The set of all coordination edges. The subscript means “user to user.”
- (“the number of coordination edges”). How many times per year users reach another specific person through the platform.
- (“kappa sub U-U”). The average fee the platform charges on each coordination edge.
What Equation (4) says. A platform’s revenue equals the fee per tool sale times the number of tool sales, plus the fee per person-to-person connection times the number of those connections.
Why it matters. It splits the platform into its two businesses, so each can be followed separately once Condition 1 arrives.
Now apply Condition 1. Every user can generate the tools they used to buy. The user and the developer become the same person. The tool edge now runs from the user back to themselves: it becomes a loop. An open platform cannot charge a fee on a loop, because no second party is involved. The number of chargeable tool edges falls toward zero, and the first term of Equation (4) disappears:
What Equation (5) says. The arrow again means “is pushed toward.” On an open platform, revenue shrinks until only the person-to-person business is left.
Why it matters. Tools can be generated, but other people cannot. So the platform’s business of selling tools dies, and its business of connecting people survives.
A controlled platform has one more option: charge for permission to run tools the user made themselves. Code signing, device rules, identity checks, and licensing turn the loop back into a gate the platform can charge for. The app store’s tool-selling job empties out. Its jobs as gatekeeper and payment processor remain. Figure 1 shows the four cases.
Office software becomes something a person describes out loud for one afternoon’s use and then throws away. Processing a payment, checking an identity, settling a trade, and keeping a trusted record of where something came from are all computation, so their do-it-yourself cost is . What remains is the part that is permission or another person: legal access to a payment network, legal recognition of an identity, permission to reach a controlled device, and an audience of specific people. Those surviving functions become more concentrated, because there are fewer edges left and everyone still has to cross them.
7. What a Household Can Actually Make
Condition 2 promises that a household can print its own phone. That promise has a physical limit.
Two pieces of notation make the limit precise.
- (“omega”). Everything rival that a household can legally use: the land and roof area it controls, the sunlight falling on that area, its water, the materials it can recover, whatever stocks of goods it already owns or inherited, and any access rights it can enforce. Omega is the last letter of the Greek alphabet, used here for the household’s complete starting endowment.
- (“tau”). The shared technology available to everyone under the three conditions: the thinking machines, the fabricators, and the solar panels. Tau is the Greek letter t, for technology. Every household has the same .
- (“script A of omega, given tau”). The full list of goods a household can make from its own endowment using the shared technology . The curly stands for achievable. The semicolon separates the two inputs by role: is what differs from household to household, and is what every household shares.
Result 3. Conditions 1 through 3 improve the shared technology for everyone. They leave each household’s endowment exactly as unequal as it was. A household is self-sufficient only in the goods on its list .
The reason is simple. A fabricator rearranges matter. Chemistry moves atoms between molecules, and it can only work with atoms the household already has. Turning one element into another takes nuclear reactions, at energies millions of times higher than ordinary chemistry, which lies outside the three conditions. Intelligence finds more substitutes and recovers materials more efficiently. It never produces an element out of nothing.
Modern technology uses a very wide range of materials. A modern computer chip uses more than sixty elements, and for several important metals no adequate substitute exists today in their major uses [10]. That number describes today’s designs, which pick whatever elements give the best performance at the lowest cost in a world with cheap global trade. It is a poor guide to what a household actually needs. A working computer can be built from far fewer elements, and machines better than the best materials scientists keep finding designs that swap a scarce element for a common one at a small cost in performance. The minimum set of hard-to-get elements for a given job shrinks under Condition 1, and each household can choose the design that fits the elements it has.
The limit does not disappear. Some elements have no workable substitute in some jobs, and at the bottom of the list there is always a smallest set a design needs. Demand then concentrates on that irreducible set, so its prices tend to rise even as demand for the elements that get designed out falls. What binds is how much of those few elements a household can actually recover with the energy, equipment, and legal access it has. The question of whether a trace of an element exists somewhere in its soil is beside the point.
A household with no recoverable gallium, for example, cannot build a design that truly needs gallium unless it recycles gallium from something it already owns or trades for it. Usually the machines will find a design that avoids gallium. Where they cannot, missing matter stays missing, because no machine can copy an atom it does not have.
Long-distance trade therefore shrinks compared with today’s economy. Much of what households need, both mental work and fabricated goods, gets made at home, and a smaller set of material and legal connections to the outside remains. Those few connections become powerful when a small number of owners control them, when substitutes are poor, when people cannot do without them, and when newcomers cannot enter. Being essential alone gives no monopoly. Being essential while sitting at a chokepoint does.
Self-sufficiency is a limit, not a forecast. Sunlight, soil, climate, and water differ from place to place, and it makes little sense for every household to grow its own apples, oranges, and bananas. Households still gain from regional and community production, and perishable food has to travel short distances quickly. Alongside the shrinking long-distance trade, a layered local network grows: regional farms and greenhouses at the top, grocery-scale depots in the middle, and a dense last-mile layer of small sites that store food and dispatch delivery machines. The best last-mile sites are the ones people already travel to for food, such as busy neighborhood corners now occupied by fast-food restaurants and convenience stores, because that traffic marks where people live and eat. What those sites need is rival and legal: the location itself, cold storage, power, and permission to run delivery machines. Their owners join the list of those who collect the rent.
A household that makes most of what it needs has kept its dependence and moved it. All of it now sits on the few inputs outside its list . The terms on those few connections decide how well the household lives, because everything the household makes depends on them.
8. Where the Money Goes
Result 1 wipes out the scarcity rent on thinking that anyone can generate. Two things follow. First, everything whose cost contains thinking or fabrication gets cheaper, including the machinery, fertilizer, processing, and panels that go into food and energy; the direction is certain even though the size is not. Second, the rival inputs themselves are the exception. Their prices can move either way: better intelligence lowers demand for some materials by finding substitutes, and raises demand for others by finding new uses. Land that still binds is the main case where prices can rise.
Split all scarcity rent in the economy into two parts:
Here is each piece of Equation (6).
- (“rho”). The total scarcity rent in the economy: all the extra money, above production costs, that sellers collect because buyers cannot get things elsewhere. Rho is the Greek letter r, for rent.
- (“rho sub G”). The part of that rent earned from the scarcity of thinking: the premium for expertise, analysis, design, and other work that Condition 1 makes generable. G stands for generable.
- (“rho sub C”). The part of that rent earned by everything thinking cannot produce: the Type M, P, and H leftovers from Section 4. C stands for complements, meaning the other inputs that thinking has to be combined with to produce anything.
What Equation (6) says. All scarcity rent comes either from thinking or from the other inputs thinking needs.
Why it matters. Result 1 acts on only one of the two parts, so splitting them shows which part disappears and which part is left to absorb the money.
Result 1 says what happens to the first part:
What Equation (7) says. The rent earned from the scarcity of thinking is pushed toward zero. This is Equation (3) applied to the whole economy at once.
Why it matters. Once is gone, any scarcity rent that still exists has to be in . That is where the surviving money goes.
Lower prices pass much of the productivity gain on to users. The rest ends up in the price of the inputs whose supply cannot expand. Figure 2 shows this shift for a single product.
David Ricardo worked out this mechanism for farming in 1817. Improve farming methods, and part of the gain shows up as higher land rent, because the amount of land is fixed while the better method spreads to everyone [11]. Henry George extended the idea in 1879 to explain why an age of astonishing invention still had widespread poverty: the gains from progress flow disproportionately to whoever owns the input that progress cannot reproduce [12].
The same logic applies here, with generable thinking playing the role of the better farming method. The effect is much broader than in Ricardo’s case, because Condition 1 reaches every kind of mental work at once. It is a tendency, and the owners of land and permission capture a share of the gain. How much becomes lower prices for users and how much goes into land, resources, infrastructure, or permission depends on product prices, substitution, policy, and changes in who owns what.
George published the mechanism in 1879. The current investment program is rediscovering it at a trillion dollars a year.
What counts as “land” once thinking is no longer scarce? It includes literal ground and mineral deposits. It also includes complements fixed in supply by institutions: grid connections, radio spectrum, ports, access to payment systems, and licenses that limit who may enter.
9. Rules at the Remaining Gates
Which institutions survive when the value of generable thinking collapses? The test is to remove the scarcity of information and see which income remains.
Companies holding mineral rights, power plants, grid connections, ports, spectrum, satellite orbital slots, land, trusted networks, and insurance capital pass the test. Result 2 lets those claims stay under concentrated control even as the human staff running them shrinks.
Governments pass the test even more clearly. A government is defined by authority over territory and the power to enforce rules inside it. Territory is rival, and enforceable authority over it is the original chokepoint. A government’s paperwork can be generated and becomes cheap. That makes government administration need fewer people. Government authority over territory stays.
So the importance of rules grows as the importance of technical skill shrinks. When capability itself is cheap and copyable, the rules at visible checkpoints decide who can turn that capability into legally recognized action. A licensing rule, a grid connection requirement, an accreditation standard, a spectrum allocation, or a rule about who may access a payment system can serve a real safety or coordination purpose and also keep competitors out. Either way, the money question is the same: does the rule make permission scarce, who collects the value of that scarcity, and how easily can users go to another jurisdiction or system?
Result 4. As generable capability gets cheaper, permission becomes relatively more valuable wherever activity has to pass through a visible checkpoint and the supply of permissions is limited. The effect is weakest where people can easily do the work privately or move elsewhere, and strongest where operating requires passing through a public gate with no alternative.
Three institutional paths
The technology does not pick one political and economic system. Three paths are all consistent with the same three conditions.
On the closed-gate path, the leftover assets stay concentrated, permissions are capped or can be bought and sold, and the productivity gains flow into private bottlenecks.
On the regulated-access path, private owners keep the rival assets, but rules limit their fees: common-carrier duties that require serving all customers on equal terms, open grid connection, price rules, or licenses and credentials that can be carried across employers and jurisdictions.
On the commons path, shared infrastructure, widely spread ownership, and broad access to land and materials expand the list for people who start without land or material stocks.
The three paths share the same technology. They differ in who owns , who can pass through a gate, and whether the gatekeeper can collect the productivity gain. Choices made today about property transfer, access, entry, taxes, and shared infrastructure therefore shape who benefits from the endpoint well before anyone knows whether the technology will arrive.
An established company facing Result 1 has an obvious strategy: trade a shrinking information advantage for a physical or legal one. It buys land, energy, mineral rights, infrastructure, or a legal right to operate. Industries also tend to acquire and shape the regulations that govern them [13]. A safety threshold written in terms of computing power, electricity use, fabrication capacity, professional status, or safety certification turns open capability into a limited license.
Patents and professional licenses already show how this works. Inventing something yourself does not get you around a patent, and a machine’s competence does not give it a medical or law license. Enforcement is easiest at visible transactions and physical checkpoints: selling a drug, connecting to the grid, entering a courtroom, running a clinic, or signing code for a controlled device. Private thinking is hard to police. Public operation is a chokepoint.
One possible endgame for the technology industry looks like a professional licensing board. Safety rules serve public purposes and, at the same time, fix how many operators are authorized. The economic questions are who may comply, who may enter, and whether the permission can be sold or is capped.
On the closed-gate path, the end state is an alliance between the companies holding rival assets and the institutions that decide who gets access to them, and corporations remain. There is a plain word for someone who owns the ground everyone else works on: landlord. The same arrangement appears when the deed is replaced by a permit, a grid connection, or a payment account: unlimited intelligence behind a metered gate. Regulated access, shared infrastructure, and spread-out ownership are real alternatives, and nothing in the technology rules them out.
10. What Can and Cannot Be Measured
Result 5. When every household has the same technology , machine capability stops making some households richer than others. What decides how the leftover scarcity rent is shared is who owns and can access the endowments . Better technology changes what each piece of is worth, through substitution, recycling, and higher yields. At the endpoint, nobody earns extra rent from having better thinking machines than their neighbors.
Result 5 is about who gets the money. Machine capability still makes everyone better off. A better machine finds a substitute for a scarce element, recycles more efficiently, and cuts the land needed for food and energy, and every household gets that improvement. What universal access removes is the advantage of owning better intelligence than someone else. What it leaves is the advantage of owning more of the inputs intelligence works on.
The thing that would need to be measured
The natural question for data is whether the surviving inputs are owned more equally than the claims that lose their information-based income. Current U.S. wealth statistics cannot answer it, and the reason shows what data would be needed.
A share of stock is a legal wrapper. Inside the wrapper may be software, patents, mines, land, data centers, ports, and government licenses. A home combines location value, which is rival, with a building, which Condition 2 makes cheaper to reproduce. Rental property, mineral rights, water rights, and infrastructure sit in other accounting categories. Standard wealth tables sort assets by wrapper. What matters for the endpoint is what sits inside.
The measurement needed is look-through ownership: who ultimately owns the underlying scarce assets, counted by the asset itself instead of by the wrapper holding it. The assets are land value, mineral and water rights, energy sites, grid connections, ports, spectrum, payment networks, computing permissions, and government franchises that limit entry. No standard U.S. statistical product identified in preparing this paper reports it directly.
Why a first look seems to show equalizing
Table 2 shows the figures that exist. They explain the first-look intuition and its limits.
How to read the table: the top 1 percent of households hold 50.2 percent of all stocks and mutual funds in the country, while the bottom half holds 1.1 percent. Stocks make up 52.7 percent of everything the top 0.1 percent owns, and real estate, mostly homes, makes up 46.6 percent of everything the bottom half owns.
Now imagine an extreme thought experiment: every stock goes to zero and every house keeps its value. The top 0.1 percent would lose 52.7 percent of their assets and the bottom half would lose 5.7 percent. That looks like dramatic equalizing. The thought experiment exaggerates in two directions. It overstates the loss, because the stock category includes companies that own rival assets, plus funds holding things other than stock. It overstates how well housing survives, because houses include buildings that become cheap to reproduce. A study by the Organisation for Economic Co-operation and Development (OECD), an association of mostly high-income countries, makes a related point using a snapshot of household wealth at one moment: across its member countries, removing housing from household wealth raises the average wealth inequality measure (the Gini coefficient, where 0 means everyone owns the same and 1 means one person owns everything) from 0.66 to 0.82 [15]. Homes make wealth look more evenly spread. They say little about who owns economically useful land.
Anticipation weakens any automatic equalizing further. Established owners can move out of information-based assets and into land, energy, infrastructure, and political access before the endpoint arrives, and expected gains get priced into those assets as soon as the endpoint looks believable. The paper’s own mechanism predicts that asset prices move before the technology is finished.
11. How Much Land a Household Needs
A question that public data can answer is a different one. How much land does it take to feed a household and power its energy use, and how does that compare with an actual residential lot? The calculation starts from today’s technology, because that is what public data measures, and then asks how far better technology shrinks the answer. The starting calculation has four inputs.
Energy use per person. The United States used 96 quadrillion British thermal units (Btu) of primary energy in 2025 [16]. Primary energy counts all energy in its original form: oil, gas, coal, nuclear, wind, sunlight, and so on, before conversion losses. A Btu is the heat needed to warm one pound of water by one degree Fahrenheit, about 1,055 joules. Spread evenly over a year and over 341.8 million people [17], that equals about 9.4 kilowatts per person, running continuously, day and night. For scale, 9.4 kilowatts is roughly nine hair dryers running nonstop for every person. This figure covers all U.S. energy use, including industry and transportation, which suits a household that makes its own goods.
Solar output per square meter. Solar panels are rated by how much power they produce per square meter under full, direct test sunlight of 1,000 watts per square meter. The national rooftop solar assessment by the National Renewable Energy Laboratory (NREL) assumes panels rated at 160 watts per square meter, meaning they convert about 16 percent of full sunlight to electricity [18]. A real roof produces far less than that rating on average, because of night, clouds, winter, panel angle, and shade. NREL’s published national totals work out to about 20 watts per square meter on average across a whole year on suitable roofs. NREL also reports that panels rated at 200 watts per square meter raise output about 25 percent, to about 25 watts per square meter. Applying the same proportional scaling to panels rated at 220 watts per square meter gives about 28 watts per square meter.
Land to grow food. Peters et al. [19] calculated how much U.S. farmland it takes to feed one person on ten different diets. This paper uses the two extremes: the vegan diet, which needs the least land, and the typical current U.S. diet, which needs the most. For a household of 2.5 people, those come to 0.80 acres and 6.67 acres.
The size of a real lot. The median lot for a new single-family detached house sold in the U.S. in 2024 was 8,506 square feet, or 0.195 acres [20]. An acre is 43,560 square feet, about three-quarters of an American football field.
Table 3 combines these numbers.
How to read the table: the “Food” column is the farmland for the diet. The “Energy” column is the solar panel area for 2.5 people’s share of national energy use. “Total” adds the two. The last column divides the total by the median lot of 0.195 acres. So a vegan household with ordinary panels needs 1.09 acres, which is 5.6 median lots.
Table 3 and Figure 3 show where the real limit is, and it is a different limit from the one technology discussions usually stress. Food is 73 percent of the vegan total and 96 percent of the typical-diet total. Going from ordinary panels to the best realistic panels moves the headline number only from 5.6 to 5.2 lots. Changing the diet moves it from 5.6 to 35.6. How much food an acre can grow matters far more than how efficient the solar panels are.
The comparison has definite limits. The lot figure describes new houses sold in one year, which differ from the full stock of existing homes and from the typical household. The Peters figures are national averages across all kinds of farmland; a particular backyard may lack the soil, water, or climate to feed its occupants. The vegan diet uses the least land per person because it uses only cropland, and the Peters analysis finds that it feeds fewer people nationally than two of the diets that include some meat, because those diets can also use grazing land that is unsuited to crops. Solar panels and farmland can share space in some systems and compete for it in others. The calculation leaves out the house’s own footprint, energy storage, backup power, fabrication equipment, starting stocks of materials, and the element limits from Section 7. It gives renters and people without land no parcel at all. The result is a rough size comparison for food and energy. A threshold for self-sufficiency on a particular lot would require site data.
How far better technology shrinks the requirement
Table 3 uses today’s technology, and Conditions 1 through 3 describe a world with much better technology. The land a household needs will fall, and two of the inputs above overstate it for that world.
The energy figure counts primary energy. Most of the fuel burned in power plants and car engines leaves as waste heat, and the 9.4 kilowatts includes that loss. A household that runs on its own solar electricity skips most of those losses, so it needs less energy than the national primary figure. Better machines, insulation, and fabrication processes cut the need further.
The food figure uses national average farm yields. Machines better than the best agronomists raise crop yields, cut losses between field and plate, and make food from microbes or cells grown in tanks, which needs little farmland. Some of these routes move land from the food column into the energy column. Food grown under electric lights, or made from electricity, needs fewer acres of field and more acres of solar panels, because turning sunlight into electricity and back into light for plants loses most of the energy along the way.
Two improvement factors capture all of this. Call F the factor by which the land needed for food shrinks, and E the factor by which the household’s energy use shrinks. A factor of 2 means half as much land or half as much energy. The total land needed is then
Here is each piece of Equation (8).
- L
- (“ell”). The total land, in acres, needed to feed and power the household. L stands for land.
- (“ell food”). The farmland the household’s diet needs today, from Table 3: 0.80 acres for the vegan diet.
- (“ell energy”). The solar panel area the household’s energy use needs today, from Table 3: 0.21 acres with the best panels.
- F
- (“eff”). How many times less land the food takes with better technology. is today.
- E
- (“ee”). How many times less energy the household uses with better technology. is today.
What Equation (8) says. Divide today’s food land by the food improvement, divide today’s energy land by the energy improvement, and add the two.
Why it matters. It turns “technology will help” into a checkable number: how large the improvements must be before one ordinary lot feeds and powers a household.
Table 4 works through the vegan diet with the best panels.
The table cannot say how large F and E will become. It can say which way they move. Every input to farming and to power that is designed, fabricated, or managed gets cheaper under Result 1, and machines better than the best engineers keep finding methods that need less land and less energy per unit of food. So F and E rise over time, and the land a household needs falls. What the table fixes is the size of the improvement needed before one lot is enough.
How to read the table: each cell is the total land from Equation (8), followed by that total divided by the median lot of 0.195 acres. The top left cell is today. One median lot is enough only in the bottom right corner: food land down about tenfold and energy use down by half or more. The house itself also sits on the lot, so the real requirement is somewhat stricter.
The household need not supply all its own energy. Grid power from nuclear, hydro, and utility-scale sources also gets cheaper under Result 1, because designing, building, and running plants is generable. With cheap outside power, food no longer has to come from fields. Crops can grow under lights in stacked layers, and food can be made in tanks from microbes, so the measure that matters shifts from area to volume and energy, and the land requirement in Table 4 can fall far below one lot. The shift depends on the energy coming from off the lot: growing under lights powered by the household’s own panels usually needs more total area than a field, because each conversion from sunlight to electricity to light loses energy. What still binds is rival or legal: the plant sites, fuel, and grid connection behind the cheap power; the phosphorus, potassium, and water that plants and microbes need; somewhere to dump the heat; and zoning and height limits, which cap the volume a lot may hold. A household that takes this route trades self-sufficiency for dependence on the grid connection and the permits, the kind of gates Section 9 describes.
So the land a household needs shrinks substantially under Conditions 1 through 3, and food remains the input that decides whether a lot is enough. Engineering is a large lever. It leaves two questions for institutions. First, the requirement stays above zero, so a household with no land still has no parcel to be self-sufficient on. Second, as Section 8 shows, part of each improvement gets priced into the land that still binds: a lot that can now feed a family is worth more. Access, ownership, shared infrastructure, and the rules governing the remaining trade network decide who collects that value.
12. Buying the Gates Early
The transition starts before the endpoint. A company that expects its information-based income to shrink has a reason to trade those claims for assets that will stay scarce: land, energy, minerals, infrastructure, access to payment systems, or permission. The paper’s mechanism therefore predicts early buying. The prices of the remaining bottlenecks can rise before universally generable thinking arrives, and ownership can shift toward those bottlenecks while old profit margins still look healthy.
A corporation is a legal bundle of assets, debts, voting rights, legal standing, and claims. Result 1 by itself destroys no productive activity. It removes one source of scarcity value. The financial loss therefore lands on claims whose expected income depended on keeping others away from reproducible thinking. A company that already owns rival assets or enforceable gates survives on those claims. A company that sees the transition coming can try to buy them.
This complicates any simple story in which free thinking automatically equalizes wealth. The technology can equalize capability dramatically while the financial gains flow to whoever owns the bottlenecks the technology makes more valuable. Public rules on property transfer, access, entry, taxation, and shared infrastructure then decide who benefits from the transition.
13. Conclusions
If the three conditions arrive, every business model that sells scarce, generable thinking ends. That reaches far beyond software. Drug discovery, legal analysis, diagnosis, consulting, publishing, and teaching all contain a part that sells copies of thinking. The activities continue. What survives of each business shrinks to the matter and energy for physical work, access to real-world specimens and sites, well-placed local distribution sites, legal responsibility, the consent and attention of specific people, and enforceable authority.
The companies face the same choice every year: stop investing and risk losing the market now, or keep investing and erode the market later along with everyone else. They are racing toward a capability that destroys part of the prize when they reach it, and the race can stay rational for every runner all the way to the finish line.
The argument ends one way of charging for thinking. What survives threatens people’s bargaining power, while leaving their survival secure. Free intelligence gives users the savings and shifts scarcity rent toward whatever users cannot make or legally reach. Losing the copy moat is the good news. Who owns land, material stocks, infrastructure, and permissions is the question that remains.
Henry George saw this pattern in 1879 without the machinery. In his economy, the copyable input was industrial technique. Thinking now plays that role across a far wider range of activity, because it goes into every design and every decision.
For food and energy, the land requirement at today’s farm yields and energy use is roughly five times the median lot of a new single-family house sold in 2024, and three-quarters of that is food. Better technology shrinks the number: one median lot suffices once food land falls about tenfold and energy use falls by about half. Cheap grid power and indoor food production go further, turning the requirement from area into volume and energy, at the price of dependence on a grid connection, plant nutrients, and building permits. For materials, renters, and licensed connections, engineering alone hands out no deeds and opens no gates. The endpoint therefore has two levers: shrink the bundle of rival inputs a good life needs, and widen access to the bundle that remains.
The goal of a 2026 investment program expected to exceed one trillion dollars is to make thinking stop being the moat. The economic question is who already owns the ground, the concentrated matter, and the permissions when it succeeds.
14. Glossary
- (c sub x, A-I). The total cost for a buyer to make their own substitute for product x using Condition 1: the computing cost plus the unavoidable other costs .
- coordination
- edge (, E sub U-U). A connection through a platform in which one user reaches another specific person: to pay them, buy from them, be read by them, get their agreement, or rely on their identity. It cannot be generated, because the other person is the point.
- E (ee).
- The factor by which a household’s energy use shrinks with better technology; means half as much energy.
- F (eff).
- The factor by which the land needed for food shrinks with better technology; means half as much farmland.
- L, ,
- (ell, ell food, ell energy). The total land needed to feed and power a household, and its food and energy parts at today’s technology.
- (epsilon sub x). The computing cost of making a substitute for product x. Under Condition 1 it is essentially the electricity bill.
- excludable.
- A thing is excludable when its owner can actually stop others from using it, by physical, technical, or legal means. Legal exclusion, such as a patent or a license, is what survives once people can make their own substitutes without copying or stealing.
- generable.
- An output is generable when a buyer can use Condition 1 to make something that does the same job on their own, without copying anyone’s protected work or learning anyone’s secret.
- ,
- (kappa sub U-D, kappa sub U-U). The average fee a platform charges on each tool edge and on each coordination edge.
- ,
- look-through ownership. Ownership counted by the underlying asset instead of by the legal wrapper that holds it. A stock is the wrapper; the land, mine, port, spectrum license, or government franchise inside the company is what look-through ownership would report.
- (m sub x). Every cost of product x that thinking cannot remove: rival materials and energy, a physical body to do the work, someone taking legal responsibility, and required permission.
- moat.
- A lasting advantage that keeps competitors away from a business’s customers, named after the ditch around a castle. The moat this paper follows is expertise: selling thinking that customers cannot do for themselves.
- non-rival.
- A thing is non-rival when any number of people can use it without using it up. A proof, a design, and a piece of software are non-rival.
- (the number of edges in E). The vertical bars mean “count the members of this set.”
- (omega). Everything rival a household can legally use: its land and roof area, the sunlight on that area, water, recoverable materials, inherited stocks of goods, and access rights it can enforce.
- (p sub x). The price a seller charges for product x.
- , ,
- (rho, rho sub G, rho sub C). Total scarcity rent, split into the part earned by scarce generable thinking () and the part earned by the inputs thinking cannot produce ().
- rival.
- A thing is rival when one person’s use takes it away from another. An acre, an hour of a particular surgeon’s time, and the gallium in a particular seam of ore are rival.
- rival.
- scarcity rent (rent). The part of a price that exists because buyers cannot easily get the thing elsewhere, above the cost of producing it.
- (script A of omega, given tau). The full list of goods a household can make from its own endowment using the shared technology . Anything off this list must be traded for, reached through legal access to someone else’s endowment, or done without.
- (tau).
- The shared technology every household has under the three conditions: the thinking machines, fabricators, and solar panels.
- tool
- edge (, E sub U-D). A connection through a platform in which a user gets a generable item from a developer. Under Condition 1 the user becomes their own developer, the edge becomes a loop, and an open platform cannot charge for it.
- Type H.
- A leftover claim resting on a specific person or on relative position: identity, consent, relationships, membership, attention, or ranking.
- Type M.
- A leftover claim resting on rival matter and energy: elements, raw materials, sites, water, sunlight, and the physical body of any machine.
- Type P.
- A leftover claim resting on permission: professional licenses, drug approvals, accreditation, the right to appear in court, code signing, and other government-granted rights to operate.
- V (vee).
- A platform’s total revenue: the fee per edge times the number of edges, added up over both kinds of edges.
Author Contributions
Conceptualization, methodology, investigation, and writing—original draft preparation, review, and editing, V.A.W.; project administration, V.A.W. The author has read and agreed to the published version of the manuscript.
Funding
This research received no external funding.
Institutional Review Board Statement
Not applicable.
Informed Consent Statement
Not applicable.
Data Availability Statement
All data used in the numerical calculations are publicly available from the sources cited in the text. The arithmetic behind the land comparison is reported in full in Appendix A and in Table 3 and Table 4. No original microdata were created or analyzed.
Use of Artificial Intelligence
The author used multiple general-purpose large language models during the preparation of this manuscript. Uses included research and source triage, manuscript organization, drafting and revision, LaTeX and code assistance, numerical cross-checking, and internal consistency review, as applicable. AI outputs were treated as provisional working material. The author reviewed and adjudicated the underlying sources, calculations, code, figures, and final text and accepts full responsibility for the manuscript.
Conflicts of Interest
The author declares no conflicts of interest.
Appendix A. Checking the Land Calculation
This appendix repeats every step of the arithmetic behind Table 3 and Table 4, so a reader can check it against the sources. All inputs are public.
Step 1: energy per person. U.S. primary energy use in 2025 was 96 quadrillion Btu [16]. One Btu is 1,055.06 joules, so the total is joules. A joule is a unit of energy; a watt is one joule per second. A year has seconds. Dividing gives watts, the average rate of U.S. energy use at every moment of the year. Dividing by the population of 341.8 million [17] gives watts per person, reported in the text as about 9.4 kilowatts.
Step 2: solar output per square meter. NREL’s rooftop assessment assumes panels rated at 160 watts per square meter, which is 16 percent of the 1,000 watts per square meter of full test sunlight. Its published national totals work out to about 20 watts per square meter averaged over a full year on suitable roof area [18]. NREL reports that 200-watt panels raise each estimate about 25 percent, giving 25 watts per square meter. Scaling the same way for 220-watt panels gives watts per square meter, reported as about 28.
Step 3: energy area for the household. At 20 watts per square meter, one person needs square meters of panels. For 2.5 people that is square meters. One acre is 4,046.86 square meters, so this is acres. At 25 watts per square meter the result is 0.23 acres, and at 27.5 watts per square meter it is 0.21 acres.
Step 4: food area for the household. The food figures are the national farmland equivalents from Peters et al. [19] for the vegan diet (least land of the ten diets studied) and the typical current U.S. diet (most land), taken for 2.5 people: 0.80 acres and 6.67 acres.
Step 5: totals and ratios. The median lot for a new U.S. single-family detached house sold in 2024 was 8,506 square feet [20]. One acre is 43,560 square feet, so the lot is acres. Food plus energy gives the totals, and dividing each total by 0.1953 gives the last column: ; ; ; ; .
Step 6: shares. Food is percent of the vegan total and percent of the typical-diet total. Across the full range of panels the headline ratio moves from 5.6 to 5.2; across the two diets it moves from 5.6 to 35.6.
Step 7: better technology.Table 4 applies Equation (8) with and . For example, with food land down tenfold and energy use halved, acres, and lots. With food land unchanged and energy use quartered, acres, or 4.4 lots. The other cells follow the same way.
Scope. These are national land equivalents compared with a national lot statistic. The limits listed in Section 11 apply to every figure above.
References
- IEA (International Energy Agency). Key Questions on Energy and AI; IEA: Paris, 2026; Available online: https://www.iea.org/reports/key-questions-on-energy-and-ai.
- Goldman Sachs Research. Global AI investment is forecast to exceed $1 trillion in 2026. 7 August 2026. Available online: https://www.goldmansachs.com/insights/articles/global-investment-is-forecast-to-exceed-1-trillion-in-2026.
- Acemoglu, D.; Restrepo, P. Automation and new tasks: How technology displaces and reinstates labor. J. Econ. Perspect. 2019, 33(2), 3–30. [Google Scholar] [CrossRef]
- Korinek, A.; Stiglitz, J. E. Artificial intelligence and its implications for income distribution and unemployment. In The Economics of Artificial Intelligence: An Agenda; Agrawal, A., Gans, J., Goldfarb, A., Eds.; University of Chicago Press, 2019; pp. 349–390. [Google Scholar]
- Papadogiannis, A. Scarcity in an age of AI abundance. SSRN Work. Pap. 2026. [Google Scholar] [CrossRef]
- Yang, H.; Meng, X.; Cobb, C. W.; Wang, J.; Wang, Z. Platform monopolies and unearned income in China and the U.S.—A Georgist perspective. Am. J. Econ. Sociol. 2026. [Google Scholar] [CrossRef]
- Spence, M. Job market signaling. Q. J. Econ. 1973, 87(3), 355–374. [Google Scholar] [CrossRef]
- Coase, R. H. The nature of the firm. Economica 4(16) (1937), 386–405. [CrossRef]
- Teece, D. J. Profiting from technological innovation: Implications for integration, collaboration, licensing and public policy. Res. Policy 1986, 15(6), 285–305. [Google Scholar] [CrossRef]
- Graedel, T. E.; Harper, E. M.; Nassar, N. T.; Reck, B. K. On the materials basis of modern society. Proc. Natl. Acad. Sci. 2015, 112(20), 6295–6300. [Google Scholar] [CrossRef]
- Ricardo, D. On the Principles of Political Economy and Taxation; John Murray, 1817. [Google Scholar]
- George, H. Progress and Poverty. Author’s Edition; W. M. Hinton & Co.: San Francisco, 1879. [Google Scholar]
- Stigler, G. J. The theory of economic regulation. Bell J. Econ. Manag. Sci. 1971, 2(1), 3–21. [Google Scholar] [CrossRef]
- Board of Governors of the Federal Reserve System. Distributional Financial Accounts, 2026:Q1 release. 18 June 2026. Available online: https://www.federalreserve.gov/releases/efa/efa-distributional-financial-accounts.htm.
- Causa, O.; Woloszko, N.; Leite, D. Housing, wealth accumulation and wealth distribution: Evidence and stylized facts. In OECD Economics Department Working Paper No. 1588; 2019. [Google Scholar] [CrossRef]
- EIA (U.S. Energy Information Administration). The 250-year history of U.S. energy consumption. 30 June 2026. Available online: https://www.eia.gov/todayinenergy/detail.php?id=67824.
- U.S. Census Bureau. U.S. population growth slows due to historic decline in net international migration. 27 January 2026. Available online: https://www.census.gov/newsroom/press-releases/2026/population-growth-slows.html.
- Gagnon, P.; Margolis, R.; Melius, J.; Phillips, C.; Elmore, R. Estimating rooftop solar technical potential across the US using a combination of GIS-based methods, lidar data, and statistical modeling Rooftop Solar Photovoltaic Technical Potential in the United States: A Detailed Assessment, NREL/TP-6A20-65298. In Environmental Research Letters; Gagnon, P., Margolis, R., Melius, J., Phillips, C., Elmore, R., Eds.; National Renewable Energy Laboratory, 2018; Volume 13, 2, p. 024027, Module power density assumptions and the efficiency sensitivity are detailed in the companion report. [Google Scholar] [CrossRef]
- Peters, C. J.; Picardy, J.; Darrouzet-Nardi, A. F.; Wilkins, J. L.; Griffin, T. S.; Fick, G. W. Carrying capacity of U.S. agricultural land: Ten diet scenarios. Elem. Sci. Anthr. 2016, 4, 000116. [Google Scholar] [CrossRef]
- U.S. Census Bureau. “Median and average lot size of new detached single-family houses sold.” Characteristics of New Housing, 2024 data, released 2025. Available online: https://www.census.gov/construction/chars/xls/soldlotsize_cust.xls.
Figure 1.
Platform edges under Condition 1. (a) A tool edge runs from a user to a developer, and the platform charges a fee on it. (b) Under Condition 1 the user becomes their own developer, so the edge becomes a loop, and an open platform has no second party to charge. (c) Code signing, device rules, and identity checks put a gate on the loop and restore a fee. (d) A coordination edge reaches a second, specific person, so it survives with its fee .
Figure 1.
Platform edges under Condition 1. (a) A tool edge runs from a user to a developer, and the platform charges a fee on it. (b) Under Condition 1 the user becomes their own developer, so the edge becomes a loop, and an open platform has no second party to charge. (c) Code signing, device rules, and identity checks put a gate on the loop and restore a fee. (d) A coordination edge reaches a second, specific person, so it survives with its fee .
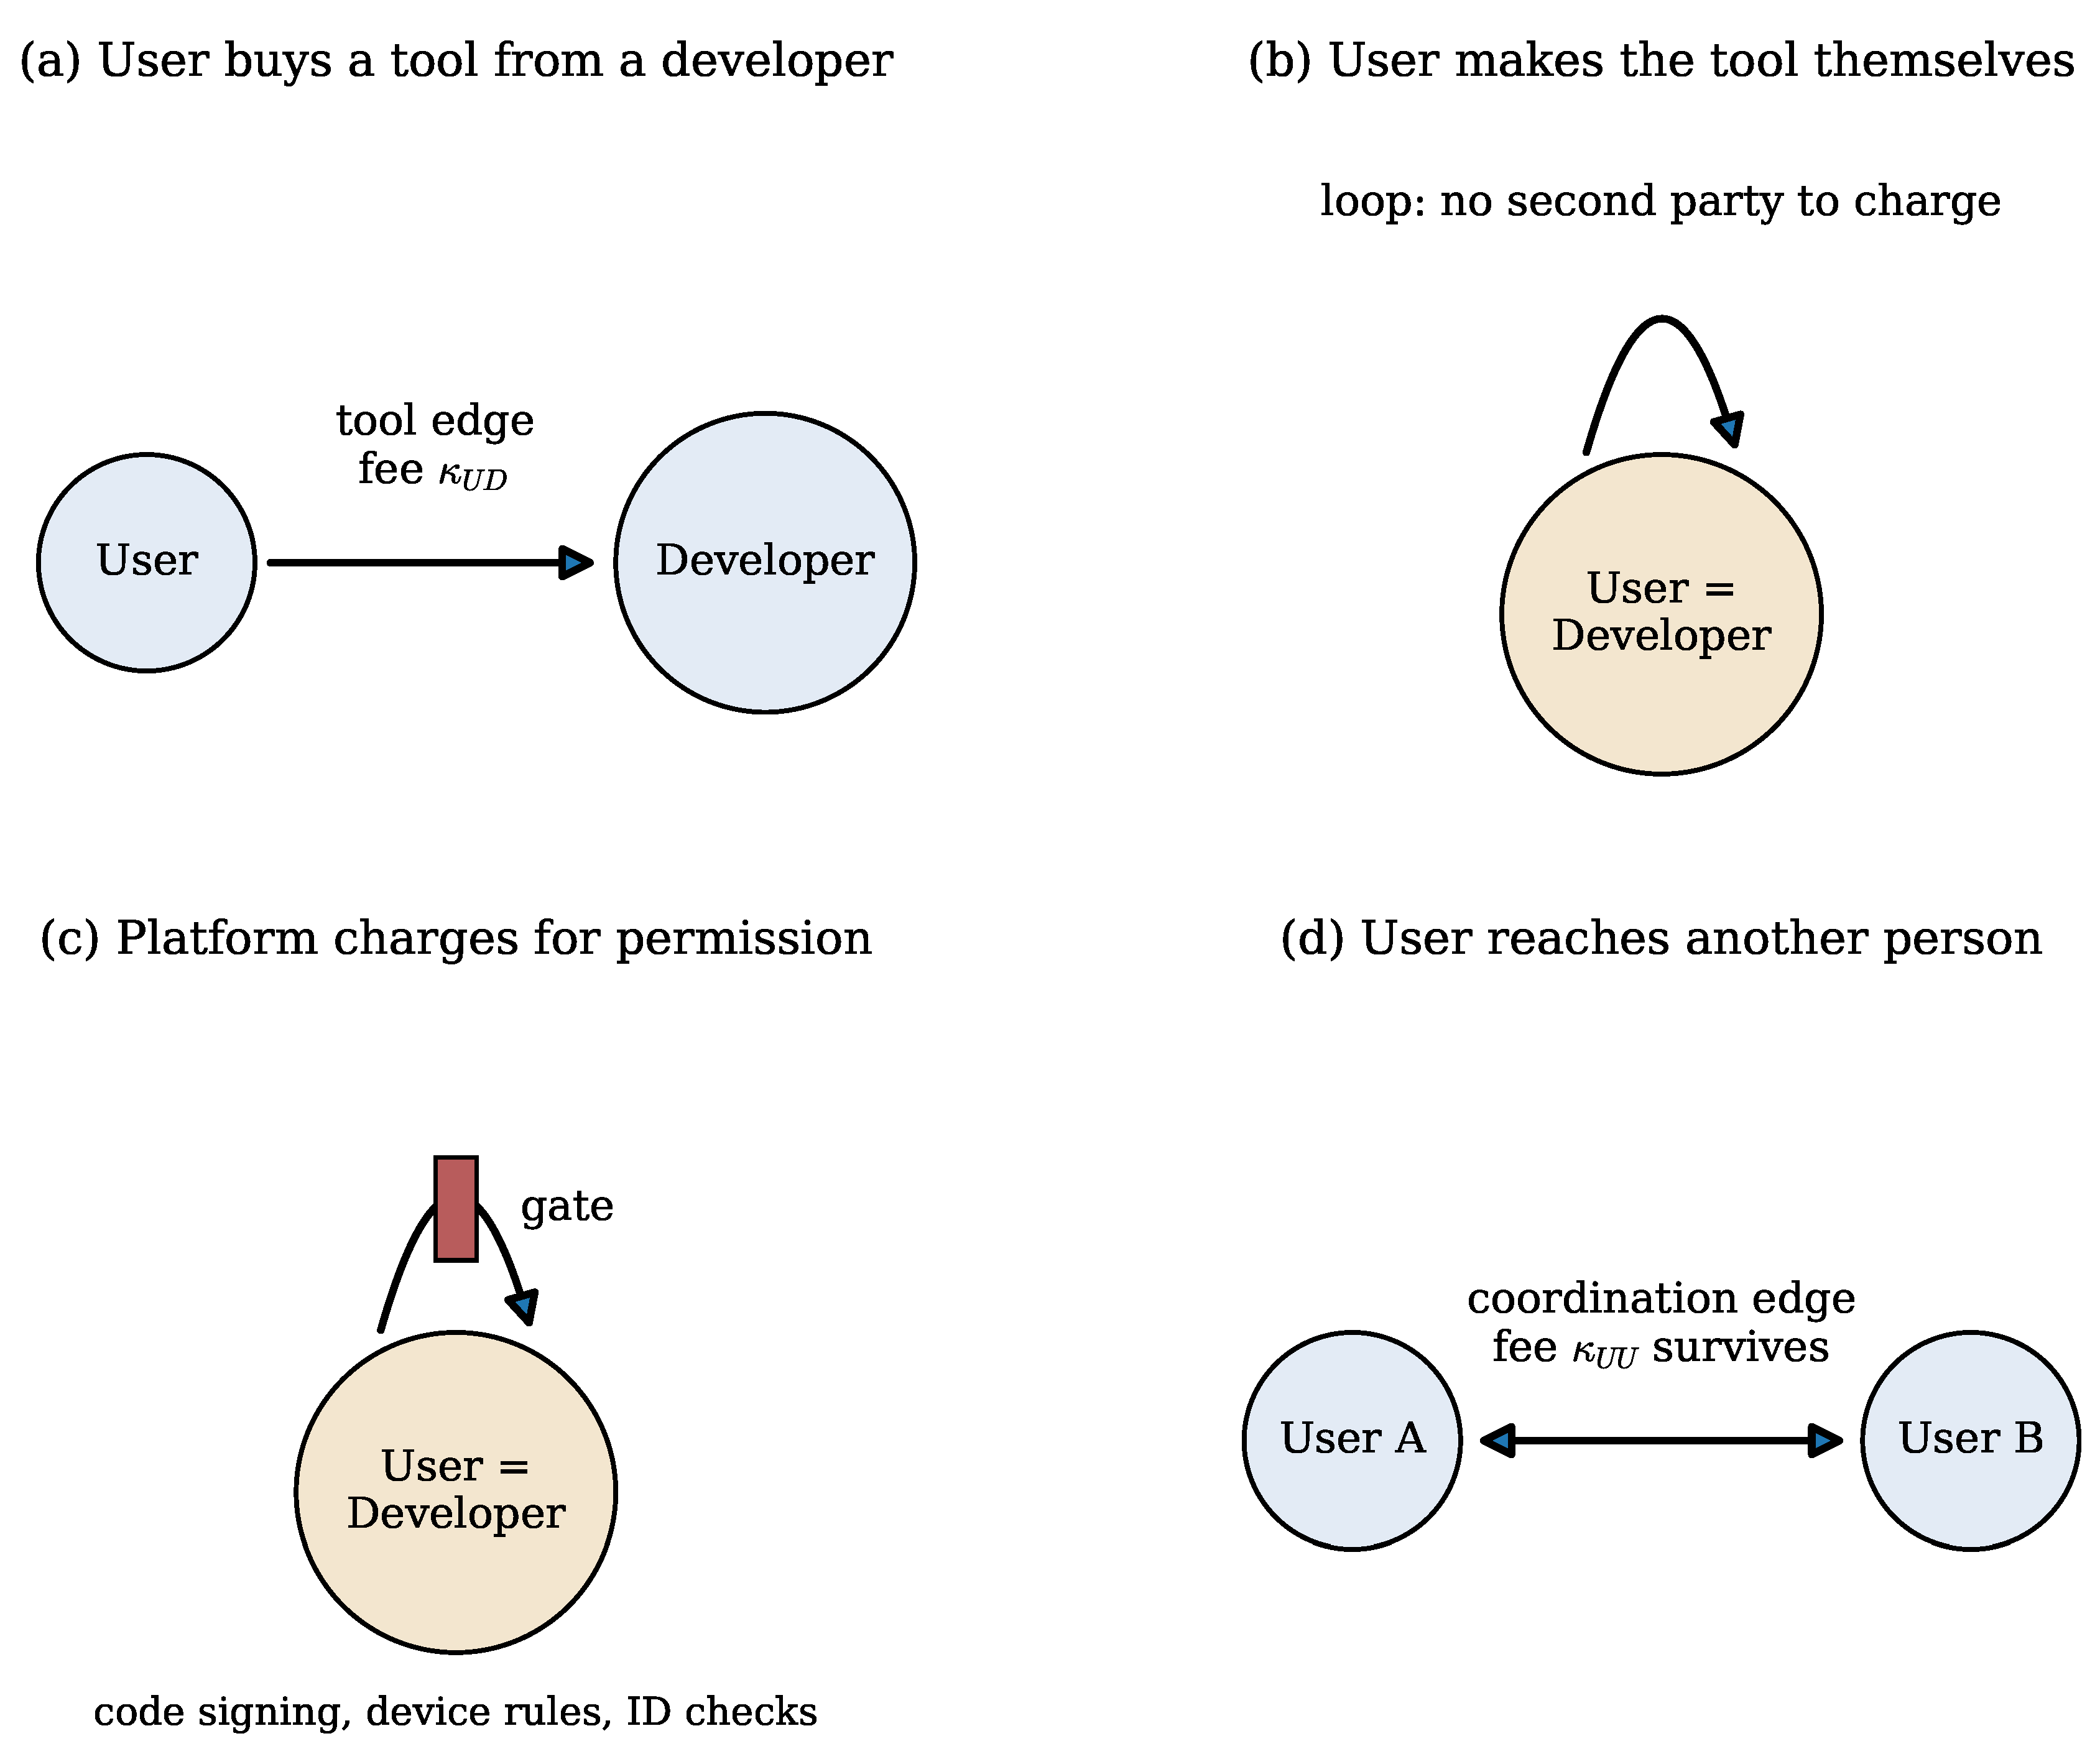
Figure 2.
What happens to the price of one generable product. Before the endpoint, the price has three layers: the computing cost ; the non-generable inputs, split into types M, P, and H; and the scarcity rent on thinking, . At the endpoint, leaves the price. Part of it reaches users as lower prices, and part is absorbed into the price of the remaining bottlenecks. How the split falls depends on product prices, substitution, policy, and ownership changes. Bar heights are illustrative.
Figure 2.
What happens to the price of one generable product. Before the endpoint, the price has three layers: the computing cost ; the non-generable inputs, split into types M, P, and H; and the scarcity rent on thinking, . At the endpoint, leaves the price. Part of it reaches users as lower prices, and part is absorbed into the price of the remaining bottlenecks. How the split falls depends on product prices, substitution, policy, and ownership changes. Bar heights are illustrative.
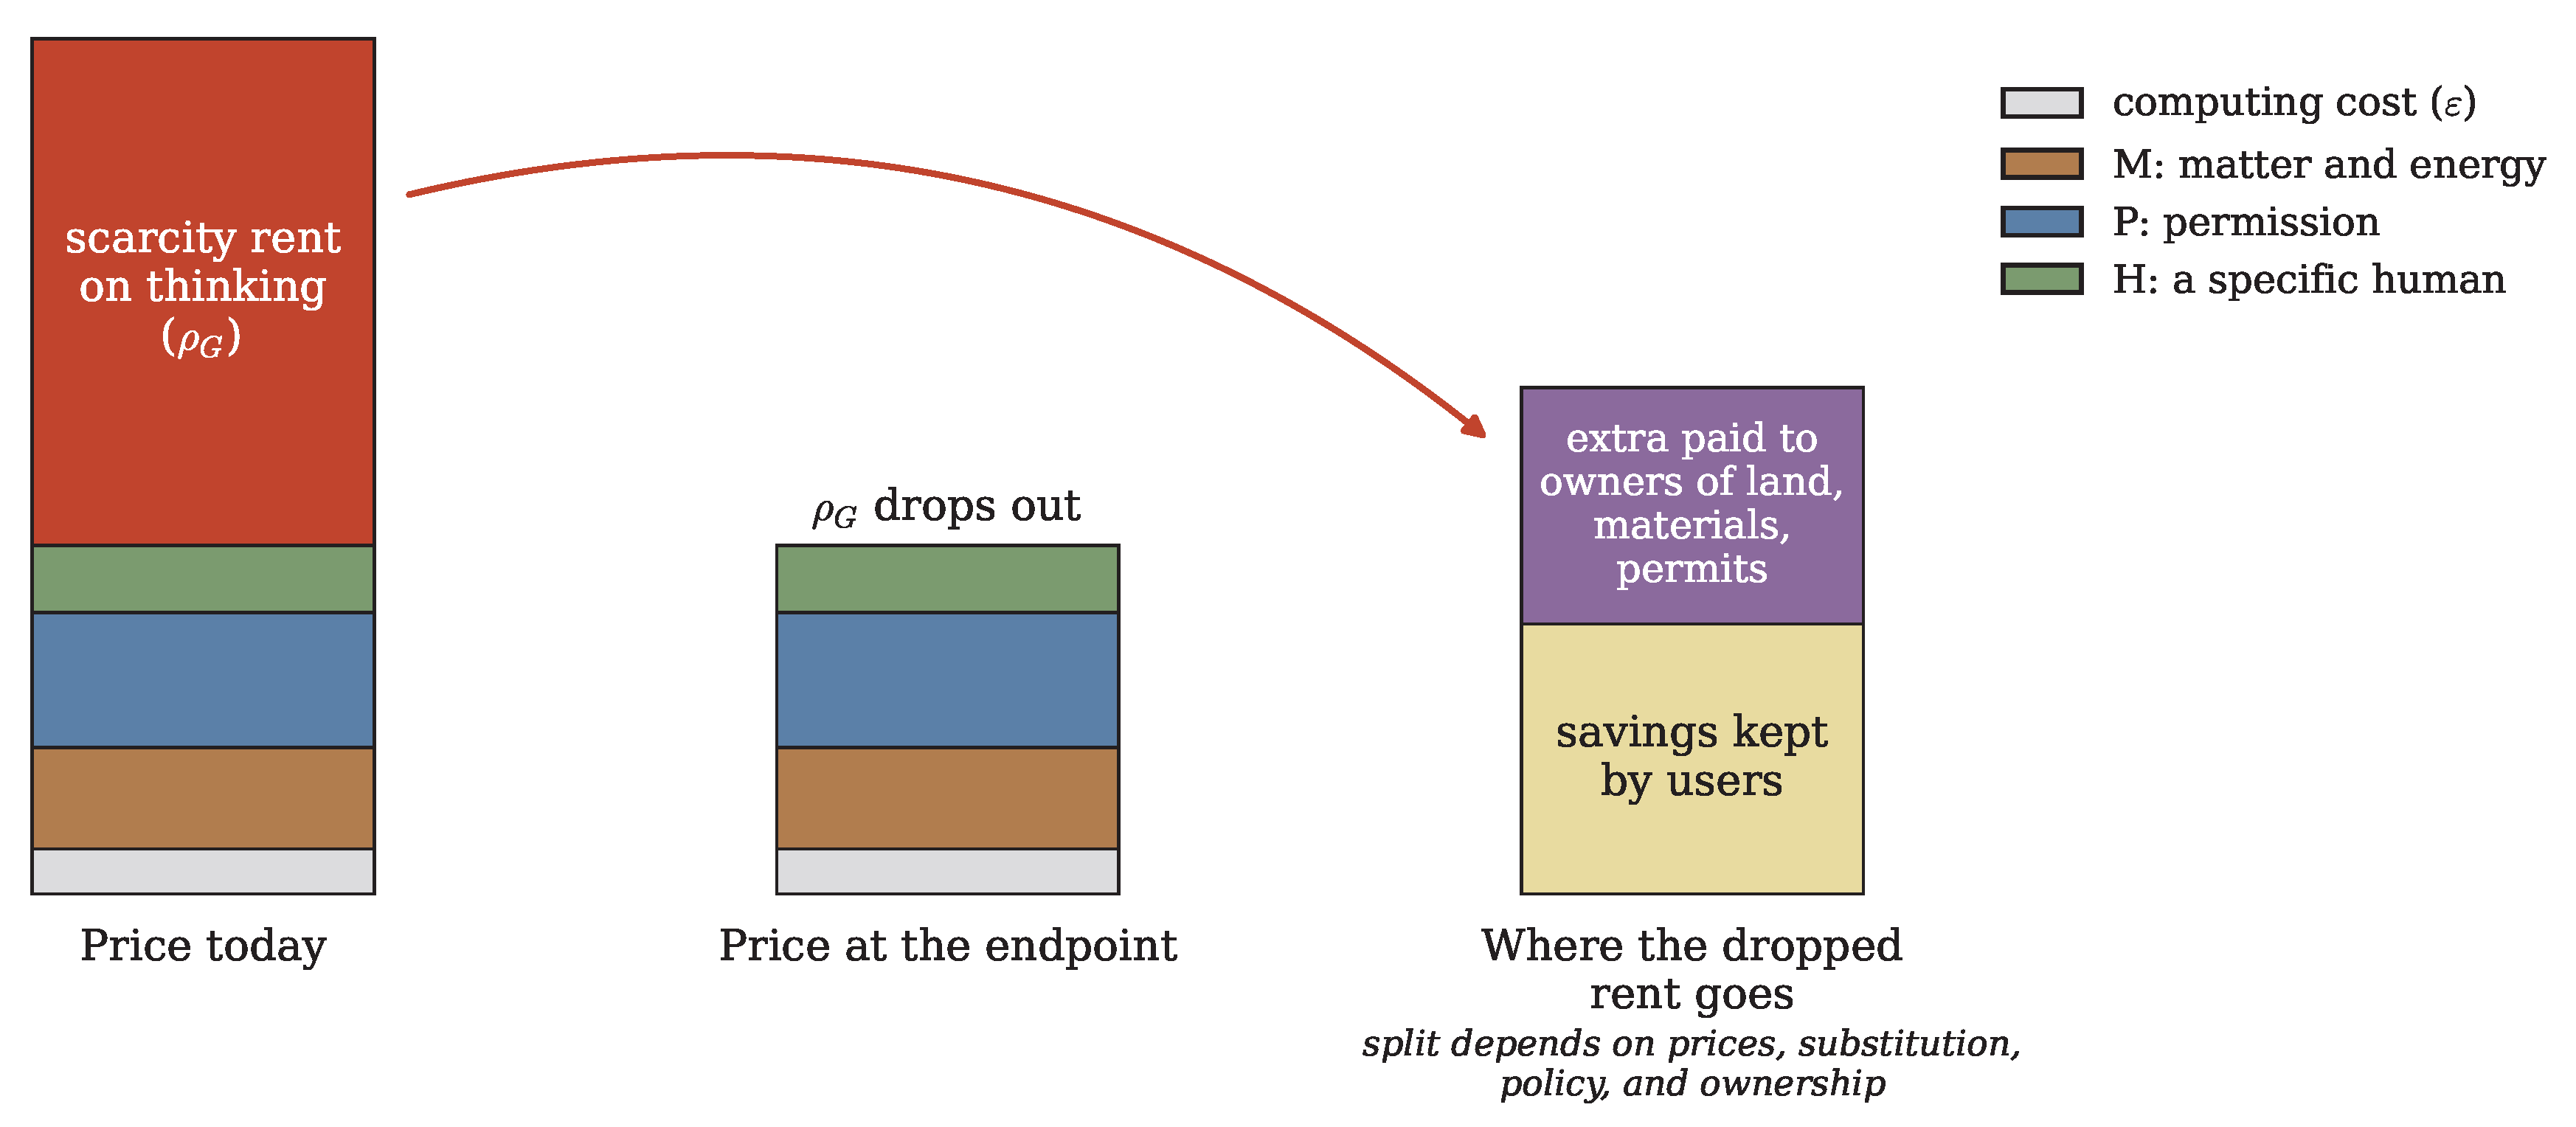
Figure 3.
Land needed to feed and power a household of 2.5 people at today’s farm yields and national energy use, compared with the median lot of a new U.S. single-family detached house sold in 2024. Sources and arithmetic: Table 3 and Appendix A.
Figure 3.
Land needed to feed and power a household of 2.5 people at today’s farm yields and national energy use, compared with the median lot of a new U.S. single-family detached house sold in 2024. Sources and arithmetic: Table 3 and Appendix A.
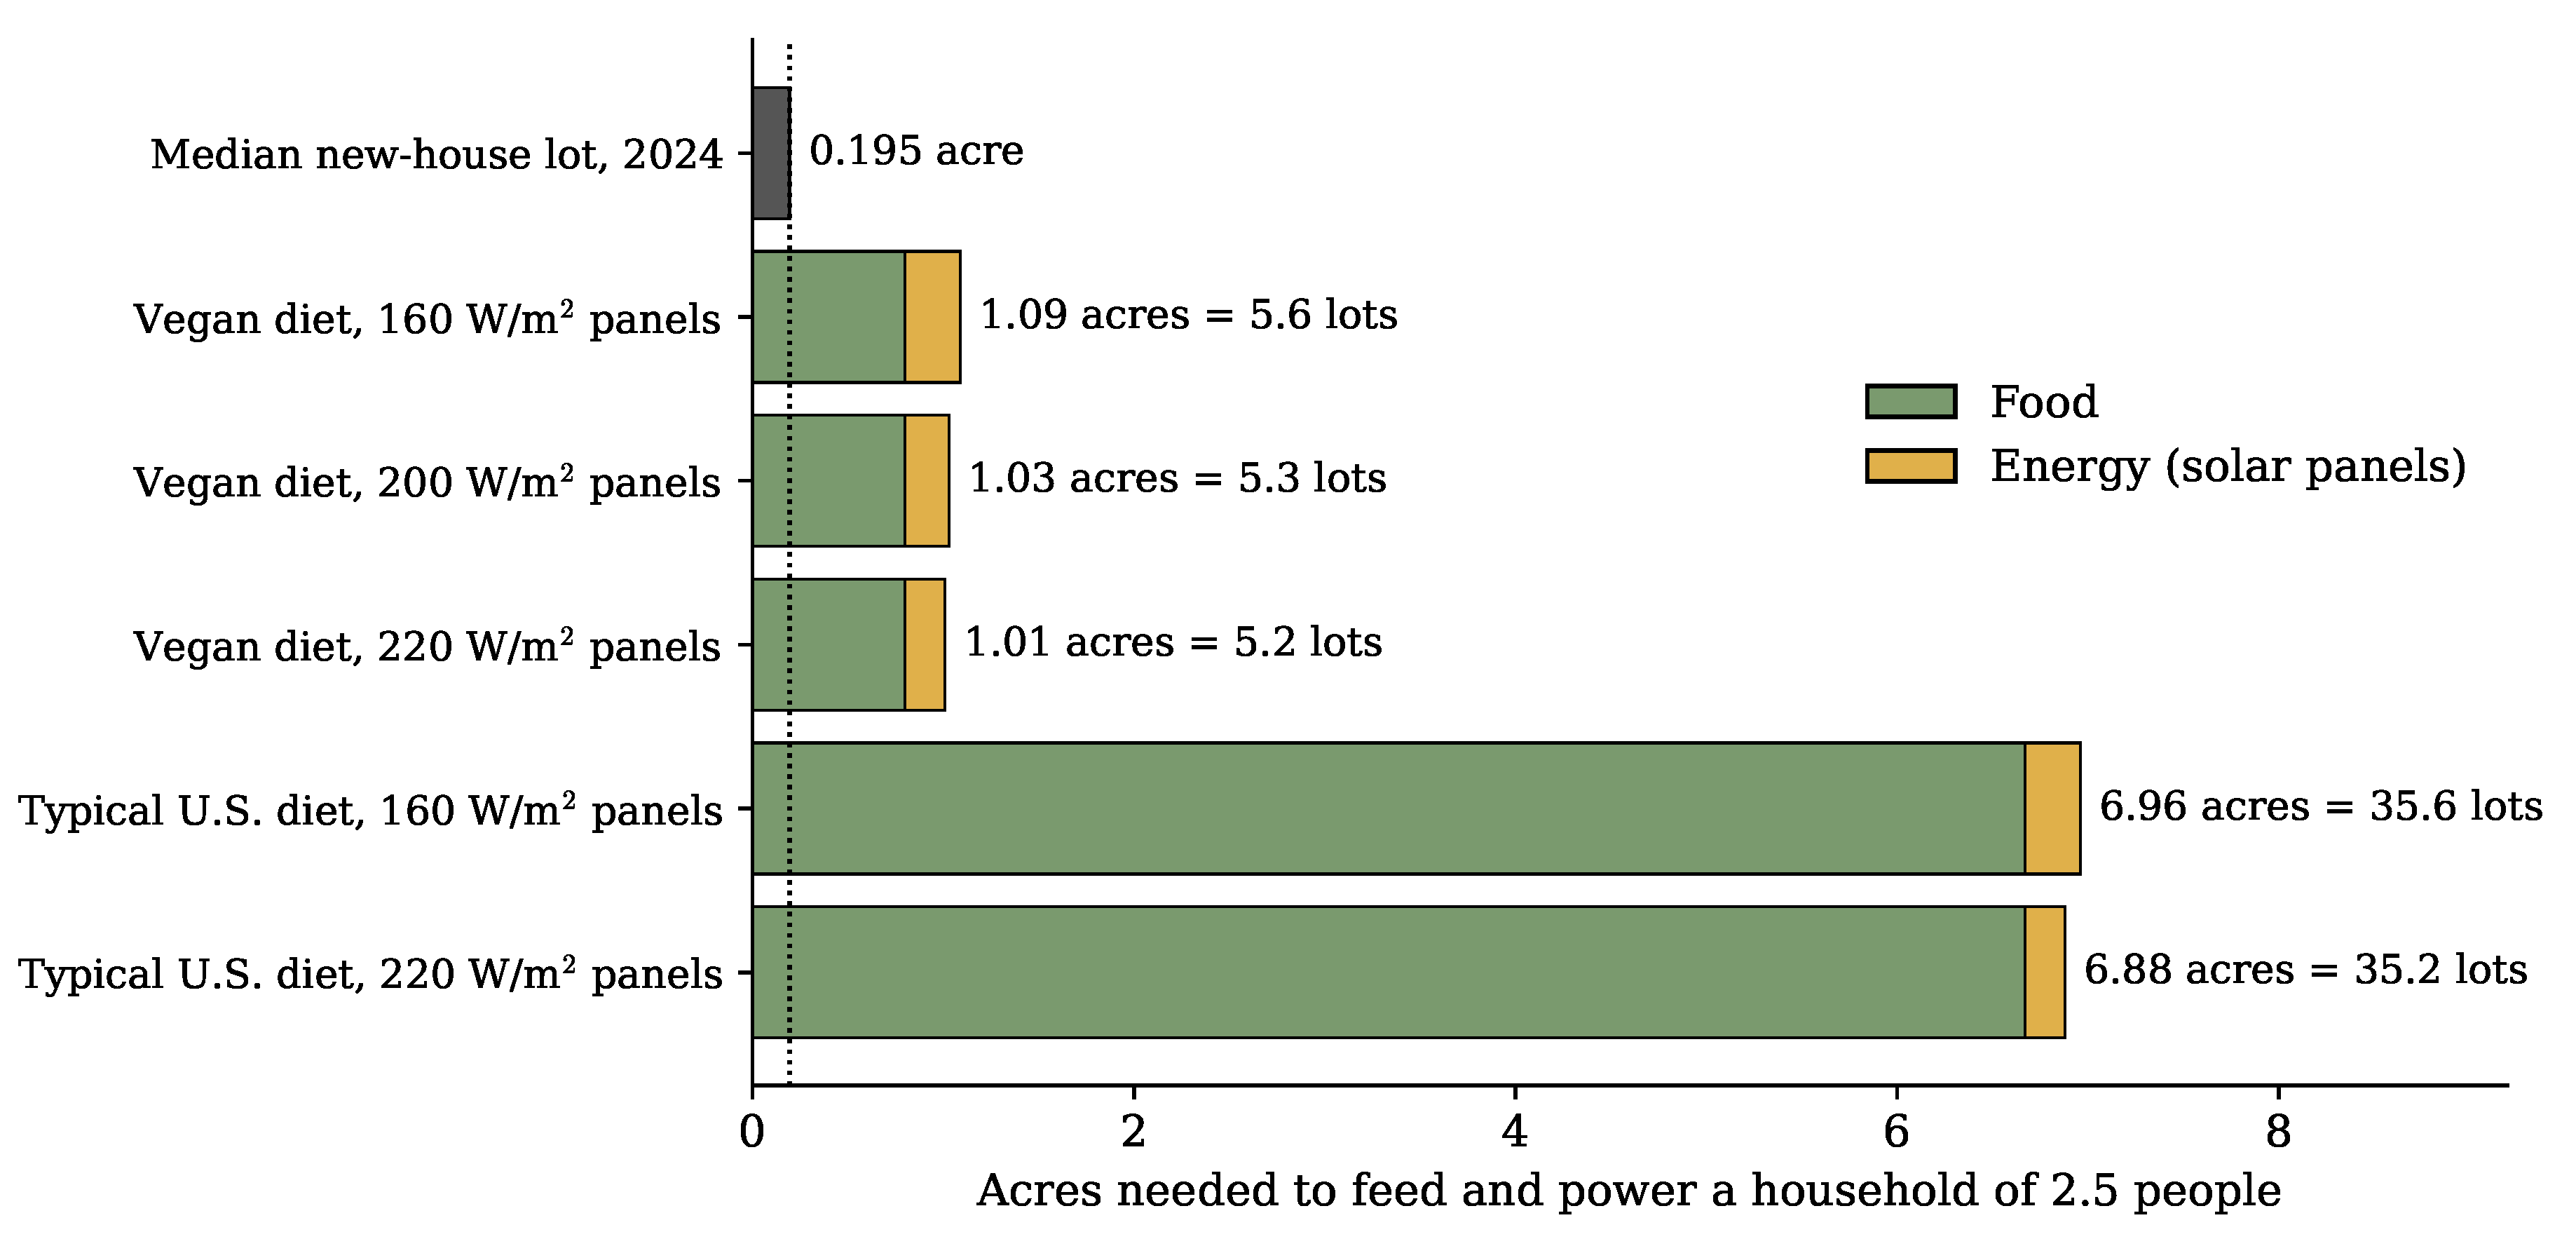

Table 1.
What becomes generable, and what is left
| Industry | Becomes generable | What is left, by type |
|---|---|---|
| Software | Code, app development, connecting systems, maintenance, running systems | Data center land, power, and grid connection [M]; code signing and permission to run on devices [P] |
| Pharmaceuticals | Choosing drug targets, designing molecules, running and analyzing trials, planning synthesis, designing and running sterile manufacturing, prescribing decisions | Raw chemical elements, energy, and plant sites [M]; drug approval and patents [P] |
| Law | Research, analysis, drafting, negotiation, argument | The right to appear in court and the state’s power to enforce [P]; the consent of a specific opposing party, and relationships with particular judges and officials [H] |
| Medicine | Diagnosis, examination, procedures, surgery, nursing, monitoring, record-keeping, designs for instruments and devices | The materials and energy to build and run instruments and devices, and a site [M]; a medical license [P]; wanting a human clinician [H] |
| Advisory services | Analysis, audit work, certification work, carrying out plans | Legal liability for a signed opinion and certification as a protected franchise [P]; a firm’s relationships with particular regulators, clients, and counterparties [H] |
| University | Teaching, testing and credentialing, designing and running research, lab work, designs for instruments | Specimens, field sites, and the materials and energy for instruments [M]; accreditation that licensing laws require [P]; alumni networks and membership in a class of graduates [H] |
| Academic publishing | Copying, formatting, storage, archiving, search, review, selection, record-keeping | Readers’ limited attention [H] |
[M] matter and energy [P] permission [H] a specific human
Table 2.
U.S. household holdings by asset type, first quarter of 2026
| Top 0.1% | Top 1% | Bottom 50% | |
|---|---|---|---|
| Share of the national total held by the group | |||
| Stocks and mutual fund shares | — | 50.2% | 1.1% |
| Homes, second homes, and land | — | 13.3% | 9.9% |
| Share of the group’s own total assets | |||
| Stocks and mutual fund shares | 52.7% | — | 5.7% |
| Homes, second homes, and land | 7.7% | — | 46.6% |
Source: Board of Governors of the Federal Reserve System [14]. A dash means the figure is not reported for that group in that
form. Figures exclude stocks and funds held through retirement accounts such as 401(k)s. The Fed’s real estate category covers
owner-occupied homes, second homes that are not rented, vacant homes for sale, and vacant land. Quarters after the third
quarter of 2022 are estimated from the 2022 Survey of Consumer Finances, so the split across groups is modeled from survey
data.
Table 3.
Land needed to feed and power a household of 2.5 people at today’s farm yields and national energy use, in acres
Table 3.
Land needed to feed and power a household of 2.5 people at today’s farm yields and national energy use, in acres
| Scenario | Food | Energy | Total | Times the median lot |
|---|---|---|---|---|
| Vegan diet, 160 W/m2 panels | 0.80 | 0.29 | 1.09 | 5.6 |
| Vegan diet, 200 W/m2 panels | 0.80 | 0.23 | 1.03 | 5.3 |
| Vegan diet, 220 W/m2 panels | 0.80 | 0.21 | 1.01 | 5.2 |
| Typical U.S. diet, 160 W/m2 panels | 6.67 | 0.29 | 6.96 | 35.6 |
| Typical U.S. diet, 220 W/m2 panels | 6.67 | 0.21 | 6.88 | 35.2 |
Table 4.
Land needed for a vegan household of 2.5 people with better technology, in acres and in median lots
Table 4.
Land needed for a vegan household of 2.5 people with better technology, in acres and in median lots
| Food land shrinks | Energy use unchanged | Energy use halved | Energy use quartered |
|---|---|---|---|
| Not at all () | 1.01 (5.2 lots) | 0.91 (4.6 lots) | 0.85 (4.4 lots) |
| By half () | 0.61 (3.1 lots) | 0.51 (2.6 lots) | 0.45 (2.3 lots) |
| Fivefold () | 0.37 (1.9 lots) | 0.27 (1.4 lots) | 0.21 (1.1 lots) |
| Tenfold () | 0.29 (1.5 lots) | 0.19 (0.95 lots) | 0.13 (0.68 lots) |
Disclaimer/Publisher’s Note: The statements, opinions and data contained in all publications are solely those of the individual author(s) and contributor(s) and not of MDPI and/or the editor(s). MDPI and/or the editor(s) disclaim responsibility for any injury to people or property resulting from any ideas, methods, instructions or products referred to in the content. |
© 2026 by the authors. Licensee MDPI, Basel, Switzerland. This article is an open access article distributed under the terms and conditions of the Creative Commons Attribution (CC BY) license (http://creativecommons.org/licenses/by/4.0/).
Copyright: This open access article is published under a Creative Commons CC BY 4.0 license, which permit the free download, distribution, and reuse, provided that the author and preprint are cited in any reuse.