

Submitted:
17 September 2026
Posted:
18 September 2026
You are already at the latest version
Abstract
Background/Objectives: Sodium–glucose cotransporter 2 (SGLT2) inhibitors are established in chronic kidney disease, but evidence in glomerular disease is limited and patients on intensified immunosuppression have been excluded from the randomised trials. We examined the effect of dapagliflozin on proteinuria and kidney function over two years in such a population. Methods: Single-centre retrospective cohort study with historical controls. 147 patients treated with dapagliflozin between 2021 and 2025 were compared with 170 patients seen between 2014 and 2021, most with biopsy-proven glomerular diseases. Proteinuria and estimated glomerular filtration rate (eGFR) were assessed at months 0, 12 and 24, and comparisons used analysis of covariance adjusted for baseline. Subgroups on intensified immunosuppression at entry were prespecified. Results: Proteinuria fell by 51.9% under dapagliflozin and by 22.2% in the historical cohort; the adjusted geometric mean ratio (GMR) was 0.684 (95% CI 0.534–0.877; p = 0.003). During the second year the decline in eGFR was 4.61 mL/min/1.73 m² per year slower under dapagliflozin (95% CI 1.83–7.40; p = 0.001), and an eGFR below 15 mL/min/1.73 m² was reached by 0.7% of treated patients against 11.8% of controls. Among patients on intensified immunosuppression, proteinuria fell by 67.5% when dapagliflozin was added, against 4.6% on the same treatment without it (adjusted GMR 0.371; 95% CI 0.236–0.583; p < 0.001). Conclusions: Dapagliflozin was associated with a progressive antiproteinuric effect, most marked in patients on intensified immunosuppression, and with stabilisation of kidney function. Given the observational design, these magnitudes should be read as an upper bound.
Keywords:
dapagliflozin
; SGLT2 inhibitors
; glomerular disease
; proteinuria
; glomerular filtration rate
; immunosuppression
; chronic kidney disease
; real-world evidence
1. Introduction
Chronic kidney disease (CKD) affects about 788 million adults worldwide, 14.2% of the adult population, and in 2023 was the ninth leading cause of death [1]. Against that background, sodium–glucose cotransporter 2 (SGLT2) inhibitors have substantially changed its treatment for the first time since renin–angiotensin system blockade with angiotensin-converting enzyme inhibitors (ACEi) and angiotensin receptor blockers (ARB). In the DAPA-CKD trial, dapagliflozin reduced a composite of kidney disease progression and death by 39% [2], and EMPA-KIDNEY confirmed the benefit of empagliflozin in a broader population, including patients with an estimated glomerular filtration rate (eGFR) as low as 20 mL/min/1.73 m² and those without albuminuria [3]. A meta-analysis of the large placebo-controlled trials of SGLT2 inhibitors confirmed that the kidney benefit is largely independent of diabetes status [4]. On this evidence the KDIGO 2024 guideline recommends an SGLT2 inhibitor for most adults with chronic kidney disease, alongside renin–angiotensin system blockade [5].
The mechanism is only partly haemodynamic: inhibition of proximal sodium reabsorption restores tubuloglomerular feedback and relieves glomerular hyperfiltration, but the class also alters tubular energy handling, oxygen consumption and inflammation, and the relative weight of these pathways remains debated [6,7]. The haemodynamic component produces a characteristic early dip in eGFR followed by a slower long-term decline; this dip is functional and reversible, and separating it from the subsequent chronic slope has become standard in the analysis of these trials [8]. Albuminuria falls in parallel, but a prespecified analysis of DAPA-CKD found the reduction to differ between patients with and without diabetes while clinical outcomes did not – part of the protection is probably mediated by pathways independent of albuminuria [9].
Evidence in glomerular disease is thinner: patients with glomerulopathies were a minority in the pivotal trials, and the largest single group, the 270 participants with IgA nephropathy in DAPA-CKD, showed a 71% reduction in a composite of kidney disease progression and death [10]. The data remain sparse for membranous nephropathy, focal segmental glomerulosclerosis and the proliferative glomerulonephritides, whose chapters have not been revised since 2021 [11]. For IgA nephropathy and lupus nephritis, the updated KDIGO guidelines of 2025 and 2024 now include SGLT2 inhibitors in supportive care [12,13]. The evidence using proteinuria as the outcome is limited and conflicting: the DIAMOND trial found no change in 24-hour proteinuria after six weeks of dapagliflozin [14], while a small study of empagliflozin reported a reduction [15].
A further gap concerns patients whose disease is actively treated. The largest observational cohort confined to non-diabetic glomerulopathies excluded anyone on induction immunosuppression – prednisone above 20 mg daily, rituximab or cyclophosphamide within the preceding six months – although stable maintenance treatment was allowed [16]; the same population is absent from the randomised trials. That background immunosuppression remains unexamined was pointed out some years ago [17], and a recent review concluded that the benefit probably extends to these patients but that the data are lacking [18]. Whether an antiproteinuric effect can be demonstrated on top of intensified immunosuppression, and whether it differs from that seen in quiescent disease, is therefore unknown.
Real-world evidence is unevenly distributed and particularly scarce from eastern Europe [19,20]. Few cohorts follow the full two-year trajectory of both proteinuria and eGFR in a population defined by biopsy rather than by an albuminuria threshold.
We examined the effect of dapagliflozin on proteinuria and kidney function over two years in a Bulgarian cohort with predominantly biopsy-proven glomerular disease, compared with a historical cohort from the same centre treated before SGLT2 inhibitors entered routine clinical practice. We asked three questions: whether dapagliflozin reduces proteinuria and slows the decline in eGFR; whether any such effect persists after adjustment for baseline values and blood pressure; and whether it differs in patients on intensified immunosuppression.
2. Materials and Methods
2.1. Design, Setting and Participants
We conducted a single-centre retrospective cohort study with historical controls at the Clinic of Nephrology, University Hospital "Tsaritsa Yoanna – ISUL", Sofia; the dapagliflozin cohort was treated and followed between September 2021 and December 2025. The historical cohort was followed at the same clinic between February 2014 and September 2021, before SGLT2 inhibitors entered routine practice. The periods do not overlap and no patient appears in both cohorts.
Of 301 patients who received dapagliflozin, 147 met the criteria and were analysed. Excluded were 145 who, though still on treatment, lacked a complete set of assessments at all three visits, one who declined consent, five who stopped treatment of their own accord and three in whom it was withdrawn for recurrent urinary tract infection. The historical cohort comprised all 170 patients from the corresponding period who met the same criteria; no further selection was applied.
Patients were eligible if they were aged 18 or over, had CKD by the KDIGO 2024 criteria and an eGFR of at least 25 mL/min/1.73 m², and had complete data from three admissions for scheduled review of their glomerular disease – at baseline and at approximately 12 and 24 months, within a window of one month. CKD was defined as abnormalities of kidney structure or function persisting for more than three months, that is, an eGFR below 60 mL/min/1.73 m² or a marker of kidney damage – proteinuria, urine sediment abnormalities, imaging or histological abnormalities – and was staged by eGFR. All patients were required to have given the standard written consent for the use of their clinical data for scientific purposes; one patient declined and was not included. Exclusion criteria were acute kidney injury on CKD, active infection of any kind including urinary tract infection at the time of sampling at any visit, obstructive uropathy, terminal malignancy and an eGFR below 25 mL/min/1.73 m². Refusal of consent for the use of clinical data was a further ground for exclusion.
2.2. Assessments
Patients were admitted at baseline and at 12 and 24 months for history, examination and laboratory work. Recorded variables were age, sex, diagnosis and its histological confirmation, coexisting diabetes and hypertension, concomitant medication, blood pressure and peripheral oedema, a standard biochemical and haematological panel (Table 1), and 24-hour urinary protein. Blood pressure followed the standardised office protocol recommended by KDIGO [21], and mean arterial pressure was derived as diastolic pressure plus one third of the pulse pressure. All renal biopsies were reported by a single pathologist. Records were extracted by investigators who took no part in the analysis.
The laboratory used one analytical platform throughout both periods. Creatinine was measured by a standardised, IDMS-traceable compensated Jaffe (alkaline picrate) assay on an Abbott Architect c8000 and eGFR derived from the race-free 2021 CKD-EPI equation [22]; proteinuria came from 24-hour collections and is given in g/24h.
2.3. Treatment of Glomerular Diseases and Definition of Intensified Immunosuppression
Glomerular disease was treated according to the KDIGO recommendations in force at the time – the 2012 guideline for the historical cohort [23] and its 2021 revision with subsequent updates for the dapagliflozin cohort [11,12,13] – with corticosteroids, cyclophosphamide, azathioprine, mycophenolate mofetil, ciclosporin or intravenous immunoglobulin, alone or in combination as the diagnosis required.
Subgroups were specified in advance: in each cohort, patients whose disease was active enough at entry to require intensified immunosuppression, defined by a corticosteroid dose reaching the equivalent of 20 mg prednisolone daily at any point in the preceding three months. Whichever agents a given glomerulopathy calls for, an active flare is treated with corticosteroid at or above this dose, so the threshold marks clinically active disease rather than any particular regimen.
Membership was fixed at baseline: patients meeting the criterion at entry were followed to month 24 whatever became of their treatment, and those who did not were never added. Two considerations argued for this. Immunosuppression is intensified in response to rising proteinuria, so a subgroup reassembled at each visit would have been defined partly by the outcome under study; and since therapy changed throughout follow-up, visit-by-visit assignment would have yielded a different set of patients at each time point.
2.4. Ethics
The Ethics Committee of University Hospital "Tsaritsa Yoanna – ISUL" approved the study (protocol 002, approved 09.09.2026), which was conducted in accordance with the Declaration of Helsinki (2013 revision). All patients had given written consent on admission for the use of their clinical data for scientific purposes. The Ethics Committee waived the requirement for separate study-specific consent, the analysis resting entirely on existing, anonymised records. Data were anonymised in both cohorts before analysis.
2.5. Statistical Analysis
Normality was assessed graphically and by Shapiro–Wilk test. Skewed variables are given as medians (IQR), additive quantities as means (95% CI) and categorical variables as n (%). Baseline comparisons used the Mann–Whitney U, χ² or Fisher's exact test; all tests were two-sided with p < 0.05 taken as significant. Data were complete at every visit, so nothing was imputed. No sample size calculation was performed, the cohorts comprising every eligible patient in the two periods, and no matching was applied; comparability was addressed by analysis of covariance.
Proteinuria, being strongly right-skewed, was log-transformed and effects expressed as geometric mean ratios (GMR) with 95% CI. Within-cohort change used the Friedman test with pairwise Wilcoxon signed-rank tests on log values, Bonferroni-corrected for three comparisons. eGFR is additive and was analysed untransformed, changes given as means (95% CI) and medians (IQR) with significance from the same rank-based tests. Rates of change in eGFR were annualised for the whole period, the first year and the second; the last served as the principal measure of chronic decline, since the early haemodynamic dip is reversible and would otherwise offset the treatment effect.
The cohorts began at different levels of both outcomes, and regression to the mean flatters whichever begins higher, so the principal comparisons were made by analysis of covariance: log month-24 proteinuria on log baseline; the change in eGFR over the second year on baseline and, in a further model, on month-12 eGFR. Blood pressure was handled the same way, and sensitivity analyses added mean arterial pressure at baseline and month 24 to both outcome models. Slopes were homogeneous throughout.
Categorical outcomes were prespecified. For proteinuria: reductions ≥30% and ≥50%, complete remission (<0.3 g/24h), partial remission (<3.5 g/24h with ≥50% reduction) and progression (≥30% increase); for eGFR, declines ≥30% and ≥40%, eGFR <15 mL/min/1.73 m², rapid decline (>5 mL/min/1.73 m² per year) and a three-way trajectory classification taking ±10% as stability, that being the order of biological and analytical variation. These used Fisher's exact test, with odds ratios and 95% CI. Within-cohort change in the prevalence of peripheral oedema was assessed with the exact McNemar test, and the association between changes in blood pressure and in proteinuria with the Spearman rank correlation coefficient.
Subgroup comparisons are reported with the corresponding interaction term and with a supporting model containing diagnostic category. Subgroup and stratified analyses were exploratory and carry no multiplicity adjustment beyond the Bonferroni correction described above. Reporting follows STROBE [24].
Analyses used GraphPad Prism 5.0 (GraphPad Software, San Diego, CA, USA) and Python 3.12 (Python Software Foundation) with the SciPy and statsmodels libraries; the covariance models and interaction tests were run in Python, being unavailable in Prism 5.0.
During the preparation of this manuscript, the authors used Claude (Anthropic, version accessed August 2026) to assist with statistical analysis and the preparation of figures. The authors have reviewed and edited the output and take full responsibility for the content of this publication.
3. Results
Baseline characteristics are given in Table 1. The dapagliflozin cohort was older (median 53 versus 47 years; p = 0.001) and had more advanced kidney disease (median eGFR 50.0 versus 67.0 mL/min/1.73 m²; p = 0.001), with more hypertension (91.2% versus 80.6%) and diabetes (27.2% versus 17.6%). Biopsy-proven immune nephropathy was present in 77.5% and 79.4% respectively.
3.1. Proteinuria
Proteinuria was measured at entry and at months 12 and 24 in all 317 patients, with no missing values. Under dapagliflozin it went on falling into the second year, whereas in the historical cohort it changed little after month 12; the same picture, more pronounced, emerged among patients on intensified immunosuppression.
3.2. All Patients
Median baseline proteinuria was 0.95 g/24h (IQR 0.38–2.41) under dapagliflozin and 0.62 g/24h (IQR 0.24–1.94) in the historical cohort (p = 0.078). Table 2 summarises the subsequent course.
Under dapagliflozin proteinuria fell at every interval (Friedman χ² = 66.4, p < 0.001): by 33.8% at month 12 (GMR 0.662, 95% CI 0.560–0.781) and by 51.9% at month 24 (GMR 0.481, 95% CI 0.399–0.579), with a further 27.4% accruing during the second year alone (GMR 0.726, 95% CI 0.629–0.839). The effect accumulated rather than plateauing after an initial response.
The course in the historical cohort was different. The whole of its change occurred during the first year, when proteinuria fell by 22.3% (GMR 0.777, 95% CI 0.633–0.953; adjusted p = 0.013); thereafter it plateaued (GMR for months 12 to 24, 1.002, 95% CI 0.835–1.202), and the cumulative 24-month reduction did not survive correction for multiple comparisons (GMR 0.778, 95% CI 0.638–0.948; adjusted p = 0.063). Figure 1a shows the diverging trajectories.
Comparing the individual changes directly, the cohorts did not differ at month 12 (ratio of GMRs 0.852, 95% CI 0.656–1.106; p = 0.064) but did so markedly at month 24 (0.618, 95% CI 0.472–0.809; p < 0.001).
Regression to the mean proved considerable: the coefficient on baseline proteinuria was 0.624 (95% CI 0.535–0.713); without regression to the mean it would have been close to unity. It accounted for only part of the difference. With baseline held constant, month-24 proteinuria was 31.6% lower under dapagliflozin (adjusted GMR 0.684, 95% CI 0.534–0.877; p = 0.003; slopes homogeneous, interaction p = 0.574), and adjustment for blood pressure barely altered this (Section 3.3). Figure 1b shows the fitted lines with the individual observations.
Responder rates are given in Table 3. A reduction of at least 30%, a validated surrogate endpoint in glomerular disease, was reached by 59.2% under dapagliflozin against 38.2% of the historical cohort (OR 2.34, 95% CI 1.49–3.68; p < 0.001), and a reduction of at least 50% by 48.3% against 25.9% (OR 2.68, 95% CI 1.67–4.29). Progression ran the other way, occurring in 17.0% against 30.6% (OR 0.47, 95% CI 0.27–0.80; p = 0.006). Complete remission was the one outcome that did not favour dapagliflozin (33.3% against 40.6%; OR 0.73, 95% CI 0.46–1.16; p = 0.20), the historical cohort's lower baseline placing it closer to the threshold. Figure 1c shows the individual responses.
An exploratory analysis stratified by baseline proteinuria showed a consistent difference across the subnephrotic range: below 0.5 g/24h the dapagliflozin cohort improved while the historical cohort worsened (GMR 0.784 versus 1.245; p = 0.047), with the same ordering at 0.5–1.0 g/24h (0.474 versus 0.849; p = 0.074) and 1.0–3.5 g/24h (0.368 versus 0.611; p = 0.010). Above 3.5 g/24h both improved almost identically (0.265 versus 0.261; p = 0.39). Only 19 and 24 patients fell into this uppermost stratum and intensified immunosuppression was concentrated within it, so baseline proteinuria alone gives an incomplete account of who responded; treatment status at entry is examined next.
Patients Receiving Intensified Immunosuppression at Baseline
Forty-one patients under dapagliflozin and 57 in the historical cohort were on intensified immunosuppression at entry. Baseline proteinuria was again numerically higher under dapagliflozin without reaching significance (1.14 g/24h, IQR 0.28–2.35 versus 0.59 g/24h, IQR 0.25–2.88; p = 0.41).
Since these subgroups were defined at entry, treatment could and did change thereafter. Under dapagliflozin, 26 of the 41 patients (63.4%) still met the dose criterion at month 12 and 19 (46.3%) at month 24; in the historical cohort the figures were closely similar, 38 of 57 (66.7%) and 31 (54.4%). Neither difference approached significance (p = 0.83 and p = 0.54), so exposure to intensified immunosuppression was comparable and the divergence described below cannot be attributed to a differential rate of immunosuppression withdrawal.
In this subgroup the difference between the cohorts was more pronounced than in the full analysis (Table 4, Figure 2a). Under dapagliflozin proteinuria fell by 45.2% in the first year (GMR 0.548, 95% CI 0.397–0.757) and by 67.5% by month 24 (GMR 0.325, 95% CI 0.226–0.467; Friedman χ² = 36.5, p < 0.001), with a further 40.8% during the second year alone (GMR 0.592, 95% CI 0.446–0.785). The historical cohort did not improve.
Proteinuria in the historical cohort changed little in the first year (GMR 0.816, 95% CI 0.562–1.185; adjusted p = 0.48) and then drifted upwards (GMR for months 12 to 24, 1.168, 95% CI 0.825–1.654), leaving a cumulative change of 4.6% (GMR 0.954, 95% CI 0.694–1.310; Friedman χ² = 4.71, p = 0.10). It did not fall further over the two years despite continuing immunosuppression and renin–angiotensin system blockade.
The cohorts were not clearly separated at month 12 (ratio of GMRs 0.672, 95% CI 0.415–1.086; p = 0.055) but were markedly so by month 24 (0.340, 95% CI 0.213–0.545; p < 0.001). Adjusted for baseline, month-24 proteinuria was 62.9% lower under dapagliflozin (adjusted GMR 0.371, 95% CI 0.236–0.583; p < 0.001; slopes homogeneous, interaction p = 0.66) (Figure 2b).
Responder rates followed the same pattern (Table 5, Figure 2c). A reduction of at least 30% was reached by 73.2% under dapagliflozin against 31.6% in the historical cohort (OR 5.91, 95% CI 2.43–14.37; p < 0.001), while progression occurred in 7.3% against 36.8% (OR 0.14, 95% CI 0.04–0.49; p < 0.001). Complete remission again did not separate the cohorts (39.0% versus 35.1%; OR 1.18, 95% CI 0.52–2.72; p = 0.83).
Histological diagnosis was available in 39 of the 41 patients under dapagliflozin and 48 of the 57 in the historical cohort; the rest had not undergone biopsy and were treated empirically. Diagnostic composition was broadly alike, though proliferative and immune-complex nephropathies were somewhat commoner in the historical cohort and podocytopathies under dapagliflozin (Table 6; χ² across the three categories, p = 0.21).
These entities differ in natural history, so the covariance model was repeated with diagnostic category included. It made little difference: across the 87 patients with a histological diagnosis the adjusted GMR moved from 0.371 to 0.408 (95% CI 0.245–0.678; p < 0.001), leaving the divergence unexplained by diagnostic composition.
The effect was similar in direction and magnitude across all categories. In proliferative and immune-complex nephropathies proteinuria fell by 58.9% under dapagliflozin against a slight rise in the historical cohort (GMR 0.411 versus 1.047; p = 0.002); in podocytopathies it fell by 78.6% against 29.9% (0.214 versus 0.701; p = 0.010). Only ten patients fell into the remaining category, too few to interpret (0.406 versus 0.751; p = 0.76). There was no evidence of heterogeneity (interaction p = 1.00).
Among the 219 patients not on intensified immunosuppression at baseline, dapagliflozin had no detectable effect on proteinuria (adjusted GMR 0.894, 95% CI 0.668–1.196; p = 0.45), and the contrast with the subgroup was supported by a formal test for interaction (p = 0.002). The antiproteinuric effect thus appears concentrated among patients whose disease was active enough to require intensified treatment. The analysis was exploratory, unadjusted for multiplicity, and needs confirmation in an independent cohort.
3.3. Kidney Function
Both cohorts lost eGFR over the two years, but the timing differed: under dapagliflozin the decline was confined to the first year, whereas in the historical cohort it continued and accelerated during the second.
3.3.1. All Patients
The dapagliflozin cohort began with worse kidney function: median eGFR 50.0 mL/min/1.73 m² (IQR 31.1–67.3) against 67.0 (IQR 37.9–92.0; p = 0.001), reflecting its higher proportion of patients in stages G3b and G4 (Table 1). Table 7 summarises the subsequent course.
Under dapagliflozin eGFR fell by 2.92 mL/min/1.73 m² during the first year (95% CI −4.90 to −0.94; adjusted p = 0.004) and then stopped falling: the change over the second year was −0.06 (95% CI −1.96 to +1.85), indistinguishable from zero. The historical cohort did the reverse — a smaller, non-significant first-year change (−2.19; 95% CI −4.81 to +0.43) followed by accelerating decline of −5.09 over the second year (95% CI −7.05 to −3.14; adjusted p < 0.001). Cumulative losses were −2.98 and −7.28 mL/min/1.73 m² (Figure 3a).
The early fall under dapagliflozin is the expected haemodynamic dip; since it moves eGFR downwards, any window spanning months 0 to 24 understates the treatment effect, and the chronic rate of change, between months 12 and 24, was therefore taken as the principal measure.
Annualised rates bear this out. Over months 0 to 24 the decline was −1.49 mL/min/1.73 m² per year under dapagliflozin against −3.64 in the historical cohort, a difference of 2.15 (95% CI 0.45–3.86; p = 0.005). During the first year the cohorts were indistinguishable (−0.73; 95% CI −3.99 to +2.53; p = 0.56), as expected if the dip offsets the early benefit, but over the second the difference widened to 5.04 per year (95% CI 2.33–7.75; p < 0.001).
Adjusting month-24 eGFR for its baseline gave a difference of 2.51 mL/min/1.73 m² in favour of dapagliflozin, which did not reach significance (95% CI −0.91 to +5.92; p = 0.15). That is no surprise. Baseline eGFR alone explained most of the variation in the month-24 value (coefficient 0.864, 95% CI 0.811–0.917; R² = 0.77), leaving little room in which an effect could show. Modelling the total annual rate instead makes no difference, since adjusting a follow-up value for its own baseline and adjusting the corresponding change for that same baseline come to the same thing.
Separating the two phases is another matter. It asks a different question, and the answer differs. Taking the chronic rate as the outcome, dapagliflozin was ahead by 4.61 mL/min/1.73 m² per year (95% CI 1.83–7.40; p = 0.001) – adjusted rates of −0.28 against −4.90 at the mean baseline (Figure 3b). Adding month-12 eGFR, so that both cohorts start from the same point once the dip has resolved, barely changed this (3.92 per year; 95% CI 1.35–6.50; p = 0.003); the second-year divergence is therefore not simply a reflection of where the cohorts stood at month 12. Adjusting for blood pressure left it much the same (Section 3.3). Slopes were homogeneous throughout (all interaction p ≥ 0.37).
Categorical outcomes point the same way (Table 8). A decline of at least 40%, a validated surrogate for progression to kidney failure, occurred in 5.4% under dapagliflozin against 14.1% in the historical cohort (OR 0.35, 95% CI 0.15–0.81; p = 0.014), and rapid decline in 27.2% against 42.4% (OR 0.51, 95% CI 0.32–0.82; p = 0.007). The gap in eGFR below 15 mL/min/1.73 m² was wider still – one patient against 20 (0.7% versus 11.8%; OR 0.05, 95% CI 0.01–0.39; p < 0.001) – the more striking because the dapagliflozin cohort had started lower.
Classifying each patient by the direction of change, and taking ±10% as stability, fewer treated patients lost more than 10% of their baseline eGFR (44.9% versus 57.1%; OR 0.61, 95% CI 0.39–0.96; p = 0.033) and in more of them eGFR rose by more than 10% (25.2% versus 15.9%; OR 1.78, 95% CI 1.02–3.10; p = 0.049); similar proportions stayed stable (29.9% versus 27.1%). Across the three categories together the difference just missed conventional significance (χ² p = 0.053). Figure 3c shows the individual changes.
3.3.2. Patients Receiving Intensified Immunosuppression at Baseline
The same subgroup was examined for kidney function. Its members had better preserved eGFR than the cohorts as a whole, as would be expected where immune disease is active but has not yet caused advanced structural damage: median 62.0 mL/min/1.73 m² (IQR 37.0–90.6) under dapagliflozin and 82.1 (IQR 44.0–104.0) in the historical cohort (p = 0.24). Table 9 sets out the 24-month course.
The direction of change matched the full cohorts. Under dapagliflozin eGFR fell by 4.68 mL/min/1.73 m² in the first year (95% CI −8.63 to −0.72; adjusted p = 0.042) and then stopped falling, the change over the second being +0.29 (95% CI −3.87 to +4.44), leaving a cumulative change of −4.39 (95% CI −9.71 to +0.93). The historical cohort declined throughout, losing 9.67 mL/min/1.73 m² over the two years (95% CI −15.03 to −4.31), of which 6.62 came in the second year alone (95% CI −10.83 to −2.41; adjusted p = 0.013).
Adjusted for baseline, the chronic rate of eGFR decline differed by 6.45 mL/min/1.73 m² per year in favour of dapagliflozin (95% CI 0.47–12.42; p = 0.037; interaction p = 0.70); adding month-12 eGFR, so that the cohorts are compared from the same point, left the estimate almost unchanged (5.69 per year; 95% CI 0.02–11.35; p = 0.052). Among categorical outcomes only the most extreme separated the cohorts: no patient on dapagliflozin reached an eGFR below 15 mL/min/1.73 m² at month 24, against nine of 57 in the historical cohort (0.0% versus 15.8%; p = 0.009). A decline of at least 40% occurred in 4.9% against 17.5% (p = 0.069) and rapid decline in 36.6% against 50.9% (p = 0.22), both favouring dapagliflozin without reaching significance.
These estimates are less precise than those from the full cohorts, and the subgroup is small. Unlike the corresponding analysis of proteinuria, however, it gives no sign that the effect on eGFR depends on intensified immunosuppression: the test for interaction was negative (p = 0.34), and among the 219 patients not on such therapy the adjusted difference was 3.91 mL/min/1.73 m² per year (95% CI 0.86–6.95; p = 0.013). The effect on the rate of eGFR decline therefore appears comparable in patients with and without intensified immunosuppression, in contrast to its effect on proteinuria – though the analysis is exploratory and uncorrected for multiple comparisons.
3.4. Blood Pressure and Oedema
The cohorts were well matched at entry, with no difference in systolic (p = 0.65), diastolic (p = 0.25) or mean arterial pressure (p = 0.88). Table 10 gives the subsequent course.
Blood pressure fell under dapagliflozin and did not change in the historical cohort. Systolic pressure fell by 6.31 mmHg in the first year (95% CI −9.34 to −3.29; adjusted p < 0.001) and by 6.54 over the two years (95% CI −9.99 to −3.10; adjusted p = 0.002), with no further change after month 12 (−0.23; 95% CI −3.14 to +2.68). Mean arterial pressure followed the same course, falling by 3.77 mmHg (95% CI −6.12 to −1.42; adjusted p = 0.017). The diastolic fall was smaller and confined to the first year (−3.57; 95% CI −5.37 to −1.77; adjusted p = 0.001). Nothing changed in the historical cohort at any interval (all Friedman p ≥ 0.28).
Adjusted for baseline, systolic pressure was lower under dapagliflozin at both visits – by 4.09 mmHg at month 12 (95% CI −7.62 to −0.56; p = 0.024) and 4.21 at month 24 (95% CI −7.93 to −0.49; p = 0.027) – as was mean arterial pressure (−3.53; 95% CI −5.68 to −1.39; p = 0.001, and −2.60; 95% CI −5.06 to −0.14; p = 0.039). The difference in diastolic pressure was confined to the first year (−3.35 at month 12; 95% CI −5.17 to −1.54; p < 0.001) and had gone by month 24 (−1.50; 95% CI −3.63 to +0.62; p = 0.17). Slopes were homogeneous throughout (all interaction p ≥ 0.10). The size and timing of these changes are what sodium–glucose cotransporter 2 inhibition would be expected to produce.
Peripheral oedema was equally common throughout, affecting 27.2% and 28.8% at entry and 21.8% and 22.4% at month 24, respectively (all p ≥ 0.70), with a slight fall in both cohorts that did not reach significance (McNemar test, adjusted p = 0.65 and p = 0.35). Neither volume depletion nor worsening fluid overload was apparent under dapagliflozin.
A fall of this size could in principle account for part of the antiproteinuric effect, so the covariance models were repeated with mean arterial pressure at baseline and month 24 added. The effect barely weakened: the adjusted GMR moved from 0.684 to 0.707 (95% CI 0.552–0.907; p = 0.007), and adjusting for systolic pressure instead gave 0.719 (95% CI 0.561–0.921; p = 0.010). In the subgroup on intensified immunosuppression the estimate changed little (0.371 to 0.376; 95% CI 0.235–0.603), and the chronic rate of eGFR decline was likewise almost unaffected (4.61 to 4.47 per year; 95% CI 1.65–7.30; p = 0.002).
The size of the association argues against blood pressure as the principal mechanism for the antiproteinuric effect. In the fully adjusted model each 1 mmHg of mean arterial pressure at month 24 corresponded to a 1.3% difference in proteinuria (p = 0.024), so the 4 mmHg fall observed here would account for about 5%, against the 51.9% actually seen. The two also follow different time courses: blood pressure reached its nadir by month 12 and fell no further, whereas proteinuria went on declining through the second year. The correlation between the change in mean arterial pressure and the change in proteinuria was weak and virtually identical in the cohorts (Spearman r = 0.195, p = 0.018 and r = 0.193, p = 0.012, respectively), which is not what a mediator of the treatment effect would produce.
3.5. Tolerability and Persistence with Treatment
The persistence was assessed in all 301 patients who received dapagliflozin. Treatment was discontinued in eight (2.7%): five at the patient's own request and three (1.0%) for recurrent urinary tract infection. No other adverse event led to withdrawal, giving a persistence of 97.3%.
Among the 147 patients analysed, no adverse event attributable to dapagliflozin was recorded and none discontinued. Given the retrospective design this reflects the absence of documented events rather than active surveillance, and mild reactions managed outside the clinic will have been under-ascertained. The rate of discontinuation for urinary tract infection, however, matches that reported in the randomised trials, suggesting that serious events were reasonably well captured.
4. Discussion
Over two years, in 317 patients most with biopsy-proven glomerular disease, dapagliflozin was associated with a substantial and progressive fall in proteinuria and with stabilisation of kidney function. More telling than the size of the effect is its shape, and here three things stand out. Proteinuria kept falling into the second year rather than plateauing. Loss of eGFR was confined to the first year and had all but stopped by month 24, while in the historical cohort it accelerated. And the antiproteinuric effect was concentrated among patients whose disease was active enough to require intensified immunosuppression – a group the comparable literature has set aside.
4.1. Proteinuria
Our effect on proteinuria was larger than the randomised trials report. DAPA-CKD found a 29.3% reduction in geometric mean albumin-to-creatinine ratio overall, but only 14.8% (95% CI 5.9–22.9) in participants without type 2 diabetes [9]; the clinical benefit in that subgroup was nonetheless clear [25]. We found 31.6% overall and 62.9% in the subgroup on intensified immunosuppression. Part of the difference comes from the measure itself: 24-hour protein excretion and the albumin-to-creatinine ratio do not measure the same thing in glomerular disease. Another part comes from the population, defined here by biopsy rather than by an albuminuria threshold and more heterogeneous than a trial cohort, as routine practice is. Together they do not account for the whole gap. Since dapagliflozin became standard of care as soon as it was introduced, a contemporaneous control group was not available; a comparison against historical controls, however, does not exclude residual confounding, and when an observational estimate exceeds the randomised evidence for the same drug, it is better interpreted as an upper bound than as a truer measurement.
The DIAMOND trial makes a different point. It randomised patients with non-diabetic proteinuric CKD, an eGFR above 25 mL/min/1.73 m² and 24-hour proteinuria of 500–3500 mg (close to our population) and found no effect on proteinuria at all, though the acute fall in measured GFR appeared as expected [14]. It ran for six weeks. Our data suggest why that may be too short: proteinuria fell by 33.8% in the first year and by a further 27.4% in the second, reaching 40.8% in the second year among patients on intensified immunosuppression. An effect accruing over months to years will escape a six-week study, so the null result of DIAMOND sets a lower limit on the time required rather than casting doubt on whether the effect exists. A more recent crossover trial in non-diabetic stage 4 disease, with iohexol-measured GFR and 24-hour proteinuria as co-primary outcomes, was similarly short [26].
Two observational series offer closer comparison. The international cohort of the Immunonephrology Working Group of the European Renal Association and the Spanish GLOSEN group followed 493 patients with biopsy-proven glomerulonephritis and residual proteinuria of at least 1 g/day on renin-angiotensin blockade, reporting reductions of 35%, 41%, 45% and 48% at 3, 6, 9 and 12 months, consistent across the underlying diseases [27]. Our 33.8% at 12 months is of the same order, and the trajectory (a reduction that deepens rather than settling) is the same. A second series, confined to non-diabetic glomerulopathies and also measuring proteinuria in g/24 h, assessed it at 3–6 months and excluded patients on induction immunosuppression [16]. Our cohort complements both rather than repeating them: in the length of follow-up, and in the second case in the very patients that series set aside.
The largest real-world experience with dapagliflozin points the same way. Across 93 Italian renal clinics, 1724 patients treated for a mean of four months showed a 25% fall in albuminuria, with a reduction of at least 30% in 48.3% [28]. Our responder rate in the second year was 59.2%. The two are not directly comparable – a much shorter exposure, albuminuria rather than 24-hour proteinuria, and a population defined by chronic kidney disease rather than by glomerular diagnosis, a distinction that the Italian study could not make – but the direction is what an accruing effect would predict.
4.2. Kidney Function
Kidney function behaved as the pharmacology predicts. In the treated cohort eGFR fell by 2.92 mL/min/1.73 m² in the first year – the haemodynamic dip that follows restoration of tubuloglomerular feedback – and then all but stopped falling, the change over the second year being −0.06 (95% CI −1.96 to +1.85). In the historical cohort the reverse held: the decline in eGFR accelerated to 5.09 mL/min/1.73 m² in the second year. The chronic slope, between months 12 and 24, is the component most closely related to subsequent clinical events, and the case for using it rather than total decline rests on a meta-analysis of 47 randomised trials in more than 60 000 participants and on the workshops convened by the National Kidney Foundation with the Food and Drug Administration and the European Medicines Agency [29,30].
Again our estimate outruns the randomised evidence. DAPA-CKD reported a difference in eGFR chronic slope of 1.29 mL/min/1.73 m² per year (95% CI 0.73–1.85) in patients without type 2 diabetes and 2.26 (1.88–2.64) in patients with diabetes, and a difference in total slope, over a median 2.4 years, of 0.95 (0.63–1.27) [8]; the prespecified analysis in focal segmental glomerulosclerosis gave 2.0 (0.6–3.5) [31]. EMPA-KIDNEY pointed the same way, its secondary analyses showing benefit on chronic slope across primary kidney diseases including glomerulonephritis [32,33]. We found 4.61 mL/min/1.73 m² (1.83–7.40) for the chronic rate and 2.15 (0.45–3.86) for the total. The direction matches; the magnitude does not.
Two features could explain why the difference in the rate of eGFR decline between our dapagliflozin and historical cohorts exceeds that reported in the trials. The chronic slope in our study and that in DAPA-CKD are not measured over the same period. Ours covers the second year alone, after the dip has resolved. In DAPA-CKD the first year is included as well, while kidney function is still recovering from the dip. The difference in chronic slope reported in DAPA-CKD is therefore smaller than ours. Both of our cohorts, moreover, include patients with active immune diseases, whom the randomised trials excluded; in these conditions part of the early loss of function is potentially reversible, and dapagliflozin allows that recovery to be more complete – a possible additive effect to immunosuppression, to which we return below.
One result, however, is not explained this way. At month 24 a single patient on dapagliflozin had an eGFR below 15 mL/min/1.73 m², against 20 of 170 in the historical cohort (0.7% versus 11.8%; p < 0.001). Since the dapagliflozin cohort started from the lower median eGFR — 50.0 against 67.0 – the baseline imbalance works against this finding rather than for it. Rapid decline, defined as a loss of eGFR exceeding 5 mL/min/1.73 m² per year, was likewise less common (27.2% versus 42.4%; p = 0.007).
4.3. Effect Modification by Intensified Immunosuppression
The least expected finding concerns patients whose disease was active at entry. Among them, month-24 proteinuria was 62.9% lower in the dapagliflozin than in the historical cohort at the same baseline value (adjusted GMR 0.371, 95% CI 0.236–0.583), whereas among the 219 patients from both cohorts not on intensified immunosuppression no such difference was found (GMR 0.894, 95% CI 0.668–1.196; p = 0.45); the difference between the two subgroups was significant (p = 0.002). Adding diagnostic category to the model barely changed the estimate (GMR 0.408), and the effect was similar across all diagnoses.
Published studies have approached these patients differently. The randomised trials excluded patients on high-dose immunosuppression altogether. The ERA–GLOSEN cohort excluded patients on induction treatment but kept 79 (16%) on maintenance immunosuppression, and found the proportion reaching a 30% reduction in proteinuria to be identical in them and in those not receiving immunosuppression (p = 0.89) [27]. The series confined to non-diabetic glomerulopathies excluded anyone on prednisone above 20 mg daily, rituximab or cyclophosphamide within six months – our own threshold, used there as an exclusion criterion [16]. Some years ago it was pointed out that background immunosuppression remains the unexamined variable in this field [17], and a recent review concluded that the benefit probably extends to such patients, though the data to show it are lacking [18]. Whether SGLT2 inhibitors belong in the routine management of glomerular disease, and on what evidence, has been debated directly between the groups working on it [34]. Two studies point the other way and must be set against ours. In a prospective cohort of 93 patients with biopsy-proven IgA nephropathy on full-dose renin–angiotensin blockade, SGLT2 inhibition reduced 24-hour proteinuria by 22.9% at three months and 27.1% at six, independently of immunosuppressive use [35]. More directly, the ERA-GLOSEN investigators found that a serum albumin below 3.5 g/dL at initiation made a 30% reduction in proteinuria less likely (odds ratio 0.53, 95% CI 0.30–0.91), and concluded that patients with active disease are unlikely to respond [27]. That is the opposite of what we observed.
That conclusion, however, does not follow from a prespecified criterion of activity: serum albumin was one of several candidate predictors in a regression model and was then read as a marker of activity. Albumin captures the nephrotic syndrome rather than immune activity. Many glomerulonephritides, including IgA nephropathy and lupus nephritis, are active with a preserved albumin, and it also falls for reasons other than urinary protein loss, such as inflammation, malnutrition or liver disease. Our own marker, the corticosteroid dose, reflects something different: the clinical judgement that the disease required intensified treatment. It too, however, remains clinical rather than histological, and how closely clinical activity tracks morphological activity is not known.
There is a plainer possibility that has to be weighed first. If the baseline visit fell at a different point in the treatment course in the two cohorts – the historical patients caught once immunosuppression had already worked, those on dapagliflozin caught as it was starting – the difference would belong to the design rather than to the drug. Three things argue against it. The historical subgroup was, if anything, the more active at entry: proteinuria of 3.5 g/24h or more in 19.3% against 14.6%, serum albumin below 35 g/L in 21.1% against 9.8%, and much the same prevalence of oedema. High-dose corticosteroid was withdrawn at the same pace in both, 66.7% and 65.9% still above the dose threshold at month 12, which is not what one would see had the historical patients been further along. And the estimate held when the analysis was confined to comparable baseline values: adjusted GMR 0.399 above 0.5 g/24h, 0.369 above 1.0 g/24h and 0.378 above 1.5 g/24h, against 0.371 in the subgroup as a whole. The date on which immunosuppression began was not recorded, however, so a difference in timing cannot be ruled out.
Within the historical cohort the subgroup on intensified immunosuppression fared worse than the remaining 113 patients of that cohort – a 4.6% fall against 29.8% – and of the 57, the 38 still above the dose threshold at month 12 did not improve at all, while the 19 who had been tapered fell by 13.5%. High-dose treatment at entry therefore marks disease not yet controlled rather than disease about to remit, and the absence of spontaneous improvement is what one would expect.
A mechanism has nonetheless been proposed: beyond haemodynamics, SGLT2 inhibitors modulate inflammation, immunometabolism and oxidative stress, and might thereby reduce the activity of glomerulonephritis itself – though the review setting this out described the evidence as speculative and awaiting clinical, histological and molecular confirmation [18]. Experimental work points the same way: in proteinuric non-diabetic nephropathy dapagliflozin limited podocyte damage independently of any glycaemic effect [36]. Patients on intensified immunosuppression also begin from higher proteinuria, and adjustment for baseline is not randomisation; the finding is exploratory and needs confirming.
4.4. Blood Pressure Is Not the Explanation
Blood pressure fell further under dapagliflozin than in the historical cohort – systolic by 6.54 against 1.56 mmHg – in magnitude and timing what this class of drug usually produces. It accounts, however, for very little of the effect on proteinuria. Adjusting for mean arterial pressure moved the estimate only from 0.684 to 0.707, and a 4 mmHg fall corresponds to about a 5% reduction in proteinuria, against the 51.9% observed. The timing differs too: blood pressure reached its lowest point at month 12 and went no further, while proteinuria kept falling. And where blood pressure did fall, proteinuria fell no more steeply under dapagliflozin than in the historical cohort, which is not what would be expected if the one were driving the other.
4.5. Limitations and Strengths
The limitations follow chiefly from the design. Historical controls cannot simply be assumed comparable: concomitant care, referral patterns and thresholds for intervention all moved between 2014 and 2025. The cohorts were imbalanced at entry, most importantly in eGFR, and although analysis of covariance addresses this, adjustment is no substitute for randomisation and we did not perform a propensity-score analysis. Proteinuria came from 24-hour collections, which are prone to collection error and are not directly comparable with the albumin-to-creatinine ratio of the trials. Cystatin C was not measured, so eGFR was estimated from creatinine alone. Three time points cannot separate the acute and chronic components of the eGFR slope as cleanly as more frequent sampling would. Inclusion required three scheduled admissions, so patients who did not attend regularly are not represented. Eleven patients had no histological diagnosis and were treated empirically. Follow-up was limited to 24 months because too few patients had reached a longer horizon by the end of the observation period. The subgroup analyses were exploratory and carry no multiplicity adjustment. And our effect sizes exceed those of the randomised trials, for which residual confounding is the more economical explanation than greater efficacy. The date on which immunosuppression began was not recorded, so the baseline visit may have fallen at different points in the treatment course in the two cohorts; sensitivity analyses restricted to comparable baseline proteinuria left the estimate unchanged (Section 4.3), but a difference in timing cannot be excluded and would inflate the apparent effect in the subgroup.
The strengths are the two-year horizon, the completeness of the data – proteinuria and eGFR were available for every patient at every visit, so nothing was imputed – the histological characterisation of most participants, all read by a single pathologist, and a single laboratory using one creatinine assay across both periods. Tolerability was good: among all 301 patients treated, persistence over two years was 97.3%, and the only withdrawals for an adverse event were three cases of recurrent urinary tract infection (Section 3.4).
5. Conclusions
In a two-year real-world cohort of patients with predominantly biopsy-proven glomerular disease, dapagliflozin was associated with a progressive fall in proteinuria and with stabilisation of kidney function, the benefit accruing through the second year rather than being spent on an initial response. It appeared concentrated among patients whose disease required intensified immunosuppression at entry – a group excluded from the trials and from the comparable observational literature – and was not explained by the accompanying fall in blood pressure. Given the observational design and the historical control group, these magnitudes are best read as an upper bound; the direction and the timing, however, sit comfortably with the randomised evidence [2,3,25] and with the observational experience in glomerular diseases [27], and support the use of dapagliflozin alongside intensified immunosuppression in this population.
Author Contributions
Conceptualization, I.G., I.T. and M.R.; methodology, V.V. and V.A.; formal analysis, V.V. and M.R.; investigation, V.A., T.I., B.V., M.P., S.K.-H., S.K. and M.M.; data curation, V.A., T.I., B.V., M.P., S.K.-H., S.K. and M.M.; writing – original draft preparation, V.A., T.I., B.V., M.P. and V.V.; writing – review and editing, V.V.; visualization, V.V. and M.R.; supervision, V.V. All authors have read and agreed to the published version of the manuscript.
Funding
This research received no external funding.
Institutional Review Board Statement
The study was conducted in accordance with the Declaration of Helsinki and approved by the Ethics Committee of University Hospital "Tsaritsa Yoanna – ISUL", Sofia (protocol code 002, date of approval 09.09.2026).
Informed Consent Statement
All patients had given written consent on admission for the use of their clinical data for scientific purposes. The requirement for separate study-specific consent was waived by the Ethics Committee, the study being based entirely on existing medical records. All data were anonymised before analysis.
Data Availability Statement
The anonymised data supporting the findings of this study are available from the corresponding author upon reasonable request. The data are not publicly available because of restrictions relating to patient privacy.
Conflicts of Interest
The authors declare no conflicts of interest.
References
- GBD 2023 Chronic Kidney Disease Collaborators. Global, regional, and national burden of chronic kidney disease in adults, 1990-2023, and its attributable risk factors: a systematic analysis for the Global Burden of Disease Study 2023. Lancet. 2025 Nov 22;406(10518):2461-2482. Epub 2025 Nov 7. [CrossRef] [PubMed]
- Heerspink, H.J.L.; Stefánsson, B.V.; Correa-Rotter, R.; Chertow, G.M.; Greene, T.; Hou, F.-F.; Mann, J.F.E.; McMurray, J.J.V.; Lindberg, M.; Rossing, P.; et al. Dapagliflozin in patients with chronic kidney disease. N. Engl. J. Med. 2020, 383, 1436–1446. [CrossRef]
- The EMPA-KIDNEY Collaborative Group. Empagliflozin in patients with chronic kidney disease. N. Engl. J. Med. 2023, 388, 117–127. [CrossRef]
- Nuffield Department of Population Health Renal Studies Group; SGLT2 Inhibitor Meta-Analysis Cardio-Renal Trialists’ Consortium. Impact of diabetes on the effects of sodium glucose co-transporter-2 inhibitors on kidney outcomes: collaborative meta-analysis of large placebo-controlled trials. Lancet 2022, 400, 1788–1801. [CrossRef]
- Kidney Disease: Improving Global Outcomes (KDIGO) CKD Work Group. KDIGO 2024 Clinical Practice Guideline for the Evaluation and Management of Chronic Kidney Disease. Kidney Int. 2024, 105 (4S), S117–S314. [CrossRef]
- Vallon, V.; Thomson, S.C. Targeting renal glucose reabsorption to treat hyperglycaemia: the pleiotropic effects of SGLT2 inhibition. Diabetologia 2017, 60, 215–225. [CrossRef]
- Yau, K.; Dharia, A.; Alrowiyti, I.; Cherney, D.Z.I. SGLT2 inhibitors and kidney protection: mechanisms beyond tubuloglomerular feedback. Kidney360 2024, 5, 758–768. [CrossRef]
- Heerspink HJL, Jongs N, Chertow GM, Langkilde AM, McMurray JJV, Correa-Rotter R, Rossing P, Sjöström CD, Stefansson BV, Toto RD, et al.; DAPA-CKD Trial Committees and Investigators. Effect of dapagliflozin on the rate of decline in kidney function in patients with chronic kidney disease with and without type 2 diabetes: a prespecified analysis from the DAPA-CKD trial. Lancet Diabetes Endocrinol. 2021 Nov;9(11):743-754. Epub 2021 Oct 4. Erratum in: Lancet Diabetes Endocrinol. 2022 Oct;10(10):e10. doi: 10.1016/S2213-8587(22)00223-6. [CrossRef] [PubMed]
- Jongs, N.; Greene, T.; Chertow, G.M.; McMurray, J.J.V.; Langkilde, A.M.; Correa-Rotter, R.; Rossing, P.; Sjöström, C.D.; Stefansson, B.V.; Toto, R.D.; et al. Effect of dapagliflozin on urinary albumin excretion in patients with chronic kidney disease with and without type 2 diabetes: a prespecified analysis from the DAPA-CKD trial. Lancet Diabetes Endocrinol. 2021, 9, 755–766. [CrossRef]
- Wheeler, D.C.; Toto, R.D.; Stefánsson, B.V.; Jongs, N.; Chertow, G.M.; Greene, T.; Hou, F.-F.; McMurray, J.J.V.; Correa-Rotter, R.; Rossing, P.; et al. A pre-specified analysis of the DAPA-CKD trial demonstrates the effects of dapagliflozin on major adverse kidney events in patients with IgA nephropathy. Kidney Int. 2021, 100, 215–224. [CrossRef]
- Kidney Disease: Improving Global Outcomes (KDIGO) Glomerular Diseases Work Group. KDIGO 2021 Clinical Practice Guideline for the Management of Glomerular Diseases. Kidney Int. 2021, 100 (4S), S1–S276. [CrossRef]
- Kidney Disease: Improving Global Outcomes (KDIGO) IgAN and IgAV Work Group. KDIGO 2025 Clinical Practice Guideline for the Management of Immunoglobulin A Nephropathy (IgAN) and Immunoglobulin A Vasculitis (IgAV). Kidney Int. 2025, 108 (4S), S1–S71. [CrossRef]
- Kidney Disease: Improving Global Outcomes (KDIGO) Lupus Nephritis Work Group. KDIGO 2024 Clinical Practice Guideline for the Management of Lupus Nephritis. Kidney Int. 2024, 105 (1S), S1–S69. [CrossRef]
- Cherney, D.Z.I.; Dekkers, C.C.J.; Barbour, S.J.; Cattran, D.; Abdul Gafor, A.H.; Greasley, P.J.; Laverman, G.D.; Lim, S.K.; Di Tanna, G.L.; Reich, H.N.; et al. Effects of the SGLT2 inhibitor dapagliflozin on proteinuria in non-diabetic patients with chronic kidney disease (DIAMOND): a randomised, double-blind, crossover trial. Lancet Diabetes Endocrinol. 2020, 8, 582–593. [CrossRef]
- Hammad H, Shaaban A, Philips MV, Fayed A, Abdelaziz TS. Effect of sodium-glucose transporter 2 inhibitor empagliflozin on proteinuria and kidney function progression in patients with non-diabetic glomerulonephritis: a pilot superiority randomized controlled trial. Int Urol Nephrol. 2023 Sep;55(9):2321-2326. Epub 2023 Mar 6. [CrossRef] [PubMed] [PubMed Central]
- Vargas-Brochero, M.J.; Russo, I.; Mazzierli, T.; Cara, A.; Berti, G.M.; Milheiro, J.; Thongprayoon, C.; Allinovi, M.; Somma, C.; Raglianti, V.; et al. Antiproteinuric effect of SGLT2 inhibitors in non-diabetic glomerulopathies is dependent on body mass index. Nephrol. Dial. Transplant. 2026, 41, 703–714. [CrossRef]
- Patoulias, D.; Popovic, D.S. Are SGLT-2 inhibitors “the elephant in the room” of non-diabetic glomerulonephritis? Considerations about the background immunosuppressive treatment. Int. Urol. Nephrol. 2023, 55, 3281–3282. [CrossRef]
- Del Vecchio, L.; Peiti, S.; Pucci Bella, G.; Locatelli, F. SGLT2 inhibitors in glomerulonephritis: beyond nephroprotection? J. Clin. Med. 2025, 14, 3533. [CrossRef]
- Ferro CJ, Wanner C, Luyckx V, Fontana M, Gallego D, Vanholder R, Torra R, Ortiz A; Stronger Kidneys Taskforce of the European Renal Association, the European Kidney Health Alliance and the European Kidney Patients Federation. A call for urgent action on chronic kidney disease across Europe. Lancet Reg Health Eur. 2025 Jun 11;54:101347. [CrossRef] [PubMed] [PubMed Central]
- Mitić, I.; Laganović, M.; Marinova, I.; Gancheva, N.; Nakić, V.; Melentijevic, D.; Paskalev, E.; Vajd, R.; Škoberne, A. Chronic kidney disease in Balkan countries — a call to action for timely diagnosis and monitoring. Diagnostics 2022, 12, 2162. [CrossRef]
- Kidney Disease: Improving Global Outcomes (KDIGO) Blood Pressure Work Group. KDIGO 2021 Clinical Practice Guideline for the Management of Blood Pressure in Chronic Kidney Disease. Kidney Int. 2021, 99 (3S), S1–S87. [CrossRef]
- Inker, L.A.; Eneanya, N.D.; Coresh, J.; Tighiouart, H.; Wang, D.; Sang, Y.; Crews, D.C.; Doria, A.; Estrella, M.M.; Froissart, M.; et al. New creatinine- and cystatin C-based equations to estimate GFR without race. N. Engl. J. Med. 2021, 385, 1737–1749. [CrossRef]
- Kidney Disease: Improving Global Outcomes (KDIGO) Glomerulonephritis Work Group. KDIGO Clinical Practice Guideline for Glomerulonephritis. Kidney Int. Suppl. 2012, 2, 139–274. [CrossRef]
- von Elm, E.; Altman, D.G.; Egger, M.; Pocock, S.J.; Gøtzsche, P.C.; Vandenbroucke, J.P.; STROBE Initiative. The Strengthening the Reporting of Observational Studies in Epidemiology (STROBE) statement: guidelines for reporting observational studies. Lancet 2007, 370, 1453–1457. [CrossRef]
- Wheeler, D.C.; Stefánsson, B.V.; Jongs, N.; Chertow, G.M.; Greene, T.; Hou, F.-F.; McMurray, J.J.V.; Correa-Rotter, R.; Rossing, P.; Toto, R.D.; et al. Effects of dapagliflozin on major adverse kidney and cardiovascular events in patients with diabetic and non-diabetic chronic kidney disease: a prespecified analysis from the DAPA-CKD trial. Lancet Diabetes Endocrinol. 2021, 9, 22–31. [CrossRef]
- Trillini M, Villa A, Perna A, Peracchi T, Fidone D, Rubis N, Guarinoni C, Martinetti D, Chiappa A, Gamba T, et al. ADAPT Study Group. Randomized Trial of Dapagliflozin in Patients With Nondiabetic Stage 4 CKD. Kidney Int Rep. 2025 Jul 24;10(10):3340-3355. [CrossRef] [PubMed] [PubMed Central]
- Caravaca-Fontán, F.; Stevens, K.; Padrón, M.; Huerta, A.; Montomoli, M.; Villa, J.; González, F.; Vega, C.; López Mendoza, M.; Fernández, L.; et al. Sodium-glucose cotransporter 2 inhibition in primary and secondary glomerulonephritis. Nephrol. Dial. Transplant. 2024, 39, 328–340. [CrossRef]
- Minutolo, R.; Borrelli, S.; Ambrosini, A.; Amoroso, L.; Aucella, F.; Batini, V.; Battaglia, Y.; Bregoli, L.; Cantaluppi, V.; Cianciolo, G.; et al. Efficacy and safety of dapagliflozin in patients with CKD: real-world experience in 93 Italian renal clinics. Clin. Kidney J. 2025, 18, sfae396. [CrossRef]
- Inker, L.A.; Heerspink, H.J.L.; Tighiouart, H.; Levey, A.S.; Coresh, J.; Gansevoort, R.T.; Simon, A.L.; Ying, J.; Beck, G.J.; Wanner, C.; et al. GFR slope as a surrogate end point for kidney disease progression in clinical trials: a meta-analysis of treatment effects of randomized controlled trials. J. Am. Soc. Nephrol. 2019, 30, 1735–1745. [CrossRef]
- Levey, A.S.; Gansevoort, R.T.; Coresh, J.; Inker, L.A.; Heerspink, H.L.; Grams, M.E.; Greene, T.; Tighiouart, H.; Matsushita, K.; Ballew, S.H.; et al. Change in albuminuria and GFR as end points for clinical trials in early stages of CKD: a scientific workshop sponsored by the National Kidney Foundation in collaboration with the US Food and Drug Administration and European Medicines Agency. Am. J. Kidney Dis. 2020, 75, 84–104. [CrossRef]
- Wheeler DC, Jongs N, Stefansson BV, Chertow GM, Greene T, Hou FF, Langkilde AM, McMurray JJV, Rossing P, Nowicki M, et al.; DAPA-CKD Trial Committees and Investigators. Safety and efficacy of dapagliflozin in patients with focal segmental glomerulosclerosis: a prespecified analysis of the dapagliflozin and prevention of adverse outcomes in chronic kidney disease (DAPA-CKD) trial. Nephrol Dial Transplant. 2022 Aug 22;37(9):1647-1656. [CrossRef] [PubMed] [PubMed Central]
- The EMPA-KIDNEY Collaborative Group. Impact of primary kidney disease on the effects of empagliflozin in patients with chronic kidney disease: secondary analyses of the EMPA-KIDNEY trial. Lancet Diabetes Endocrinol. 2024, 12, 51–60. [CrossRef]
- The EMPA-KIDNEY Collaborative Group. Effects of empagliflozin on progression of chronic kidney disease: a prespecified secondary analysis from the EMPA-KIDNEY trial. Lancet Diabetes Endocrinol. 2024, 12, 39–50. [CrossRef]
- Caravaca-Fontán, F.; Del Vecchio, L.; Praga, M.; Floege, J.; Zoccali, C. Sodium glucose co-transporter 2 inhibitors in the treatment of glomerular diseases: a CKJ controversy. Clin. Kidney J. 2024, 17, sfae237. [CrossRef]
- Dong, Y.; Shi, S.; Liu, L.; Zhou, X.; Lv, J.; Zhang, H. Effect of SGLT2 inhibitors on the proteinuria reduction in patients with IgA nephropathy. Front. Med. (Lausanne) 2023, 10, 1242241. [CrossRef]
- Cassis, P.; Locatelli, M.; Cerullo, D.; Corna, D.; Buelli, S.; Zanchi, C.; Villa, S.; Morigi, M.; Remuzzi, G.; Benigni, A.; et al. SGLT2 inhibitor dapagliflozin limits podocyte damage in proteinuric nondiabetic nephropathy. JCI Insight 2018, 3, e98720. [CrossRef]
Figure 1.
Proteinuria over 24 months in the dapagliflozin and historical cohorts. (a) Proteinuria expressed as the ratio to the individual baseline value (geometric mean with 95% confidence interval), plotted on a logarithmic scale; the dashed line marks the absence of change. (b) Analysis of covariance of log-transformed month-24 proteinuria on log-transformed baseline proteinuria, both in g/24h; individual patients are shown as points and the fitted parallel regression lines as solid lines, the dashed diagonal being the line of identity. (c) Percentage change in proteinuria at month 24 for every patient, sorted in descending order within each cohort; the dashed line marks the −30% response threshold and bars are truncated at +200%. Blue, dapagliflozin cohort (N₁ = 147); red, historical cohort (N₂ = 170). GMR, geometric mean ratio; CI, confidence interval.
Figure 1.
Proteinuria over 24 months in the dapagliflozin and historical cohorts. (a) Proteinuria expressed as the ratio to the individual baseline value (geometric mean with 95% confidence interval), plotted on a logarithmic scale; the dashed line marks the absence of change. (b) Analysis of covariance of log-transformed month-24 proteinuria on log-transformed baseline proteinuria, both in g/24h; individual patients are shown as points and the fitted parallel regression lines as solid lines, the dashed diagonal being the line of identity. (c) Percentage change in proteinuria at month 24 for every patient, sorted in descending order within each cohort; the dashed line marks the −30% response threshold and bars are truncated at +200%. Blue, dapagliflozin cohort (N₁ = 147); red, historical cohort (N₂ = 170). GMR, geometric mean ratio; CI, confidence interval.
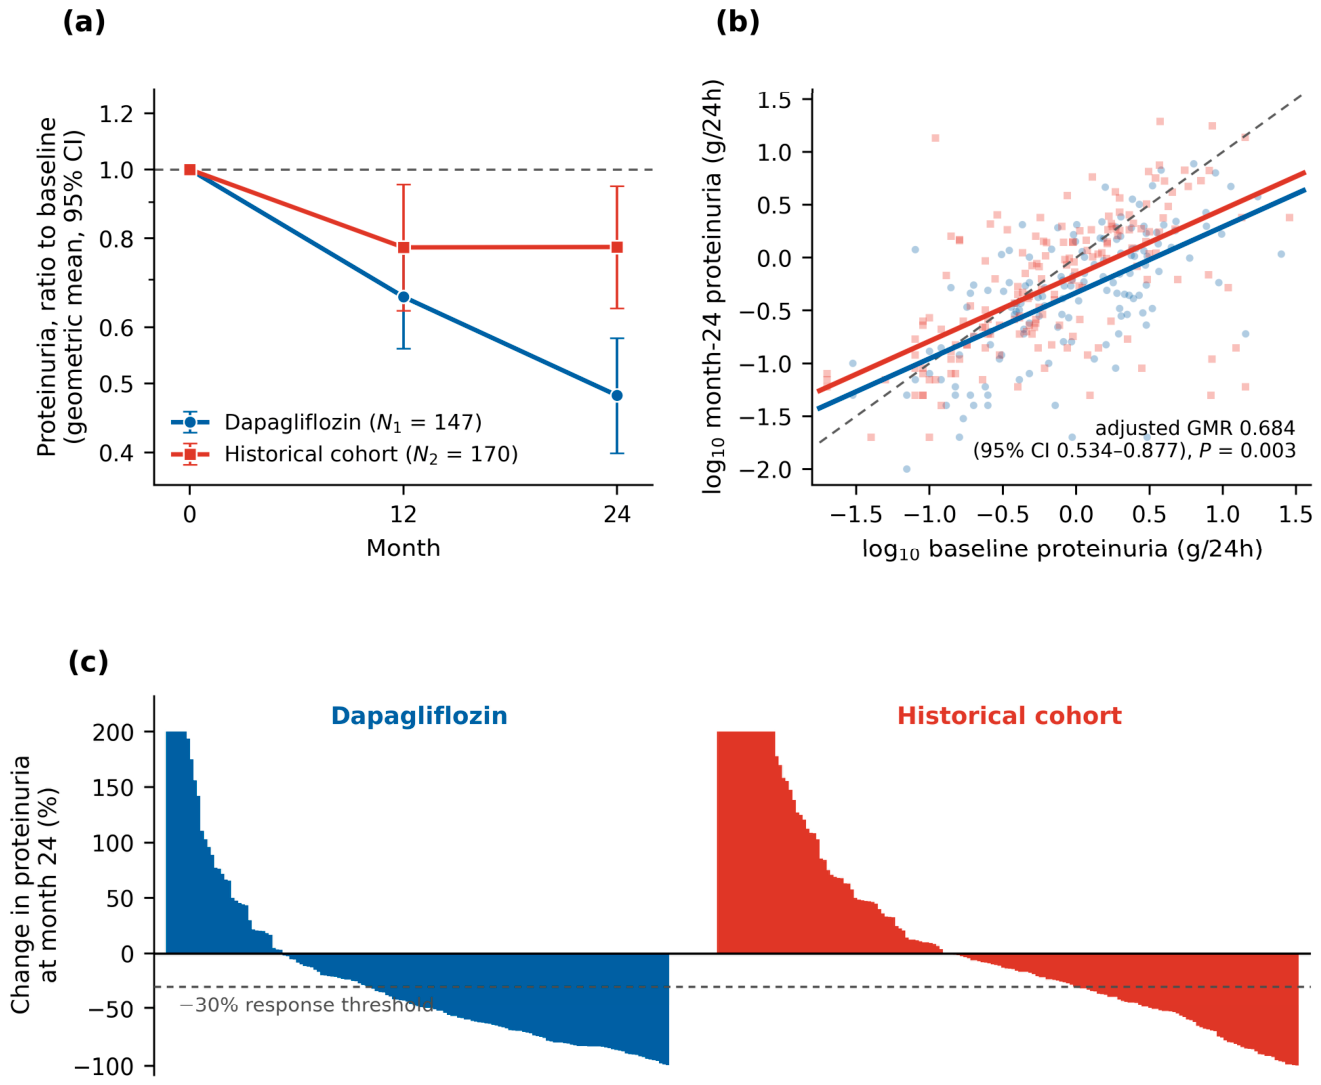
Figure 2.
Proteinuria over 24 months in patients receiving intensified immunosuppressive therapy at baseline. (a) Proteinuria expressed as the ratio to the individual baseline value (geometric mean with 95% confidence interval) on a logarithmic scale; the dashed line marks the absence of change. (b) Analysis of covariance of log-transformed month-24 proteinuria on log-transformed baseline proteinuria, both in g/24h. (c) Percentage change in proteinuria at month 24 for every patient, sorted in descending order within each cohort; the dashed line marks the −30% response threshold and bars are truncated at +200%. Blue, dapagliflozin cohort (n₁ = 41); red, historical cohort (n₂ = 57). GMR, geometric mean ratio; CI, confidence interval.
Figure 2.
Proteinuria over 24 months in patients receiving intensified immunosuppressive therapy at baseline. (a) Proteinuria expressed as the ratio to the individual baseline value (geometric mean with 95% confidence interval) on a logarithmic scale; the dashed line marks the absence of change. (b) Analysis of covariance of log-transformed month-24 proteinuria on log-transformed baseline proteinuria, both in g/24h. (c) Percentage change in proteinuria at month 24 for every patient, sorted in descending order within each cohort; the dashed line marks the −30% response threshold and bars are truncated at +200%. Blue, dapagliflozin cohort (n₁ = 41); red, historical cohort (n₂ = 57). GMR, geometric mean ratio; CI, confidence interval.
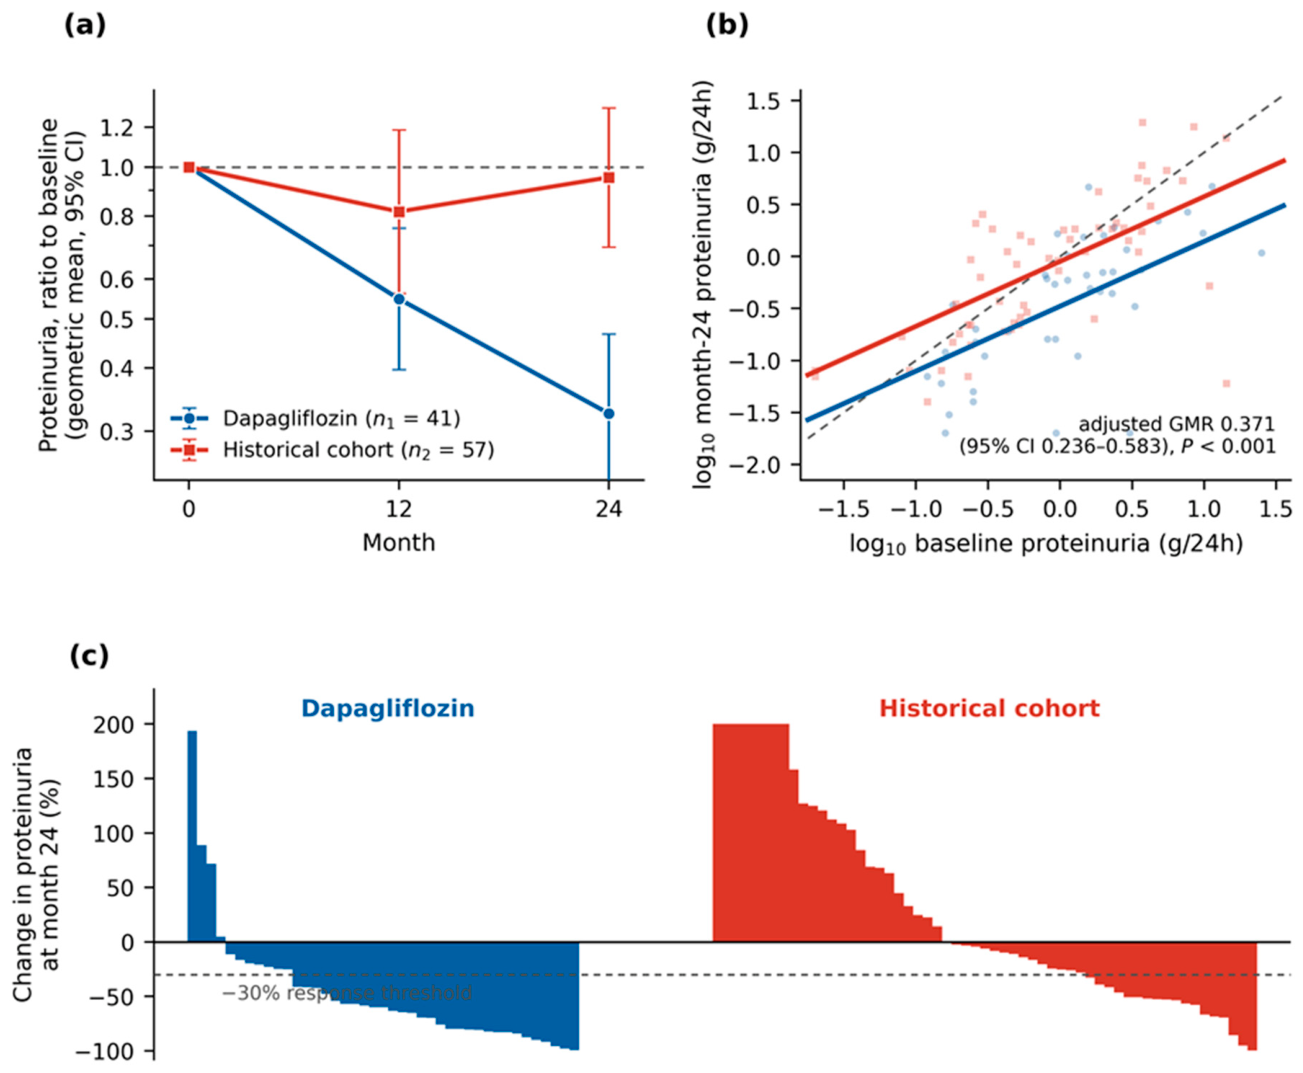
Figure 3.
Estimated glomerular filtration rate over 24 months in the dapagliflozin and historical cohorts. (a) Mean change in eGFR from the individual baseline value, with 95% confidence intervals; the dashed line marks the absence of change. (b) Analysis of covariance of the change in eGFR between months 12 and 24 on baseline eGFR; individual patients are shown as points and the fitted parallel regression lines as solid lines, the dashed horizontal line marking no change. (c) Percentage change in eGFR at month 24 for every patient, sorted in descending order within each cohort; the dashed line marks the −40% decline threshold and bars are truncated at ±100%. Blue, dapagliflozin cohort (N₁ = 147); red, historical cohort (N₂ = 170). CI, confidence interval.
Figure 3.
Estimated glomerular filtration rate over 24 months in the dapagliflozin and historical cohorts. (a) Mean change in eGFR from the individual baseline value, with 95% confidence intervals; the dashed line marks the absence of change. (b) Analysis of covariance of the change in eGFR between months 12 and 24 on baseline eGFR; individual patients are shown as points and the fitted parallel regression lines as solid lines, the dashed horizontal line marking no change. (c) Percentage change in eGFR at month 24 for every patient, sorted in descending order within each cohort; the dashed line marks the −40% decline threshold and bars are truncated at ±100%. Blue, dapagliflozin cohort (N₁ = 147); red, historical cohort (N₂ = 170). CI, confidence interval.
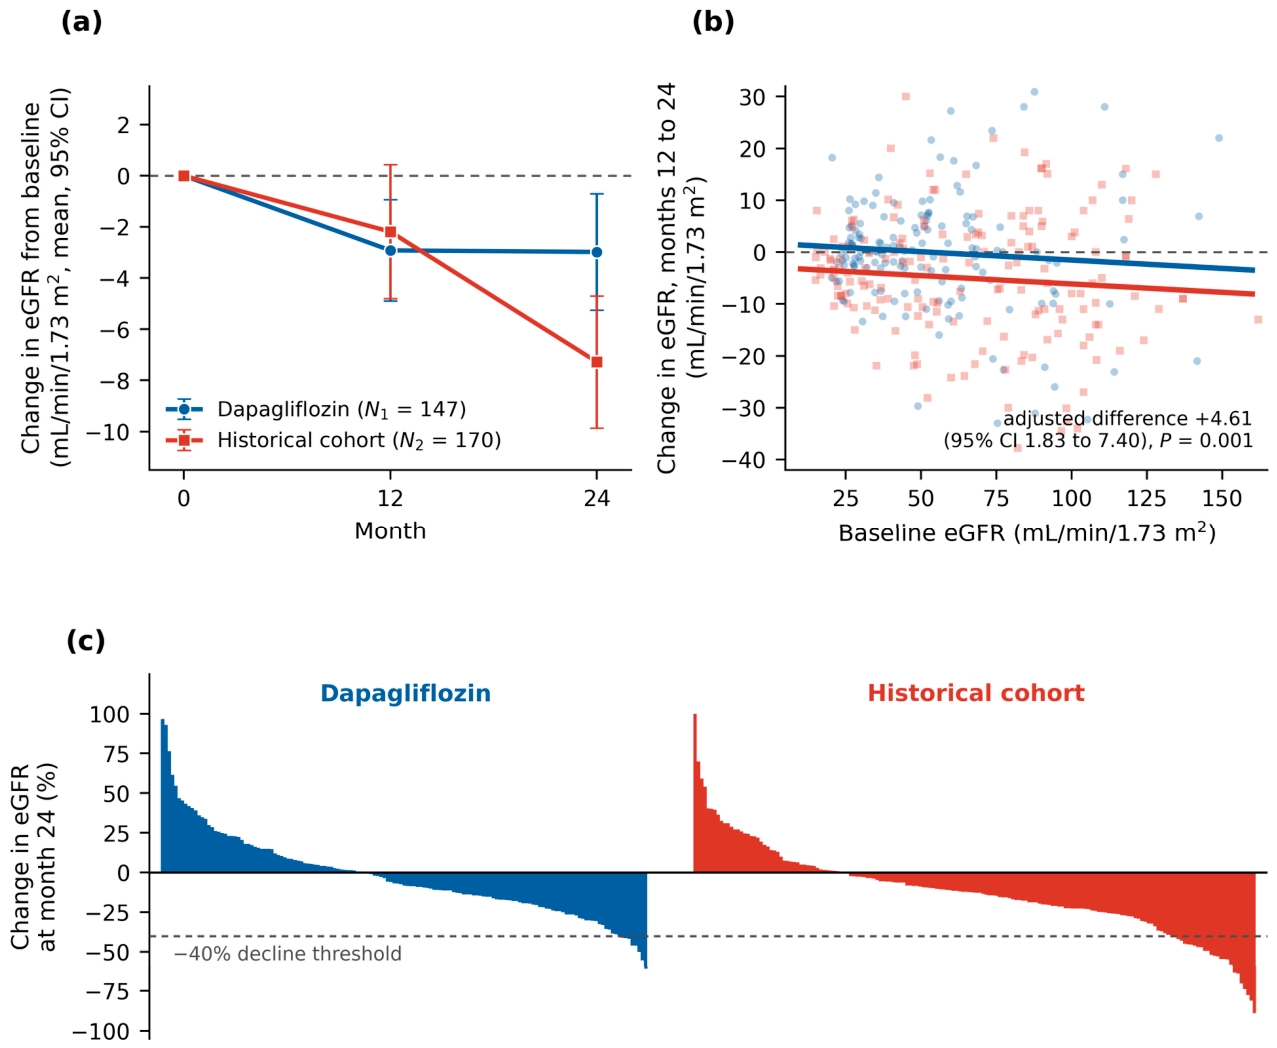

Table 1.
Baseline characteristics of the dapagliflozin cohort and the historical cohort.
| Variable |
Dapagliflozin cohort (N1=147) |
Historical cohort (N2=170) |
p-value |
| Age, years, median (IQR) | 53.0 (43.0-63.0) | 47.0 (38.8-57.3) | 0.0010 |
| Female sex, n (%) | 78 (53.1%) | 88 (51.8%) | 0.8227 |
| Biopsy proven specific immune nephropathy1, n (%) | 114 (77.5%) | 135 (79.4%) | 0.7839 |
| IgAN MN FSGS MCD CIN LN MGN MPGN |
27 (18.4%) 14 (9.5%) 25 (17.0%) 4 (2.7%) 16 (10.9%) 11 (7.5%) 13 (8.8%) 4 (2.7%) |
18 (10.6%) 17 (10.0%) 20 (11.8%) 9 (5.3%) 13 (7.6%) 23 (13.5%) 26 (15.3%) 9 (5.3%) |
0.0537 1.0000 0.1993 0.2737 0.3355 0.1016 0.0887 0.2737 |
| Diabetes mellitus2, n (%) | 40 (27.2%) | 30 (17.6%) | 0.0429 |
| Biopsy proven diabetic nephropathy3, n (%) | 12 (8.2%) | 4 (2.4%) | 0.0213 |
| Hypertension, n (%) | 134 (91.2%) | 137 (80.6%) | 0.0100 |
| Biopsy proven hypertensive nephropathy4, n (%) | 38 (25.9%) | 10 (5.9%) | <0.0001 |
| Intensified immunosuppression within the past 3 months, n (%) | 41 (27.9%) | 57 (33.5%) | 0.3297 |
| ACEi or ARB use5, n (%) | 97 (65.9%) | 119 (70.0%) | 0.4698 |
| Loop diuretic use, n (%) | 46 (31.3%) | 46 (27.1%) | 0.4570 |
| Thiazide diuretic use, n (%) | 9 (6.1%) | 14 (8.2%) | 0.5208 |
| MRA use6, n (%) | 25 (17.0%) | 32 (18.8%) | 0.7696 |
| Systolic blood pressure, mmHg, median (IQR) | 130 (120-145) | 130 (120-140) | 0.6492 |
| Diastolic blood pressure, mmHg, median (IQR) | 80 (70-90) | 80 (80-90) | 0.2474 |
| Mean arterial pressure, mmHg, median (IQR) | 98.3 (90.0-106.7) | 96.7 (93.3-106.7) | 0.8752 |
| Haemoglobin, g/L, median (IQR) | 137 (123-147) | 135 (123-151) | 0.9339 |
| Haematocrit, L/L, median (IQR) | 0.44 (0.39-0.48) | 0.41 (0.38-0.46) | 0.0015 |
| Serum creatinine7, µmol/L, median (IQR) | 125.0 (86.0-165.0) | 95.5 (66.0-152.3) | 0.0041 |
| eGFR, mL/min/1.73 m2, median (IQR) | 50.0 (31.1-67.3) | 67.0 (37.9-92.0) | 0.0010 |
| G1 (≥90 mL/min/1.73 m2), n (%) G2 (60-89 mL/min/1.73 m2), n (%) G3a (45-59 mL/min/1.73 m2), n (%) G3b (30-44 mL/min/1.73 m2), n (%) G4 (15-29 mL/min/1.73 m2), n (%) G5 (<15 mL/min/1.73 m2), n (%) |
18 (12.2%) 30 (20.4%) 31 (21.1%) 35 (23.9%) 33 (22.4%) 0 (0.0%) |
49 (28.8%) 43 (25.3%) 24 (14.1%) 23 (13.5%) 31 (18.3%) 0 (0.0%) |
0.0003 0.3496 0.1365 0.0201 0.4005 - |
| Urea, mmol/L, median (IQR) | 7.6 (5.9-11.0) | 7.7 (5.2-10.8) | 0.8270 |
| Uric acid, µmol/L, median (IQR) | 345 (303-418) | 369 (303-422) | 0.4779 |
| Serum sodium, mmol/L, median (IQR) | 141.0 (140.0-143.0) | 141.0 (139.0-142.0) | 0.1764 |
| Serum potassium, mmol/L, median (IQR) | 4.6 (4.3-4.9) | 4.7 (4.4-5.0) | 0.0497 |
| Serum chloride, mmol/L, median (IQR) | 107.0 (105.0-108.0) | 104.0 (102.0-106.0) | <0.0001 |
| Fasting blood glucose, mmol/L, median (IQR) | 5.41 (5.06-6.02) | 5.16 (4.80-5.72) | 0.0028 |
| Serum total protein, g/L, median (IQR) | 70.0 (65.0-75.0) | 70.0 (65.0-76.0) | 0.8875 |
| Serum albumin, g/L, median (IQR) | 41.0 (39.0-44.0) | 42.0 (38.0-44.0) | 0.4638 |
| Serum total cholesterol, mmol/L, median (IQR) | 5.49 (4.67-6.36) | 5.90 (5.13-7.13) | 0.0008 |
| Serum triglycerides, mmol/L, median (IQR) | 1.60 (1.10-2.51) | 1.41 (0.98-2.19) | 0.1593 |
| Proteinuria, g/24h, median (IQR) | 0.95 (0.38-2.41) | 0.62 (0.24-1.94) | 0.0784 |
| <0.15 g/24h, n (%) 0.15-0.49 g/24h, n (%) 0.50-3.49 g/24h, n (%) ≥3.50 g/24h, n (%) |
12 (8.2%) 40 (27.2%) 76 (51.7%) 19 (12.9%) |
27 (15.9%) 41 (24.1%) 78 (45.9%) 24 (14.1%) |
0.0405 0.6057 0.3126 0.8696 |
IgAN, immunoglobulin A nephropathy; MN, membranous nephropathy; FSGS, focal segmental glomerulosclerosis; MCD, minimal change disease; CIN, chronic interstitial nephritis; LN, lupus nephritis; MGN, mesangioproliferative glomerulonephritis; MPGN, membranoproliferative glomerulonephritis; IQR, interquartile range; eGFR, estimated glomerular filtration rate (CKD-EPI 2021 equation); ACEi, angiotensin-converting enzyme inhibitor; ARB, angiotensin II type 1 receptor blocker; MRA, mineralocorticoid receptor antagonist. 1. Histologically confirmed diffuse renal disease other than diabetic or hypertensive nephropathy. At baseline, these conditions did not necessarily require specific intensified immunosuppression. 2. Diagnosed according to laboratory criteria. 3. Histologically confirmed diabetic nephropathy, either coexisting with the specific (immune) nephropathy or as the principal cause CKD. 4. Histologically confirmed hypertensive nephropathy, either coexisting with the specific (immune) nephropathy or as the principal cause of CKD. 5. ACEi or ARB were administered as standard of care at the highest dose tolerated according to the patient’s clinical status (blood pressure, serum potassium, stage of CKD). 6. Steroidal (spironolactone or eplerenone) or non-steroidal (finerenone). Finerenone was received by one patient in the dapagliflozin cohort and by no patient in the historical cohort. 7. Serum creatinine was measured by a standardised, IDMS-traceable compensated Jaffe (alkaline picrate) method on an Abbott Architect c8000 analyser, and eGFR was calculated with the race-free 2021 CKD-EPI creatinine equation.
Table 2.
Twenty-four-hour proteinuria over the 24-month observation period.
|
Proteinuria, g/24h, median (IQR) |
GMR vs. baseline (95% CI) |
Adjusted p-value | |
| Dapagliflozin cohort (N1=147) | |||
| Baseline (Month 0) | 0.95 (0.38-2.41) | - | - |
| Month 12 | 0.57 (0.23-1.95) | 0.662 (0.560-0.781) | <0.001 |
| Month 24 | 0.49 (0.19-1.19) | 0.481 (0.399-0.579) | <0.001 |
| Month 12 → Month 24 | - | 0.726 (0.629-0.839) | <0.001 |
| Historical cohort (N2=170) | |||
| Baseline (Month 0) | 0.62 (0.24-1.94) | - | - |
| Month 12 | 0.56 (0.19-1.56) | 0.777 (0.633-0.953) | 0.013 |
| Month 24 | 0.57 (0.18-1.74) | 0.778 (0.638-0.948) | 0.063 |
| Month 12 → Month 24 | - | 1.002 (0.835-1.202) | >0.99 |
GMR, geometric mean ratio; CI, confidence interval; IQR, interquartile range. GMR values were derived from paired differences of log-transformed proteinuria. p-values are from the Wilcoxon signed-rank test on log-transformed values, Bonferroni-adjusted for three within-cohort comparisons. The final row of each block reports the change between months 12 and 24.
Table 3.
Proteinuria response at 24 months.
| Outcome at month 24 |
Dapagliflozin cohort (N1=147), n (%) |
Historical cohort (N2=170), n (%) |
OR (95% CI) |
| ≥30% reduction | 87 (59.2%) | 65 (38.2%) | 2.34 (1.49-3.68) |
| ≥50% reduction | 71 (48.3%) | 44 (25.9%) | 2.68 (1.67-4.29) |
| Partial remission | 69 (46.9%) | 44 (25.9%) | 2.53 (1.58-4.06) |
| Complete remission (<0.3 g/24h) | 49 (33.3%) | 69 (40.6%) | 0.73 (0.46-1.16) |
| Progression (≥30% increase) | 25 (17.0%) | 52 (30.6%) | 0.47 (0.27-0.80) |
OR, odds ratio; CI, confidence interval. Partial remission was defined as proteinuria <3.5 g/24h combined with a reduction of at least 50% from baseline. Odds ratios are unadjusted; p-values were obtained with Fisher’s exact test.
Table 4.
Proteinuria in patients receiving intensified immunosuppression at baseline.
|
Proteinuria, g/24h, median (IQR) |
GMR vs. baseline (95% CI) |
Adjusted p-value | |
| Dapagliflozin cohort (n1=41) | |||
| Baseline (Month 0) | 1.14 (0.28-2.35) | - | - |
| Month 12 | 0.57 (0.20-2.04) | 0.548 (0.397-0.757) | 0.002 |
| Month 24 | 0.49 (0.11-1.12) | 0.325 (0.226-0.467) | <0.001 |
| Month 12 → Month 24 | - | 0.592 (0.446-0.785) | 0.002 |
| Historical cohort (n2=57) | |||
| Baseline (Month 0) | 0.59 (0.25-2.88) | - | - |
| Month 12 | 0.71 (0.20-2.15) | 0.816 (0.562-1.185) | 0.48 |
| Month 24 | 0.93 (0.22-1.87) | 0.954 (0.694-1.310) | >0.99 |
| Month 12 → Month 24 | - | 1.168 (0.825-1.654) | >0.99 |
GMR, geometric mean ratio; CI, confidence interval; IQR, interquartile range. GMR values were derived from paired differences of log-transformed proteinuria. p-values are from the Wilcoxon signed-rank test on log-transformed values, Bonferroni-adjusted for three within-cohort comparisons. The final row of each block reports the change between months 12 and 24.
Table 5.
Proteinuria response at 24 months in patients receiving intensified immunosuppression at baseline.
Table 5.
Proteinuria response at 24 months in patients receiving intensified immunosuppression at baseline.
| Outcome at month 24 |
Dapagliflozin cohort (n1=41), n (%) |
Historical cohort (n2=57), n (%) |
OR (95% CI) |
| ≥30% reduction | 30 (73.2%) | 18 (31.6%) | 5.91 (2.43-14.37) |
| ≥50% reduction | 26 (63.4%) | 14 (24.6%) | 5.32 (2.22-12.79) |
| Partial remission | 25 (61.0%) | 14 (24.6%) | 4.80 (2.01-11.46) |
| Complete remission (<0.3 g/24h) | 16 (39.0%) | 20 (35.1%) | 1.18 (0.52-2.72) |
| Progression (≥30% increase) | 3 (7.3%) | 21 (36.8%) | 0.14 (0.04-0.49) |
OR, odds ratio; CI, confidence interval. Partial remission was defined as proteinuria <3.5 g/24h combined with a reduction of at least 50% from baseline. Odds ratios are unadjusted; p-values were obtained with Fisher’s exact test.
Table 6.
Histological diagnosis in patients receiving intensified immunosuppression at baseline, and 24-month change in proteinuria by diagnostic category.
Table 6.
Histological diagnosis in patients receiving intensified immunosuppression at baseline, and 24-month change in proteinuria by diagnostic category.
|
Diagnostic category |
Dapagliflozin cohort (n1=41), n (%) |
Historical cohort (n2=57), n (%) |
GMR at month 24, Dapagliflozin | GMR at month 24, Historical | p-value |
| Proliferative/immune-complex1 | 18 (43.9%) | 31 (54.4%) | 0.411 | 1.047 | 0.002 |
| Podocytopathy2 | 15 (36.6%) | 13 (22.8%) | 0.214 | 0.701 | 0.010 |
| Other3 | 6 (14.6%) | 4 (7.0%) | 0.406 | 0.751 | 0.76 |
| No biopsy performed4 | 2 (4.9%) | 9 (15.8%) | - | - | - |
GMR, geometric mean ratio, expressed relative to the individual baseline value; p-values are from the Mann-Whitney U test on log-transformed changes. Where more than one histological diagnosis was recorded, patients were assigned to the category of the leading immune nephropathy. 1. IgA nephropathy, lupus nephritis, membranoproliferative glomerulonephritis, mesangioproliferative glomerulonephritis. 2. Minimal change disease, focal segmental glomerulosclerosis, membranous nephropathy. 3. Chronic interstitial nephritis, hypertensive nephropathy. 4. Patients treated empirically without histological confirmation; excluded from the analyses by diagnostic category.
Table 7.
Estimated glomerular filtration rate over the 24-month observation period.
| eGFR, mL/min/1.73 m², median (IQR) |
Change from previous value, mean (95% CI) |
Change from previous value, median (IQR) |
Adjusted p-value | |
| Dapagliflozin cohort (N1=147) | ||||
| Baseline (Month 0) | 50.0 (31.1-67.3) | - | - | - |
| Month 12 | 46.3 (31.1-64.0) | −2.92 (−4.90 to −0.94) | −3.10 (−8.60 to +2.80) | 0.004 |
| Month 24 | 44.0 (32.4-66.1) | −0.06 (−1.96 to +1.85) | 0.00 (−5.70 to +5.50) | >0.99 |
| Month 0 → Month 24 | - | −2.98 (−5.25 to −0.70) | −2.90 (−11.40 to +4.20) | 0.011 |
| Historical cohort (N2=170) | ||||
| Baseline (Month 0) | 67.0 (37.9-92.0) | - | - | - |
| Month 12 | 62.2 (35.1-93.4) | −2.19 (−4.81 to +0.43) | −2.00 (−12.05 to +7.25) | 0.36 |
| Month 24 | 60.0 (28.8-85.3) | −5.09 (−7.05 to −3.14) | −4.70 (−11.35 to +3.25) | <0.001 |
| Month 0 → Month 24 | - | −7.28 (−9.86 to −4.70) | −7.55 (−17.00 to +1.00) | <0.001 |
IQR, interquartile range; CI, confidence interval. Changes are given both as means with 95% confidence intervals and as medians with interquartile ranges. The mean is reported because the rate of change in eGFR is an additive quantity and is the form in which slopes are conventionally expressed, and because the covariance models below estimate adjusted means; the median is given alongside it because the distribution of individual changes departed from normality (Shapiro-Wilk test p=0.002 and p<0.001 for the dapagliflozin and historical cohorts, respectively). The two summaries agree closely at every interval. p-values are from the Wilcoxon signed-rank test, Bonferroni-adjusted for three within-cohort comparisons. Friedman test across the three visits: χ² = 13.5, p=0.001 for the dapagliflozin cohort and χ² = 41.0, p<0.001 for the historical cohort. The final row of each block reports the cumulative change from baseline to month 24.
Table 8.
Kidney outcomes at 24 months.
| Outcome at month 24 |
Dapagliflozin cohort (N1=147), n (%) |
Historical cohort (N2=170), n (%) |
OR (95% CI) |
| ≥40% decline in eGFR | 8 (5.4%) | 24 (14.1%) | 0.35 (0.15-0.81) |
| ≥30% decline in eGFR | 19 (12.9%) | 35 (20.6%) | 0.57 (0.31-1.05) |
| eGFR <15 mL/min/1.73 m² | 1 (0.7%) | 20 (11.8%) | 0.05 (0.01-0.39) |
| Rapid decline (>5 mL/min/1.73 m² per year) |
40 (27.2%) | 72 (42.4%) | 0.51 (0.32-0.81) |
| Decline >10% | 66 (44.9%) | 97 (57.1%) | 0.61 (0.39-0.96) |
| Stable (−10% to +10%) | 44 (29.9%) | 46 (27.1%) | 1.15 (0.71-1.88) |
| Improvement >10% | 37 (25.2%) | 27 (15.9%) | 1.78 (1.02-3.10) |
OR, odds ratio; CI, confidence interval. The first four rows describe progression and are not mutually exclusive. Rapid decline was defined, in accordance with current guidance, as a sustained loss of more than 5 mL/min/1.73 m² per year. The final three rows form an exhaustive and mutually exclusive classification of the 24-month trajectory; a change of up to 10% in either direction was taken as stability, since biological variation in creatinine generation and clearance together with analytical variation in the assay may account for a change of this magnitude. The distribution across these three categories did not quite reach significance (χ² test, p=0.053). Odds ratios are unadjusted; p-values were obtained with Fisher’s exact test.
Table 9.
Estimated glomerular filtration rate (eGFR) in patients receiving intensified immunosuppression at baseline.
Table 9.
Estimated glomerular filtration rate (eGFR) in patients receiving intensified immunosuppression at baseline.
| eGFR, mL/min/1.73 m², median (IQR) |
Change from previous value, mean (95% CI) |
Change from previous value, median |
Adjusted p-value | |
| Dapagliflozin cohort (n1=41) | ||||
| Baseline (Month 0) | 62.0 (37.0-90.6) | - | - | - |
| Month 12 | 54.9 (35.2-82.9) | −4.68 (−8.63 to −0.72) | −3.40 | 0.042 |
| Month 24 | 70.4 (34.0-81.1) | +0.29 (−3.87 to +4.44) | 0.00 | >0.99 |
| Month 0 → Month 24 | - | −4.39 (−9.71 to +0.93) | −6.90 | 0.10 |
| Historical cohort (n2=57) | ||||
| Baseline (Month 0) | 82.1 (44.0-104.0) | - | - | - |
| Month 12 | 70.1 (30.5-108.5) | −3.04 (−8.28 to +2.19) | −2.00 | >0.99 |
| Month 24 | 71.2 (27.5-90.5) | −6.62 (−10.83 to −2.41) | −6.00 | 0.013 |
| Month 0 → Month 24 | - | −9.67 (−15.03 to −4.31) | −10.10 | 0.002 |
IQR, interquartile range; CI, confidence interval. Changes are given from the preceding visit except in the final row of each block, which reports the cumulative change from baseline to month 24. p-values are from the Wilcoxon signed-rank test, Bonferroni-adjusted for three within-cohort comparisons. Medians of the distribution and medians of the individual changes are distinct quantities: the former may shift although the latter is zero, since different patients occupy the middle rank at each visit.
Table 10.
Blood pressure and peripheral oedema over the 24-month observation period.
|
Dapagliflozin cohort (D) (N1=147) |
Historical cohort (H) (N2=170) |
Mean change from baseline, D vs. H (within-cohort p) |
Between-cohort p | |
|
SBP, mmHg, median (IQR) |
||||
| Baseline (Month 0) | 130 (120-145) | 130 (120-140) | - | - |
| Month 12 | 130 (120-140) | 130 (120-140) | −6.31 (p<0.001) vs −1.59 (p>0.99) | 0.024 |
| Month 24 | 130 (120-140) | 130 (120-140) | −6.54 (p=0.002) vs −1.56 (p=0.90) | 0.027 |
|
DBP, mmHg, median (IQR) |
||||
| Baseline (Month 0) | 80 (70-90) | 80 (80-90) | - | - |
| Month 12 | 80 (70-80) | 80 (80-90) | −3.57 (p=0.001) vs −0.59 (p>0.99) | <0.001 |
| Month 24 | 80 (75-80) | 80 (80-90) | −2.07 (p=0.22) vs −0.98 (p>0.99) | 0.17 |
|
MAP, mmHg, median (IQR) |
||||
| Baseline (Month 0) | 98.3 (90.0-106.7) | 96.7 (93.3-106.7) | - | - |
| Month 12 | 95.0 (90.0-100.0) | 96.7 (93.3-103.8) | −4.41 (p<0.001) vs −0.88 (p=0.89) | 0.001 |
| Month 24 | 95.0 (91.7-100.0) | 96.7 (93.3-106.7) | −3.77 (p=0.017) vs −1.18 (p=0.67) | 0.039 |
|
Peripheral oedema, n (%) |
||||
| Baseline (Month 0) | 40 (27.2%) | 49 (28.8%) | - | 0.80 |
| Month 12 | 36 (24.5%) | 45 (26.5%) | - | 0.70 |
| Month 24 | 32 (21.8%) | 38 (22.4%) | - | >0.99 |
SBP, systolic blood pressure; DBP, diastolic blood pressure; MAP, mean arterial pressure. Blood pressure values are medians with interquartile ranges; oedema is given as counts and percentages. Mean changes from baseline are in mmHg, shown for the dapagliflozin and historical cohorts respectively, each with its within-cohort p-value from the Wilcoxon signed-rank test, Bonferroni-adjusted for three comparisons. Friedman test across the three visits in the dapagliflozin cohort: χ² = 16.6 (p < 0.001) for SBP, χ² = 13.2 (p = 0.001) for DBP and χ² = 15.4 (p < 0.001) for MAP; in the historical cohort all p ≥ 0.28. The between-cohort p-value is from analysis of covariance on the value at that visit, adjusted for the corresponding baseline value; for oedema it is from Fisher's exact test comparing the cohorts at that visit.
Disclaimer/Publisher’s Note: The statements, opinions and data contained in all publications are solely those of the individual author(s) and contributor(s) and not of MDPI and/or the editor(s). MDPI and/or the editor(s) disclaim responsibility for any injury to people or property resulting from any ideas, methods, instructions or products referred to in the content. |
© 2026 by the authors. Licensee MDPI, Basel, Switzerland. This article is an open access article distributed under the terms and conditions of the Creative Commons Attribution (CC BY) license (http://creativecommons.org/licenses/by/4.0/).
Copyright: This open access article is published under a Creative Commons CC BY 4.0 license, which permit the free download, distribution, and reuse, provided that the author and preprint are cited in any reuse.