

Submitted:
11 September 2026
Posted:
18 September 2026
You are already at the latest version
Abstract
Public financial support can be rapidly disbursed yet remain unevaluable when fiscal, beneficiary, exposure, and outcome records are not linked. This study audits Mongolia’s livestock-sector support using budget-execution and livestock-loss data for 2010–2024, along with aggregated records for 289 classified White Gold concessional-loan applications as of 20 June 2025. The analysis distinguishes implementation, delivery conversion, concentration, spatial traceability, and the evidentiary requirements for causal effectiveness. Support execution rose from MNT 10.9 billion in 2010 to MNT 316.1 billion in 2024; the mean execution rate was 87.55% and the minimum 45.62%. Livestock mortality was episodic, with 10.2 million losses in 2010 and 9.3 million in 2024, but aggregate fiscal data cannot separate prevention, compensation, or anticipatory financing. Of the classified applications, 145 were approved and 133 disbursed; MNT 411.4 billion was recorded as disbursed, equal to 90.8% of the approved value and 47.2% of the requested value. Disbursement was concentrated in working capital (81.4%), cashmere-related purposes (80.9%), Ulaanbaatar-registered firms (95.0%), and five banks (94.7%; HHI = 0.246). The program is measurable for implementation and concentration, but not for final regional incidence or causal effectiveness. Evaluation-ready policy requires province-level exposure, supplier and beneficiary tracing, and post-finance outcomes.
Keywords:
agricultural policy
; pastoral livestock
; public financial support
; policy evaluability
; dzud
; livestock mortality
; concessional credit
; administrative data
; Mongolia
1. Introduction
Mongolia’s pastoral livestock economy is simultaneously a production system, a rural livelihood base, a source of food and industrial raw materials, and a major channel through which climate shocks are transmitted to household welfare and regional development. Official statistics for 2024 indicate that agriculture accounted for 7.3% of gross domestic product and 22.5% of the labor force [2]. The national herd stood at 57.6 million animals at the end of 2024, but it had contracted by 10.9% from the previous year after approximately 9.3 million animals were recorded as unnatural losses [1,2]. These conditions make public support to livestock both economically important and unusually difficult to evaluate.
The economic rationale for public intervention in agriculture is well established, although the appropriate form of intervention remains contested. Agriculture combines biological production cycles, seasonal cash flow, weather dependence, price volatility, incomplete insurance, and information asymmetry. These characteristics can generate credit rationing, underinvestment in risk-reducing assets, and insufficient protection against systemic shocks [3,4,5,6,7,8,9]. Public expenditure may therefore be justified when it corrects a specific market failure, protects food security, supplies public or collective services, or prevents a temporary liquidity constraint from becoming a permanent loss of productive assets. The existence of a rationale, however, does not demonstrate that a particular subsidy, incentive, or loan program is effective.
International evidence on agricultural support is mixed. Subsidies can facilitate investment, technology adoption, and income stabilization, but they can also preserve low-productivity structures, weaken price signals, or be capitalized into land and other assets [10,11,12]. Credit interventions are similarly conditional. Relaxing liquidity and risk constraints can alter input use and investment decisions, yet access may remain rationed by collateral, wealth, information, and perceived repayment risk [6,7,8,9]. Accordingly, budget authorization, expenditure, loan approval, and loan disbursement are implementation outputs rather than final measures of productivity, resilience, or welfare.
A second distinction concerns the timing and function of risk finance. Ex ante preparedness, contingent liquidity during a shock, post-loss relief, and recovery finance address different mechanisms. Index-based insurance and contingent facilities can manage covariate losses, but their performance depends on triggers, basis risk, delivery speed, administrative capacity, and correspondence between financial protection and actual losses [13,14,15]. A government may spend more during a disaster because losses are expected or already visible. Such expenditure can be necessary and well executed without proving that it prevented mortality.
Mongolia provides a high-value case because livestock losses are concentrated in severe dzud episodes. Dzud is a compound winter disaster in which preceding drought, pasture condition, snow, cold, forage and water access, herd structure, mobility, animal health, and institutional capacity interact [16,17,18,19,20,21,22,23]. Recent panel evidence from a Mongolian pastoral system further shows that rangeland and vegetation dynamics can diverge from household-income recovery, reinforcing the need to distinguish ecological from livelihood outcomes [24]. The 2009/2010 winter generated record losses, while the 2023/2024 episode again caused a major contraction in the national herd [25,26]. Research on Mongolian pastoral systems emphasizes that community organization, mobility, local institutions, preparedness, information, and access to collective resources shape adaptive capacity [16,17,18,19,20,21,22,23]. These findings imply that a national expenditure aggregate cannot represent the full causal pathway from hazard to exposure, vulnerability, financial response, and realized loss.
Public support to agriculture in Mongolia includes product incentives, interest subsidies, concessional loans, value-chain finance, and program-specific budget measures. Earlier assessments questioned the fiscal efficiency and market effects of agricultural subsidies and called for stronger links between public spending, productivity, and measurable results [27,28,29,30,31]. Recent initiatives have placed greater emphasis on sustainable livestock production, processing capacity, and value-chain development [30,32,33]. The White Gold national movement, designed to support processing of livestock-origin raw materials, illustrates this shift toward concessional finance for enterprises operating in cashmere, wool, hides, leather, and related industries [33,34].
The core problem is not simply a shortage of data. It is a mismatch between data levels and policy claims. Budget records are commonly national and annual; livestock losses can be observed nationally and regionally; administrative loan records identify applicants, banks, registration locations, loan types, and purposes; but post-finance production, supplier geography, repayment, employment, exports, and household outcomes are not linked. Combining these records into one estimate of “support effectiveness” would exceed what the evidence can support. Evaluation requires a sequence from policy objective to eligibility, exposure, delivery, immediate output, final outcome, and a credible comparison.
This study therefore examines policy evaluability rather than claiming a treatment effect. Evaluability is defined as the extent to which policy objectives, financial inputs, delivery records, beneficiary and geographic exposure, outputs, and outcomes are specified and linked well enough to support a valid empirical inference. The applied audit has four dimensions: (i) fiscal implementation, measured by budget execution; (ii) delivery conversion, measured through the loan application–approval–disbursement funnel; (iii) allocation structure, measured through shares and concentration indices; and (iv) traceability, assessed by whether registered finance can be connected to production geography, suppliers, losses, and post-finance outcomes.
The study addresses four research questions. First, how did public-support budgets, execution, and livestock losses evolve during 2010–2024? Second, what do the two severe loss episodes reveal about the limits of interpreting contemporaneous fiscal changes as protective effects? Third, how were White Gold applications converted into approvals and disbursements, and how concentrated was delivery across loan types, purposes, banks, and registered locations? Fourth, which additional data fields are required to move from implementation monitoring to outcome and impact evaluation?
The contribution is threefold. Empirically, the paper integrates a 15-year national fiscal-loss series with a recent administrative credit portfolio. Methodologically, it converts known data limitations into an explicit evaluability audit rather than presenting unstable small-sample regressions as impact estimates. Practically, it identifies a minimum data architecture for risk-sensitive and outcome-linked support in climate-exposed livestock systems. The resulting analysis is relevant not only to Mongolia but also to other pastoral and dryland economies where public finance is substantial, shocks are spatially heterogeneous, and administrative systems record transactions more reliably than final outcomes.
2. Materials and Methods
2.1. Study Design and Evaluation Boundary
The study applies a non-experimental, multi-source policy-diagnostic design. It integrates national annual observations, regional cross-sectional indicators, and aggregated administrative loan records. These data are not pooled into one regression because they describe different policy stages and units of analysis. National series describe fiscal authorization, execution, herd change, and realized mortality. Regional statistics describe the geography of livestock exposure and loss. White Gold records describe application filtering, approval, disbursement, and administrative allocation. The design deliberately separates what can be measured from what can be inferred.
The evaluation boundary is implementation and evaluability. No beneficiary-level counterfactual is available; the timing of support can respond to expected or realized loss; the national support series does not vary across provinces within a year; and the credit records do not include post-finance outcomes. Consequently, the paper does not estimate an average treatment effect, a mortality-reduction elasticity, or a causal productivity effect. Severe-loss years are used only as descriptive event categories, not as exogenous climate treatments.
The national analytical period is 2010–2024, providing 15 annual observations. This interval contains the 2010 and 2024 severe loss episodes and the marked fiscal expansion after 2020. The White Gold administrative record is a point-in-time implementation snapshot reported on 20 June 2025. The regional comparison uses 2024 livestock and mortality shares because that is the loss year closest to the credit-program snapshot. This cross-period comparison is descriptive only and is not interpreted as a contemporaneous targeting test or an estimate of program impact.
2.2. Data Sources and Analytical Units
Livestock stocks, unnatural losses, herd growth, agricultural value added, and sector indicators were compiled from the National Statistics Office of Mongolia [1,2]. “Unnatural loss” follows the official statistical classification for livestock deaths outside normal slaughter or sale. It is treated as realized loss and not as a purely meteorological variable. Public-support budgets and execution were compiled from the Ministry of Finance and the Ministry of Food, Agriculture and Light Industry [32,35]. The fiscal series covers the instruments included in the underlying dissertation database and should not be interpreted as a complete Producer Support Estimate for Mongolia.
The White Gold source contained 291 applications requesting MNT 871.5 billion [34]. Two records did not contain sufficiently complete loan-type or purpose classifications for the detailed breakdown, leaving 289 classified applications. The aggregated records identify requested, approved, and disbursed values; application status; loan type; participating bank; borrower registration location; and financing purpose. They do not identify final herder beneficiaries, raw-material sourcing provinces, transaction-level supplier payments, post-loan production, exports, employment, repayment, or enterprise survival.
Regional analysis groups provinces into Khangai, Western, Northern, Central, Eastern, and Gobi regions. Ulaanbaatar is reported separately in the credit analysis because it receives most registered finance but has no comparable pastoral livestock base. Borrower registration location is not assumed to equal the location of production, sourcing, or final benefit. This distinction is central to the traceability audit.
Table 1 summarizes the data sources, units, analytical uses, and inference limits.
2.3. Indicator Construction
The national mortality rate uses the livestock stock available before the loss year as the denominator:
The budget-execution rate separates authorization from realized implementation:
Severe realized-loss episodes are defined descriptively as years in which the mortality rate exceeded 10% or the national herd declined by more than 10%. This transparent analytical rule identifies 2010 and 2024 within the fiscal series; it is not presented as an official dzud threshold. Because the classification is constructed from outcomes, it is used to describe event concentration and recovery, not to interact with support in a causal regression.
The loan funnel is evaluated using four separate rates: approval by count, disbursement by count among approved applications, disbursement by value among approved finance, and disbursement relative to initial requested value. The denominators are not combined because each rate represents a different administrative stage.
Concentration across banks, registered locations, loan types, and purposes is measured by category shares, the top-three and top-five concentration ratios, and the Herfindahl–Hirschman Index (HHI):
where s_j is the proportion of total disbursement allocated to category j. The HHI is interpreted as a descriptive portfolio-concentration measure and not as a competition-law judgment.
Administrative spatial alignment is measured as the difference between each pastoral region’s share of registered disbursement and its share of a reference exposure measure:
For the reported alignment-gap metric, exposure share is represented by the 2024 livestock-stock share. The 2024 mortality share is retained separately as a descriptive loss comparator. A negative gap therefore means that the region’s registered-loan share is below its livestock share. Because processor registration can differ from supplier geography, the gap is an administrative traceability indicator rather than a welfare or equity estimate.
2.4. Analytical Procedure
The analytical procedure has five steps. First, annual budgets, execution, execution rates, mortality rates, and herd growth are summarized to establish fiscal scale, delivery volatility, and loss timing. Second, the severe 2010 and 2024 episodes are examined through mortality, herd contraction, and recorded loss counts. No statistical test is used to label these outcome-defined episodes as exogenous shocks.
Third, the White Gold application funnel is decomposed by count and monetary value. Requested, approved, under-review, returned, and disbursed categories are kept distinct. Fourth, the disbursed portfolio is decomposed by loan type, purpose, bank, and registered location; HHI and top-bank shares summarize channel dependence. Fifth, regional registered-loan shares are compared with livestock and mortality shares to assess whether the administrative record can identify the final geography of value-chain finance.
Inference is based on arithmetic identity checks, denominator transparency, concentration diagnostics, and institutional interpretation. Given the limited number of independent annual observations, the heterogeneity of support instruments, and the absence of region-specific financial exposure, regression-based causal inference is not pursued. The study therefore reports descriptive estimates only at the level supported by the available records.
2.5. Evaluability Criteria
Each policy component is classified across four evaluation levels. Level 1, implementation monitoring, asks whether funds were authorized and delivered. Level 2, access and allocation, asks who received finance and through which channels. Level 3, outcome monitoring, requires linked records for production, procurement, employment, exports, repayment, or livestock recovery. Level 4, impact evaluation, additionally requires a defensible comparison strategy and pre-specified treatment timing. The highest supported level is determined by the weakest missing link, not by the number of available transactions.
2.6. Software, Reproducibility, and Generative AI Use
All reported descriptive calculations, arithmetic consistency checks, summary indicators, and Figure 1, Figure 2, Figure 3 and Figure 4 were reproduced in Python 3.13.5 using pandas 2.2.3, NumPy 2.3.5, and Matplotlib 3.10.8. The aggregated analytical tables, data dictionary, executable code, calculated outputs, rounding-reconciliation file, and high-resolution figure files used for reproducibility are available from the corresponding author upon reasonable request. Any materials shared for reproducibility exclude application-level confidential records, borrower identifiers, and personal data.
OpenAI ChatGPT (GPT-5.6 Sol, accessed 10 September 2026) was used for English-language editing, structural refinement, consistency checking, reference verification, and formatting. It was not used to create or alter the official source data. Responsibility for the final content rests with the author.
3. Results
3.1. Fiscal Expansion and Uneven Budget Execution
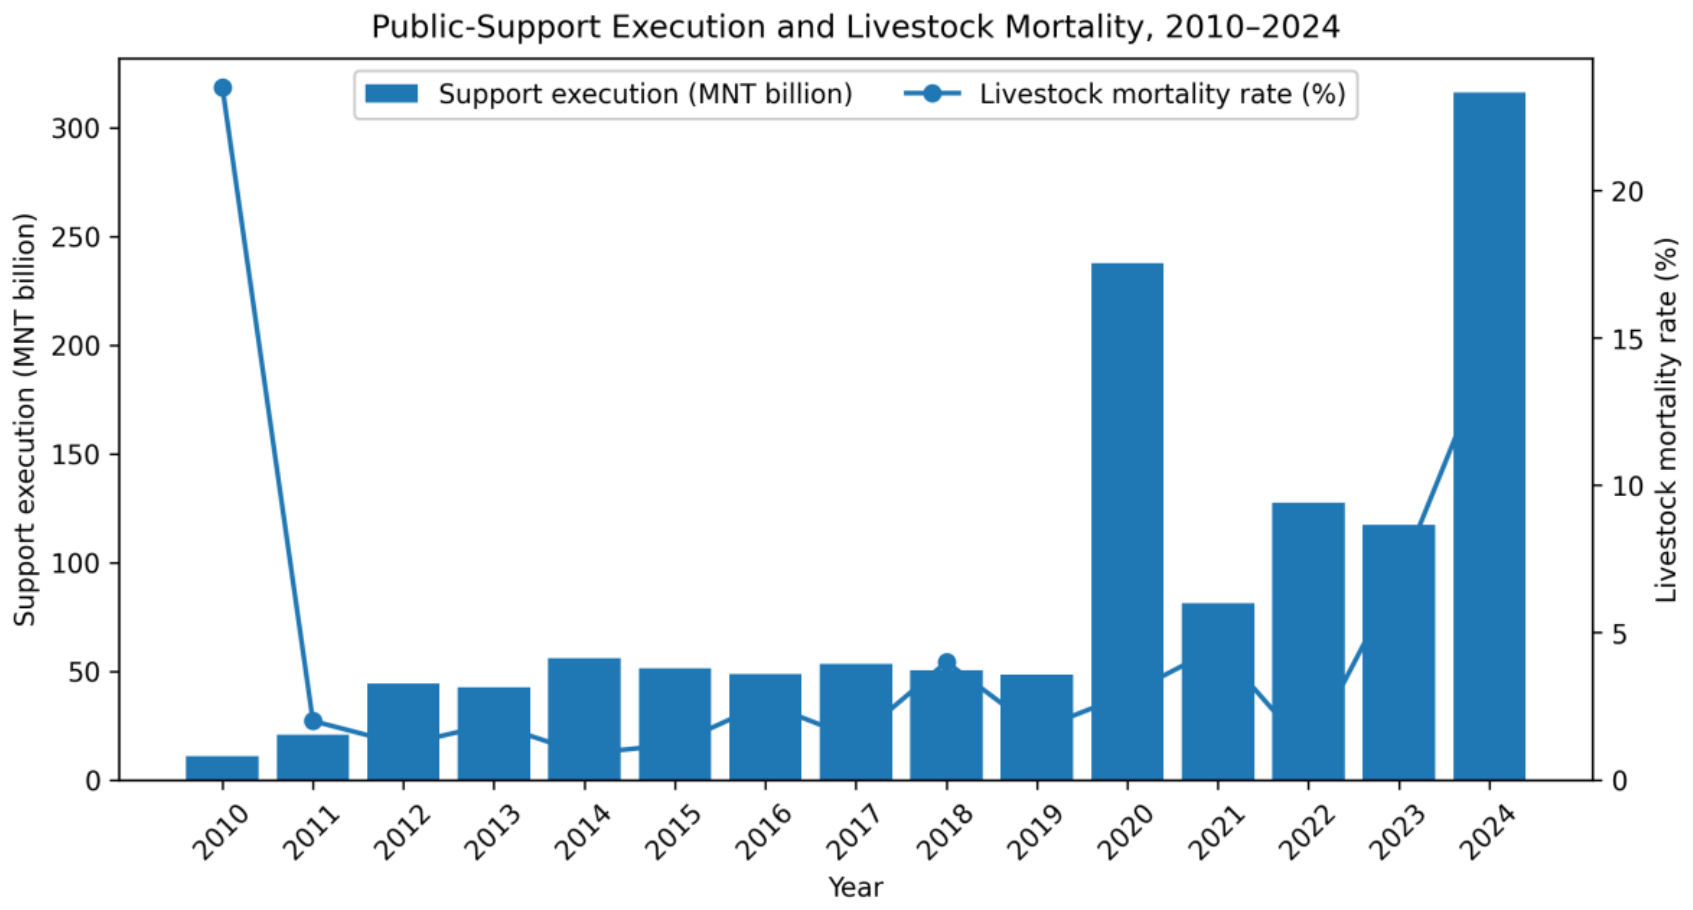
Public-support execution expanded sharply but discontinuously during 2010–2024. Execution rose from MNT 10.9 billion in 2010 to MNT 56.0 billion in 2014, remained near MNT 50 billion through 2019, increased to MNT 237.7 billion in 2020, fell to MNT 81.4 billion in 2021, and reached MNT 316.1 billion in 2024. The final-year amount was 29.0 times the 2010 amount in nominal terms. This scale comparison does not imply equivalent growth in real support, beneficiary coverage, or protective capacity.
Budget execution was also variable. The mean execution rate was 87.55%, but annual values ranged from 45.62% to 99.81%. In 2023, MNT 117.2 billion of a MNT 256.9 billion budget was executed; in 2024, execution reached MNT 316.1 billion, or 95.2% of the approved budget. Authorization and implementation are therefore empirically distinct stages. A budget can signal intent or response capacity, whereas execution records actual fiscal delivery within the reporting period.
The full annual series is reported in Table 2, and the joint timing of support execution and mortality is shown in Figure 1.
Figure 1.
Public-support execution and livestock mortality, 2010–2024. Co-movement in selected years can reflect anticipation, emergency response, compensation, or common exposure; the figure does not identify a causal effect.
Figure 1.
Public-support execution and livestock mortality, 2010–2024. Co-movement in selected years can reflect anticipation, emergency response, compensation, or common exposure; the figure does not identify a causal effect.
3.2. Severe Loss Episodes
Livestock mortality was episodic rather than smoothly distributed. The unweighted mean annual mortality rate was 4.68%, but it reached 23.51% in 2010 and 14.48% in 2024. Official records indicate approximately 10.2 million unnatural losses in 2010 and 9.3 million in 2024. The corresponding national herd contractions were 25.5% and 10.9%. These two observations define the extreme tail of the fiscal-period loss distribution.
The two episodes are treated as descriptive endpoints, not as evidence of policy effectiveness or independent meteorological treatments. The available fiscal series documents annual herd change and realized mortality but does not contain the linked household, herd-composition, debt, income, or post-event outcome data required to evaluate recovery.
Table 3 demonstrates why the fiscal and loss series cannot establish protection. The 2010 event combined the highest mortality with the lowest nominal support execution in the series, whereas 2024 combined severe mortality with the highest execution. The contrast is consistent with major changes in policy scale and response capacity over time, but it is also compatible with anticipatory spending, contemporaneous relief, and post-loss support. Without instrument timing and beneficiary exposure, the same descriptive pattern supports several competing mechanisms.
3.3. White Gold Application, Approval, and Disbursement Funnel
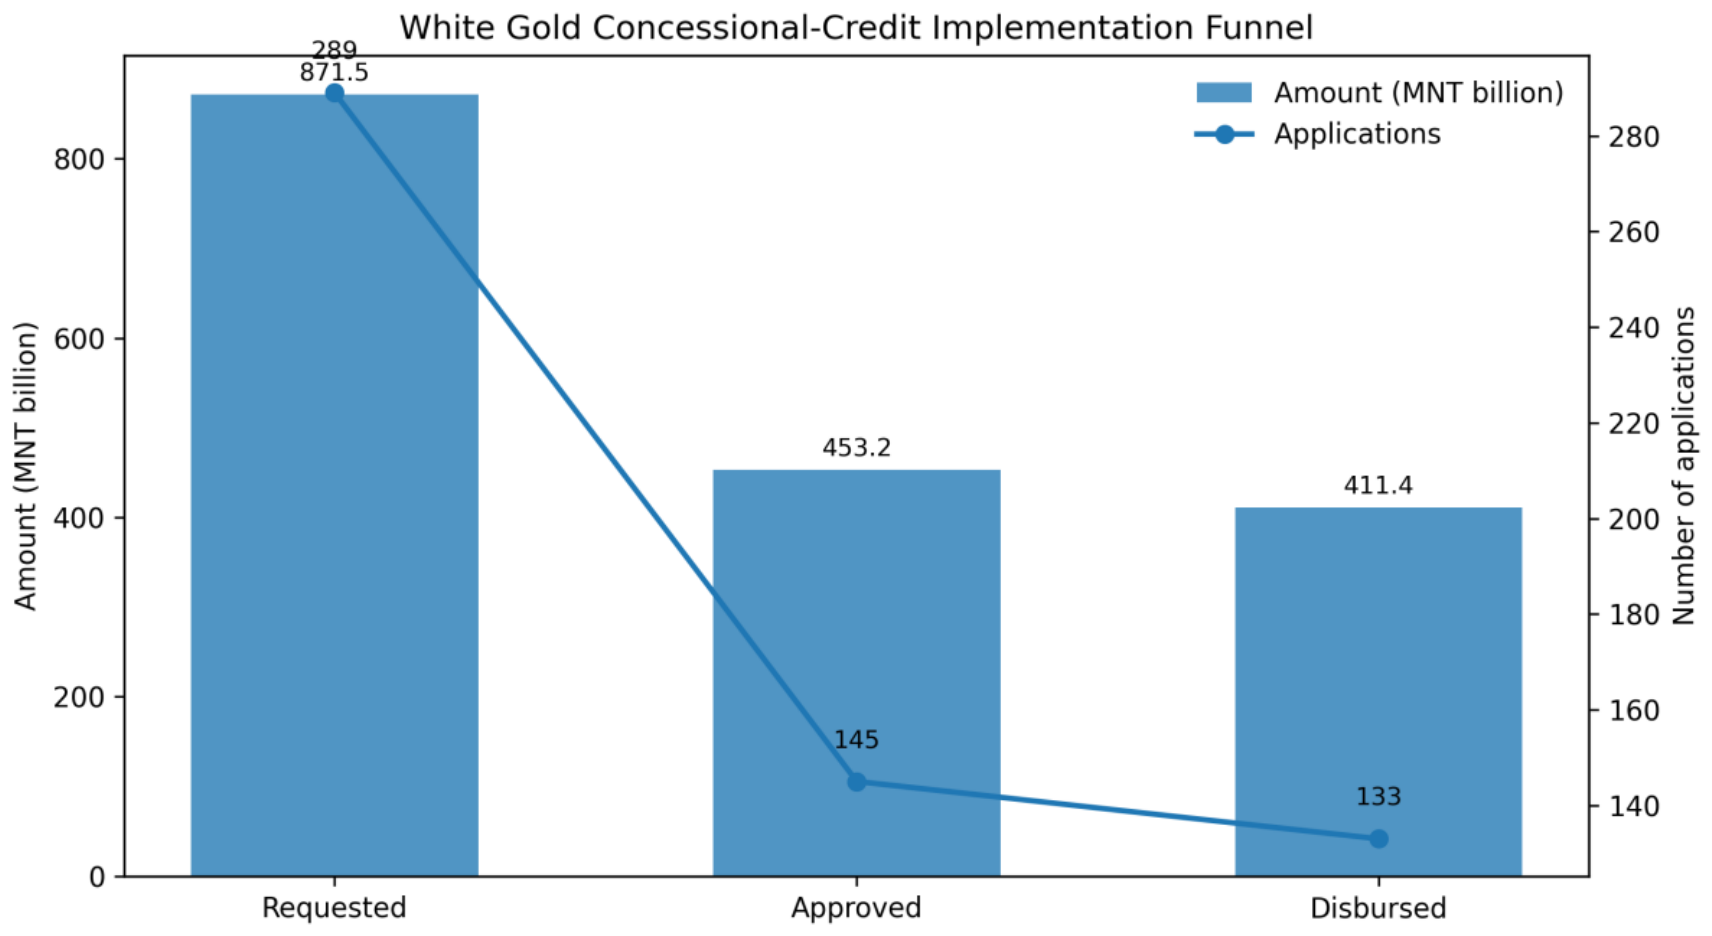
The White Gold records show substantial demand for concessional finance and a clear administrative funnel. The 289 classified applications requested MNT 871.5 billion. A total of 145 applications were approved, equal to 50.2% by count, and approved value was MNT 453.2 billion, or 52.0% of requested value. By 20 June 2025, 133 approved applications had received disbursement. MNT 411.4 billion was recorded as disbursed, representing 91.7% of approved applications by count and 90.8% of approved value. Relative to initial requested value, however, the delivered share was 47.2%.
Seventy-five applications requesting MNT 155.3 billion remained under review, while 69 applications requesting MNT 204.8 billion were returned or did not meet requirements. These categories represent different constraints. Rejection or return can reflect eligibility, documentation, collateral, creditworthiness, or project quality, whereas an approved but undisbursed loan can reflect contracting, conditions precedent, procurement readiness, or implementation delays. Publishing only one “access rate” would conceal these distinctions.
Working-capital and investment finance followed different delivery paths. Working-capital applications requested MNT 647.1 billion and received MNT 334.7 billion; 96.6% of approved working-capital value was disbursed. Investment applications requested MNT 224.4 billion and received MNT 76.7 billion; 71.8% of approved investment value was disbursed. The result identifies the delivery stage at which implementation differs, but the available records do not identify the specific cause of each delay.
Table 4 reports the funnel and loan-type conversion rates, while Figure 2 visualizes the requested, approved, and disbursed stages.
Figure 2.
White Gold concessional-credit implementation funnel by application count and monetary value. Approval and disbursement use different denominators and should not be merged into one access statistic.
Figure 2.
White Gold concessional-credit implementation funnel by application count and monetary value. Approval and disbursement use different denominators and should not be merged into one access statistic.
3.4. Portfolio Concentration by Loan Type, Purpose, Registered Location, and Bank
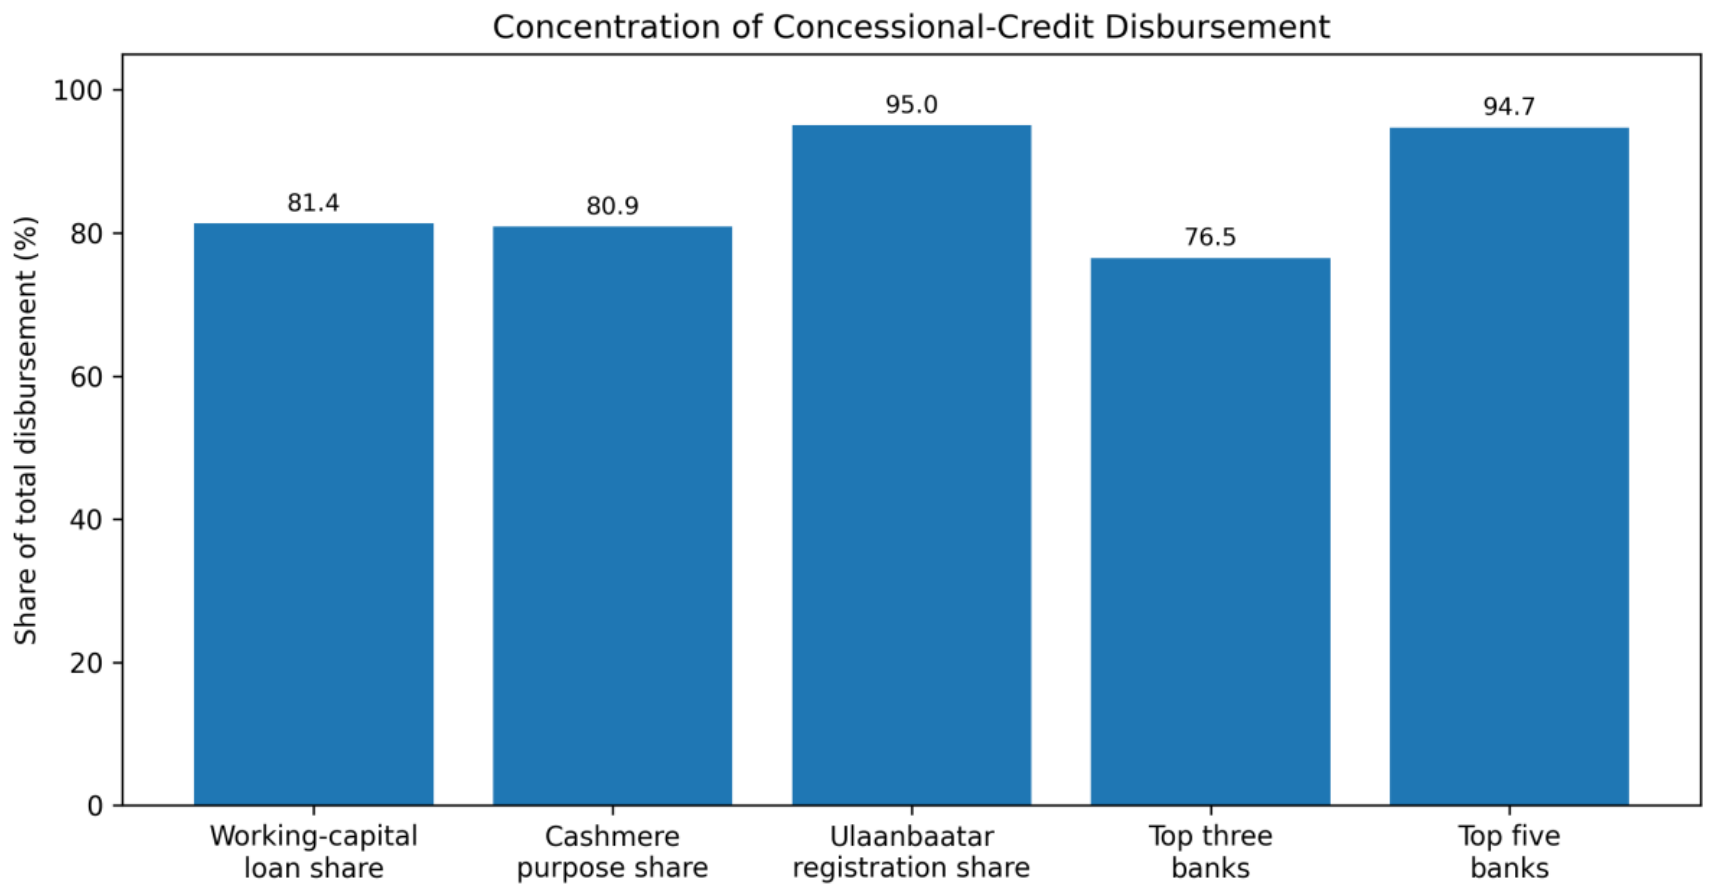
The disbursed portfolio was concentrated in a small number of channels. Working-capital finance accounted for MNT 334.7 billion, or 81.4% of total disbursement. Cashmere-related activities received MNT 332.7 billion, or 80.9%. Cashmere working capital and raw-material procurement formed the largest subcategory. Wool and fiber received 9.9%, and hides and leather received 9.2%. This composition may be consistent with the scale and seasonality of cashmere procurement, but the program record does not state an ex ante portfolio benchmark against which the allocation can be classified as optimal or inefficient.
Borrower registration was even more concentrated. Ulaanbaatar-registered firms received MNT 390.9 billion, equivalent to 95.0% of disbursement when reported to one decimal place. Orkhon-associated firms accounted for most finance registered outside the capital. This concentration may partly reflect headquarters-based reporting and the location of financial and processing functions rather than the geography of raw-material sourcing. It nevertheless prevents a direct reading of the final rural or provincial incidence of finance.
The bank channel had an HHI of 0.246. The largest bank disbursed MNT 163.0 billion, equal to 39.6% of the portfolio. The top three banks delivered 76.5%, and the top five delivered 94.7%. Concentration can reduce transaction costs when a small number of institutions have the operational capacity to implement a program. It can also create delivery dependence and uneven geographic access. The data identify concentration but not its net efficiency effect.
Figure 3.
Concentration of concessional-credit disbursement by loan type, purpose, registered location, and bank channel. Concentration is a structural description and is not, by itself, evidence of inefficient allocation.
Figure 3.
Concentration of concessional-credit disbursement by loan type, purpose, registered location, and bank channel. Concentration is a structural description and is not, by itself, evidence of inefficient allocation.
3.5. Regional Exposure and the Limits of Registration-Based Allocation
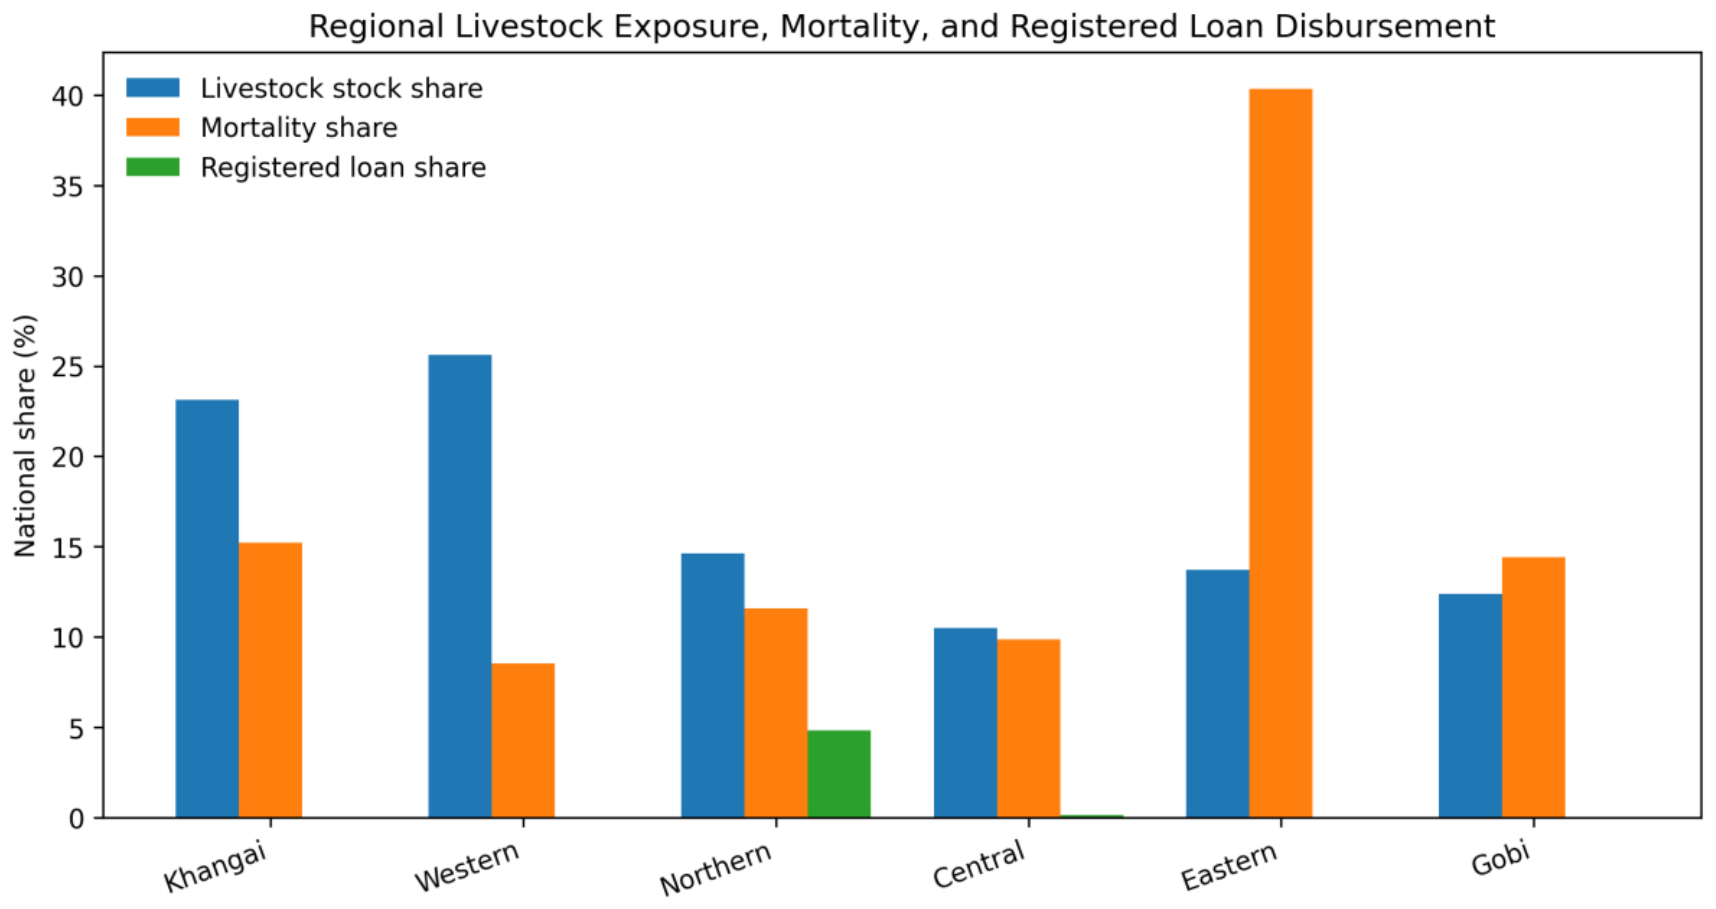
The regional comparison reveals a large difference between the spatial distribution of livestock and the registration location of financed enterprises. The Khangai and Western regions together held 48.74% of the national herd in 2024, but no disbursement was registered to firms in those regions. The Eastern region held 13.72% of livestock and accounted for 40.35% of national mortality, with a regional mortality rate of 47.94%, yet no disbursement was registered there. The Gobi region accounted for 14.43% of mortality and also had no registered disbursement.
The Northern region held 14.64% of the herd, accounted for 11.59% of mortality, and received 4.84% of registered disbursement. The Central region held 10.49% of livestock, accounted for 9.87% of mortality, and received 0.13% of registered disbursement. On a registration basis, the loan-minus-livestock-share gap was negative in every pastoral region, ranging from −9.80 percentage points in the Northern region to −25.60 points in the Western region.
These differences do not demonstrate that rural suppliers received no benefit. A processor registered in Ulaanbaatar can procure cashmere, wool, hides, or leather inputs from several provinces, and working-capital credit can transmit liquidity through purchase contracts. The administrative record does not report supplier identifiers, province-level sourcing volumes and values, contract terms, or payment timing. The observed mismatch is therefore evidence that geographic incidence cannot be measured from borrower registration alone.
Figure 4.
Regional livestock stock, 2024 mortality, and registered loan-disbursement shares. The figure identifies an administrative-location mismatch; it does not establish the final regional incidence of processor finance.
Figure 4.
Regional livestock stock, 2024 mortality, and registered loan-disbursement shares. The figure identifies an administrative-location mismatch; it does not establish the final regional incidence of processor finance.
3.6. Evaluability Audit
The combined evidence supports different conclusions at different evaluation levels. Fiscal implementation is observable: approved budgets, execution amounts, and execution rates are recorded annually. Credit delivery is also observable: applications can be followed through approval and disbursement. Allocation structure is partially observable through bank, purpose, loan type, and borrower registration. However, beneficiary exposure, supplier geography, immediate outputs, and final outcomes are not linked across systems.
Table 7 converts these findings into an evaluability audit. The highest fully supported level is implementation monitoring, while access and allocation are partially supported, with important geographic limitations. Outcome monitoring is not yet supported because finance cannot be linked to procurement, production, employment, exports, repayment, livestock recovery, or household welfare. Impact evaluation is not supported because treatment exposure, timing, outcome linkage, and a comparison strategy are absent.
4. Discussion
4.1. Implementation Success and Policy Effectiveness Are Different Claims
The first substantive finding is that Mongolia’s public-support architecture can be measured more credibly for fiscal implementation than for economic effectiveness. The budget series documents major expansion and generally high execution, while the White Gold records document a high approved-to-disbursed conversion. These are meaningful management results. They indicate whether authorized resources moved through government and banking channels. They do not reveal whether the same resources increased resilience, productivity, value addition, or welfare.
This distinction is consistent with international evidence showing that agricultural support has heterogeneous effects across instruments, farm structures, and institutional settings [10,11,12]. A payment can be rapidly disbursed but poorly targeted; an investment loan can be delayed but ultimately productive; emergency support can coincide with high mortality because it responds to the same event. Evaluation becomes misleading when an implementation variable is relabeled as an outcome or when contemporaneous association is interpreted as prevention.
The design choice is consequential. A short national series cannot support precise multivariable inference, and repeating a national support value across regions does not create independent policy variation. The descriptive audit consequently prioritizes transparent denominators, measurement boundaries, and institutional interpretation over unstable significance tests.
4.2. Extreme Livestock Losses Require Independent Hazard and Exposure Measurement
The 2010 and 2024 episodes demonstrate the episodic nature of pastoral risk. Previous research shows that dzud mortality is jointly shaped by drought, snow, cold, herd density, animal condition, mobility, forage access, and social and institutional capacity [16,17,18,19,20,21,22,23]. A mortality threshold identifies a severe realized outcome, but it is not an independent hazard variable. Using mortality to define a “shock” and then explaining mortality with support would condition the model on its own dependent variable.
A future risk-sensitive evaluation should construct hazard exposure independently. Province- or soum-level temperature, snow, precipitation, drought, pasture condition, and official dzud-warning indicators should be linked to instrument-specific financial exposure. The timing must distinguish preparedness finance issued before the winter, contingent liquidity released during the event, and recovery support delivered afterward. Only then can the analysis separate prevention from response and estimate whether support altered losses conditional on hazard severity.
Recovery should be measured beyond national herd counts. Aggregate stock changes can conceal differences in herd species, breeding quality, household ownership, debt, forced sales, migration, or unequal recovery. Household- and enterprise-level outcomes are therefore necessary for distributional, welfare, and resilience inference. Consistent with this concern, a 2018–2024 household panel from Öndörshireet Soum found that herd size increased over the study period while real household income declined, and that post-dzud herd rebuilding did not restore income to its pre-shock level [24].
4.3. Credit Concentration Is Not Automatically Misallocation
The White Gold portfolio is highly concentrated in working capital, cashmere-related purposes, capital-registered firms, and a few banks. One plausible institutional interpretation is that seasonal raw-material procurement can create large short-term liquidity needs, while larger processors and banks may have greater capacity to satisfy program documentation, collateral, and risk-management requirements. The available records do not establish that these mechanisms caused the observed concentration, and Ulaanbaatar registration should not be interpreted as the location of raw-material benefits.
The evaluative problem is the absence of an explicit benchmark and incidence fields. If the primary objective is to stabilize raw-material procurement, the program should report incremental procurement volume, supplier counts, prices paid, payment timing, processing utilization, exports, and repayment. If balanced regional development or herder inclusion is also an objective, supplier origin and beneficiary geography must be recorded. Without pre-specified targets, observed concentration can be measured but cannot be judged against policy intent.
The bank concentration result similarly identifies a trade-off rather than an automatic failure. Concentrated delivery may lower administrative costs and accelerate disbursement, but it may also make access dependent on a small number of bank networks and risk appetites. Reporting approval and disbursement rates by bank, borrower size, location, and application reason would allow the program to determine whether concentration reflects efficient specialization or avoidable exclusion.
4.4. A Minimum Data Architecture for Evaluation-Ready Support
The central policy implication is that better evaluation requires redesigning the administrative record, not merely adding more econometric techniques. Each instrument should have a unique identifier, policy objective, eligibility rule, approval date, disbursement date, amount, beneficiary identifier, geographic exposure, intended output, and outcome-monitoring schedule. Product incentives, interest subsidies, emergency grants, guarantees, and concessional loans should not be pooled unless their mechanisms and units are comparable.
For livestock-risk programs, the minimum spatial unit should be the province and preferably the soum or beneficiary level. Hazard fields should be imported independently from meteorological and remote-sensing systems. Loan and incentive records should identify raw-material sourcing, supplier counts, procurement values, and payment dates. Post-finance monitoring should capture investment completion, capacity utilization, production, sales, exports, employment, repayment, and default. Data governance should preserve confidentiality through anonymized identifiers and access controls while enabling authorized linkage.
The evaluation plan should be specified before implementation. Primary outcomes, expected lags, heterogeneity dimensions, comparison groups, and reporting intervals should be documented. Threshold-based or phased eligibility can sometimes support quasi-experimental designs, but such methods are credible only when assignment rules and pre-policy trends are preserved. Where causal identification is not possible, the system should explicitly report implementation and outcome monitoring without overclaiming impact.
4.5. Relevance to Other Climate-Exposed Pastoral Systems
The evaluability problem extends beyond Mongolia. Pastoral and dryland economies often combine systemic climate risk, mobile production, weak collateral, long value chains, centralized processors, and fragmented administrative systems. Public programs may therefore produce detailed expenditure and banking records while failing to record the location and condition of final producers. The audit structure used here—implementation, conversion, concentration, traceability, outcomes, and counterfactual—offers a transferable framework for determining what a support system can credibly claim before more advanced impact methods are attempted.
4.6. Limitations
The study has five principal limitations. First, the national fiscal-loss series contains only 15 annual observations and combines heterogeneous instruments in nominal values. It is therefore used descriptively. Second, the severe episodes are classified from realized mortality and herd decline; they do not represent independent meteorological treatments. Third, the White Gold dataset is a point-in-time snapshot, and the status of applications under review may change.
Fourth, borrower registration is not equivalent to production, sourcing, or final-beneficiary location. The regional alignment gap measures the limitation of the administrative field rather than the true spatial distribution of benefits. Fifth, application-level administrative data are not publicly redistributable, and linked post-finance outcomes are unavailable. The conclusions are consequently limited to implementation, concentration, and evaluability. They should not be interpreted as estimates of economic return, regional equity, or causal impact. This spatial limitation is consequential because recent dual-scale evidence from Mongolian rangelands shows the analytical value of combining local pasture-user-group data with a national soum-level panel to align livestock, climate, ecological, and livelihood information across spatial scales [36].
5. Conclusions
Mongolia’s public financial support to agriculture expanded substantially during 2010–2024, and the White Gold program converted most approved finance into actual disbursement. These findings establish administrative scale and delivery performance. They do not establish that aggregate support reduced livestock mortality or generated productivity gains.
The severe 2010 and 2024 loss episodes illustrate why fiscal timing alone is insufficient for causal inference. Support can be preventive, anticipatory, contemporaneous, compensatory, or developmental. Independent hazard indicators, instrument-specific timing, and beneficiary exposure are required to distinguish these mechanisms.
The White Gold portfolio was concentrated in working capital, cashmere-related purposes, Ulaanbaatar-registered firms, and a small group of banks. Concentration may be compatible with value-chain structure, but current records cannot trace finance from capital-registered processors to provincial suppliers or final outcomes. The primary empirical finding is therefore a traceability gap rather than proof of regional misallocation.
The available records support implementation monitoring and partially support access and allocation analysis. They do not yet support outcome or impact evaluation. The next reform should be an integrated data architecture that links policy objectives, eligibility, financial delivery, hazard and geographic exposure, suppliers and beneficiaries, immediate outputs, and post-finance outcomes. Better data design is a prerequisite for stronger causal methods and more defensible agricultural policy.
Author Contributions
U.G. is the sole author of this preprint and has approved the final version of the manuscript.
Funding
This research received no external funding.
Institutional Review Board Statement
Not applicable. The study uses aggregated official statistics and administrative program records and does not involve experiments or primary data collection from humans or animals.
Informed Consent Statement
Not applicable.
Data Availability Statement
The aggregated analytical data and executable code required to reproduce the reported descriptive indicators and Figure 1, Figure 2, Figure 3 and Figure 4 are available from the corresponding author upon reasonable request. The underlying official statistics are available from the National Statistics Office of Mongolia, the Ministry of Finance, and the Ministry of Food, Agriculture and Light Industry, as cited in the manuscript. Application-level White Gold records, borrower identifiers, and confidential credit information are not publicly redistributed due to confidentiality restrictions.
Acknowledgments
The author acknowledges the National Statistics Office of Mongolia, the Ministry of Finance, and the Ministry of Food, Agriculture and Light Industry for producing the official statistical and administrative information used in this study.
Conflicts of Interest
The author declares no conflict of interest. The data-producing institutions had no role in the study design, interpretation of the results, writing of the manuscript, or decision to publicly disseminate this preprint.
References
- National Statistics Office of Mongolia. Livestock Population Declined to 57.6 Million, Down 10.9 Percent from the Previous Year (I–XII/2024); NSO: Ulaanbaatar, Mongolia, 2025. (In Mongolian).
- National Statistics Office of Mongolia. Mongolian Statistical Yearbook 2024; NSO: Ulaanbaatar, Mongolia, 2025. (In Mongolian).
- World Bank. World Development Report 2008: Agriculture for Development; World Bank: Washington, DC, USA, 2008.
- Food and Agriculture Organization of the United Nations; United Nations Development Programme; United Nations Environment Programme. A Multi-Billion-Dollar Opportunity: Repurposing Agricultural Support to Transform Food Systems; FAO: Rome, Italy, 2021.
- OECD. Agricultural Policy Monitoring and Evaluation 2023: Adapting Agriculture to Climate Change; OECD Publishing: Paris, France, 2023.
- Stiglitz, J.E.; Weiss, A. Credit rationing in markets with imperfect information. Am. Econ. Rev. 1981, 71, 393–410.
- Hoff, K.; Stiglitz, J.E. Introduction: Imperfect information and rural credit markets—puzzles and policy perspectives. World Bank Econ. Rev. 1990, 4, 235–250. [CrossRef]
- Boucher, S.R.; Carter, M.R.; Guirkinger, C. Risk rationing and wealth effects in credit markets: Theory and implications for agricultural development. Am. J. Agric. Econ. 2008, 90, 409–423. [CrossRef]
- Karlan, D.; Osei, R.; Osei-Akoto, I.; Udry, C. Agricultural decisions after relaxing credit and risk constraints. Q. J. Econ. 2014, 129, 597–652. [CrossRef]
- Minviel, J.J.; Latruffe, L. Effect of public subsidies on farm technical efficiency: A meta-analysis of empirical results. Appl. Econ. 2017, 49, 213–226. [CrossRef]
- Rizov, M.; Pokrivcak, J.; Ciaian, P. CAP subsidies and productivity of the EU farms. J. Agric. Econ. 2013, 64, 537–557. [CrossRef]
- Zhu, X.; Oude Lansink, A. Impact of CAP subsidies on technical efficiency of crop farms in Germany, the Netherlands and Sweden. J. Agric. Econ. 2010, 61, 545–564. [CrossRef]
- Barnett, B.J.; Barrett, C.B.; Skees, J.R. Poverty traps and index-based risk transfer products. World Dev. 2008, 36, 1766–1785. [CrossRef]
- Carter, M.R.; de Janvry, A.; Sadoulet, E.; Sarris, A. Index insurance for developing country agriculture: A reassessment. Annu. Rev. Resour. Econ. 2017, 9, 421–438. [CrossRef]
- Mahul, O.; Skees, J.R. Managing Agricultural Risk at the Country Level: The Case of Index-Based Livestock Insurance in Mongolia; Policy Research Working Paper No. 4325; World Bank: Washington, DC, USA, 2007. [CrossRef]
- Rao, M.P.; Davi, N.K.; D’Arrigo, R.D.; Skees, J.; Nachin, B.; Leland, C.; Lyon, B.; Wang, S.-Y.; Byambasuren, O. Dzuds, droughts, and livestock mortality in Mongolia. Environ. Res. Lett. 2015, 10, 074012. [CrossRef]
- Tachiiri, K.; Shinoda, M.; Klinkenberg, B.; Morinaga, Y. Assessing Mongolian snow disaster risk using livestock and satellite data. J. Arid Environ. 2008, 72, 2251–2263. [CrossRef]
- Du, C.; Shinoda, M.; Tachiiri, K.; Nandintsetseg, B.; Komiyama, H.; Matsushita, S. Mongolian herders’ vulnerability to dzud: A study of record livestock mortality levels during the severe 2009/2010 winter. Nat. Hazards 2018, 92, 165–181. [CrossRef]
- Nandintsetseg, B.; Shinoda, M.; Du, C.; Munkhjargal, E. Cold-season disasters on the Eurasian steppes: Climate-driven or man-made. Sci. Rep. 2018, 8, 14769. [CrossRef]
- Sternberg, T. Unravelling Mongolia’s extreme winter disaster of 2010. Nomadic Peoples 2010, 14, 72–86. [CrossRef]
- Fernández-Giménez, M.E.; Batkhishig, B.; Batbuyan, B.; Ulambayar, T. Lessons from the dzud: Community-based rangeland management increases the adaptive capacity of Mongolian herders to winter disasters. World Dev. 2015, 68, 48–65. [CrossRef]
- Addison, J.; Brown, C.G. A multi-scaled analysis of the effect of climate, commodity prices and risk on the livelihoods of Mongolian pastoralists. J. Arid Environ. 2014, 109, 54–64. [CrossRef]
- Mearns, R. Sustaining livelihoods on Mongolia’s pastoral commons: Insights from a participatory poverty assessment. Dev. Change 2004, 35, 107–139. [CrossRef]
- Davaatseren, E.; Sodnomdavaa, T.; Enkhbayar, E.; Bayarsaikhan, S.; Mandakh, U. Rangeland degradation, vegetation dynamics, and household income in a Mongolian pastoral system: Panel evidence from Öndörshireet Soum. Land 2026, 15, 954. [CrossRef]
- United Nations Development Programme. Socio-Economic Impact Assessment of Dzud 2023–2024: Dzud Resilience Strategy and Policy Recommendations; UNDP: Ulaanbaatar, Mongolia, 2025.
- United Nations Country Team in Mongolia. Mongolia: Dzud Response Plan, March 2024 Update; United Nations in Mongolia: Ulaanbaatar, Mongolia, 2024.
- World Bank. Mongolia Agricultural Sector Risk Assessment; World Bank: Washington, DC, USA, 2015.
- Gunjal, K.; Annor-Frempong, C. Review, Estimation and Analysis of Agricultural Subsidies in Mongolia; World Bank: Washington, DC, USA, 2014.
- Puntsagdorj, B.; Orosoo, D.; Huo, X.; Xia, X. Farmer’s perception, agricultural subsidies, and adoption of sustainable agricultural practices: A case from Mongolia. Sustainability 2021, 13, 1524. [CrossRef]
- Asian Development Bank. Strengthening Cooperative Institutions to Support Sustainable Livestock Production in Mongolia; ADB Brief No. 226; Asian Development Bank: Manila, Philippines, 2022. [CrossRef]
- OECD. OECD’s Producer Support Estimate and Related Indicators of Agricultural Support: Concepts, Calculations, Interpretation and Use; OECD Publishing: Paris, France, 2016.
- Ministry of Food, Agriculture and Light Industry. Annual Activity Report 2024; Government of Mongolia: Ulaanbaatar, Mongolia, 2025. (In Mongolian).
- State Great Khural of Mongolia. Resolution No. 63 on Measures to Support Processing Industries for Livestock-Origin Raw Materials; State Great Khural: Ulaanbaatar, Mongolia, 2024. (In Mongolian).
- Ministry of Food, Agriculture and Light Industry. White Gold National Movement Loan Information: Administrative Records as of 20 June 2025; Government of Mongolia: Ulaanbaatar, Mongolia, 2025. (In Mongolian; unpublished administrative data).
- Ministry of Finance. Consolidated Budget Execution of Mongolia for 2024; Government of Mongolia: Ulaanbaatar, Mongolia, 2025. (In Mongolian).
- Davaatseren, E.; Sodnomdavaa, T.; Enkhbayar, E.; Bayarsaikhan, S.; Mandakh, U.; Dorj, M. Livestock pressure, soil organic carbon, and herder income in Mongolian rangelands: Dual-scale empirical and scenario-based evidence. Land 2026, 15, 1169. [CrossRef]

Table 1.
Data sources, analytical units, and interpretation limits.
| Dataset | Period | Unit | Principal variables | Permitted inference |
|---|---|---|---|---|
| National livestock statistics | 2010–2024 | Country-year | Livestock stock, unnatural losses, mortality rate, herd growth | Trend and event description; not an exogenous hazard measure |
| Public-support budget and execution | 2010–2024 | Country-year | Approved budget, execution, execution rate | Fiscal implementation; not beneficiary exposure or effectiveness |
| Regional livestock and mortality | 2024 | Region | Livestock share, mortality rate and share | Spatial exposure and realized loss |
| White Gold administrative records | 20 June 2025 | Application / aggregated category | Requested, approved, disbursed amounts; status; bank; location; purpose | Access, delivery, concentration, and traceability; no post-finance outcomes |
Sources: National Statistics Office of Mongolia, Ministry of Finance, Ministry of Food, Agriculture and Light Industry, and aggregated White Gold administrative records.
Table 2.
Public-support budget, execution, livestock mortality, and herd growth, 2010–2024.
| Year | Budget (MNT bn) | Execution (MNT bn) | Execution rate (%) | Mortality rate (%) | Herd growth (%) |
|---|---|---|---|---|---|
| 2010 | 11.4 | 10.9 | 95.6 | 23.51 | -25.5 |
| 2011 | 35.0 | 20.7 | 59.1 | 2.00 | 11.1 |
| 2012 | 45.0 | 44.3 | 98.4 | 1.20 | 12.6 |
| 2013 | 52.0 | 42.7 | 82.1 | 1.90 | 10.3 |
| 2014 | 62.6 | 56.0 | 89.5 | 0.89 | 15.1 |
| 2015 | 51.5 | 51.4 | 99.8 | 1.20 | 7.7 |
| 2016 | 49.3 | 48.7 | 98.8 | 2.60 | 10.0 |
| 2017 | 58.5 | 53.3 | 91.1 | 1.40 | 7.7 |
| 2018 | 54.1 | 50.5 | 93.3 | 4.00 | 0.4 |
| 2019 | 56.1 | 48.5 | 86.5 | 1.70 | 6.8 |
| 2020 | 244.8 | 237.7 | 97.1 | 2.90 | -5.6 |
| 2021 | 82.6 | 81.4 | 98.5 | 4.50 | 0.5 |
| 2022 | 154.3 | 127.4 | 82.6 | 1.00 | 5.6 |
| 2023 | 256.9 | 117.2 | 45.6 | 6.90 | -9.1 |
| 2024 | 332.1 | 316.1 | 95.2 | 14.48 | -10.9 |
Sources: Ministry of Finance, Ministry of Food, Agriculture and Light Industry, and National Statistics Office of Mongolia. Rates are recalculated from the underlying series; small differences from published rounded values may occur.
Table 3.
Severe realized-loss episodes within the 2010–2024 fiscal series.
| Loss year | Previous-year herd (thousand) | Unnatural losses (million) | Mortality rate (%) | Herd growth (%) | Analytical interpretation |
|---|---|---|---|---|---|
| 2010 | 43,580.2 | 10.2 | 23.51 | −25.5 | Highest mortality in 2010–2024 |
| 2024 | 64,254.7 | 9.3 | 14.48 | −10.9 | Second-highest mortality; series endpoint |
Source: National Statistics Office of Mongolia. Severe episodes are descriptive outcome categories and are not treated as exogenous meteorological interventions.
Table 4.
White Gold loan funnel and loan-type implementation.
| Indicator | Applications | Requested (MNT bn) | Approved (MNT bn) | Disbursed (MNT bn) | Key rate |
|---|---|---|---|---|---|
| All classified applications | 289 | 871.5 | 453.2 | 411.4 | 50.2% approved; 47.2% of requested value disbursed |
| Disbursed applications | 133 | — | — | 411.4 | 91.7% of approved applications |
| Under review | 75 | 155.3 | — | — | 26.0% of classified applications |
| Returned / requirements not met | 69 | 204.8 | — | — | 23.9% of classified applications |
| Investment loans | 105 | 224.4 | 106.8 | 76.7 | 71.8% of approved value disbursed |
| Working-capital loans | 184 | 647.1 | 346.5 | 334.7 | 96.6% of approved value disbursed |
Source: aggregated White Gold administrative records reported on 20 June 2025. Two of 291 source records lacked complete loan-type or purpose classifications and are excluded from the detailed analysis. Financial amounts are rounded to one decimal place; rounded category components may differ from the reported total by MNT 0.1 billion.
Table 5.
Concentration indicators for White Gold disbursement.
| Dimension | Indicator | Value | Interpretation |
|---|---|---|---|
| Loan type | Working-capital share | 81.4% | Short-cycle procurement and operating finance dominate |
| Purpose | Cashmere-related share | 80.9% | Portfolio concentrated in one value chain |
| Registered location | Ulaanbaatar share | 95.0% | Borrower registration is capital-concentrated |
| Bank | HHI | 0.246 | Disbursement is concentrated across participating banks |
| Bank | Top-three share | 76.5% | Most finance delivered through three banks |
| Bank | Top-five share | 94.7% | Very limited disbursement outside five banks |
Shares use MNT 411.4 billion in total disbursement as the denominator. Registration location is not equivalent to production, supplier, or final-beneficiary location. Amounts are rounded to one decimal place, so displayed category totals can differ from reported totals by MNT 0.1 billion.
Table 6.
Regional livestock exposure, 2024 mortality, and registered White Gold loan disbursement.
| Region | Livestock share (%) | Mortality rate (%) | Mortality share (%) | Registered loan share (%) | Loan minus livestock share (pp) |
|---|---|---|---|---|---|
| Khangai | 23.14 | 10.71 | 15.21 | 0.00 | -23.14 |
| Western | 25.60 | 5.44 | 8.55 | 0.00 | -25.60 |
| Northern | 14.64 | 12.91 | 11.59 | 4.84 | -9.80 |
| Central | 10.49 | 15.34 | 9.87 | 0.13 | -10.36 |
| Eastern | 13.72 | 47.94 | 40.35 | 0.00 | -13.72 |
| Gobi | 12.40 | 18.97 | 14.43 | 0.00 | -12.40 |
Ulaanbaatar, which accounts for 95.0% of registered disbursement when reported to one decimal place, is excluded because it has no comparable pastoral livestock base. Values represent borrower registration, not verified production, sourcing, or final-beneficiary location. Reported administrative shares are retained because displayed monetary amounts are rounded.
Table 7.
Evaluability of the observed public-support architecture.
| Evaluation level | Primary question | Current evidence | Status | Minimum additional data |
|---|---|---|---|---|
| 1. Implementation monitoring | Were funds authorized and delivered? | Budget, execution, approval, disbursement | Supported | Instrument-level coding and consistent real-value deflators |
| 2. Access and allocation | Who received finance and through which channels? | Loan type, bank, purpose, registration location | Partially supported | Beneficiary identifiers, rejection reasons, province-level delivery fields |
| 3. Outcome monitoring | What changed after support? | No linked post-finance outcomes | Not supported | Procurement, production, capacity use, employment, exports, repayment, livestock recovery |
| 4. Impact evaluation | What would have happened without support? | No treatment-comparison design | Not supported | Pre-specified eligibility, treatment timing, exposure, counterfactual, and linked outcomes |
“Supported” refers to the inference permitted by available records, not to the quality or effectiveness of the policy itself.
Disclaimer/Publisher’s Note: The statements, opinions and data contained in all publications are solely those of the individual author(s) and contributor(s) and not of MDPI and/or the editor(s). MDPI and/or the editor(s) disclaim responsibility for any injury to people or property resulting from any ideas, methods, instructions or products referred to in the content. |
© 2026 by the authors. Licensee MDPI, Basel, Switzerland. This article is an open access article distributed under the terms and conditions of the Creative Commons Attribution (CC BY) license (http://creativecommons.org/licenses/by/4.0/).
Copyright: This open access article is published under a Creative Commons CC BY 4.0 license, which permit the free download, distribution, and reuse, provided that the author and preprint are cited in any reuse.