

Submitted:
16 September 2026
Posted:
18 September 2026
You are already at the latest version
Abstract
Interpretable prediction from longitudinal clinical data requires more than accurate risk estimates: a model should preserve meaningful domain structure, reveal how risk evolves over time, and remain auditable when transferred across heterogeneous healthcare settings. We address this challenge with a Knowledge-Guided Temporal Fuzzy Neural Network (KG-TFNN) that integrates clinically anchored yet trainable fuzzy states, explicit temporal fuzzy-risk and observation-process descriptors, parsimonious additive and cross-feature Sugeno inference, and attention-based temporal aggregation within a single auditable prediction pathway. Unlike approaches that rely primarily on latent representations or post-hoc explanations, KG-TFNN exposes membership evolution, feature-level risk contributions, native rule firing, temporal contributions, and parameter drift for direct structural analysis. We evaluated the framework for predicting a ≧ 2-point increase in Sequential Organ Failure Assessment (SOFA) score within 6 h using patient-disjoint MIMIC-IV development and locked testing, followed by fully frozen transport to the multicenter eICU-CRD database comprising 80,239 patients across 205 hospitals. Explicit temporal representation produced the largest controlled ablation effect on discrimination (ΔAUROC = 0.0510), exceeding the contribution of knowledge-guided initialization alone (ΔAUROC = 0.0061), while structural analyses demonstrated reproducible global behavior and identifiable membership and rule evolution. Although KG-TFNN did not exceed tuned LightGBM in discrimination, it enabled forms of temporal and structural auditing unavailable from predictive performance alone and revealed important limitations in cross-database calibration and patient-specific explanation. These findings establish KG-TFNN as a rigorously evaluated framework for studying the trade-off between predictive performance, semantic interpretability, temporal dynamics, and transportability, providing a reusable design principle for trustworthy longitudinal machine learning rather than a task-specific clinical alarm.
Keywords:
temporal fuzzy learning
; neuro-fuzzy system
; knowledge-guided learning
; interpretable prediction
; clinical deterioration
; external validation
1. Introduction
Longitudinal prediction problems require models to reconcile asynchronous trajectories, domain semantics, informative observation processes, and changes in data-generating settings. High discrimination alone does not show whether prior knowledge and temporal evidence remain visible in the prediction path, whether learned representations retain interpretable meaning, or whether probabilities remain reliable after transport.
Deep recurrent and attention models capture temporal dependencies through latent states, while boosting models often achieve strong discrimination and are commonly paired with post-hoc attribution. Fuzzy systems provide gradual linguistic states and rule-based reasoning, but static formulations may underrepresent temporal change, and unconstrained data-driven partitions may lose correspondence with domain concepts. Moreover, interpretability cannot be inferred solely from the presence of fuzzy terms or rules; it requires empirical analysis of stability, concentration, continuity, and structural fidelity [1,2,3].
We therefore developed the Knowledge-Guided Temporal Fuzzy Neural Network (KG-TFNN) to preserve recognizable fuzzy states while permitting data-driven membership adaptation, explicitly characterize feature-level temporal behavior, and expose intermediate prediction-path components for structural auditing. The methodological contribution lies in the system-level integration and empirical audit of four established mechanisms: knowledge-guided yet trainable fuzzy-state initialization; additive and prespecified cross-feature fuzzy inference; explicit temporal characterization of fuzzy-risk and observation processes; and attention-based fusion with direct audits of membership drift, rule firing, and temporal contributions. Accordingly, the study does not claim a new membership family, t-norm, or universal fuzzy inference operator.
SOFA-defined intensive-care-unit (ICU) deterioration was selected as a demanding empirical case because it is dynamic, multiorgan, time-sensitive, and partly dependent on measurement availability. SOFA summarizes organ dysfunction [4], whereas NEWS2 provides interpretable physiological abnormality ranges [5]. We used 24-hour observations to predict a future SOFA increase of at least 2 points within 6 hours, with patient-disjoint MIMIC-IV development and fully frozen eICU-CRD transport.
The contributions are: (1) a semantically anchored yet trainable type-1 fuzzy representation combining additive feature risk and bounded cross-feature interactions; (2) an explicit temporal fuzzy representation that separates physiologic trajectories from measurement-process descriptors and fuses them with temporal attention; and (3) a multidimensional evaluation framework covering discrimination, calibration, operational behavior, external transport, and structural explanation properties. The objective is not universal predictive superiority, but to determine what is gained and lost when knowledge guidance and temporal inspectability are built into a longitudinal fuzzy prediction path.
2. Related Work
2.1. Fuzzy and Neuro-Fuzzy Systems for Prediction
Fuzzy inference systems map continuous measurements to overlapping linguistic states and combine them through inspectable rule structures. ANFIS established a differentiable adaptive-network implementation of Sugeno inference [6], while expert fuzzy systems demonstrated the value of explicit clinical rule organization [7]. Data-driven interpretability depends on both low-level membership semantics and high-level rule structure [8]; linguistic complexity, coverage, and distinguishability therefore require explicit assessment rather than assumption [9]. Recent reviews similarly frame interpretability as a design and evaluation problem across fuzzy-rule systems [10,11], including healthcare applications [12]. These findings motivate trainable fuzzy representations whose semantic anchors and structural behavior remain auditable.
2.2. Temporal and Dynamic Fuzzy Systems
Temporal extensions must represent both evolving values and the persistence or transition of fuzzy states. Recurrent fuzzy neural networks couple fuzzy risk representation with sequence learning [13]; evolving neuro-fuzzy systems adapt rules and partitions as data distributions change [14,15]. Temporal type-2 fuzzy systems additionally model time-dependent uncertainty and trajectories [16]. These approaches establish that temporality can enter fuzzy models through recurrence, evolution, or time-indexed membership. KG-TFNN instead retains type-1 Gaussian states and makes feature-level temporal fuzzy-risk descriptors explicit before attention-based fusion, enabling separate audits of state semantics, temporal behavior, and aggregation.
2.3. Knowledge-Guided and Interpretable Fuzzy Learning
Knowledge guidance can initialize fuzzy partitions, prescribe rule structure, or regularize learning. Context-aware Mamdani neuro-fuzzy adaptation preserves linguistic organization while updating representations [17], and deep fuzzy association models expose learned fuzzy relations for explanation [18]. Differentiable logic and hybrid clinical taxonomies provide broader mechanisms for embedding rules or priors [19,20]. In biomedical sequence models, ontologies and medical knowledge have guided recurrent representation [21]; reviews characterize where such priors enter the learning pipeline [22], and a temporal-convolution/UMLS model has predicted delta-SOFA with eICU-CRD validation [23]. A remaining design challenge is to integrate these ideas in a temporal fuzzy architecture where initialization semantics, native fuzzy inference, temporal contributions, and parameter evolution can all be inspected on the prediction path.
2.4. Biomedical Temporal Prediction and Cross-Dataset Transportability
Temporal electronic-health-record models include recurrent, convolutional, attention, and graph architectures [24]. DeepSOFA modeled hourly acuity [25], while Hyland et al. linked multiorgan trajectories with lead-time, calibration, external validation, and alarm burden [26]. Cross-database studies examined local and global temporal dependencies [27] and dynamic graphs [28]. Observation masks and measurement recency are also predictive because monitoring reflects severity, attention, and workflow [29,30]. Yet only 14.7% of 572 reviewed ICU studies performed external validation, with mean external AUROC decreasing by 0.037 [31].
Evaluation of a temporal fuzzy methodology should therefore extend beyond discrimination to external transport [32], calibration [33], reliability across patient profiles [34], threshold-dependent net benefit [35], and repeated-alert burden [36]. TRIPOD+AI and PROBAST+AI further emphasize transparent eligibility, missing data, development, calibration, and validation [37,38].
Taken together, prior studies establish the relevant fuzzy, temporal, knowledge-guided, and transport-evaluation components, but they differ in whether fuzzy-state semantics, native rule behavior, explicit temporal descriptors, and frozen external reliability are examined within the same prediction path. The present study evaluates that system-level combination rather than claiming that its individual operators are new. Supplementary Table S6 makes these design distinctions explicit across representative prior work; because the table is focused and author-curated, it supports positioning rather than an exhaustive novelty claim or direct cross-study performance ranking.
3. Materials and Methods
3.1. Methodological Overview and Design Objectives
KG-TFNN addresses three requirements: semantic anchoring without immutable score rules; temporal explicitness separating influential hours from feature-level patterns; and an inspectable prediction path exposing memberships, fuzzy-risk components, descriptors, and parameter drift. The methodological question is whether these requirements can be linked in one trainable architecture and evaluated without treating inspectability as a surrogate for predictive accuracy or clinical validity. The contribution is therefore the integrated design and its controlled empirical audit, not a new membership family or inference operator.
Figure 1 maps these requirements to learnable score-informed states, hourly additive and cross-feature risk, temporal attention, and physiologic and measurement-process descriptors. Inspectability was evaluated separately from predictive superiority, clinical validity, and transportability.
3.2. Study Design and Evaluation Setting
A credible assessment of transport requires development, internal verification, and cross-database evaluation to remain separated so that performance is not inflated by patient overlap, repeated test access, or target-setting recalibration. We therefore used the Medical Information Mart for Intensive Care IV (MIMIC-IV) v3.1 for patient-disjoint development and internal testing [39] and the eICU Collaborative Research Database (eICU-CRD) v2.0 for frozen external validation [40]. Both datasets are available through PhysioNet under credentialed access. MIMIC-IV v3.1 is available at https://physionet.org/content/mimiciv/3.1/, and eICU-CRD v2.0 is available at https://physionet.org/content/eicu-crd/2.0/. Access requires PhysioNet credentialing, completion of the required human-subjects research training, and acceptance of the applicable data use agreements. Adults aged at least 18 years were eligible. Each sample contained a 24-hour window and complete future 6-hour outcome; sensitivities varied observation length from 4 to 24 hours. Training supported fitting, validation supported tuning, checkpoint selection, calibration, and thresholds, and the test set was locked for final evaluation.
MIMIC-IV included 3,843,400 training windows from 34,185 patients, 819,573 validation windows from 7,301 patients, and 830,839 test windows from 7,287 patients. eICU-CRD included 80,239 patients, 99,262 stays, 205 hospitals, and 6,215,890 windows. Feature order, range rules, imputation defaults, model weights, MIMIC-IV calibration, and thresholds were frozen; eICU-CRD permitted only deterministic field/unit mapping and contributed no outcome to model development or recalibration.
Supplementary Figure S5 gives complete source, stay-hour, and exclusion denominators. Age, time-validity, complete-horizon, and lookback criteria yielded 5,493,812 MIMIC-IV and 6,215,890 eICU-CRD windows. Reporting follows the STROBE recommendations for observational studies; a completed checklist and cohort-flow diagram accompany the submission.
3.3. Outcome Formulation and Semantic Harmonization
To assess short-horizon multiorgan change rather than static severity, deterioration was a strictly future increase in reconstructed SOFA. Clinical semantics, rather than database-specific item identifiers, were harmonized across MIMIC-IV and eICU-CRD. At index hour t,
Let denote the six SOFA organ systems. Hourly reconstruction was
Here . The index hour was excluded from the future maximum, and all six future hours were required. Cardiovascular and renal scores used the worst MAP/vasopressor and creatinine/24-hour urine categories; other components used adverse 24-hour PaO2/FiO2, platelets, bilirubin, and GCS aggregates. At least four components were required at index and future assessment; remaining missing components contributed zero, and component sets could differ.
Source fields were mapped to common variables, units converted before range checks, records aggregated adversely, and values propagated only within stays. Both databases used identical thresholds and missing-component policy. Supplementary Table S1 details mappings, support and vasopressor logic, urine handling, and GCS limitations. Missing-as-normal, complete-case, common-component, and stable-mask outcomes were sensitivities only.
3.4. Input Representation and Observation-Process Modeling
Clinical values and the processes by which they are observed carry related but non-equivalent information. Encoding both only through imputed values would obscure whether a prediction arose from physiology or from monitoring behavior. KG-TFNN therefore separates physiological values from observation-process information. The 13 variables were heart rate, respiratory rate, SpO2, FiO2, temperature, systolic and mean arterial pressure, GCS, PaO2/FiO2, platelets, bilirubin, creatinine, and lactate. Alignment, units, range filtering, and partitioning preceded imputation. Missingness and recency were recorded first; values were then forward-filled within stays and residual gaps received prespecified defaults.
For , contained values, pre-imputation missingness, and recency. Each feature yielded mean, minimum, maximum, standard deviation, slope, last-hour and window change, abnormal duration/frequency, missing fraction, current missingness, and log-scaled recency. The first nine summarized fuzzy-risk trajectories; the final three described measurement.
3.5. Knowledge-Guided Temporal Fuzzy Learning Architecture
From a fuzzy-systems perspective, KG-TFNN contains three representational levels: fuzzy-state representation, fuzzy-rule inference, and temporal fuzzy-risk aggregation. The first maps continuous measurements to semantically initialized but trainable membership states; the second produces additive and cross-feature Sugeno-style fuzzy risk; and the third summarizes the evolution of fuzzy risk using explicit descriptors and temporal attention. This separation makes state semantics, native rule behavior, and temporal aggregation individually auditable while all parameters remain jointly trainable (Figure 1).
3.5.1. Knowledge-Guided Fuzzy Membership Initialization
Purely data-driven fuzzy partitions may fit cohort-specific distributions while yielding states weakly connected to established clinical concepts; fixed score bins preserve meaning but cannot adapt to the observed cohort. KG-TFNN therefore treats NEWS2/SOFA thresholds and clinical ranges as learnable initialization priors rather than immutable cut points. This design preserves a semantic reference for auditing membership drift while permitting data-driven adaptation.
Centers , widths , and abnormality weights were initialized from NEWS2 Scale 1, SOFA, or prespecified clinical ranges. Widths remained positive through . Scale 2 was omitted because chronic hypercapnia was not reliably identifiable; oxygen and altered consciousness used FiO2 and GCS . Supplementary Table S2 lists the initialization of all 13 variables and the complete native cross-feature rule specification; Figure 3 shows representative initialized and frozen trained memberships.
3.5.2. Additive and Cross-Feature Sugeno Fuzzy Inference
Single-feature terms preserve feature-level attribution but cannot represent clinically relevant concurrent abnormalities, whereas unrestricted rule induction would weaken parsimony and auditability. We therefore combined additive feature risk with a small prespecified set of product-t-norm interactions:
where is the antecedent set of rule k. Normalized rule firing was , and hourly fuzzy risk was
limits additive/cross-rule double counting. Equations 3–5 define a differentiable zero-order Sugeno-style risk layer: and are singleton risk consequents, and no Mamdani output set or defuzzification is used. Normalized firing supplies relative predictive evidence; raw supports activation and coverage audits. The six prespecified antecedent sets, initial and frozen trained weights, and raw-firing support statistics are reported in Supplementary Table S2.
3.5.3. Temporal Fuzzy-Risk Descriptor Construction
Attention can identify influential hours without revealing whether risk reflects persistence, slope, abrupt change, or observation irregularity. To make these temporal mechanisms explicit rather than leaving them in a latent sequence state, we defined feature-specific physiologic and measurement-process descriptors for :
contained fuzzy-risk mean, minimum, maximum, and standard deviation; contained slope and last-hour/window change; contained soft duration and observed-hour frequency; and contained missing fraction, current missingness, and recency. Duration was a differentiable fraction, not the longest run. The 13×9 physiologic and 13×3 measurement blocks yielded .
3.5.4. Attention-Based Temporal Fuzzy Fusion
Fixed temporal pooling can dilute transient changes, while descriptor-only aggregation can lose which hours were influential. We therefore used attention to represent when hourly risk is influential and descriptors to represent which temporal patterns contribute. Attention was
The final logit fused attended hourly risk and :
Membership, consequent, attention, descriptor, and output parameters were optimized jointly by gradient backpropagation.
3.5.5. Fuzzy-Structure Regularization and Auditing
Unconstrained fitting could reverse prior risk directions or move membership parameters so far that their initial clinical semantics no longer provide a useful audit reference; fixing those parameters would prevent adaptation. We therefore combined class-weighted binary cross-entropy with directional, sparsity, initialization-drift, and nonnegative-weight regularizers. These terms preserve selected prior structure without guaranteeing clinical validity:
For minibatch size B, the prediction term was
was fixed from training (16.6585 equal-sample; 16.6586 full-cohort). For and ,
where contains valid adjacent feature/hour differences and . Sparsity was
Define and :
Superscript 0 denotes initialization. Directional loss used adjacent and ; sparsity/nonnegativity acted on , , and ; drift additionally acted on c and . No penalty directly targeted temporal attention (Figure 1).
3.6. Model Development and Implementation
To separate the methodological design from particular optimization choices and support reproducibility, we recorded development settings and selected parameters explicitly. The model used Python 3.12.12, PyTorch 2.5.1, CUDA 12.1, and an NVIDIA Quadro P2200. AdamW used batch size 256, learning rate 0.00489068, weight decay 0.00028051, and gradient clipping at 5.0. The attention width was 16; , , and output bias was initialized to . Loss coefficients were , , , and .
Optuna used 30 TPE trials on fixed 200,000-window training and 50,000-window validation samples, at most eight epochs, and median pruning (Supplementary Table S7). KG-TFNN-equal used these samples for controlled comparisons; KG-TFNN-full used all 3,843,400 training and 819,573 validation windows for reliability and summary analyses. Validation AUROC selected checkpoints within 20 epochs (minimum 10; patience five; minimum improvement 0.0001); both seed-42 models selected epoch 15. Table 2 Panels A–B, Figure 2(a–b), and Table 3 Panel B use KG-TFNN-equal; full-cohort panels, operating analyses, and single-checkpoint summaries use KG-TFNN-full. Multi-seed summary analyses use the equal-sample protocol documented in Supplementary Tables S3a–S3c and Table 4.
OpenAI ChatGPT and Codex were used for language editing and code debugging during manuscript and analysis preparation. The authors reviewed every retained suggestion, verified the reported analyses against the frozen outputs, and remain responsible for the work.
Algorithm 1: Training and frozen evaluation
- Construct patient-disjoint partitions, 24-hour inputs, and strictly future 6-hour labels.
- Initialize memberships, risk weights, and cross-rules from clinical priors; compute hourly fuzzy risk, temporal attention, and explicit descriptors.
- Optimize Eq. 9; select one checkpoint using validation AUROC and early stopping.
- Fit Platt calibration and 90%/95% specificity thresholds using validation predictions only.
- Freeze the model, calibration, and thresholds; evaluate the internal test once and transport the unchanged pipeline to eICU-CRD.
Validation-only Platt calibration transformed the raw model probability as
In Eq. 14, the slope and intercept were estimated only from MIMIC-IV validation predictions and then fixed for both locked MIMIC-IV testing and eICU-CRD transport.
3.7. Comparators and Multidimensional Evaluation Framework
Because a knowledge-guided methodology cannot be judged by discrimination alone, evaluation was organized around four questions: whether it predicted accurately, remained reliable across settings, produced usable operating characteristics, and exposed structurally auditable behavior. These questions corresponded to prediction (discrimination), reliability (calibration and transport), operations (decision curves and alarms), and inspectability (robustness, continuity, concentration, parameter behavior, firing, and coverage).
3.7.1. Comparator Development
To distinguish architectural differences from advantages in data volume, patient composition, or model-selection opportunity, the controlled comparison used identical patient splits, fixed identifiers, 200,000 training windows, 50,000 validation windows, and all 830,839 test windows. Within each development split, windows were sampled without replacement with outcome stratification; sampling was not performed at the patient or stay level, so long-stay contribution and key hashes were audited. Comparators were raw-13 and matched-39 GRUs; current-13 and summary-143 XGBoost; summary-143 LightGBM; and current-13 EBM and logistic regression. KG-TFNN and feature-matched GRU, XGBoost, and LightGBM each used 30 TPE trials and validation AUROC on common identifiers. Trees allowed 1,200 iterations with 50-round early stopping; GRU allowed eight epochs with pruning. Other comparators were prespecified, and architecture-specific computational budgets differed. Each external model retained its MIMIC-IV preprocessing, parameters, calibration, and thresholds; no comparator was refitted or recalibrated on eICU-CRD. Table 2 gives the complete internal benchmark, Supplementary Table S7 gives full settings, and KG-TFNN-full was not mixed with equal-sample comparisons.
3.7.2. Predictive, Reliability, and Operational Evaluation
Discrimination used AUROC/AUPRC; calibration used Brier score, log loss, 10-bin ECE, intercept, slope, and curves. Validation-only Platt probabilities supported operating points and DCA (0.01–0.20). Sensitivity, specificity, PPV, and NPV used validation-derived thresholds. For the MIMIC-IV event-level analysis, events were first evaluable SOFA increases per stay; a 6-hour refractory period suppressed repeats, and detection required an alert in . eICU-CRD operating-point transport was evaluated at the window level and by DCA; no external event-level alarm-burden claim was made. MIMIC-IV false-alert burden was
Equation 15 expresses false alerts per 100 pre-event patient-days.
3.7.3. Structural Inspectability Evaluation
KG-TFNN, LightGBM/XGBoost TreeSHAP, and current-state EBM explanations were aggregated to 13 variable groups for structural, not semantic or mathematical, comparison. The primary benchmark used three 1% Gaussian perturbations and adjacent-window continuity. Because adjacent 24-hour windows share 23 hours, sensitivity analyses used 1-, 3-, 6-, 12-, and non-overlapping 24-hour lags plus random cross-patient controls. Explanation similarity was compared with cosine similarity of both 24-by-39 inputs and 143 aligned current/summary features.
The stricter KG-TFNN-equal perturbation analysis used 20 independent repetitions at 1%, 5%, and 10% of the training standard deviation. Gaussian noise was added to the 13 continuous physiological channels after within-stay imputation; missingness indicators and time-since-measurement channels were held fixed, and all derived temporal summaries and fuzzy-risk representations were recomputed. For the signed 13-variable explanation vector , perturbation stability was
Stability used the mean, between-repeat SD, and t interval across ; continuity used patient-clustered bootstrap intervals. Near-one values retained six decimals.
For eligible within-stay pairs and independently sampled cross-patient pairs, temporal continuity and its negative control were
For sorted absolute contributions , explanation concentration was
Cross-dataset stability used global MIMIC-IV/eICU-CRD rank correlation and Top-5 Jaccard similarity. For Top-K summary sets across R seeds,
Raw rule activation used unnormalized product t-norm firing (primary threshold 0.10; sensitivity 0.01–0.50). Supplementary Tables S3a–S3c describe summaries that combined a fuzzy antecedent and learned descriptor after training; the conjunction was not a separate rule node. Candidate score and validation-locked rank were
Each prior-positive feature term was paired with its two strongest temporal terms; cross-feature antecedents used the strongest descriptor among their features. Membership thresholds were 0.50 (single) and 0.35 per cross antecedent. Prominence required 100 validation windows and used ; risk enrichment required 0.5% validation support and ranked by validation lift, , and support. Sets were locked before test coverage and lift; no test outcome influenced ranking. Coverage denotes activation, not explained logits or decisions. Complexity was mean antecedent count; Guideline-Direction Alignment used an investigator rubric. Native rules refer only to Eqs. 4–5. Supplementary Tables S3a–S3c give summary thresholds and provenance, while Table 4 reports the five-seed directional audit; neither constitutes clinician endorsement.
3.7.4. Statistical Analysis
Patient-clustered bootstrap intervals used 1,000 replicates for primary internal/equal-sample/missingness analyses and 500 for subgroup, sensitivity, and external analyses; paired differences shared draws. Hospital sensitivity resampled 205 sites 1,000 times; descriptive estimates required at least 100 patients and 50 positive/negative windows (142 sites). Empirical reflected 1,000-replicate resolution. Three-seed ablations used t intervals; directional-penalty stability used five matched seeds and ten pairs. Subgroups were exploratory without multiplicity adjustment.
4. Results
4.1. Application Cohort and Outcome Characteristics
Window-level deterioration prevalence was 5.66%, 5.81%, and 5.69% in MIMIC-IV training, validation, and test data and 4.75% in eICU-CRD. Demographic distributions were similar across MIMIC partitions, while eICU-CRD contained a larger proportion recorded as White and slightly more females (Table 1). Laboratory and oxygenation variables were frequently absent in any single hour, motivating explicit missingness and measurement-recency channels.
4.2. Predictive Discrimination, Calibration, and Frozen Transport
In the primary equal-sample MIMIC-IV comparison, KG-TFNN-equal achieved AUROC 0.6448 (patient-clustered 95% CI, 0.6379–0.6515) and AUPRC 0.1236 (0.1177–0.1297). After the matched 30-trial searches, feature-matched LightGBM achieved 0.6927 and 0.1736, and feature-matched XGBoost achieved 0.6885 and 0.1680 (Table 2). Relative to LightGBM, paired KG-TFNN-equal differences were AUROC (95% CI, to ) and AUPRC ( to ; both ). Feature-matched GRU also had higher AUROC and AUPRC, with paired differences of ( to ) and ( to ), respectively (both ).
Frozen equal-sample transport preserved the advantage of boosting but changed its ordering. On all eICU-CRD windows, AUROC and AUPRC were 0.6383 and 0.1025 for feature-matched LightGBM, 0.6246 and 0.0967 for feature-matched XGBoost, and 0.6100 and 0.0862 for KG-TFNN-equal. Corresponding values were 0.6000 and 0.0675 for feature-matched GRU and 0.5869 and 0.0695 for current-state EBM. In the 1,000-replicate hospital-clustered sensitivity, LightGBM minus KG-TFNN-equal was 0.0283 AUROC (95% CI, 0.0216–0.0356). The separately trained KG-TFNN-full achieved AUROC/AUPRC values of 0.6559/0.1309 internally and 0.6221/0.0922 externally.

Table 2.
Complete internal benchmark and frozen external performance under equal-sample and full-cohort protocols.
Table 2.
Complete internal benchmark and frozen external performance under equal-sample and full-cohort protocols.
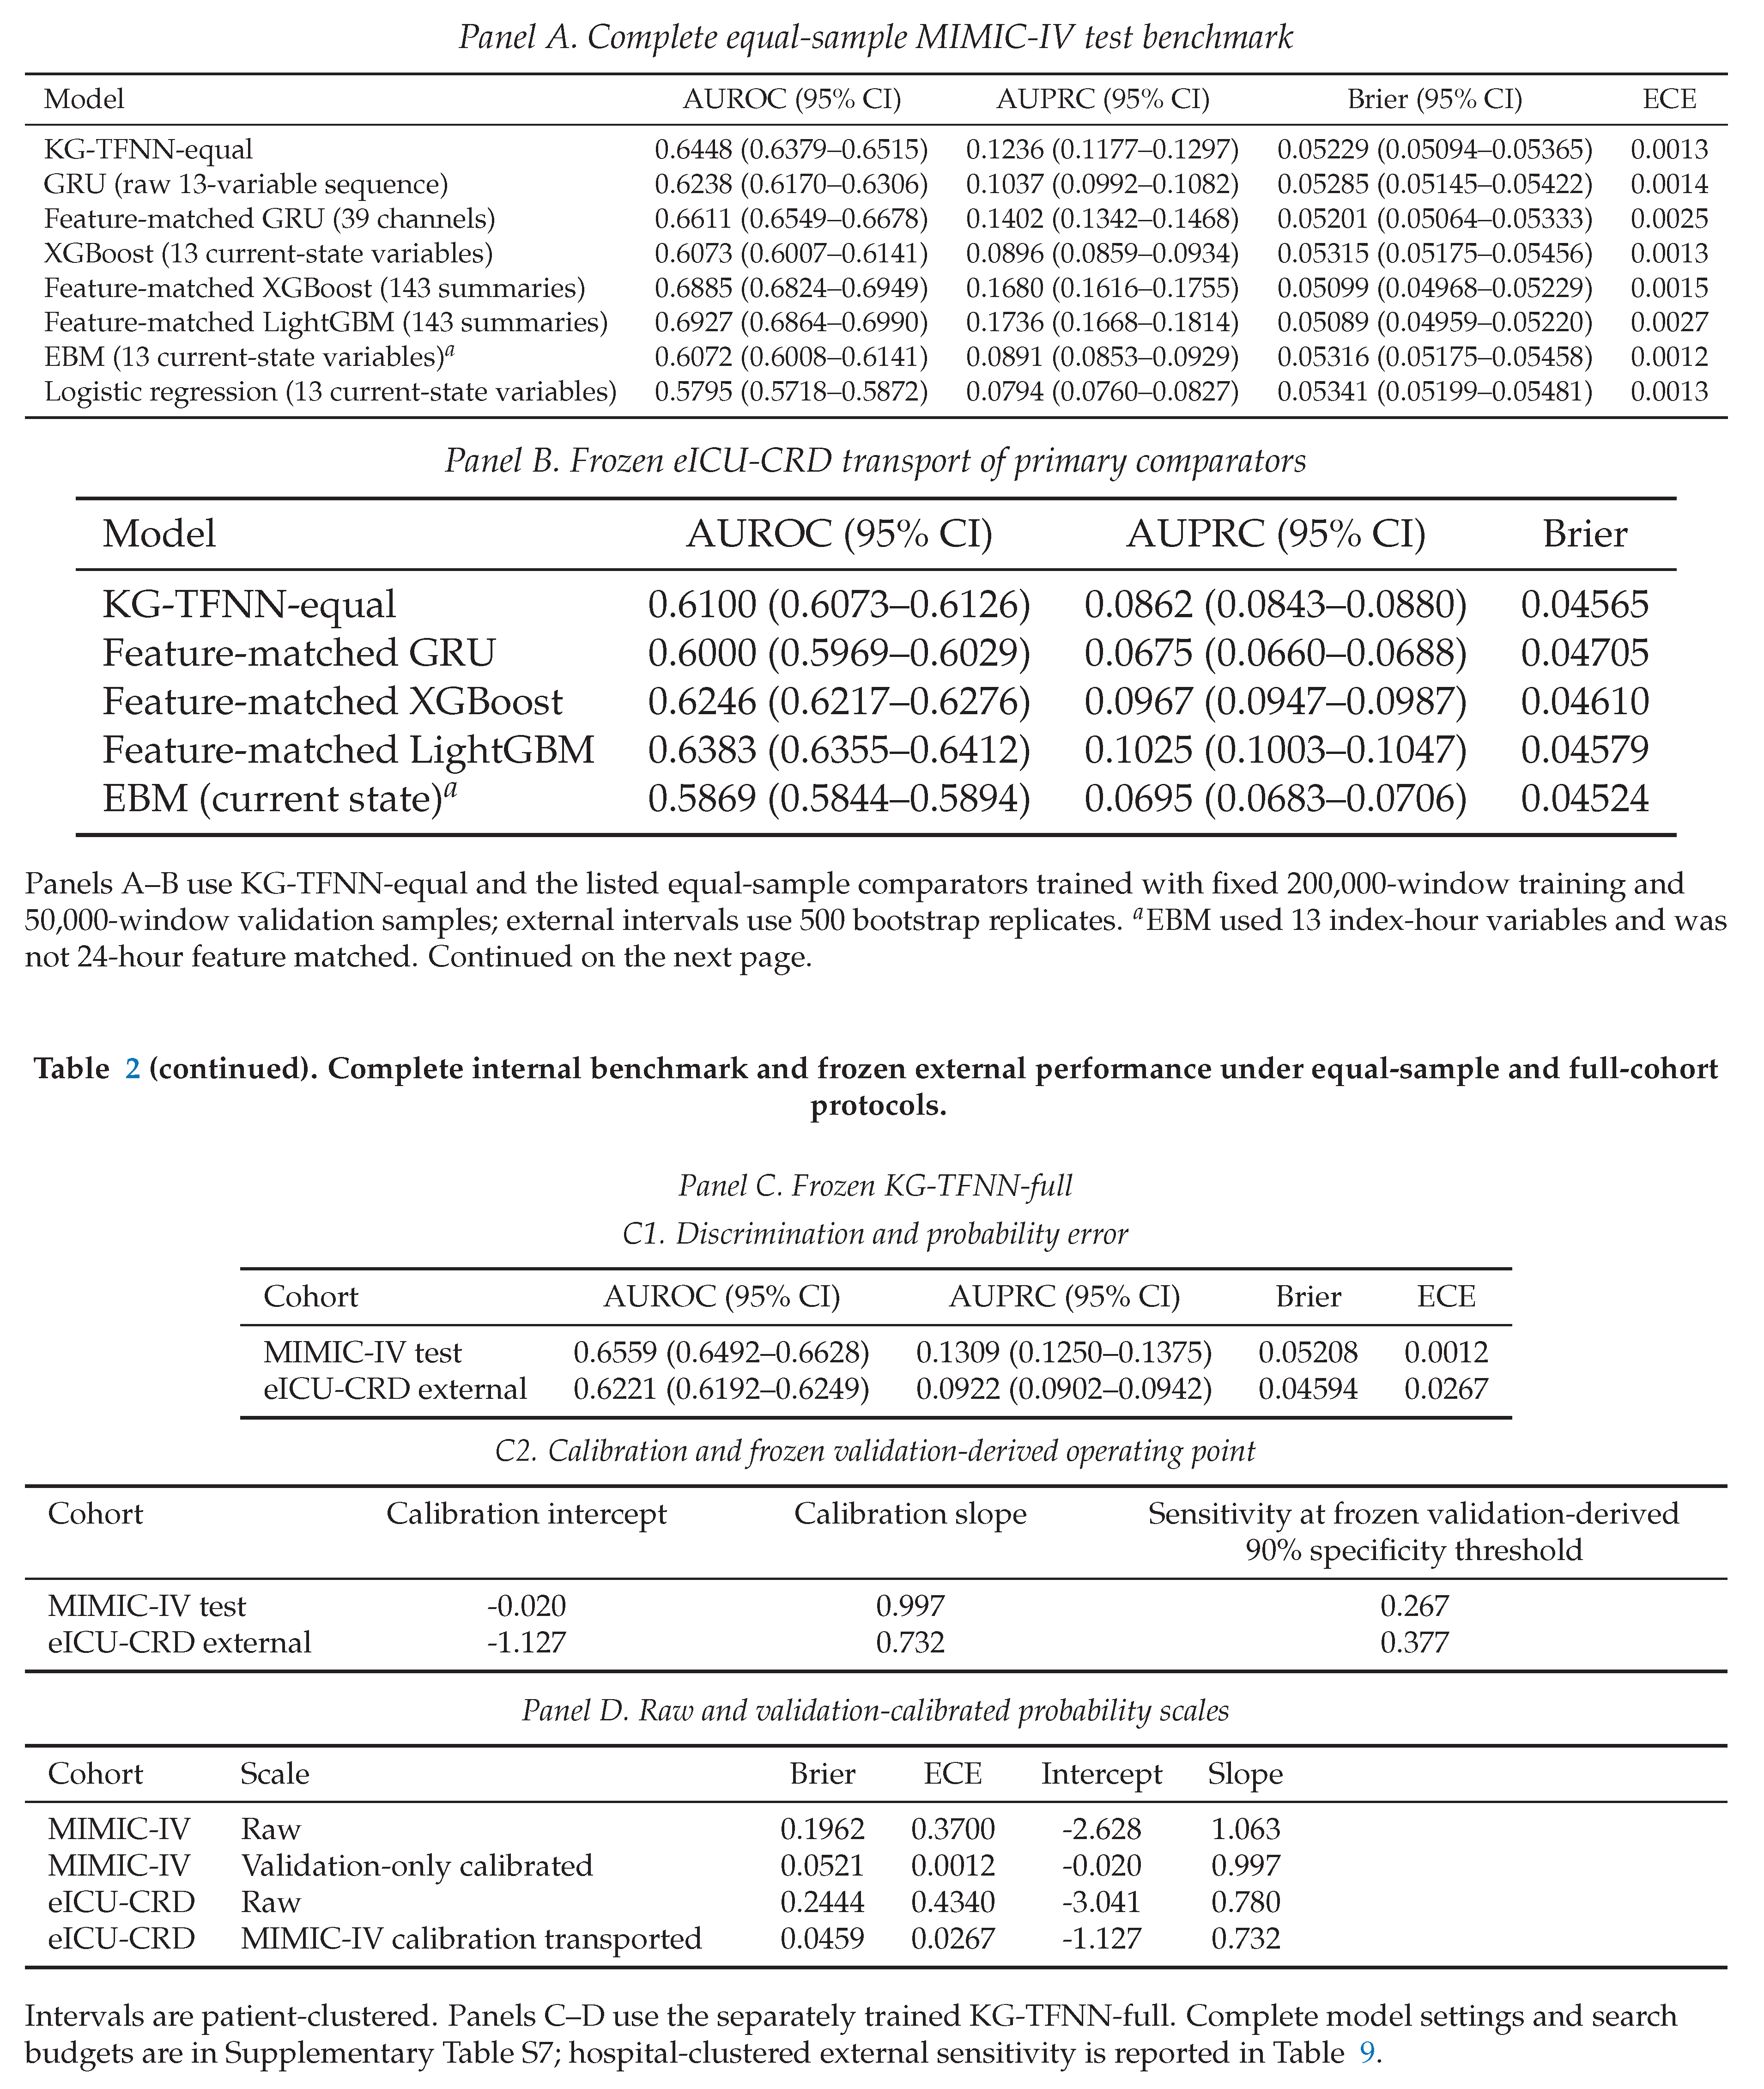
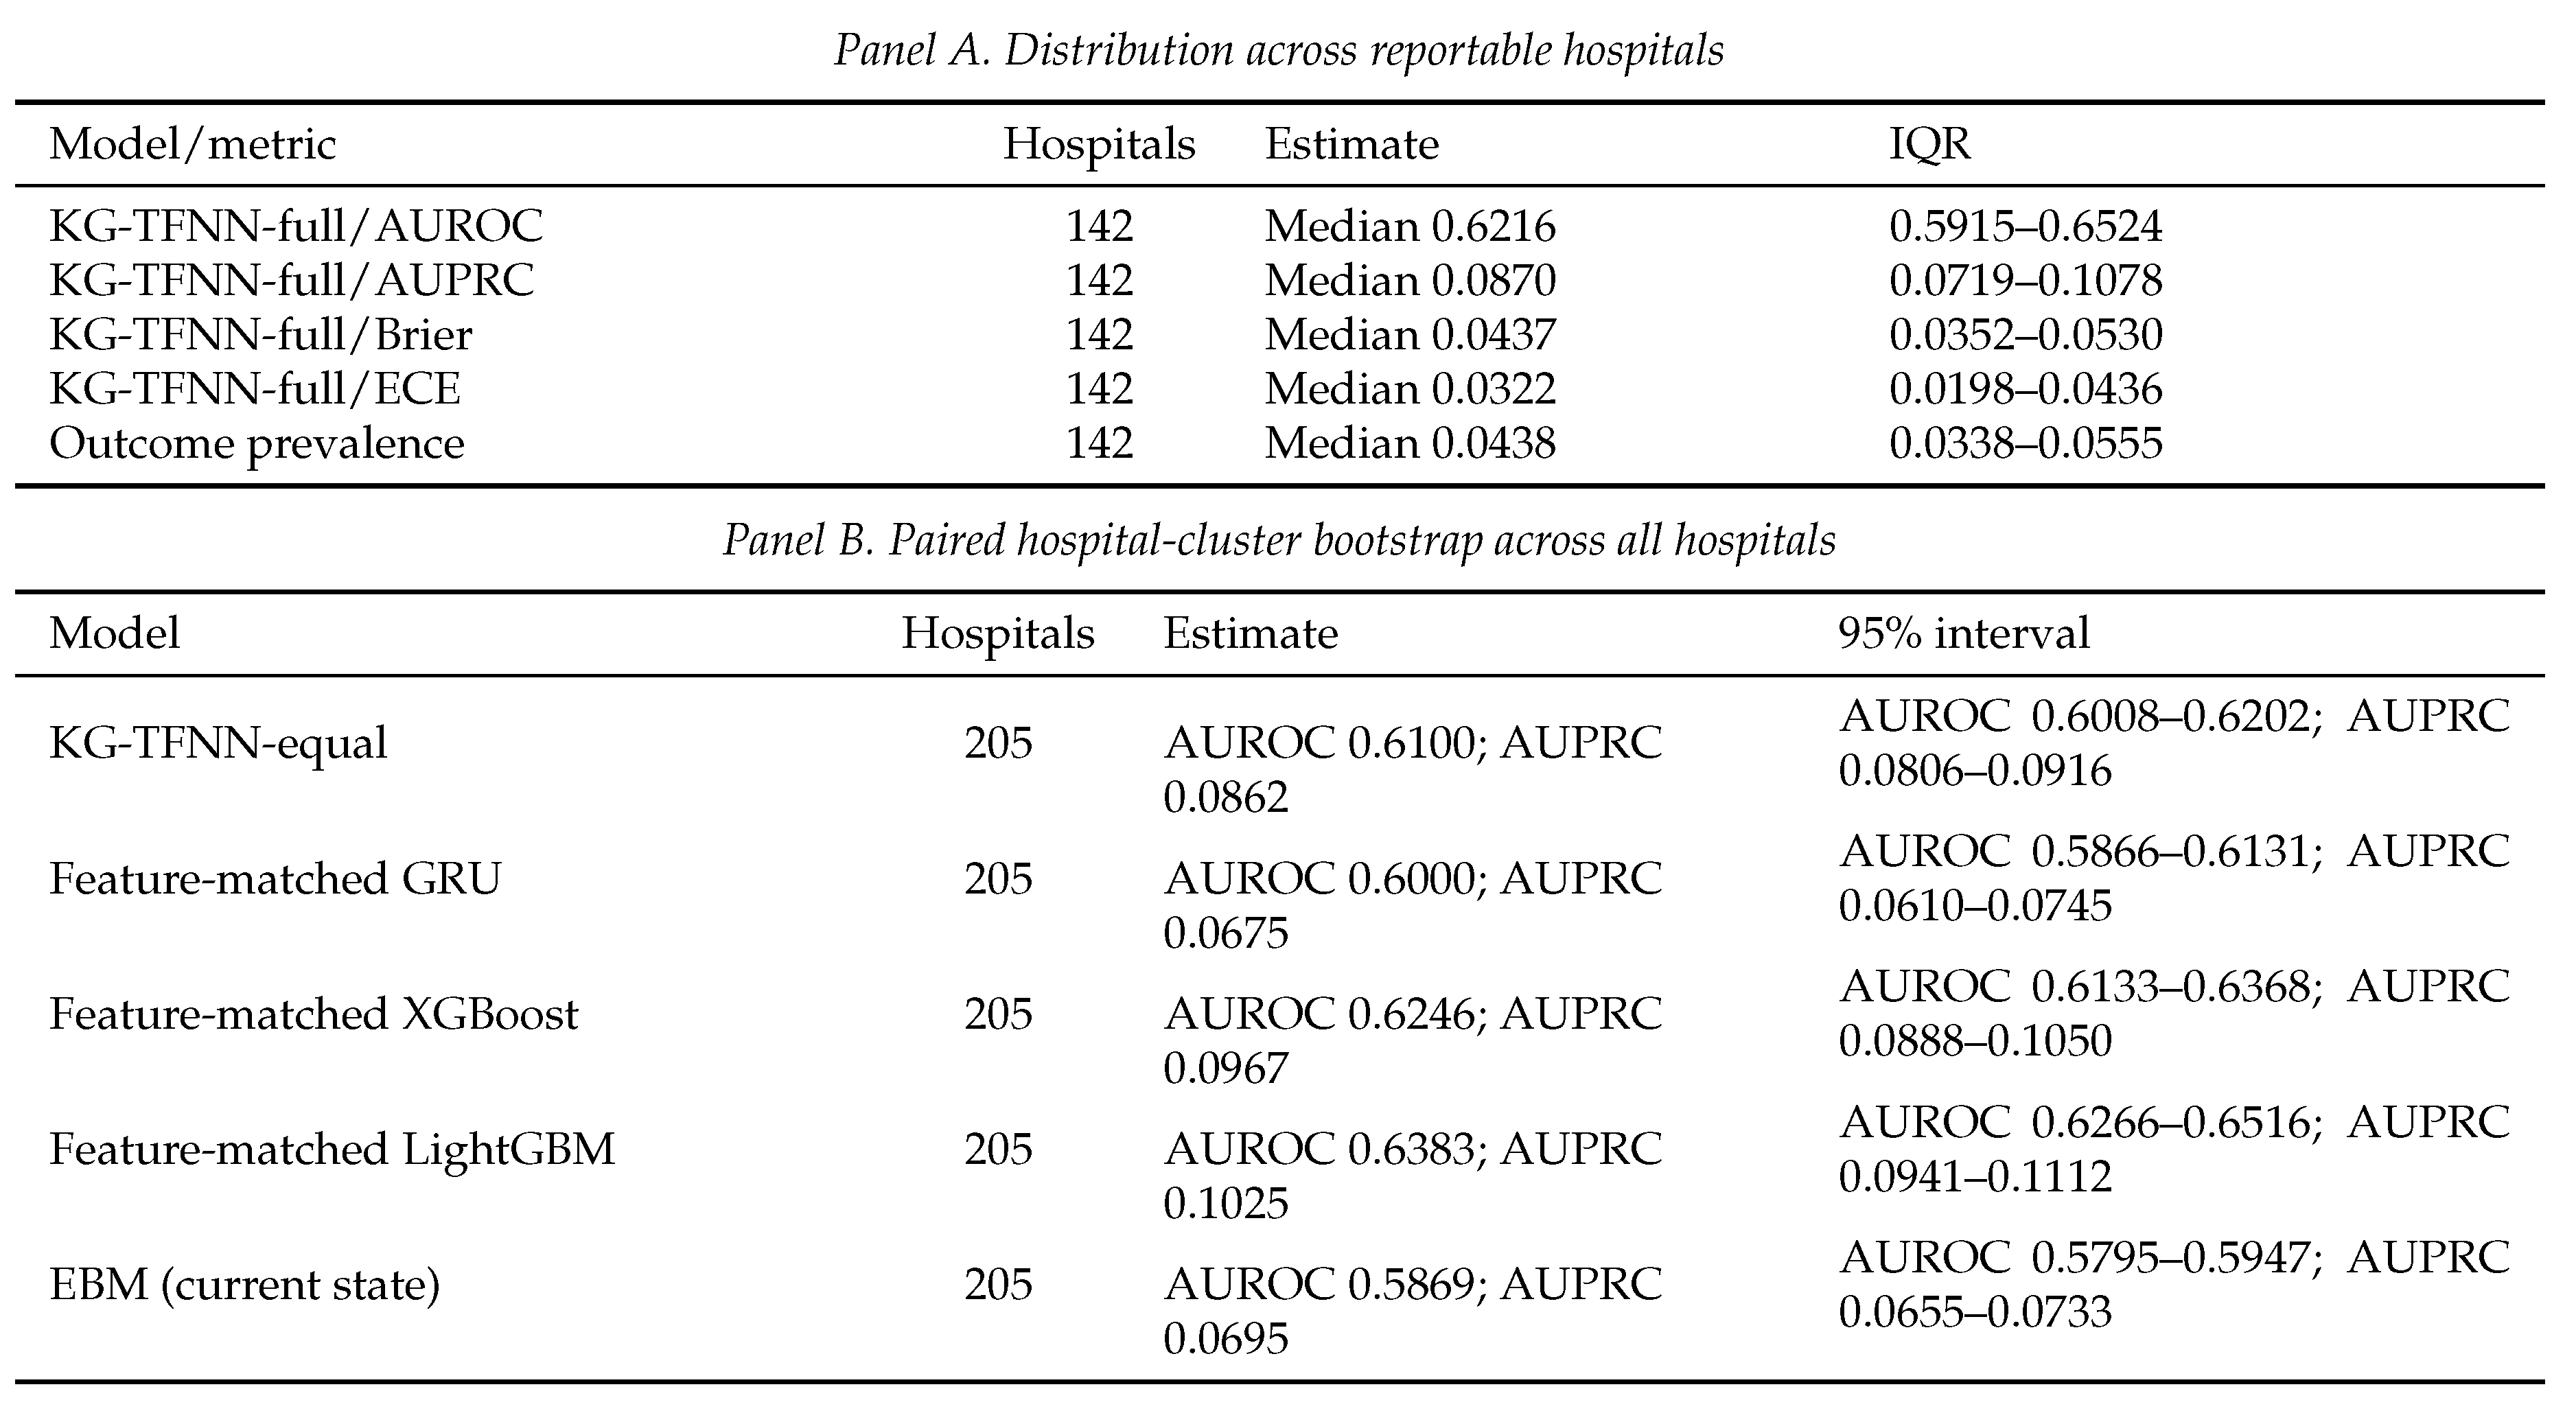
Validation-only calibration produced near-ideal internal intercept and slope, but transported calibration overpredicted eICU-CRD risk (intercept , slope 0.732). Hospital-clustered resampling gave an external AUROC 95% interval of 0.6127–0.6326; among 142 reportable hospitals, median AUROC was 0.6216 (IQR, 0.5915–0.6524; range, 0.4919–0.7657). These results separate frozen discrimination from probability and site-level transportability; decision-analytic and event-level consequences are reported in Section 4.5.
4.3. Fuzzy-System Contributions of Knowledge Guidance and Temporal Representation
The fuzzy-specific ablations used two controlled contrasts rather than a single cumulative ladder. The full architecture and its randomly initialized FNN counterpart differed in semantic initialization and showed an AUROC difference of 0.0061 (three-seed 95% t interval, 0.0026–0.0096). The temporal architecture and guideline-guided static FNN differed by explicit temporal augmentation and showed the larger difference of 0.0510 (0.0457–0.0563). Thus, temporal fuzzy-risk representation contributed more strongly to discrimination than initialization alone within these controlled contrasts, while knowledge guidance supplied an interpretable reference state for subsequent membership-drift analysis. In KG-TFNN-full, the median center movement was 0.264 initial widths (mean, 1.421); Figure 3 shows both modest and substantial center/width adaptation among six representative variables. In the three-seed component ablation, the auxiliary fuzzy-risk directional penalty did not improve AUROC or AUPRC (Table 4). The expanded five-seed analysis yielded Top-10 summary-set Jaccard similarity of 0.663370 without and 0.719814 with the penalty. Other directional, drift, and prior-risk measures changed minimally, indicating a limited cross-seed stability signal rather than broad predictive or directional improvement (Table 6 and Supplementary Figure S3).
Removing missingness channels reduced ensemble AUROC/AUPRC from 0.6475/0.1244 to 0.6042/0.0879; missingness alone achieved 0.5954/0.0904. Missingness carried workflow-associated signal but did not replace physiology.
4.4. Structural Inspectability, Robustness, and Summary Coverage
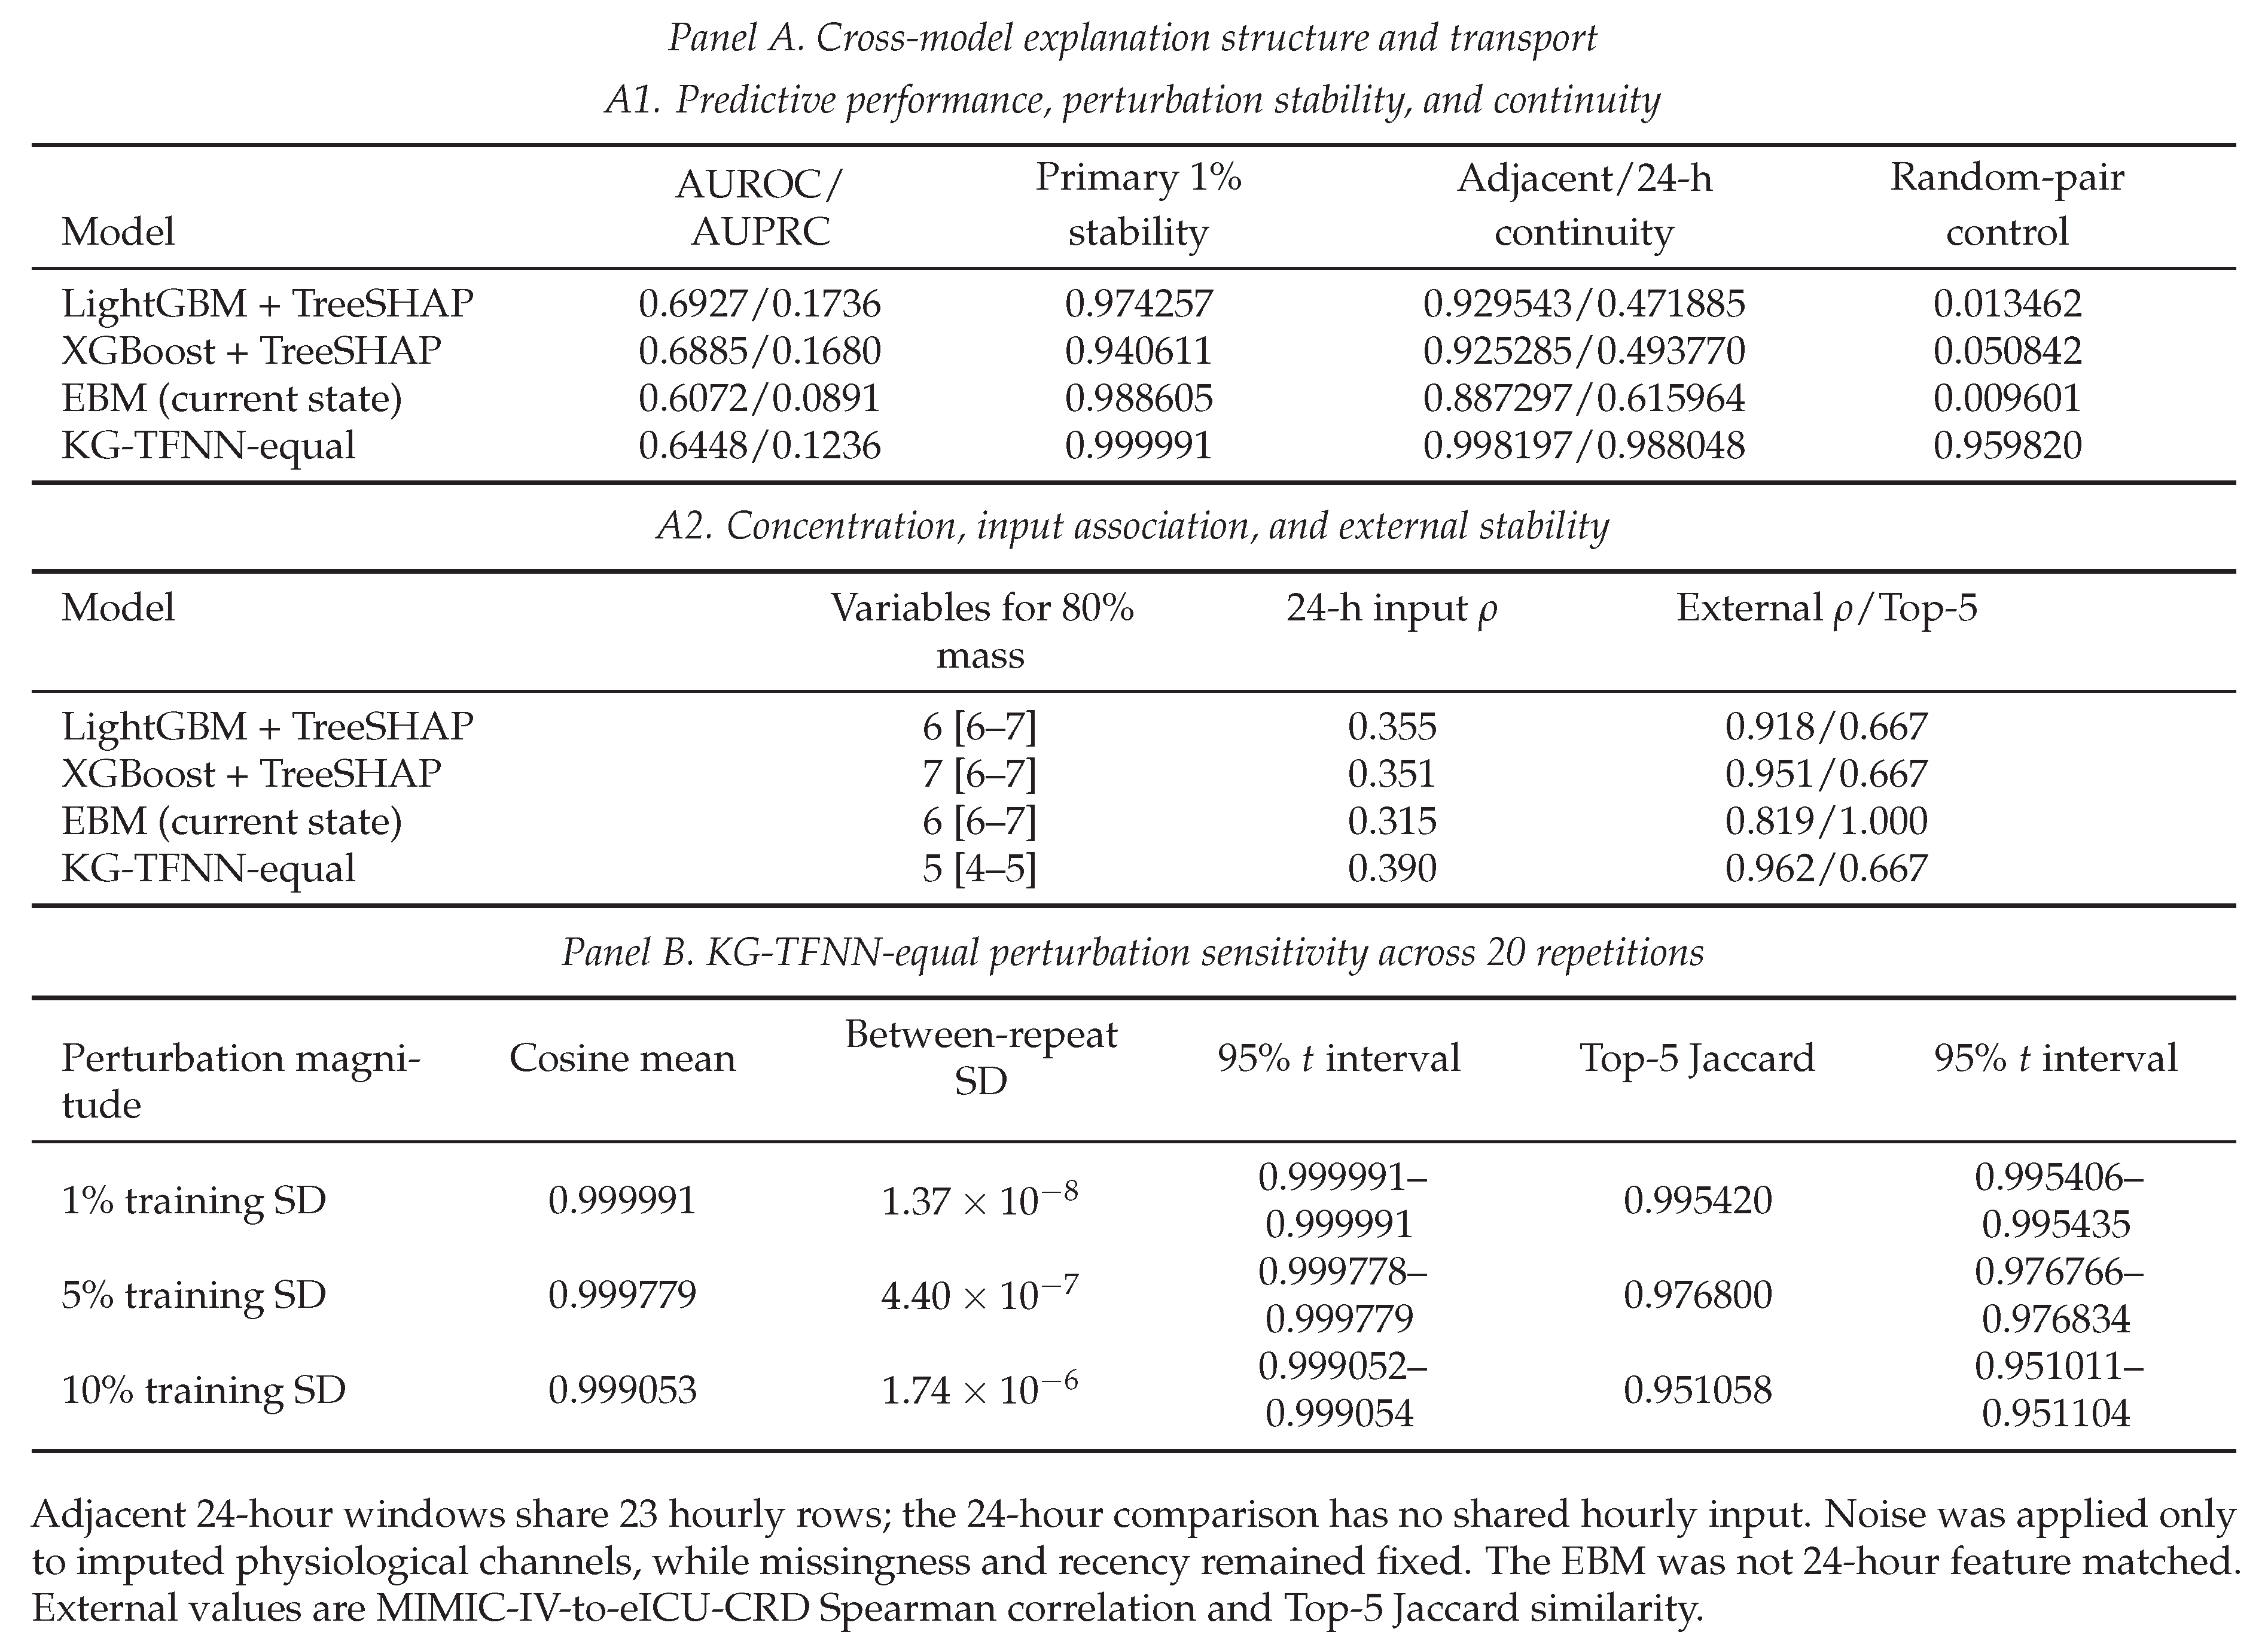
In the original structural benchmark, KG-TFNN-equal perturbation stability was 0.999991 rather than an absolute 1.000, adjacent-window continuity was 0.998197, and a median of five variables accounted for 80% attribution mass. LightGBM had 0.974, 0.930, and six variables, respectively, with higher discrimination. KG-TFNN-equal had a slightly higher cross-dataset global rank correlation than XGBoost (0.962 vs 0.951), whereas EBM had the highest Top-5 cross-dataset Jaccard similarity (1.000). Table 3 Panel B distinguishes these predictive and explanation objectives directly.
Continuity decreased monotonically as KG-TFNN-equal window separation increased: 0.996964 at 3 hours, 0.995577 at 6 hours, 0.993107 at 12 hours, and 0.988048 (patient-clustered 95% CI, 0.987823–0.988267) for non-overlapping 24-hour windows. However, randomly paired cross-patient windows still had similarity 0.959820 (0.959553–0.960070). Thus, substantial overlap did not fully explain the high absolute continuity, but the negative control showed that KG-TFNN-equal explanations also shared a strong global direction. Absolute cosine continuity should therefore be interpreted as structural smoothness rather than proof of patient-specific temporal responsiveness. Spearman correlation between aligned temporal-summary input similarity and explanation similarity was 0.390 for non-overlapping pairs and 0.363 for random pairs, indicating that input similarity was associated with, but did not fully determine, explanation similarity. Across 20 repetitions, perturbation cosine was 0.999991, 0.999779, and 0.999053 at 1%, 5%, and 10% training standard deviation; corresponding Top-5 Jaccard similarities were 0.995420, 0.976800, and 0.951058. At 10%, the between-repeat cosine SD was 0.00000174 and its 95% t interval was 0.999052–0.999054, showing measurable rank-set changes despite a very smooth contribution vector (Figure 4 and Table 5).
Table 3.
Component and missingness ablations with structural comparison of predictive and explanation properties.
Table 3.
Component and missingness ablations with structural comparison of predictive and explanation properties.
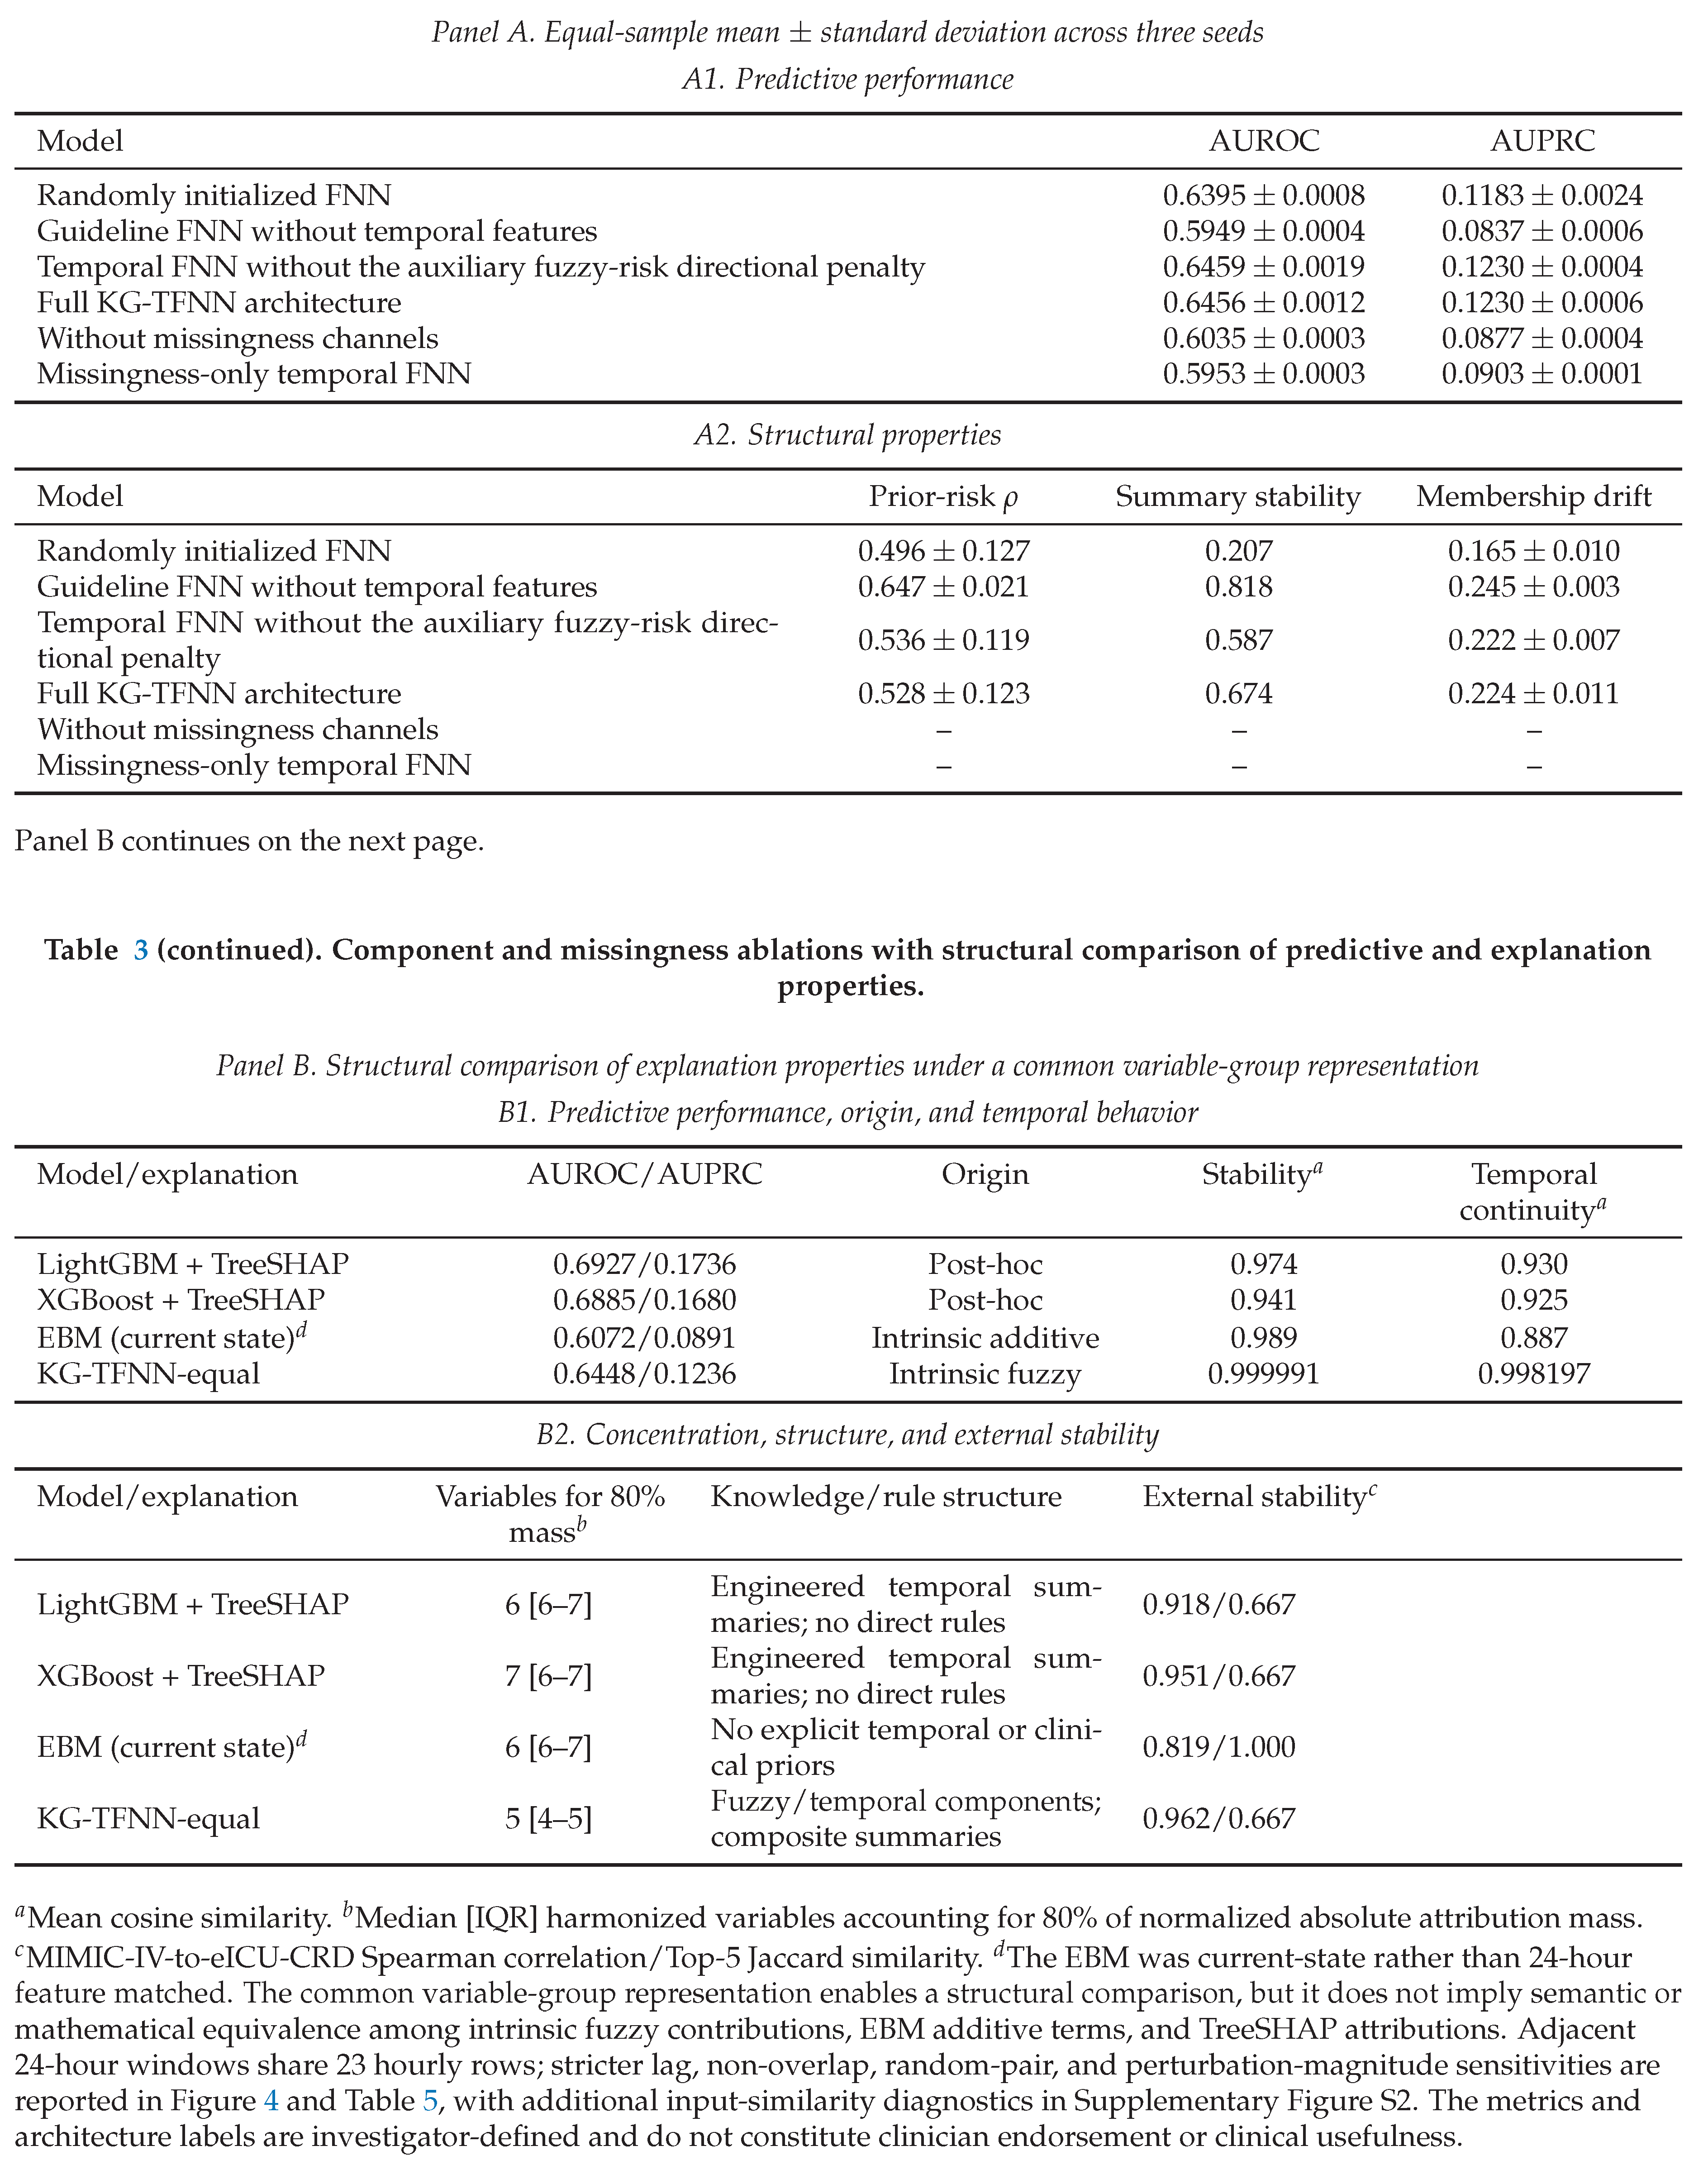
Table 4.
Full-test-cohort audit of the auxiliary fuzzy-risk directional penalty across five matched seeds. Top-10 composite-summary stability is the mean and pairwise standard deviation over 10 Jaccard comparisons; the pairs share seeds and are not independent replicates.
Table 4.
Full-test-cohort audit of the auxiliary fuzzy-risk directional penalty across five matched seeds. Top-10 composite-summary stability is the mean and pairwise standard deviation over 10 Jaccard comparisons; the pairs share seeds and are not independent replicates.
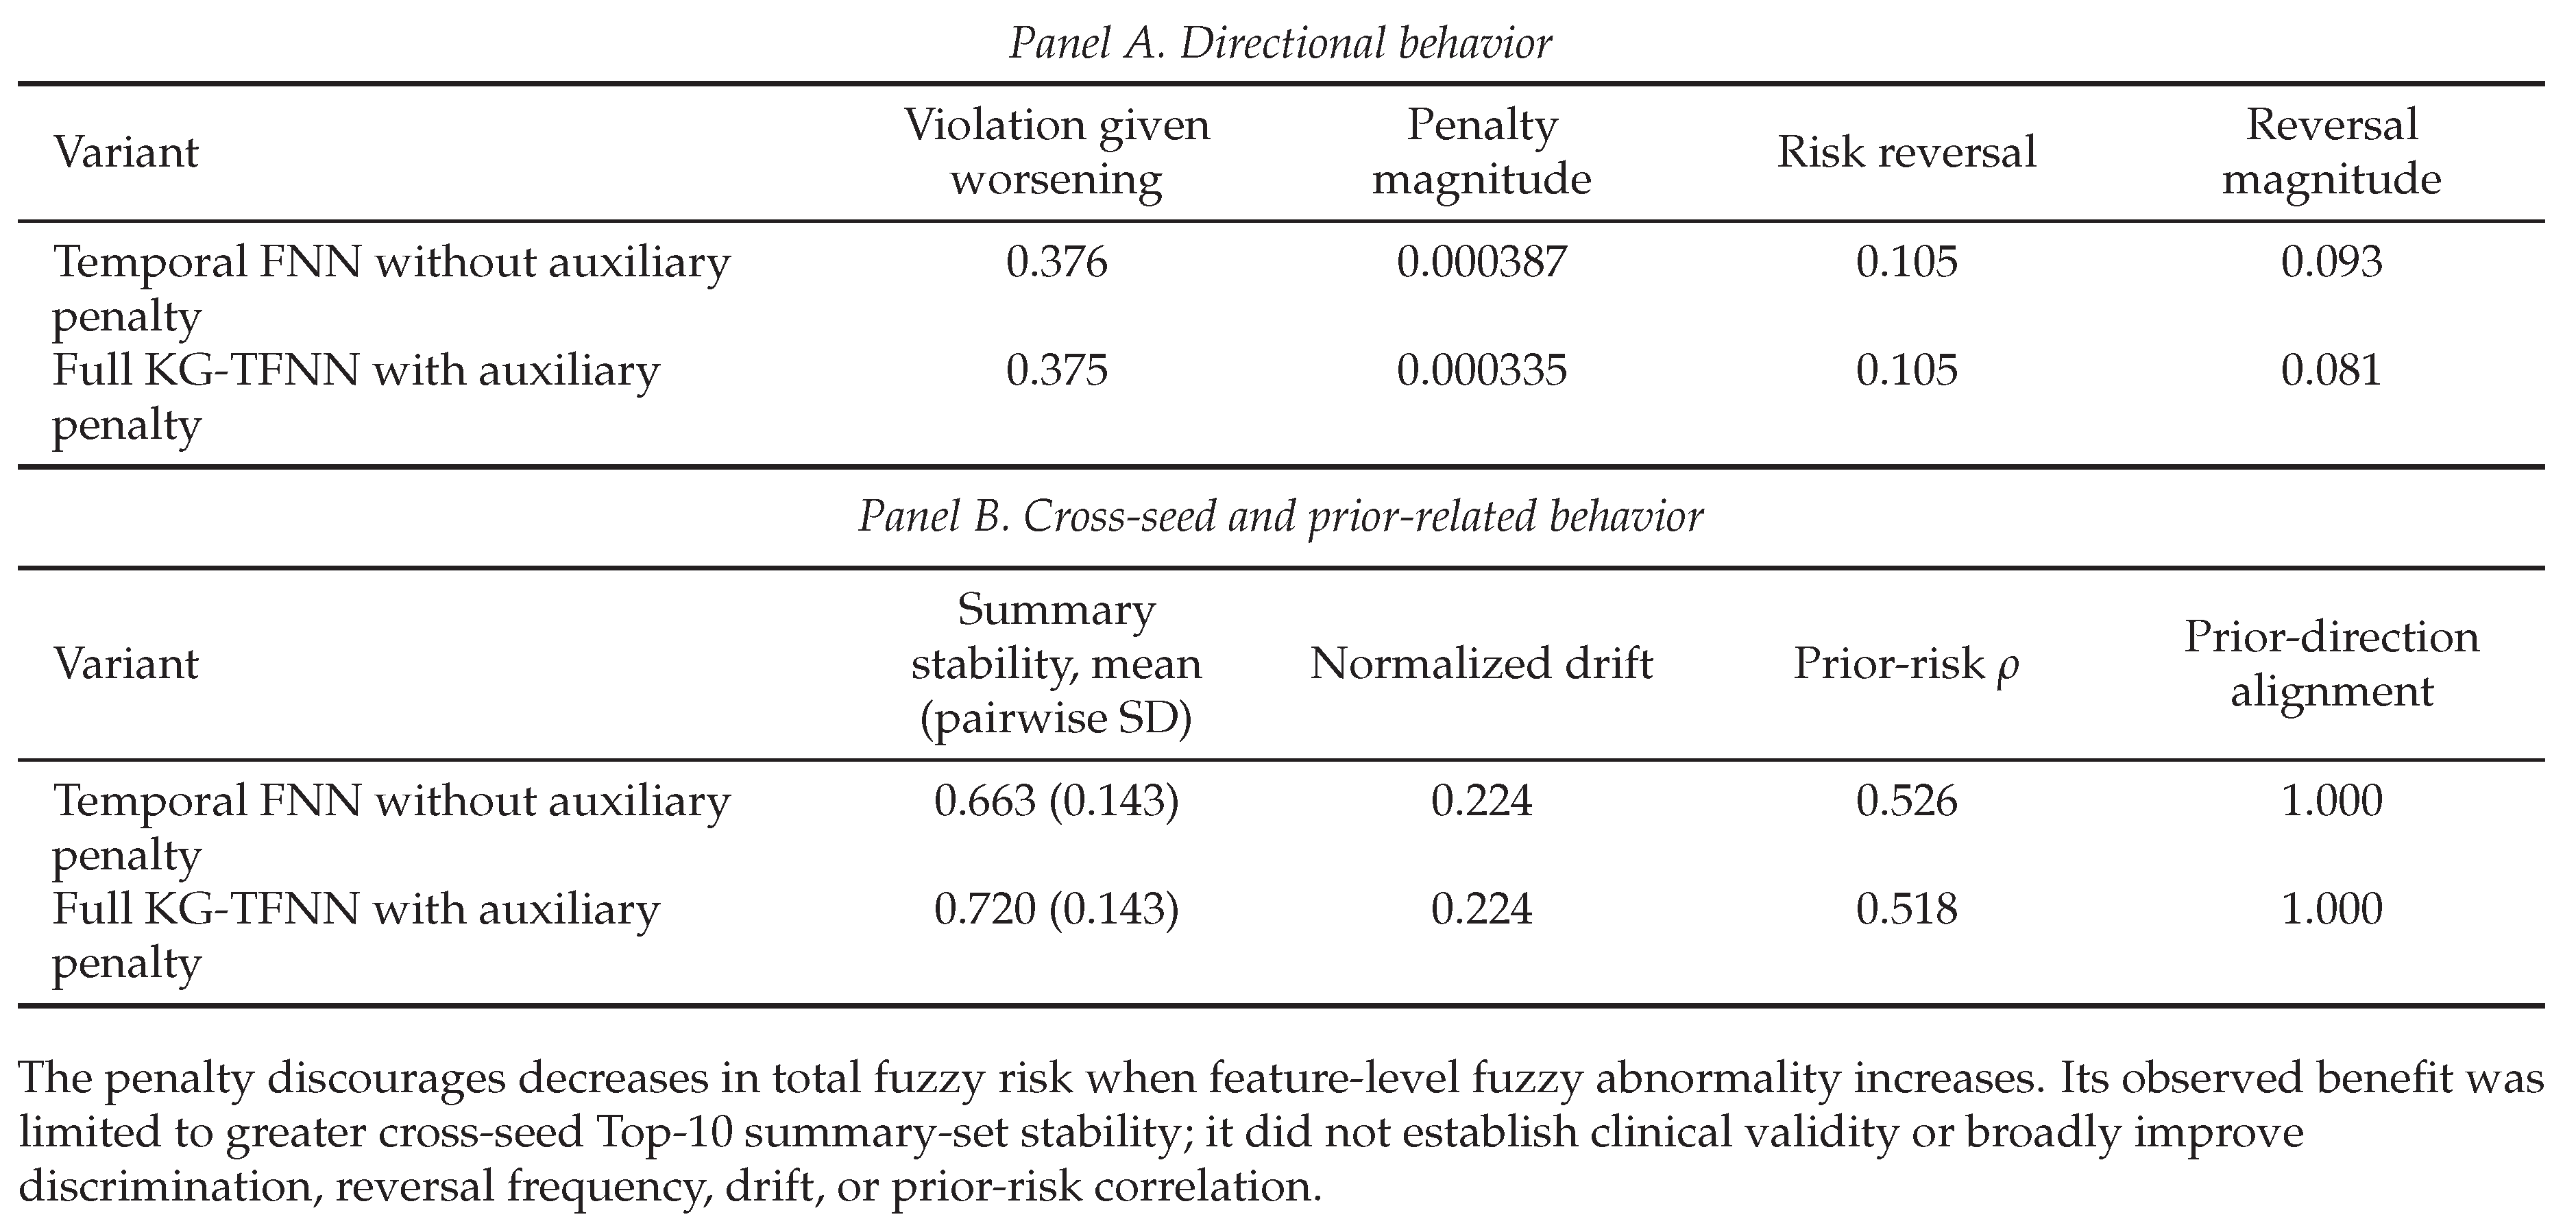
Table 5.
Detailed structural explanation audit under the common 13-variable representation. Common grouping supports comparison but does not imply semantic or mathematical equivalence among fuzzy contributions, EBM additive terms, and TreeSHAP attributions.
Table 5.
Detailed structural explanation audit under the common 13-variable representation. Common grouping supports comparison but does not imply semantic or mathematical equivalence among fuzzy contributions, EBM additive terms, and TreeSHAP attributions.
4.5. Outcome-Definition Sensitivity and Operational Implications
The prediction horizon remained fixed at 6 hours. Across 4-, 6-, 12-, and 24-hour lookbacks, the explicit 24-hour model performed best (AUROC/AUPRC, 0.6331/0.1060), whereas the 24-hour sequence-only model achieved 0.5780/0.0748 (Table 6). Assuming missing components were normal produced similar discrimination, whereas the six-component complete-case subset decreased to 176,130 windows and 0.6237/0.0923. Common-component and stable-mask definitions yielded AUROC 0.6013–0.6097 (Table 7). Of 47,292 primary positive windows, 39.0% gained a newly observed component at the future maximum and 67.1% remained positive under pairwise-common-component scoring, confirming documentation sensitivity. Supplementary Tables S4–S5 provide confidence intervals, Brier scores, and the complete sensitivity protocols.
At the MIMIC-IV-derived 90% threshold, internal specificity was 0.901, sensitivity 0.267, and PPV 0.139. External window-level values were 0.790, 0.377, and 0.082, respectively; specificity therefore did not transport. DCA was positive internally over the displayed range but diminished externally at higher thresholds (Figure 2). At 90% specificity, 1,274 of 3,710 evaluable MIMIC-IV events were detected (34.3%), with 48.23 false alerts per 100 pre-event patient-days and median lead time 3 hours. At 95%, 883 events were detected (23.8%), with 24.30 false alerts per 100 days and median lead time 2 hours (Table 8).
Two validation-locked KG-TFNN-full summary sets are reported in Supplementary Tables S3a–S3c and visualized in Figure 5. The prominent high-support set covered 68.36% of test windows, 74.79% of positive windows, 77.51% of patients, and 70.84% of first events. This breadth was driven largely by the FiO2 summary, which alone activated 63.77% of windows with lift 1.10. The validation risk-enriched set used a 0.5% minimum-support requirement and covered 6.20% of test windows, 9.86% of positive windows, 58.39% of patients, and 23.37% of first events. Test outcomes did not influence either locked set.
Under the separate five-seed equal-sample analysis, Top-10 composite summaries averaged 1.44 antecedents and pairwise Jaccard stability was 0.720. For KG-TFNN-full, Guideline-Direction Alignment was 1.000 under the investigator rubric. At raw-firing threshold 0.10, negative and positive windows activated means of 0.529 and 0.569 native current-hour cross-feature fuzzy rules; 44.8% and 47.1% activated at least one. Coverage indicates condition activation, not logit, decision, alarm, or error completeness. The summaries are representative inspectable patterns, not an exhaustive decomposition. Figure 6 illustrates how native firing, temporal contributions, and a post-training composite summary differ for one case selected by a prespecified deterministic protocol.
External performance varied across institutions and patient strata (Figure 7). Among the 142 reportable eICU hospitals, KG-TFNN-full median AUROC was 0.6216 (IQR, 0.5915–0.6524), median AUPRC was 0.0870 (0.0719–0.1078), and median ECE was 0.0322 (0.0198–0.0436). Hospital-clustered estimates across all 205 sites retained the external ordering of the primary comparators, with LightGBM achieving AUROC/AUPRC 0.6383/0.1025 and KG-TFNN-equal 0.6100/0.0862 (Table 9). These analyses quantify site dependence rather than establish deployment readiness.
5. Discussion
5.1. Knowledge-Guided Temporal Fuzzy Learning Architecture
KG-TFNN was developed as a systems-level temporal fuzzy architecture for constructing and auditing knowledge-anchored prediction paths. The SOFA case study provided a controlled empirical test of whether domain-informed states could remain trainable, temporal behavior could remain explicit, and intermediate fuzzy components could be evaluated alongside predictive and reliability outcomes. The evidence supports architectural integration and auditability as the contribution; it does not support a new primitive operator or superior ICU alarming.
This positioning also distinguishes KG-TFNN from the representative systems reviewed in Section 2. ANFIS and static expert systems establish adaptive Sugeno inference and inspectable rule organization but do not provide the same explicit longitudinal descriptor path [6,7]. Recurrent and evolving fuzzy systems model sequential or streaming adaptation, whereas KG-TFNN keeps feature-level temporal summaries and measurement-process descriptors as separately named prediction-path quantities [13,14,15]. Temporal type-2 systems address time-dependent uncertainty through a different fuzzy representation [16]. These are design distinctions, not evidence of comparative superiority across their heterogeneous datasets and tasks; the controlled evidence in this study is limited to the implemented random-initialization, static-guideline, temporal, and full-architecture contrasts.
Fuzzy memberships convert continuous values into smooth, overlapping, named states. Unlike hard bins, they preserve gradual transitions; unlike latent features, their centers, widths, directions, and drift are auditable. Term names denote initialization anchors rather than clinician-validated post-training categories, so trained states must be interpreted together with their parameter-drift audit. The small initialization gain indicates that knowledge guidance provides semantic anchoring, not the main accuracy mechanism, and prior consistency is not evidence of clinical correctness.
The directional penalty did not improve discrimination, risk reversals, drift, or prior-risk correlation; its observed benefit was limited to cross-seed Top-10 composite-summary stability. It is therefore an auxiliary structural regularizer, not a clinical-validity constraint. Guideline-Direction Alignment likewise reflects an investigator rubric, not clinician endorsement.
5.2. Implications for Temporal Fuzzy-System Design
The findings suggest three design implications. First, semantic initialization alone did not guarantee predictive advantage; in the controlled contrasts, explicit temporal representation contributed more strongly. Second, knowledge-guided initialization remained useful because it established an interpretable reference state against which learned membership movement could be audited. Third, fuzzy transparency should not be inferred solely from linguistic memberships or rules: structural claims require empirical analysis of parameter drift, rule activation, explanation stability, and temporal continuity.
Attention estimates when hourly risk matters, whereas feature descriptors identify how risk evolves through level, variability, slope, change, persistence, and frequency. Attention alone cannot distinguish sustained abnormalities from abrupt or feature-specific trends. The explicit branch therefore complements temporal weighting with named, feature-level temporal structure.
Missingness and recency characterize monitoring rather than physiology. They improved prediction but may reflect severity, attention, workflow, and resources. Separate channels make this dependency auditable without implying that it is physiological or transportable.
5.3. Intrinsic Inspectability and Post-Hoc Attribution
Latent deep sequence models address temporal complexity through learned hidden states that can encode richer interactions but do not carry prespecified clinical semantics. KG-TFNN instead keeps fuzzy centers and widths, feature-level temporal descriptors, and attention-weighted risk as named objects on the prediction path. This design favors semantic traceability and parameter auditing over unrestricted latent representation; it does not establish that lower flexibility necessarily causes lower discrimination or that exposed components are clinically valid.
For discrimination alone, the results support LightGBM or XGBoost. TreeSHAP provides post-hoc signed attributions, EBM provides native additive terms, and KG-TFNN exposes prediction-path memberships, feature risks, cross-feature firing, attention, and descriptors. These explanation forms have different mathematical roles.
KG-TFNN’s benefit is traceability and parameter auditing, not universally better or clinically correct explanations. Composite summaries combine trained components after fitting and are not native rule nodes. Common-group metrics do not make fuzzy, EBM, and TreeSHAP contributions equivalent. High non-overlapping continuity with high random-pair similarity indicates global smoothness, not patient-specific responsiveness. Thus boosting favors discrimination, whereas KG-TFNN favors inspectable temporal structure.
5.4. Transportability as Part of Methodology Evaluation
Frozen transport tested cross-database reliability, not deployment readiness. eICU-CRD discrimination remained measurable, but calibration and specificity thresholds failed to transport, site performance varied, and alarm sensitivity was limited. Knowledge guidance did not remove domain shift, and inspectability cannot replace local calibration or prospective workflow evaluation.
Monitoring patterns differ across institutions, and reconstructed SOFA was documentation-sensitive: 39% of positive windows gained a future component, while common-component definitions reduced prevalence and discrimination. The task may therefore capture intensified documentation alongside physiology, showing why outcome construction must be audited with performance.
5.5. Reusability Across Longitudinal Decision Problems
The design pattern may extend to sepsis, acute kidney injury, treatment response, chronic trajectories, or remote monitoring. Reusable elements are knowledge-anchored states, explicit temporal characterization, and prediction-path auditing; priors, interactions, endpoints, and calibration remain task specific. Present memberships, rules, and thresholds should not be reused directly.
5.6. Limitations and Future Work
Limitations include retrospective US databases, reconstructed rather than adjudicated SOFA, uncorrected sedated/intubated GCS, operational respiratory harmonization, and incomplete eICU-CRD vasopressor conversion. EBM was current-state rather than 24-hour feature matched. The randomly initialized FNN provides a controlled fuzzy comparator for isolating knowledge-guided initialization and temporal augmentation, but no independently optimized ANFIS, recurrent fuzzy, evolving fuzzy, or type-2 temporal comparator was available. The evaluation therefore does not establish superiority over broader fuzzy-system families. Although non-overlapping, random-pair, and input-similarity sensitivities addressed overlapping windows, explanation metrics remain structural rather than clinician-reader outcomes, and high random-pair similarity limits patient-specific interpretation. Guideline alignment was investigator-defined without blinded clinical review. Subgroups were exploratory, DCA lacked a prespecified cost ratio, and external validation prohibited recalibration.
Future work should test prospective, treatment-aware applications and blinded multidisciplinary assessment. Reader studies should measure interpretation time, agreement, error detection, and decisions. Methodological extensions should compare broader neuro-fuzzy and type-2 temporal systems while seeking stronger prediction without sacrificing auditability.
6. Conclusions
This study investigated how domain knowledge, temporal dynamics, and structural interpretability can be integrated and empirically evaluated within longitudinal machine learning. We developed KG-TFNN as a knowledge-guided temporal fuzzy architecture in which clinically anchored but trainable fuzzy states, explicit temporal fuzzy-risk and observation-process descriptors, native fuzzy inference, and temporal attention remain accessible along the prediction pathway rather than being represented solely through latent states or reconstructed through post-hoc explanations. Evaluation on SOFA-defined clinical deterioration provided several methodological findings. Controlled ablations showed that explicit temporal representation contributed substantially more to discrimination than knowledge-guided initialization alone, indicating that preserving interpretable temporal evolution may be more consequential than semantic initialization by itself. At the same time, KG-TFNN did not outperform carefully tuned gradient boosting in discrimination, demonstrating that structural auditability should not be conflated with predictive superiority. Its principal contribution was instead the ability to directly examine membership evolution, native-rule firing, temporal contributions, parameter drift, and explanation behavior within the learned prediction process.
The fully frozen transport from patient-disjoint MIMIC-IV development to the multicenter eICU-CRD cohort further showed that interpretability and knowledge guidance do not eliminate dataset shift. Although meaningful discrimination was retained, changes in calibration, operating characteristics, and site-level behavior emphasized the need to evaluate reliability separately from model transparency. These results therefore argue for a broader view of interpretable machine learning in which prediction, semantic fidelity, temporal behavior, structural auditability, and transportability are evaluated as distinct but interacting properties.
Overall, KG-TFNN should not be interpreted as a deployment-ready clinical alarm or as a universally superior fuzzy predictor. Rather, it provides a rigorously evaluated design framework for examining the trade-offs that arise when semantic knowledge and temporal inspectability are incorporated into adaptive longitudinal prediction. The underlying principles—knowledge-anchored adaptive representations, explicit temporal characterization, prediction-path auditing, and frozen external evaluation—may be transferable to other longitudinal decision problems in healthcare and beyond. Future work should examine these principles prospectively, compare them with broader neuro-fuzzy and temporal fuzzy families, and determine whether stronger predictive performance can be achieved without sacrificing structural auditability.
Supplementary Materials
The following supporting information can be downloaded at the website of this paper posted on Preprints.org
Author Contributions
Yan-Wei Li: Conceptualization, Data curation, Formal analysis, Investigation, Methodology, Software, Validation, Visualization, Writing - original draft. David Chunhu Li: Conceptualization, Funding acquisition, Methodology, Project administration, Supervision, Writing - review & editing.
Funding
This research was funded by the National Science and Technology Council of Taiwan ROC under grant numbers 114-2221-E-130-009-MY2
Institutional Review Board Statement
This study was a secondary analysis of credentialed, de-identified clinical data from the MIMIC-IV and eICU Collaborative Research Database (eICU-CRD) and involved no direct patient contact or attempts at patient re-identification. The collection and sharing of MIMIC-IV data were reviewed by the Institutional Review Board of Beth Israel Deaconess Medical Center, which granted a waiver of informed consent and approved the data-sharing initiative. The eICU-CRD is distributed as de-identified data in accordance with the Health Insurance Portability and Accountability Act (HIPAA) Safe Harbor provisions. Access to both databases was obtained through PhysioNet after completion of the required human-subjects research training and acceptance of the applicable data use agreements.
Informed Consent Statement
Not applicable.
Data Availability Statement
The datasets used in this study are credentialed-access clinical databases available through PhysioNet. MIMIC-IV v3.1 is available at https://physionet.org/content/mimiciv/3.1/, and eICU-CRD v2.0 is available at https://physionet.org/content/eicu-crd/2.0/. Access requires completion of the applicable PhysioNet credentialing procedures, human-subjects research training, and data use agreements. Because of patient privacy protections and data use restrictions, the source datasets and derived patient-level data cannot be redistributed by the authors. Qualified researchers may obtain the datasets directly from PhysioNet through the links provided above. Source code, configuration files, and non-sensitive reproducibility materials for data preprocessing, model development, and analysis will be made publicly available at https://github.com/rexw713ss/medical_research upon acceptance of this manuscript.
Conflicts of Interest
The authors declare that they have no financial or non-financial competing interests relevant to this work.
Use of Artificial Intelligence
During the preparation of this work, the authors used OpenAI ChatGPT and Codex for language editing and code debugging. After using these tools, the authors reviewed and edited the content as needed and take full responsibility for the content of the article.
Abbreviations
| Abbreviation | Definition | Abbreviation | Definition |
| AUPRC | Area under the precision-recall curve | AUROC | Area under the receiver operating characteristic curve |
| DCA | Decision curve analysis | EBM | Explainable Boosting Machine |
| ECE | Expected calibration error | EHR | Electronic health record |
| FNN | Fuzzy neural network | GCS | Glasgow Coma Scale |
| ICU | Intensive care unit | KG-TFNN | Knowledge-Guided Temporal Fuzzy Neural Network |
| MAP | Mean arterial pressure | NEWS2 | National Early Warning Score 2 |
| SOFA | Sequential Organ Failure Assessment | TPE | Tree-structured Parzen estimator |
References
- Rudin, C. Stop explaining black box machine learning models for high stakes decisions and use interpretable models instead. Nat. Mach. Intell. 2019, 1, 206–215. [Google Scholar] [CrossRef] [PubMed]
- Tonekaboni, S.; Joshi, S.; McCradden, M.D.; Goldenberg, A. What Clinicians Want: Contextualizing Explainable Machine Learning for Clinical End Use. Proc. Mach. Learn. Res. 2019, 106, 359–380. [Google Scholar]
- Ghassemi, M.; Oakden-Rayner, L.; Beam, A.L. The false hope of current approaches to explainable artificial intelligence in health care. Lancet Digit. Health 2021, 3, e745–e750. [Google Scholar] [CrossRef] [PubMed]
- Lambden, S.; Laterre, P.F.; Levy, M.M.; Francois, B. The SOFA score—development, utility and challenges of accurate assessment in clinical trials. Crit. Care 2019, 23, 374. [Google Scholar] [CrossRef] [PubMed]
- Smith, G.B.; Redfern, O.C.; Pimentel, M.A.; Gerry, S.; Collins, G.S.; Malycha, J.; Prytherch, D.; Schmidt, P.E.; Watkinson, P.J. The National Early Warning Score 2 (NEWS2). Clin. Med. 2019, 19, 260. [Google Scholar] [CrossRef] [PubMed]
- Jang, J.S.R. ANFIS: Adaptive-Network-Based Fuzzy Inference System. IEEE Trans. Syst. Man. Cybern. 1993, 23, 665–685. [Google Scholar] [CrossRef]
- Pal, D.; Mandana, K.; Pal, S.; Sarkar, D.; Chakraborty, C. Fuzzy expert system approach for coronary artery disease screening using clinical parameters. Knowl.-Based Syst. 2012, 36, 162–174. [Google Scholar] [CrossRef]
- Zhou, S.M.; Gan, J.Q. Low-Level Interpretability and High-Level Interpretability: A Unified View of Data-Driven Interpretable Fuzzy System Modelling. Fuzzy Sets Syst. 2008, 159, 3091–3131. [Google Scholar] [CrossRef]
- Gacto, M.J.; Alcalá, R.; Herrera, F. Interpretability of Linguistic Fuzzy Rule-Based Systems: An Overview of Interpretability Measures. Inf. Sci. 2011, 181, 4340–4360. [Google Scholar] [CrossRef]
- Varshney, A.K.; Torra, V. Literature Review of the Recent Trends and Applications in Various Fuzzy Rule-Based Systems. Int. J. Fuzzy Syst. 2023, 25, 2163–2186. [Google Scholar] [CrossRef]
- Pickering, L.; Cohen, K.; De Baets, B. A Narrative Review on the Interpretability of Fuzzy Rule-Based Models From a Modern Interpretable Machine Learning Perspective. Int. J. Fuzzy Syst. 2026, 28, 1313–1332. [Google Scholar] [CrossRef]
- Jamett, J.; Melendez, P.; Collao-Ferrada, X.; Cordero-Torres, K.; Veloz, A. Fuzzy Logic Approaches for Causal Inference in Health Care: Systematic Review. JMIR AI 2026, 5, e83425–e83425. [Google Scholar] [CrossRef] [PubMed]
- Li, D.C.; Lin, M.Y.C.; Chou, L.D. Macroscopic Big Data Analysis and Prediction of Driving Behavior With an Adaptive Fuzzy Recurrent Neural Network on the Internet of Vehicles. IEEE Access 2022, 10, 47881–47895. [Google Scholar] [CrossRef]
- de Campos Souza, P.V.; Lughofer, E. An Evolving Neuro-Fuzzy System Based on Uni-Nullneurons With Advanced Interpretability Capabilities. Neurocomputing 2021, 451, 231–251. [Google Scholar] [CrossRef]
- de Campos Souza, P.V.; Lughofer, E.; Guimaraes, A.J. An Interpretable Evolving Fuzzy Neural Network Based on Self-Organized Direction-Aware Data Partitioning and Fuzzy Logic Neurons. Appl. Soft Comput. 2021, 112, 107829. [Google Scholar] [CrossRef]
- Kiani, M.; Andreu-Perez, J.; Hagras, H. A Temporal Type-2 Fuzzy System for Time-Dependent Explainable Artificial Intelligence. IEEE Trans. Artif. Intell. 2023, 4, 573–586. [Google Scholar] [CrossRef]
- Navarro-Almanza, R.; Sanchez, M.A.; Castro, J.R.; Mendoza, O.; Licea, G. Interpretable Mamdani Neuro-Fuzzy Model Through Context Awareness and Linguistic Adaptation. Expert Syst. With Appl. 2022, 189, 116098. [Google Scholar] [CrossRef]
- Xie, C.; Rajan, D.; Prasad, D.K.; Quek, C. An Embedded Deep Fuzzy Association Model for Learning and Explanation. Appl. Soft Comput. 2022, 131, 109738. [Google Scholar] [CrossRef]
- Badreddine, S.; Garcez, A.d.; Serafini, L.; Spranger, M. Logic Tensor Networks. Artif. Intell. 2022, 303, 103649. [Google Scholar] [CrossRef]
- Kierner, S.; Kucharski, J.; Kierner, Z. Taxonomy of hybrid architectures involving rule-based reasoning and machine learning in clinical decision systems: A scoping review. J. Biomed. Inform. 2023, 144, 104428. [Google Scholar] [CrossRef]
- Choi, E.; Bahadori, M.T.; Song, L.; Stewart, W.F.; Sun, J. GRAM: Graph-based Attention Model for Healthcare Representation Learning. In Proceedings of the Proceedings of the 23rd ACM SIGKDD International Conference on Knowledge Discovery and Data Mining, Halifax NS Canada, 2017; pp. 787–795. [Google Scholar] [CrossRef] [PubMed]
- Sirocchi, C.; Bogliolo, A.; Montagna, S. Medical-informed machine learning: integrating prior knowledge into medical decision systems. BMC Med. Inform. Decis. Mak. 2024, 24, 186. [Google Scholar] [CrossRef] [PubMed]
- Ma, X.; Wang, M.; Lin, S.; Zhang, Y.; Zhang, Y.; Ouyang, W.; Liu, X. Knowledge and data-driven prediction of organ failure in critical care patients. Health Inf. Sci. Syst. 2023, 11, 7. [Google Scholar] [CrossRef] [PubMed]
- Shickel, B.; Tighe, P.J.; Bihorac, A.; Rashidi, P. Deep EHR: A Survey of Recent Advances in Deep Learning Techniques for Electronic Health Record (EHR) Analysis. IEEE J. Biomed. Health Inform. 2018, 22, 1589–1604. [Google Scholar] [CrossRef] [PubMed]
- Shickel, B.; Loftus, T.J.; Adhikari, L.; Ozrazgat-Baslanti, T.; Bihorac, A.; Rashidi, P. DeepSOFA: A Continuous Acuity Score for Critically Ill Patients using Clinically Interpretable Deep Learning. Sci. Rep. 2019, 9, 1879. [Google Scholar] [CrossRef] [PubMed]
- Hyland, S.L.; Faltys, M.; Hüser, M.; Lyu, X.; Gumbsch, T.; Esteban, C.; Bock, C.; Horn, M.; Moor, M.; Rieck, B.; et al. Early prediction of circulatory failure in the intensive care unit using machine learning. Nat. Med. 2020, 26, 364–373. [Google Scholar] [CrossRef] [PubMed]
- Zou, M.; An, Y.; Kuang, H.; Wang, J. LGTRL-DE: Local and Global Temporal Representation Learning With Demographic Embedding for In-Hospital Mortality Prediction. J. Biomed. Inform. 2023, 143, 104408. [Google Scholar] [CrossRef] [PubMed]
- Yadav, S.; Douglas, M.; Mosier, J.; Subbian, V. Graph-spa: A Spatiotemporal Graph Neural Network Based Framework for ARDS Prediction and Interpretability. J. Biomed. Inform. 2026, 173, 104969. [Google Scholar] [CrossRef] [PubMed]
- Che, Z.; Purushotham, S.; Cho, K.; Sontag, D.; Liu, Y. Recurrent Neural Networks for Multivariate Time Series with Missing Values. Sci. Rep. 2018, 8, 6085. [Google Scholar] [CrossRef] [PubMed]
- Tan, A.L.; Getzen, E.J.; Hutch, M.R.; Strasser, Z.H.; Gutiérrez-Sacristán, A.; Le, T.T.; Dagliati, A.; Morris, M.; Hanauer, D.A.; Moal, B.; et al. Informative missingness: What can we learn from patterns in missing laboratory data in the electronic health record? J. Biomed. Inform. 2023, 139, 104306. [Google Scholar] [CrossRef] [PubMed]
- Rockenschaub, P.; Akay, E.M.; Carlisle, B.G.; Hilbert, A.; Wendland, J.; Meyer-Eschenbach, F.; Näher, A.F.; Frey, D.; Madai, V.I. External validation of AI-based scoring systems in the ICU: a systematic review and meta-analysis. BMC Med. Inform. Decis. Mak. 2025, 25, 5. [Google Scholar] [CrossRef] [PubMed]
- Steyerberg, E.W.; Harrell, F.E. Prediction models need appropriate internal, internal–external, and external validation. J. Clin. Epidemiol. 2016, 69, 245–247. [Google Scholar] [CrossRef] [PubMed]
- Van Calster, B.; McLernon, D.J.; van Smeden, M.; Wynants, L.; Steyerberg, E.W. Topic Group `Evaluating diagnostic tests and prediction models’ of the STRATOS initiative. Calibration: the Achilles heel of predictive analytics. BMC Med. 2019, 17, 230. [Google Scholar] [CrossRef] [PubMed]
- Lefebvre, O.; Camirand Lemyre, F.; Ethier, J.F.; Chikouche, L.H.; Amriou, L.; Poenaru, D.; Vallières, M. Predictive performance precision analysis in medicine: identification of low-confidence predictions at patient and profile levels (MED3pa I). J. Am. Med. Inform. Assoc. 2026, 33, 1100–1111. [Google Scholar] [CrossRef] [PubMed]
- Vickers, A.J.; Elkin, E.B. Decision curve analysis: a novel method for evaluating prediction models. Med. Decis. Mak. 2006, 26, 565–574. [Google Scholar] [CrossRef] [PubMed]
- Wong, A.; Otles, E.; Donnelly, J.P.; Krumm, A.; McCullough, J.; DeTroyer-Cooley, O.; Pestrue, J.; Phillips, M.; Konye, J.; Penoza, C.; et al. External Validation of a Widely Implemented Proprietary Sepsis Prediction Model in Hospitalized Patients. JAMA Intern. Med. 2021, 181, 1065–1070. [Google Scholar] [CrossRef] [PubMed]
- Collins, G.S.; Moons, K.G.M.; Dhiman, P.; Riley, R.D.; Beam, A.L.; Van Calster, B.; Ghassemi, M.; Liu, X.; Reitsma, J.B.; Van Smeden, M.; et al. TRIPOD+AI statement: updated guidance for reporting clinical prediction models that use regression or machine learning methods. BMJ 2024, 385, e078378. [Google Scholar] [CrossRef] [PubMed]
- Moons, K.G.M.; Damen, J.A.A.; Kaul, T.; Hooft, L.; Andaur Navarro, C.; Dhiman, P.; Beam, A.L.; Van Calster, B.; Celi, L.A.; Denaxas, S.; et al. PROBAST+AI: an updated quality, risk of bias, and applicability assessment tool for prediction models using regression or artificial intelligence methods. BMJ 2025, 388, e082505. [Google Scholar] [CrossRef] [PubMed]
- Johnson, A.E.W.; Bulgarelli, L.; Shen, L.; Gayles, A.; Shammout, A.; Horng, S.; Pollard, T.J.; Hao, S.; Moody, B.; Gow, B.; et al. MIMIC-IV, a freely accessible electronic health record dataset. Sci. Data 2023, 10, 1. [Google Scholar] [CrossRef] [PubMed]
- Pollard, T.J.; Johnson, A.E.W.; Raffa, J.D.; Celi, L.A.; Mark, R.G.; Badawi, O. The eICU Collaborative Research Database, a freely available multi-center database for critical care research. Sci. Data 2018, 5, 180178. [Google Scholar] [CrossRef] [PubMed]
Figure 1.
KG-TFNN system architecture, optimization, and post-training inspection. The 24-hour input encodes 13 clinical variables as values, missingness indicators, and measurement recency, yielding 39 channels per hour. Values undergo knowledge-guided fuzzification, whereas missingness and recency additionally form three measurement-process descriptors per variable. NEWS2/SOFA-informed priors initialize trainable Gaussian memberships and selected native fuzzy weights. Additive feature risk and six native cross-feature fuzzy rules generate hourly fuzzy risk, which is integrated through temporal attention. The explicit temporal branch combines nine fuzzy-risk trajectory descriptors and three measurement-process descriptors per variable. Attended hourly risk, the explicit temporal score, and an output bias determine the raw probability, followed by Platt calibration fitted only to MIMIC-IV validation predictions. Optimization uses class-weighted binary cross-entropy and auxiliary directional, sparsity, drift, and nonnegativity penalties. Post-training inspection exposes native fuzzy components and temporal contributions; model-derived composite summaries are not separately parameterized native rule nodes.
Figure 1.
KG-TFNN system architecture, optimization, and post-training inspection. The 24-hour input encodes 13 clinical variables as values, missingness indicators, and measurement recency, yielding 39 channels per hour. Values undergo knowledge-guided fuzzification, whereas missingness and recency additionally form three measurement-process descriptors per variable. NEWS2/SOFA-informed priors initialize trainable Gaussian memberships and selected native fuzzy weights. Additive feature risk and six native cross-feature fuzzy rules generate hourly fuzzy risk, which is integrated through temporal attention. The explicit temporal branch combines nine fuzzy-risk trajectory descriptors and three measurement-process descriptors per variable. Attended hourly risk, the explicit temporal score, and an output bias determine the raw probability, followed by Platt calibration fitted only to MIMIC-IV validation predictions. Optimization uses class-weighted binary cross-entropy and auxiliary directional, sparsity, drift, and nonnegativity penalties. Post-training inspection exposes native fuzzy components and temporal contributions; model-derived composite summaries are not separately parameterized native rule nodes.
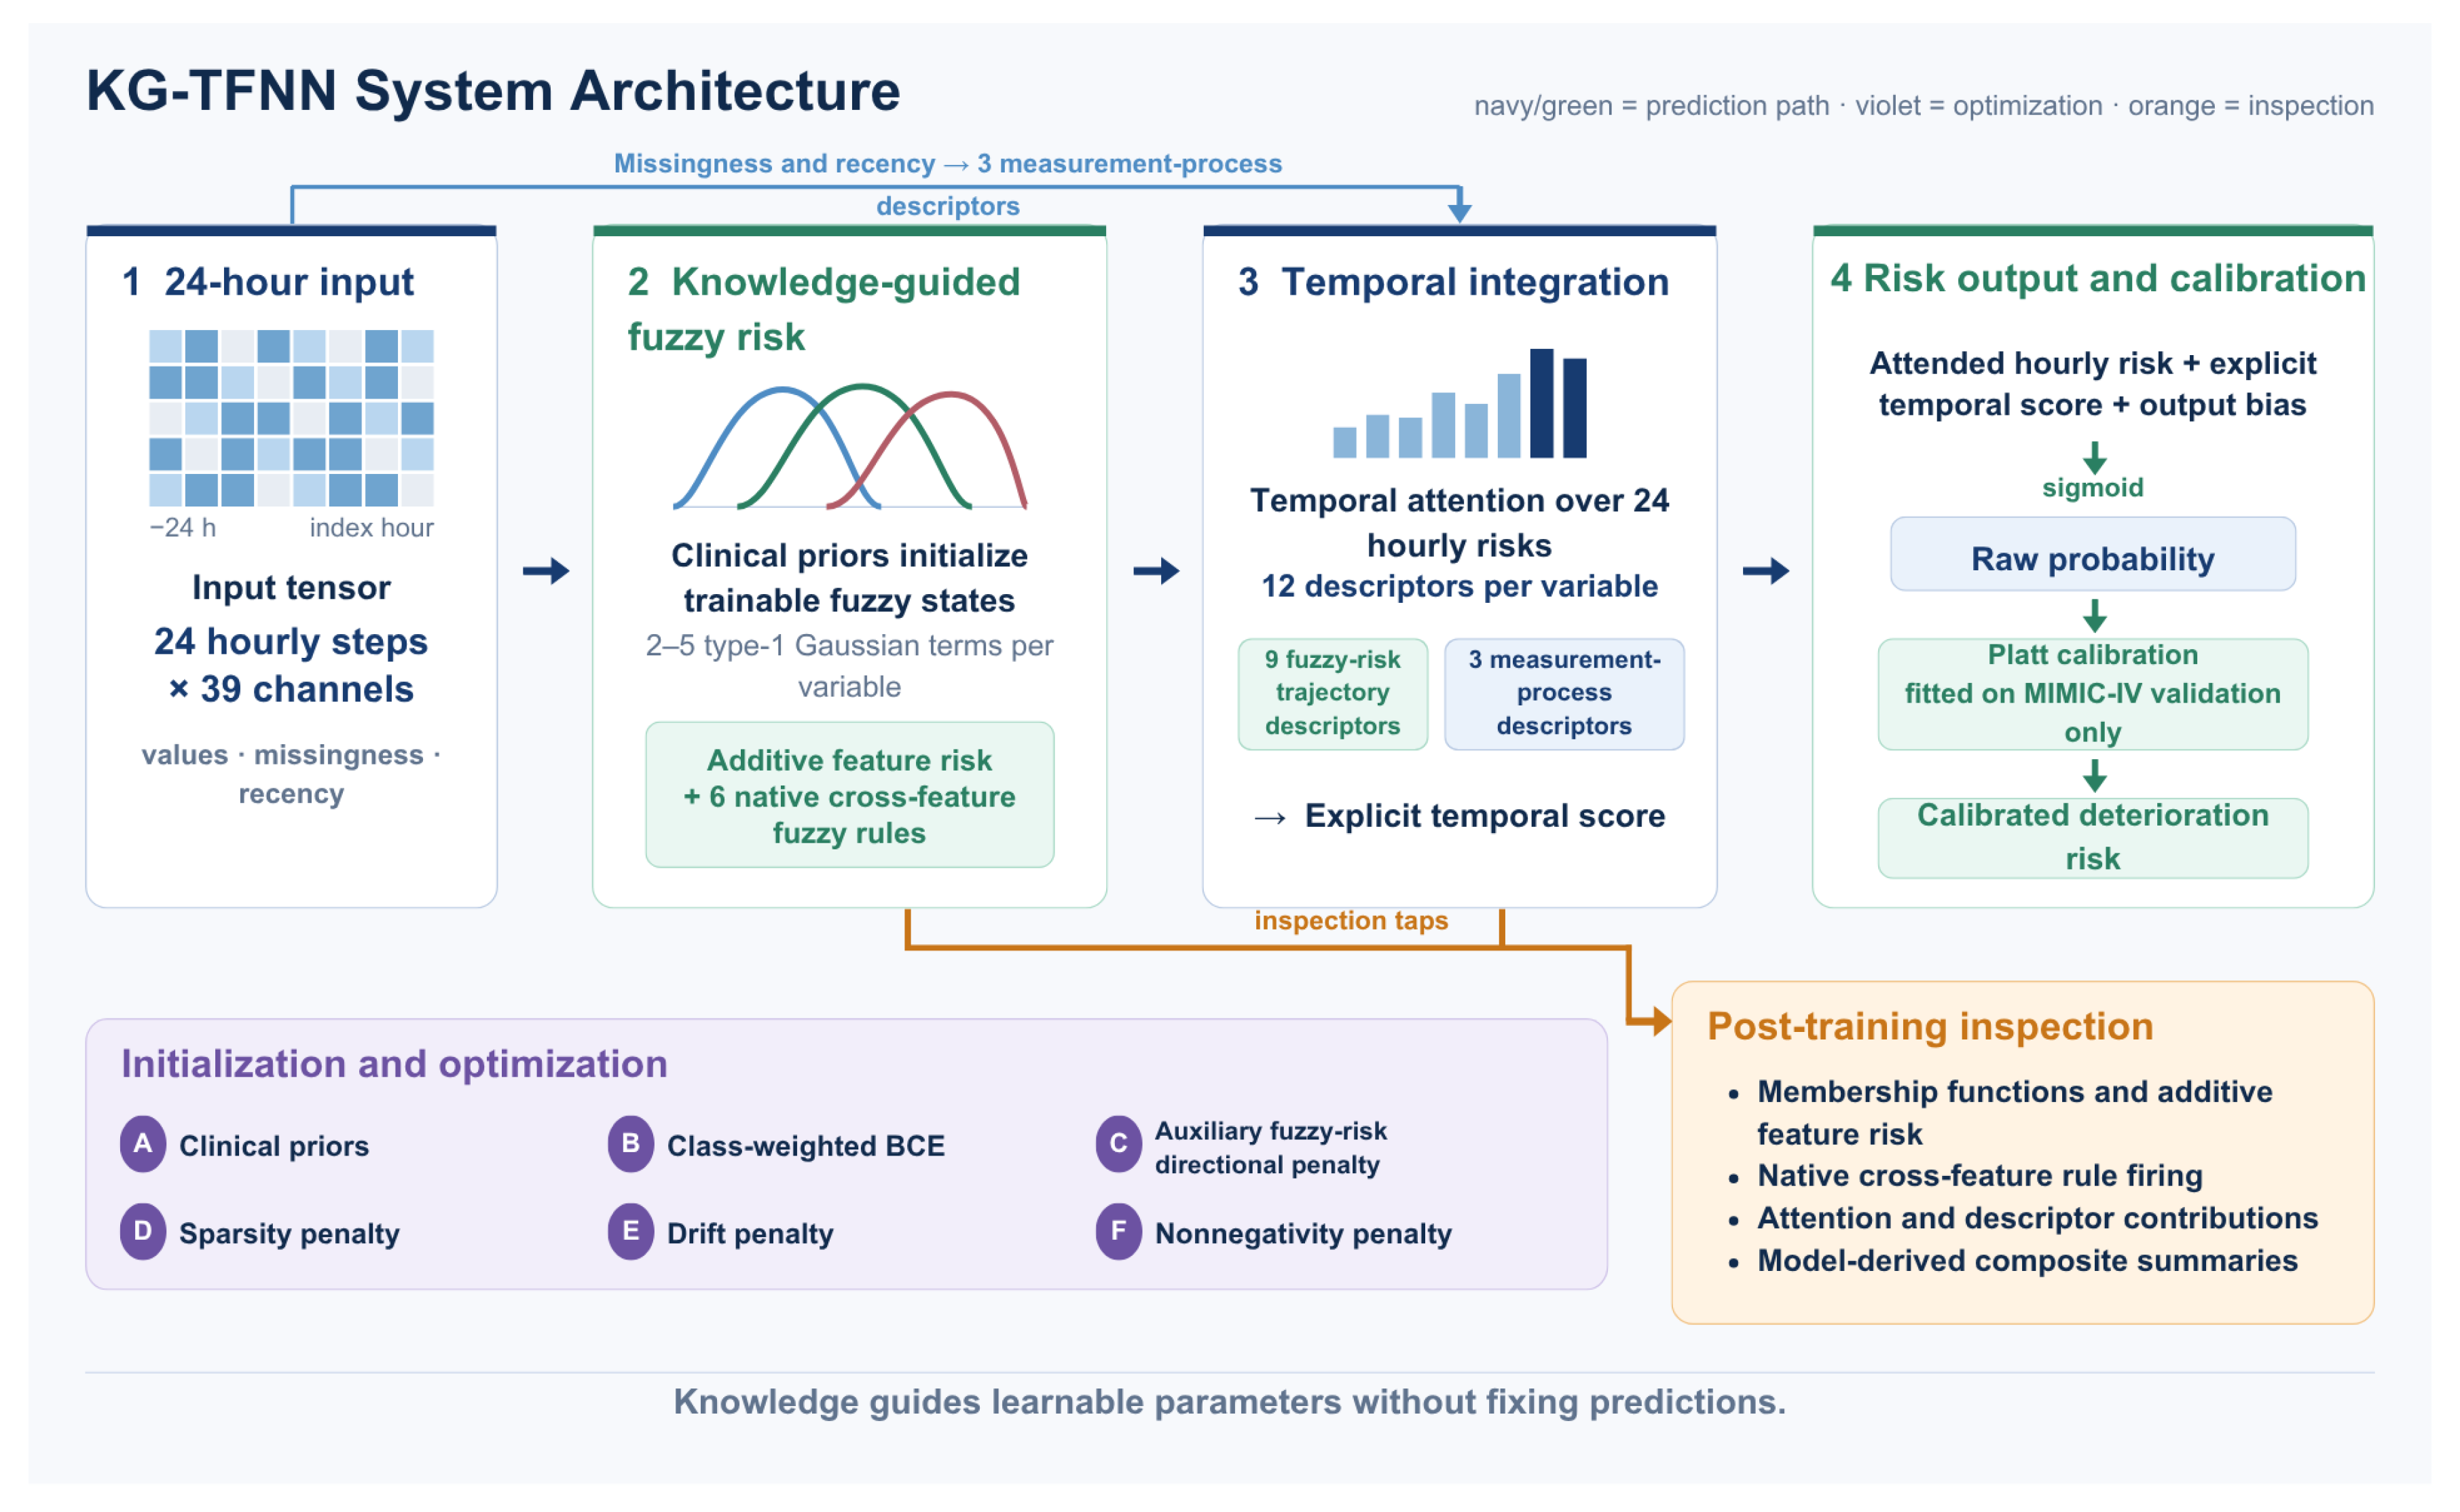
Figure 2.
Discrimination, calibration, and decision-analytic evaluation. Panels (a–b) use KG-TFNN-equal and the equal-sample comparators on identical MIMIC-IV test windows. In the legends, raw-13 denotes the raw 13-variable sequence, current-13 denotes 13 index-hour variables, matched-39 denotes the 39-channel GRU sequence, and summary-143 denotes tree models using 143 summaries derived from the same 24-hour by 39-channel input. Panels (c–d) use KG-TFNN-full; calibration and thresholds were estimated only from MIMIC-IV validation data. Complete internal and frozen eICU-CRD discrimination estimates are reported in Table 2.
Figure 2.
Discrimination, calibration, and decision-analytic evaluation. Panels (a–b) use KG-TFNN-equal and the equal-sample comparators on identical MIMIC-IV test windows. In the legends, raw-13 denotes the raw 13-variable sequence, current-13 denotes 13 index-hour variables, matched-39 denotes the 39-channel GRU sequence, and summary-143 denotes tree models using 143 summaries derived from the same 24-hour by 39-channel input. Panels (c–d) use KG-TFNN-full; calibration and thresholds were estimated only from MIMIC-IV validation data. Complete internal and frozen eICU-CRD discrimination estimates are reported in Table 2.
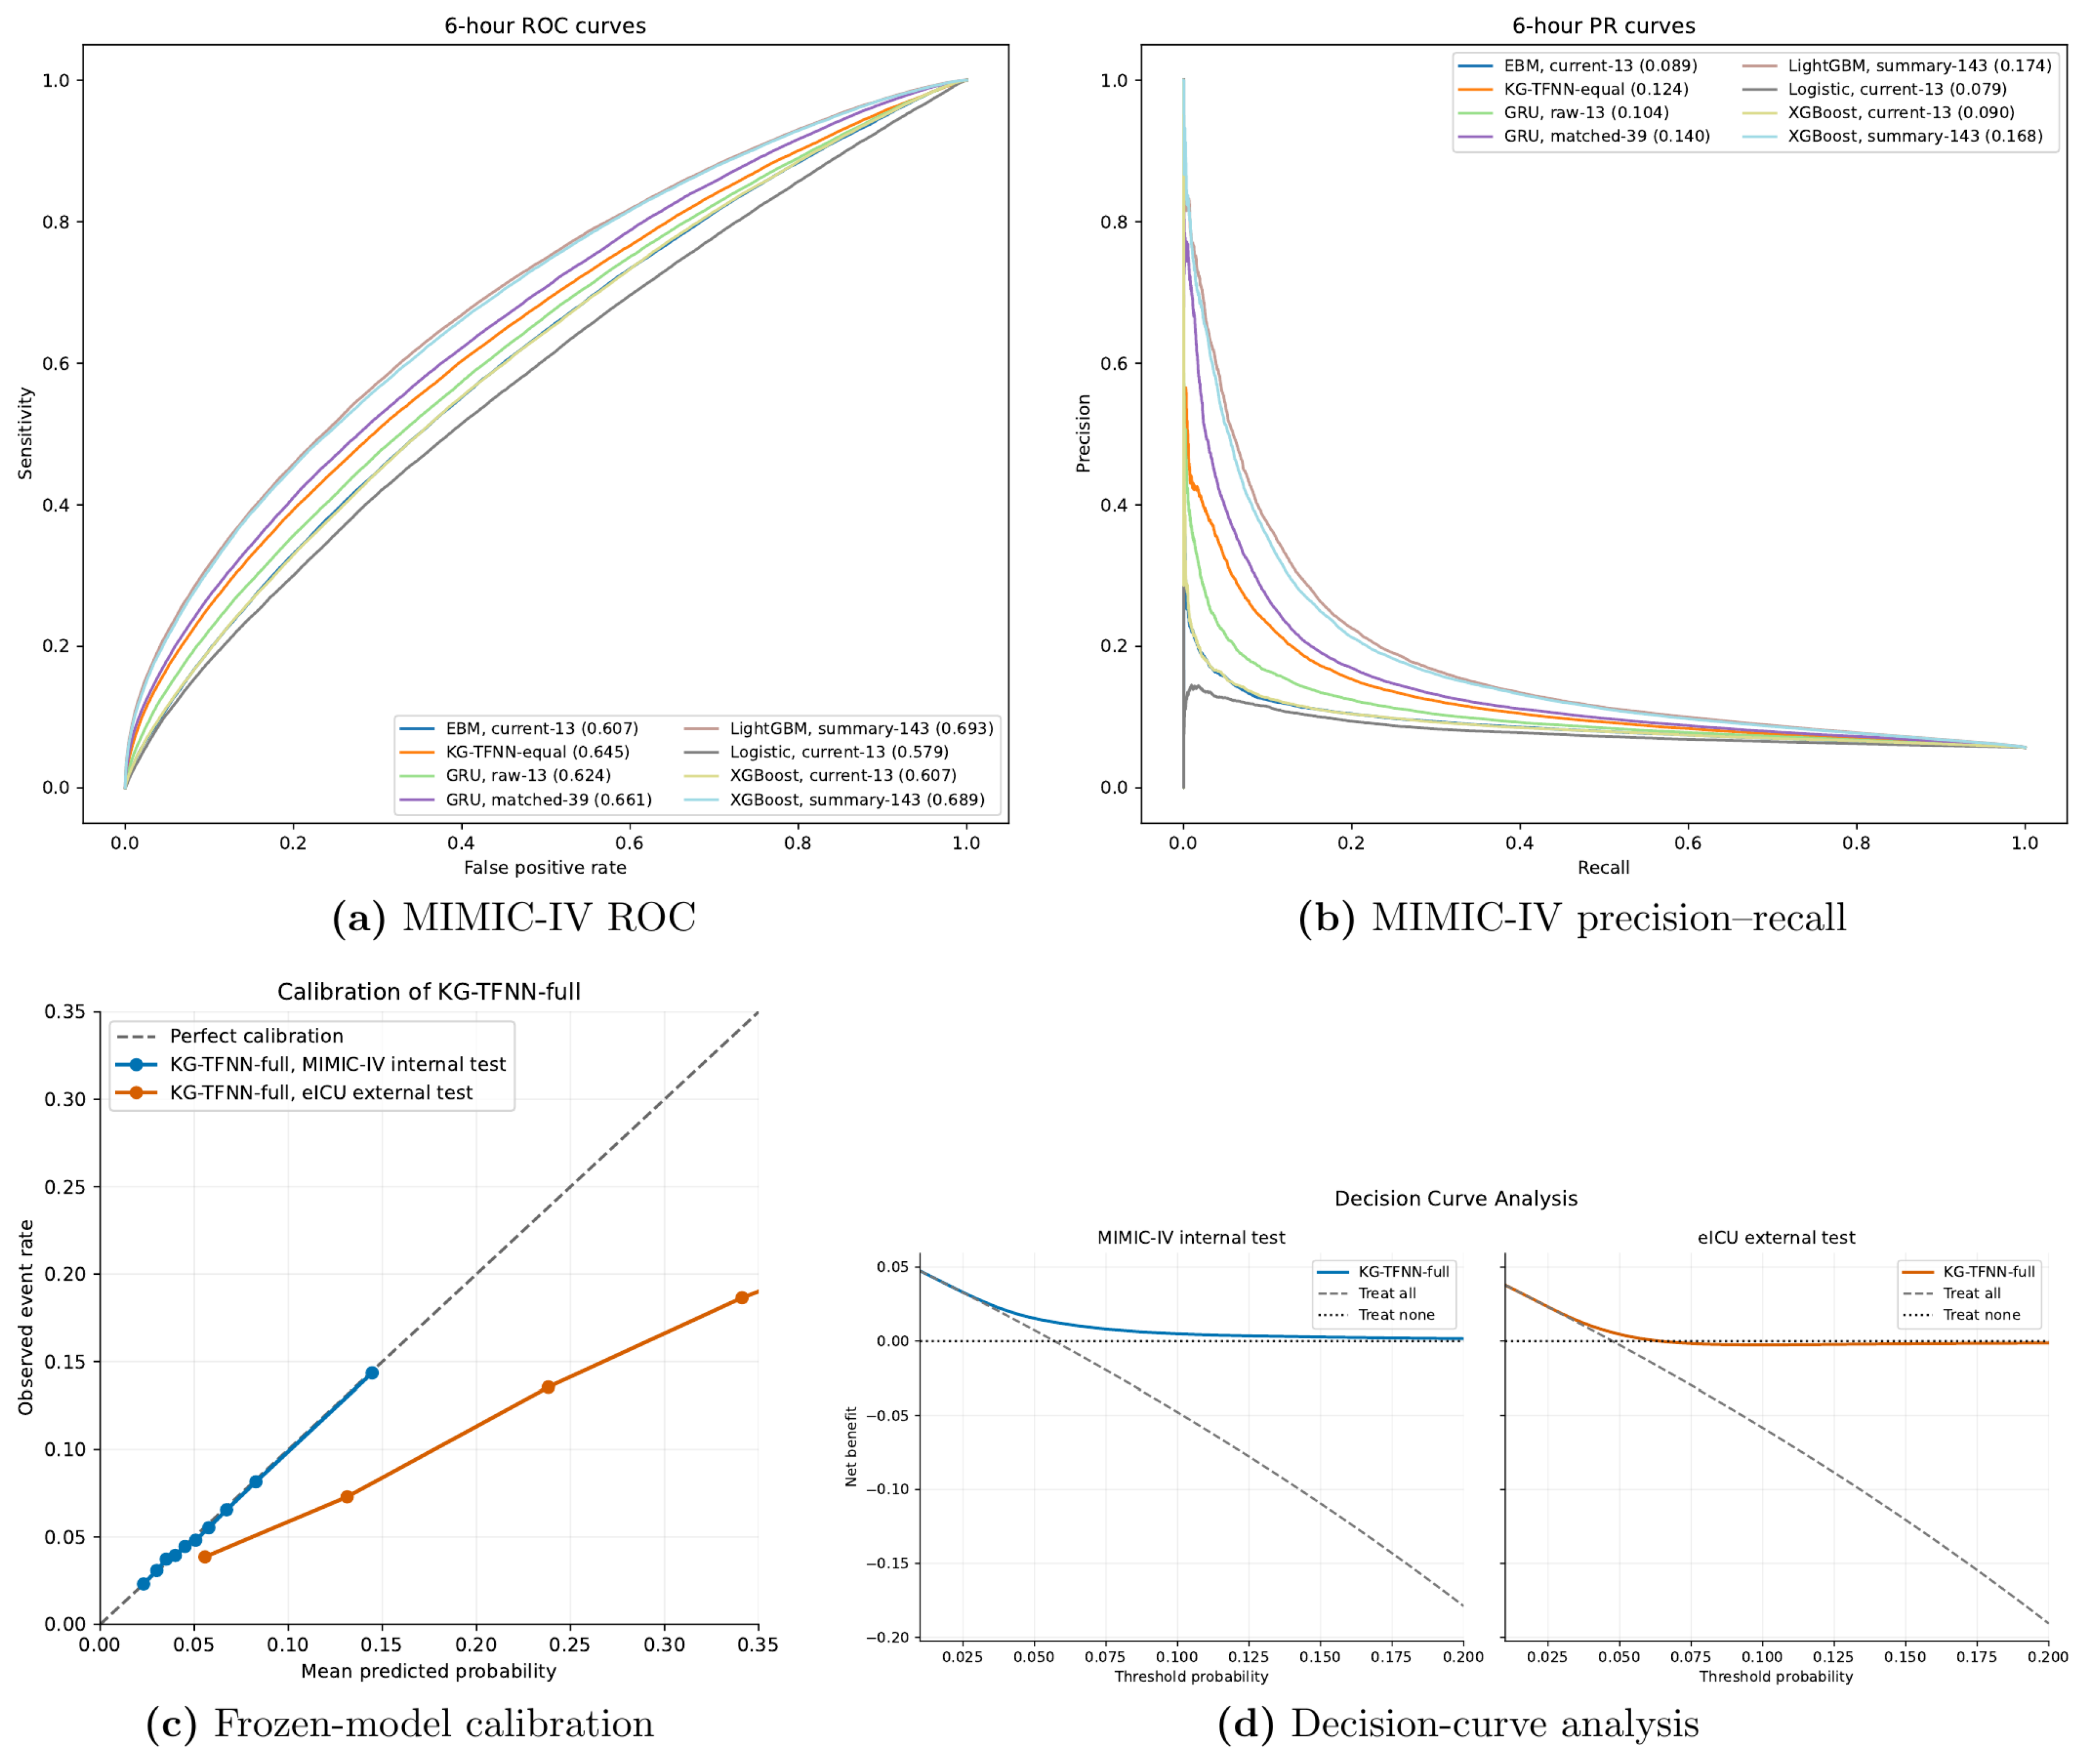
Figure 3.
Evolution of knowledge-guided fuzzy membership functions from frozen KG-TFNN-full (seed 42). Representative variables show initialized (dashed) and trained (solid) type-1 Gaussian memberships. Clinical priors define an auditable reference, whereas changes in centers and widths show data-driven adaptation. Domains span the union of initial and trained center ranges and may extend beyond physiologically admissible values; trained curves are model parameters, not new clinical cut points.
Figure 3.
Evolution of knowledge-guided fuzzy membership functions from frozen KG-TFNN-full (seed 42). Representative variables show initialized (dashed) and trained (solid) type-1 Gaussian memberships. Clinical priors define an auditable reference, whereas changes in centers and widths show data-driven adaptation. Domains span the union of initial and trained center ranges and may extend beyond physiologically admissible values; trained curves are model parameters, not new clinical cut points.
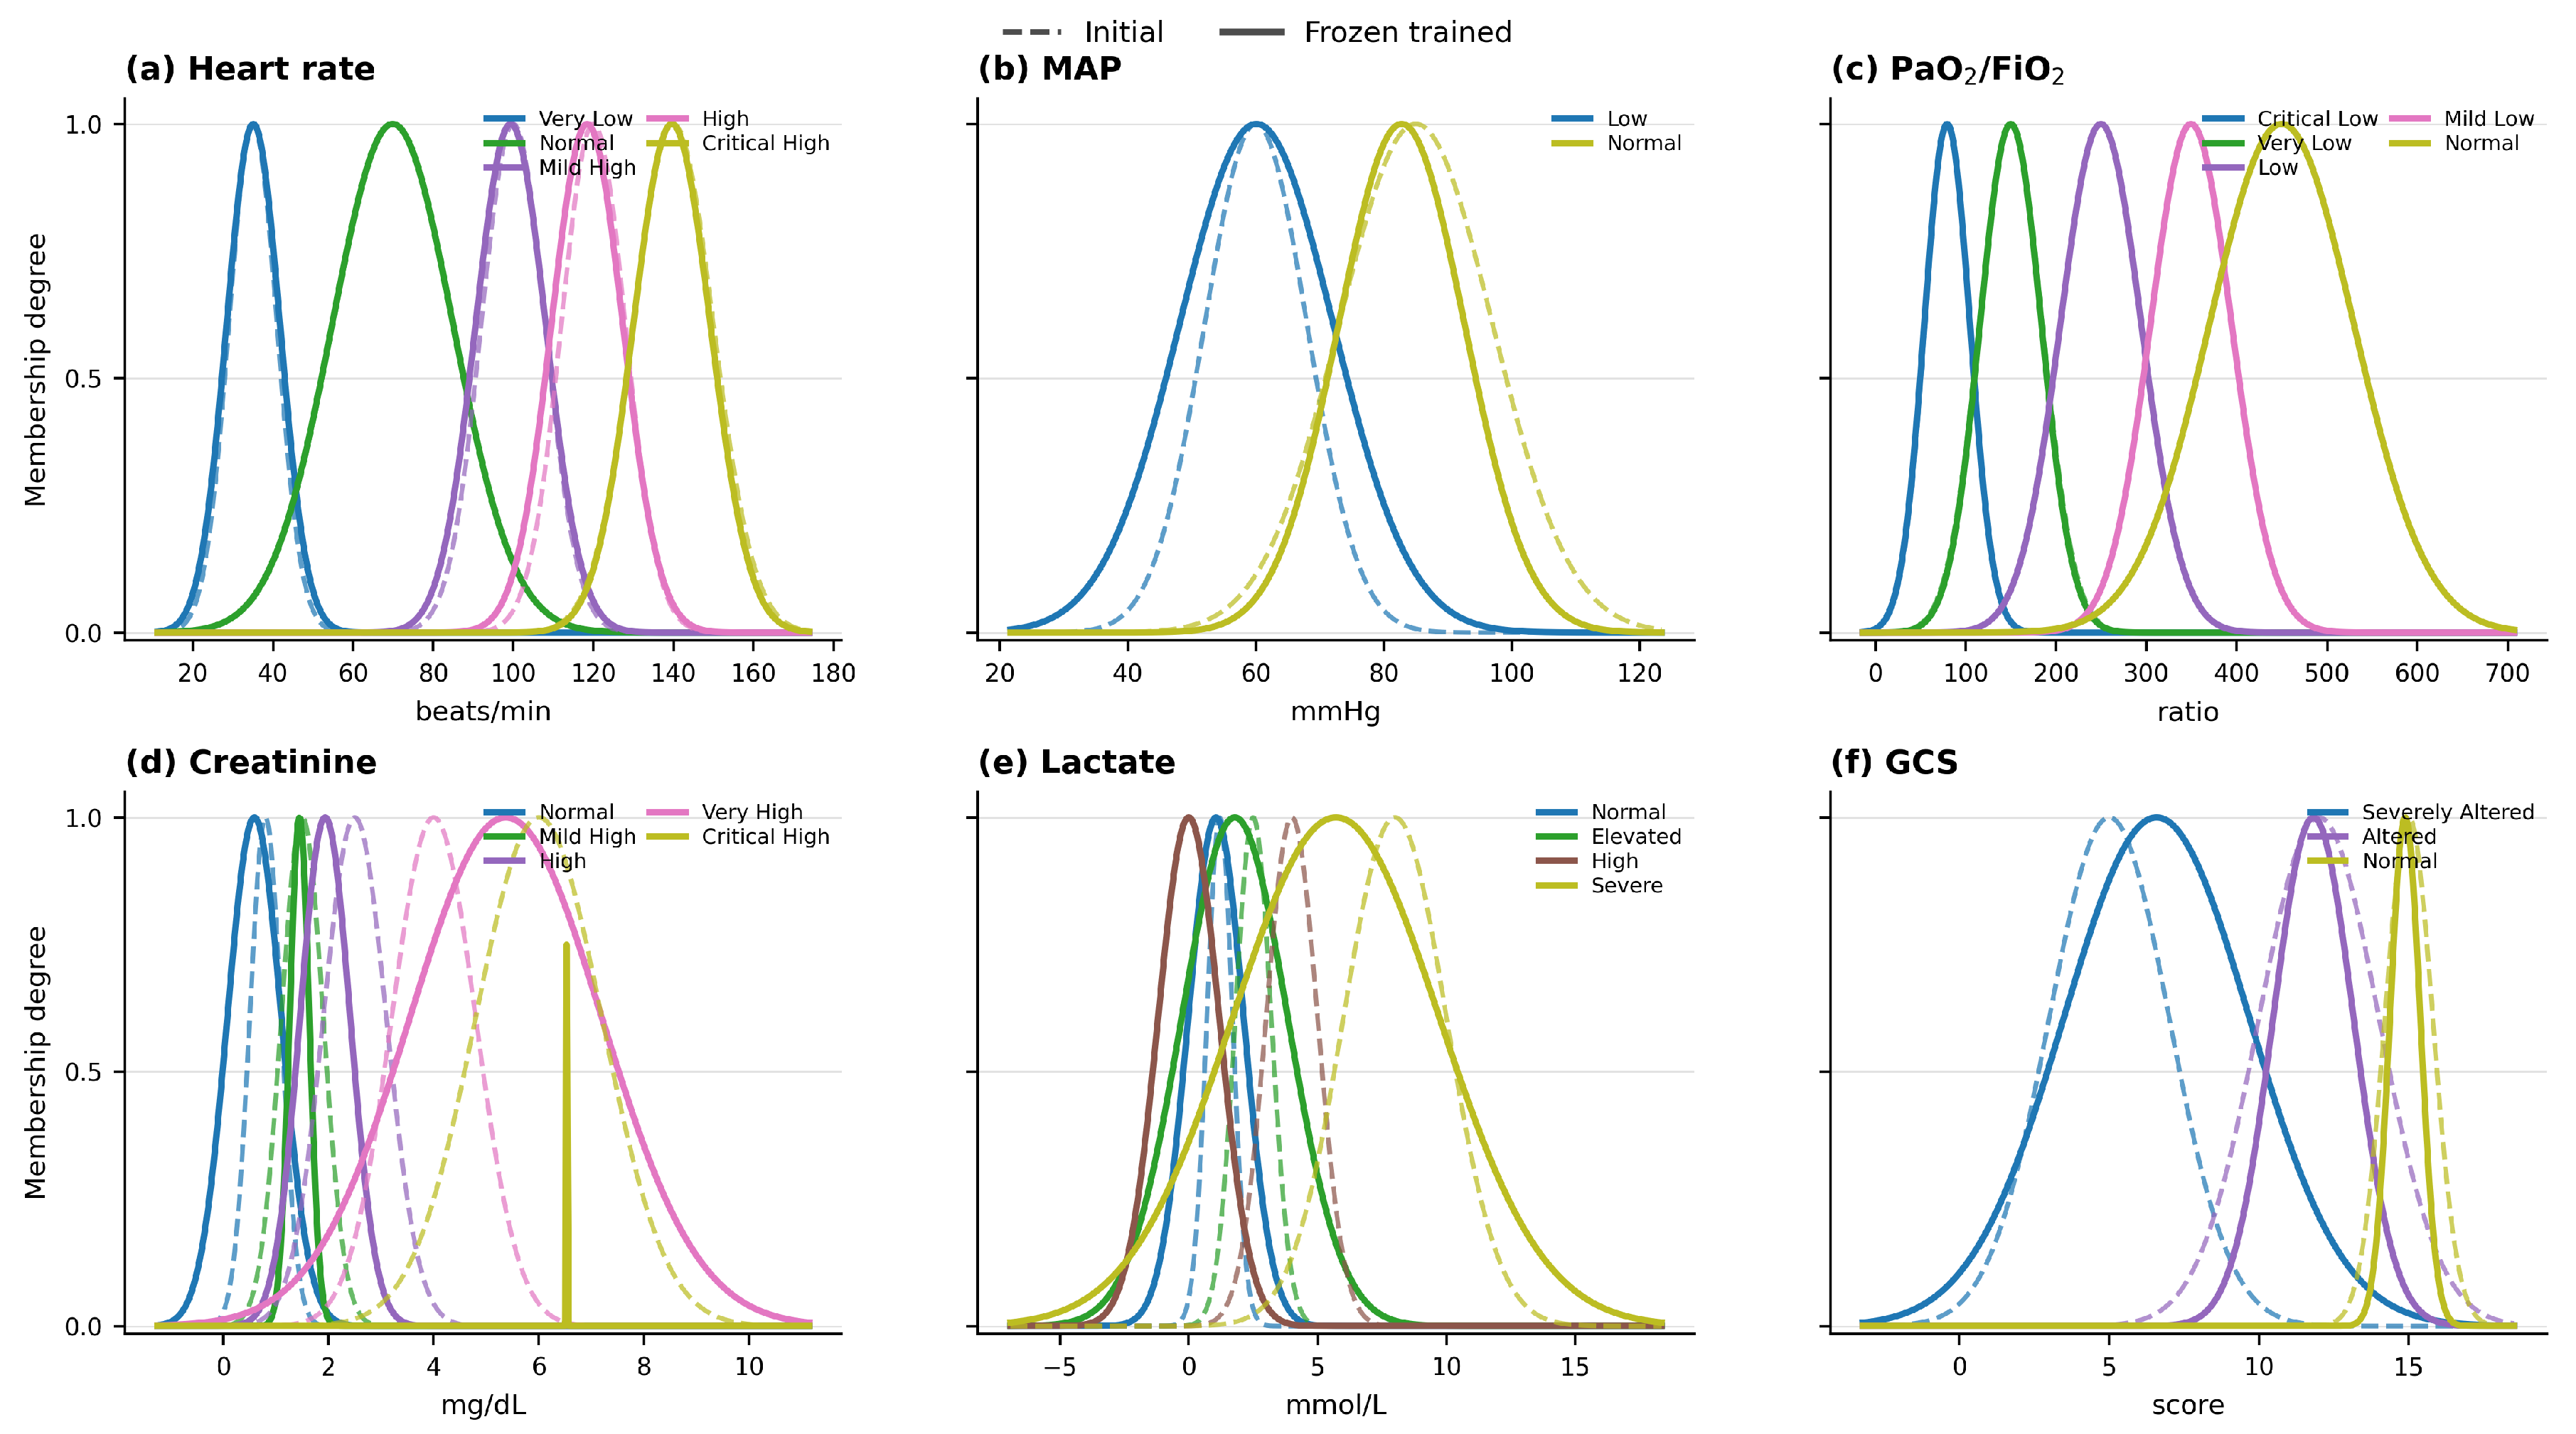
Figure 4.
Explanation robustness and temporal-continuity sensitivity for KG-TFNN-equal on all 830,839 MIMIC-IV test windows. Panels (a–b) show KG-TFNN-equal mean and 95% t intervals across 20 perturbation repetitions; noise was applied only to imputed physiological channels, while missingness and recency were fixed. Panel (c) compares explanation continuity across the common 13-variable representation at 1-, 3-, 6-, 12-, and non-overlapping 24-hour lags. Adjacent 24-hour windows share 23 hourly rows, whereas the 24-hour lag has no shared hourly input. Panel (d) compares KG-TFNN-equal adjacent, non-overlapping, and random cross-patient controls on a 0–1 scale. High random-pair similarity indicates global structural smoothness and limits interpretation of continuity as patient-specific responsiveness.
Figure 4.
Explanation robustness and temporal-continuity sensitivity for KG-TFNN-equal on all 830,839 MIMIC-IV test windows. Panels (a–b) show KG-TFNN-equal mean and 95% t intervals across 20 perturbation repetitions; noise was applied only to imputed physiological channels, while missingness and recency were fixed. Panel (c) compares explanation continuity across the common 13-variable representation at 1-, 3-, 6-, 12-, and non-overlapping 24-hour lags. Adjacent 24-hour windows share 23 hourly rows, whereas the 24-hour lag has no shared hourly input. Panel (d) compares KG-TFNN-equal adjacent, non-overlapping, and random cross-patient controls on a 0–1 scale. High random-pair similarity indicates global structural smoothness and limits interpretation of continuity as patient-specific responsiveness.
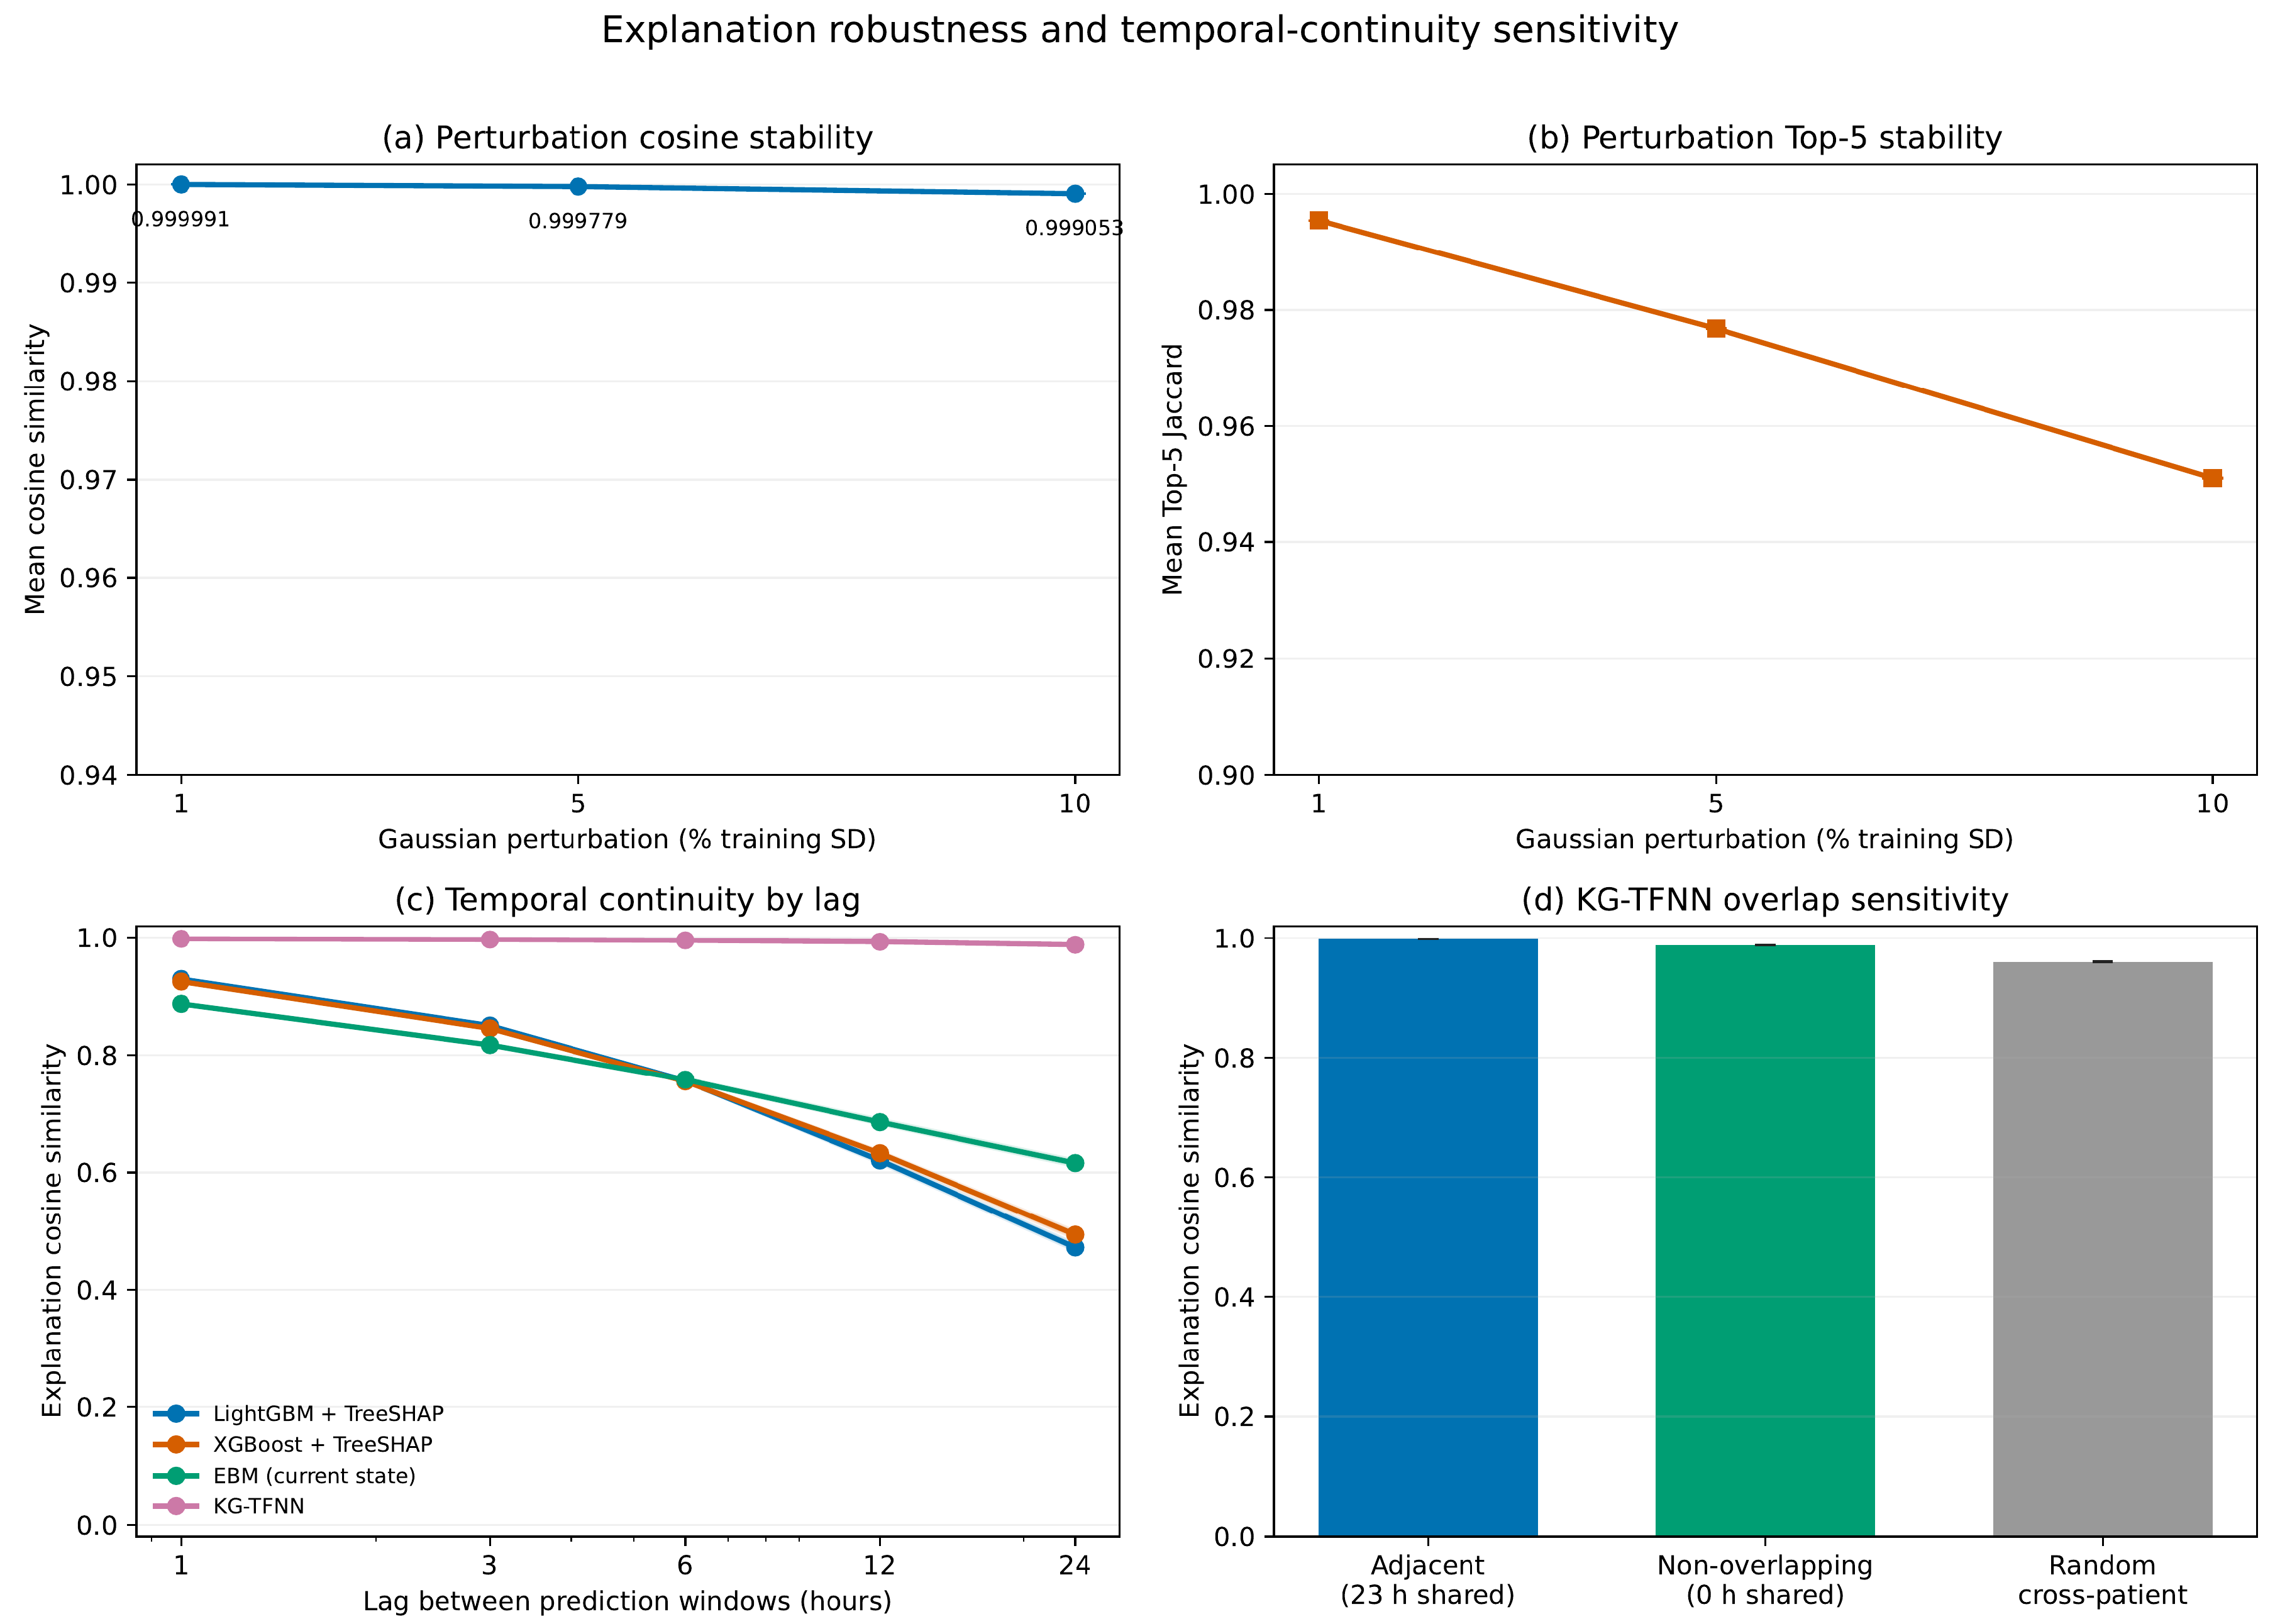
Figure 5.
Native fuzzy-rule activation and validation-locked composite-summary coverage from KG-TFNN-full. The top panel shows raw current-hour firing of native cross-feature fuzzy rules across activation thresholds. The lower panels show test coverage for the prominence-ranked high-support set (left) and the validation-locked risk-enriched set (right), including all windows, positive windows, unique patients, and first deterioration events. Composite summaries were assembled after training from prediction-path components and are not separately parameterized native rule nodes. Coverage denotes threshold-defined condition activation and does not quantify the proportion of model logits, decisions, alarms, or errors explained.
Figure 5.
Native fuzzy-rule activation and validation-locked composite-summary coverage from KG-TFNN-full. The top panel shows raw current-hour firing of native cross-feature fuzzy rules across activation thresholds. The lower panels show test coverage for the prominence-ranked high-support set (left) and the validation-locked risk-enriched set (right), including all windows, positive windows, unique patients, and first deterioration events. Composite summaries were assembled after training from prediction-path components and are not separately parameterized native rule nodes. Coverage denotes threshold-defined condition activation and does not quantify the proportion of model logits, decisions, alarms, or errors explained.
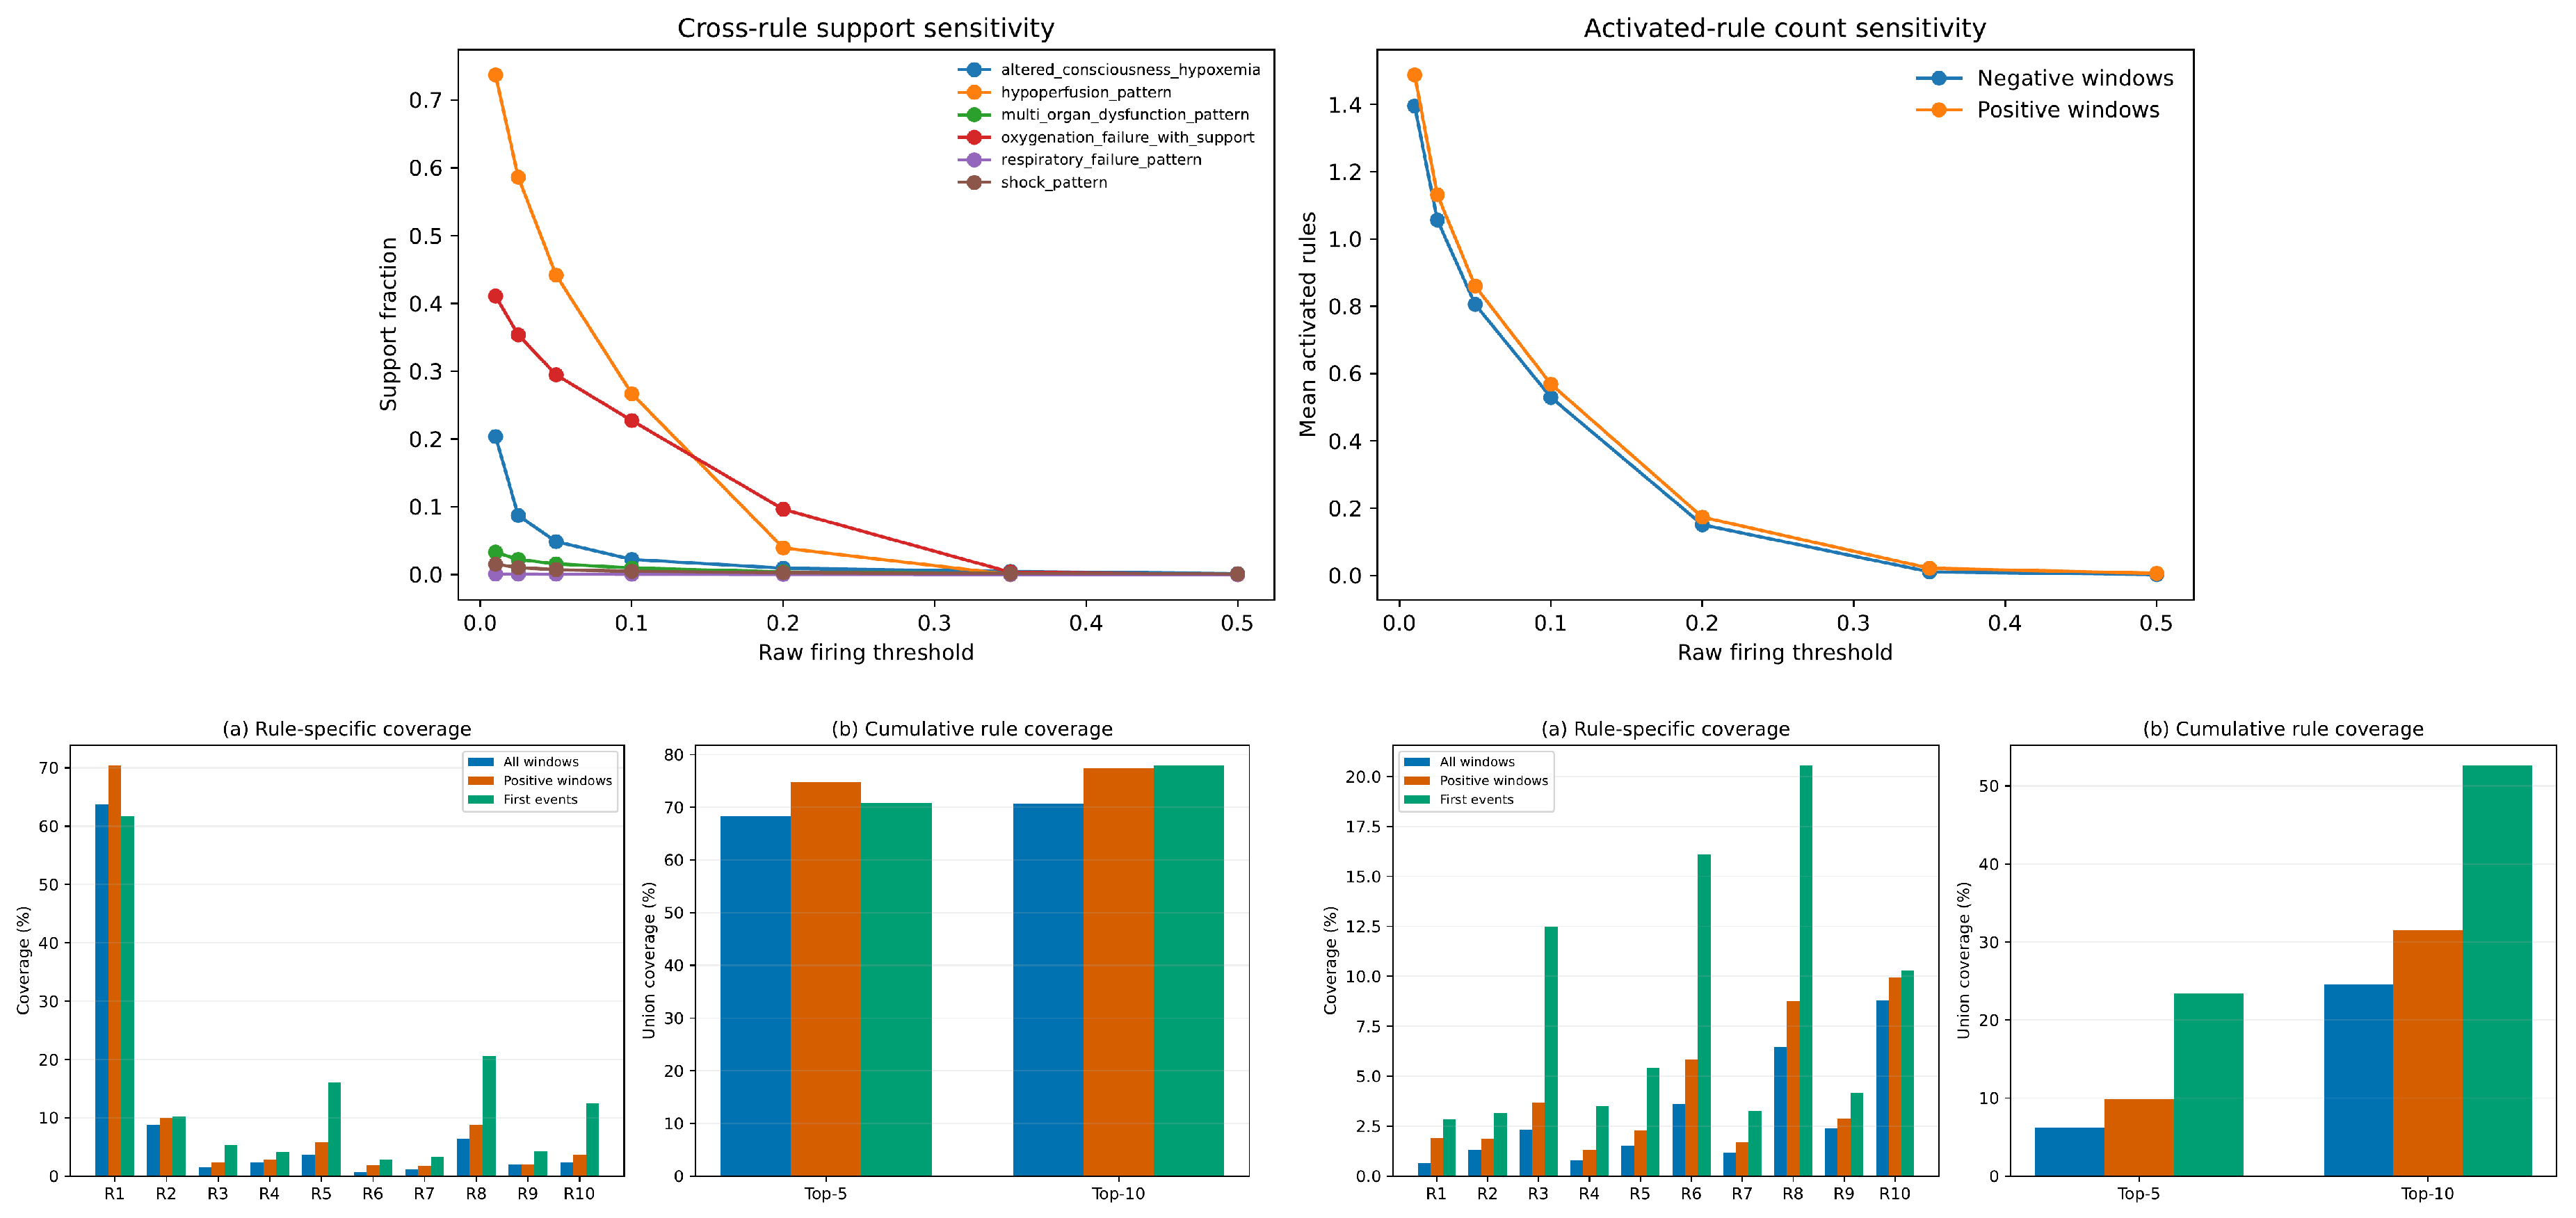
Figure 6.
Prespecified representative true-positive explanation timeline from KG-TFNN-full. The case was selected from 430 eligible true-positive events by requiring a validation-threshold alert 2–3 hours before the first evaluable deterioration event, a complete 24-hour history, and calibrated risk closest to the candidate median; stay and hour were deterministic tie-breakers, and no visual property influenced selection. The retained alert preceded a SOFA increase from 4 to 6 by 3 hours. Panel (a) displays the three variables with the largest absolute prediction-path contributions; panel (b) shows their fuzzy-risk trajectories; panel (c) shows frozen validation-calibrated risk and the frozen validation-derived operating threshold; and panel (d) separates temporal attention and native cross-feature fuzzy firing from post-training prominent composite-summary activation. Model inputs in panel (a) are within-case standardized after within-stay preprocessing.
Figure 6.
Prespecified representative true-positive explanation timeline from KG-TFNN-full. The case was selected from 430 eligible true-positive events by requiring a validation-threshold alert 2–3 hours before the first evaluable deterioration event, a complete 24-hour history, and calibrated risk closest to the candidate median; stay and hour were deterministic tie-breakers, and no visual property influenced selection. The retained alert preceded a SOFA increase from 4 to 6 by 3 hours. Panel (a) displays the three variables with the largest absolute prediction-path contributions; panel (b) shows their fuzzy-risk trajectories; panel (c) shows frozen validation-calibrated risk and the frozen validation-derived operating threshold; and panel (d) separates temporal attention and native cross-feature fuzzy firing from post-training prominent composite-summary activation. Model inputs in panel (a) are within-case standardized after within-stay preprocessing.
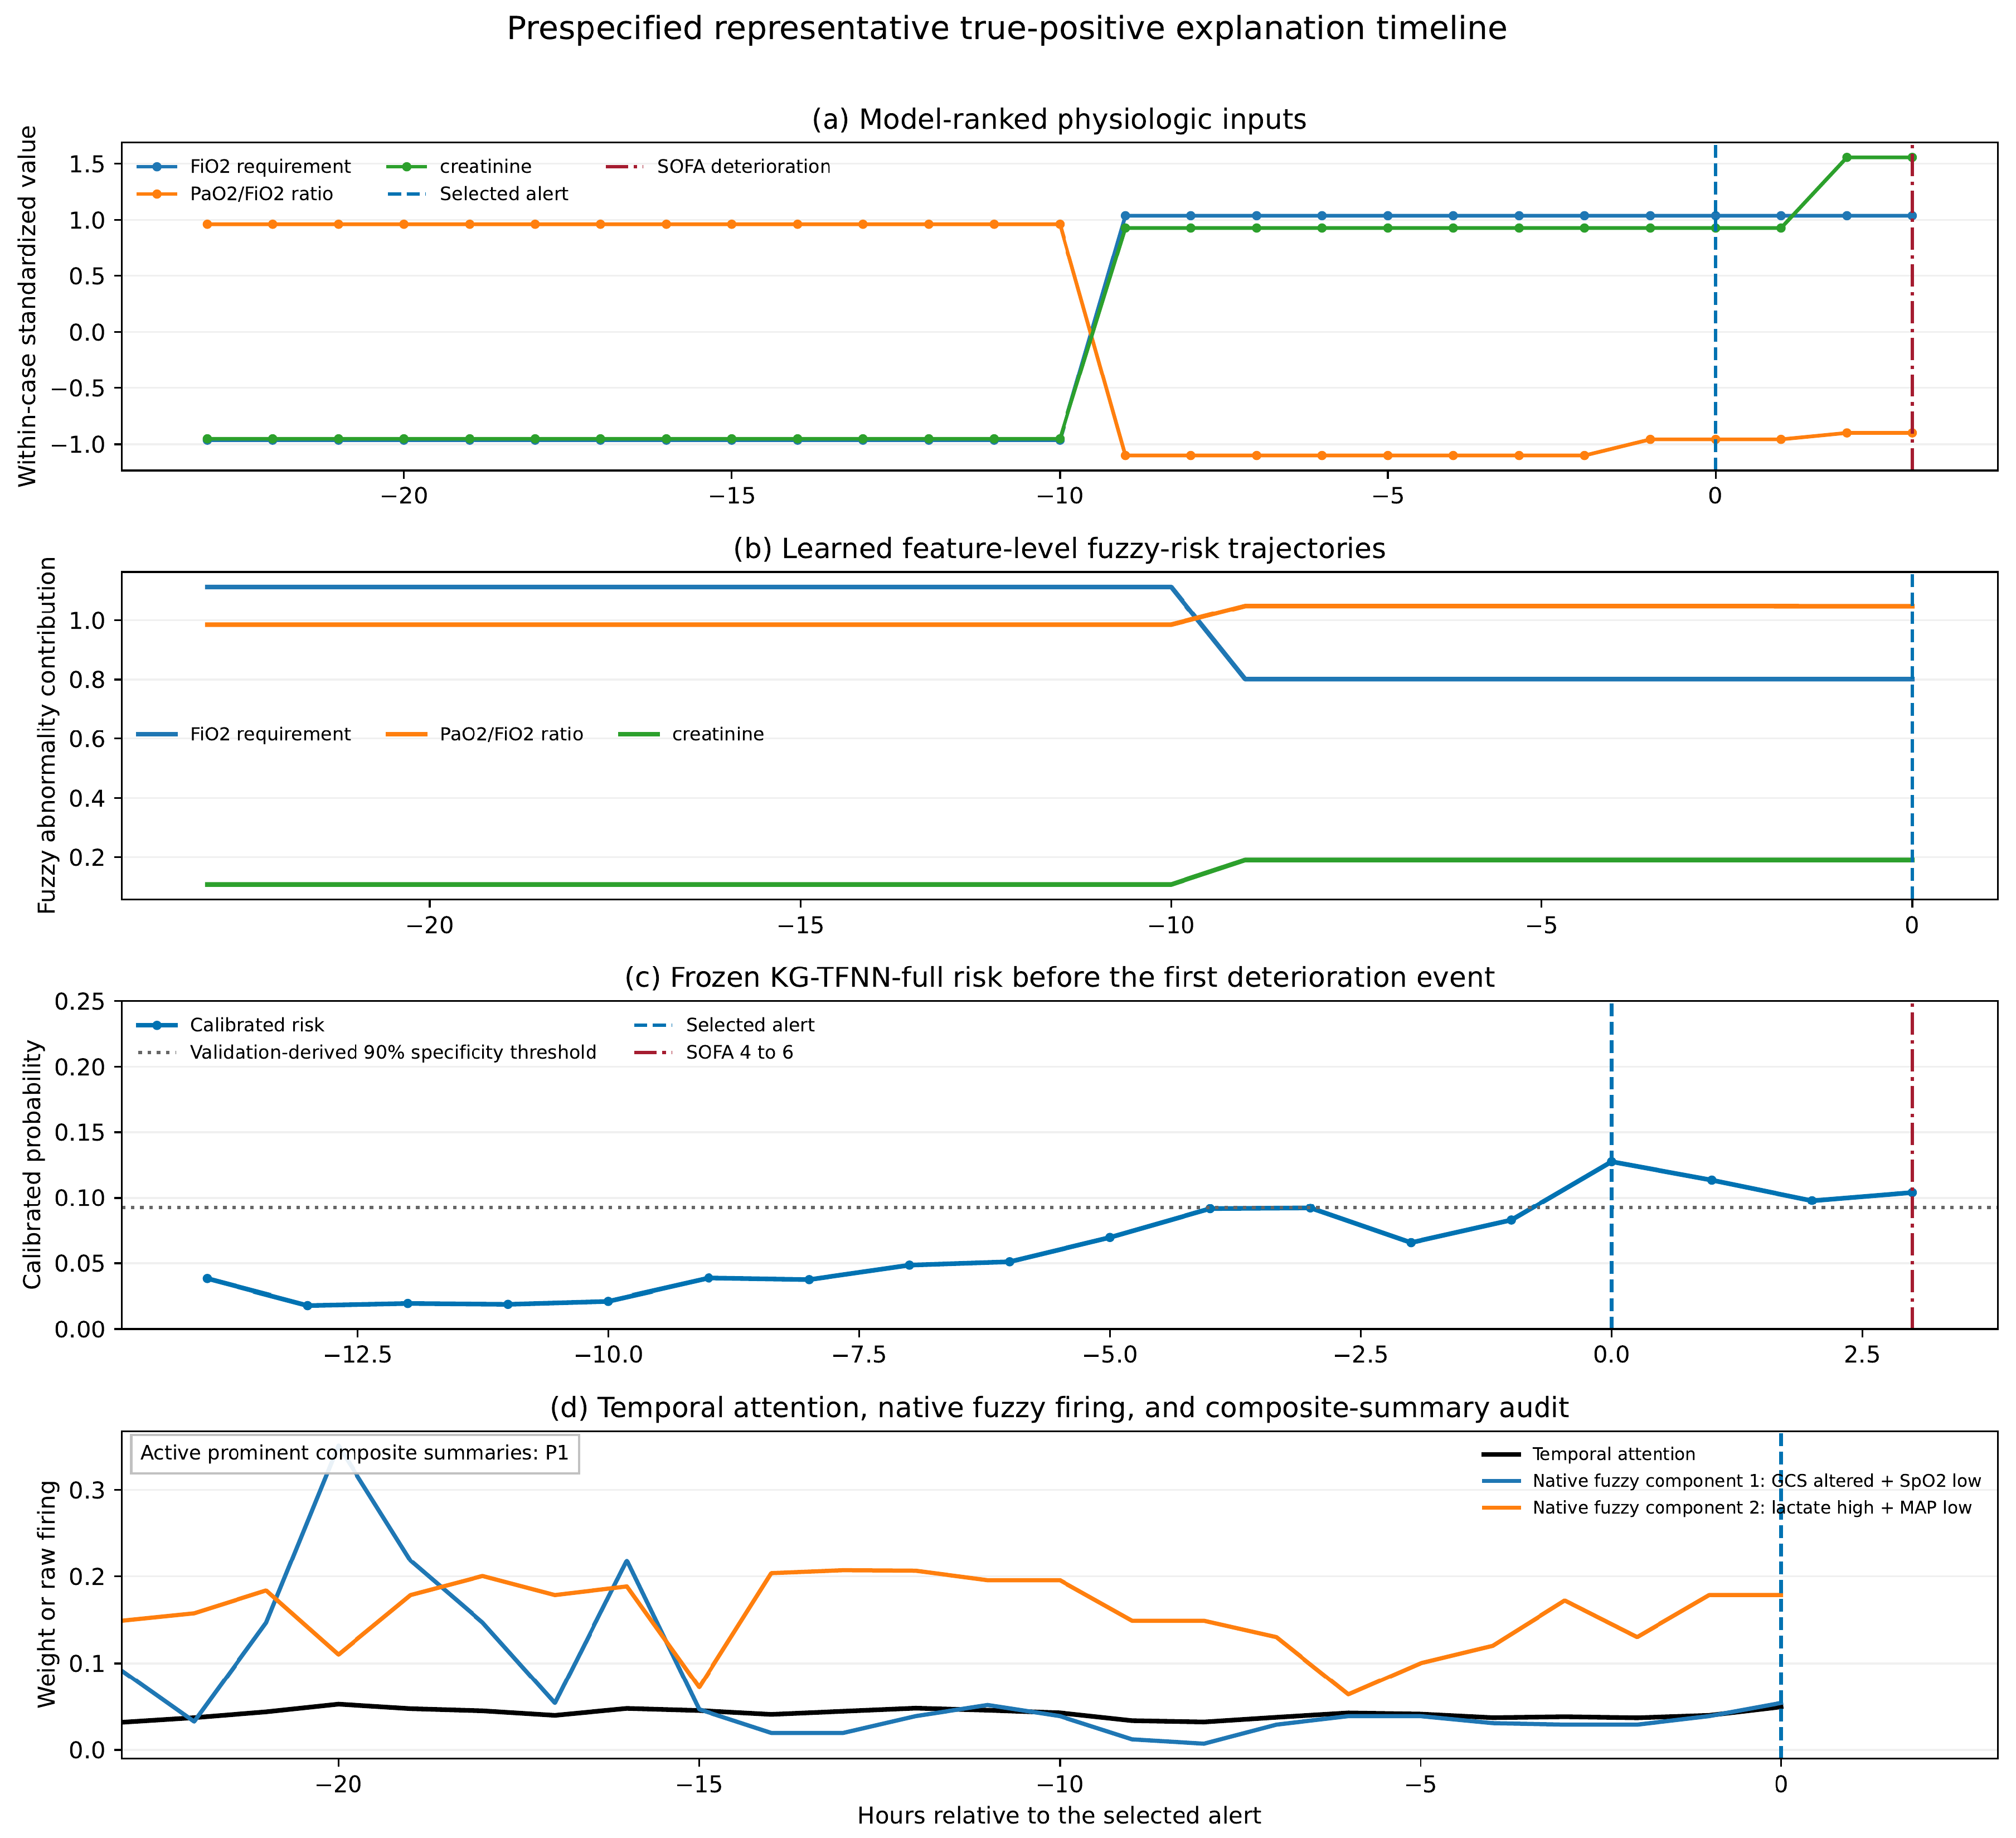
Figure 7.
Exploratory internal subgroup and external hospital heterogeneity. Left: MIMIC-IV subgroup AUROC with patient-clustered confidence intervals. Right: eICU-CRD hospital-level performance among sites with at least 100 patients and at least 50 positive and 50 negative windows. Subgroup analyses were exploratory and were not adjusted for multiplicity.
Figure 7.
Exploratory internal subgroup and external hospital heterogeneity. Left: MIMIC-IV subgroup AUROC with patient-clustered confidence intervals. Right: eICU-CRD hospital-level performance among sites with at least 100 patients and at least 50 positive and 50 negative windows. Subgroup analyses were exploratory and were not adjusted for multiplicity.
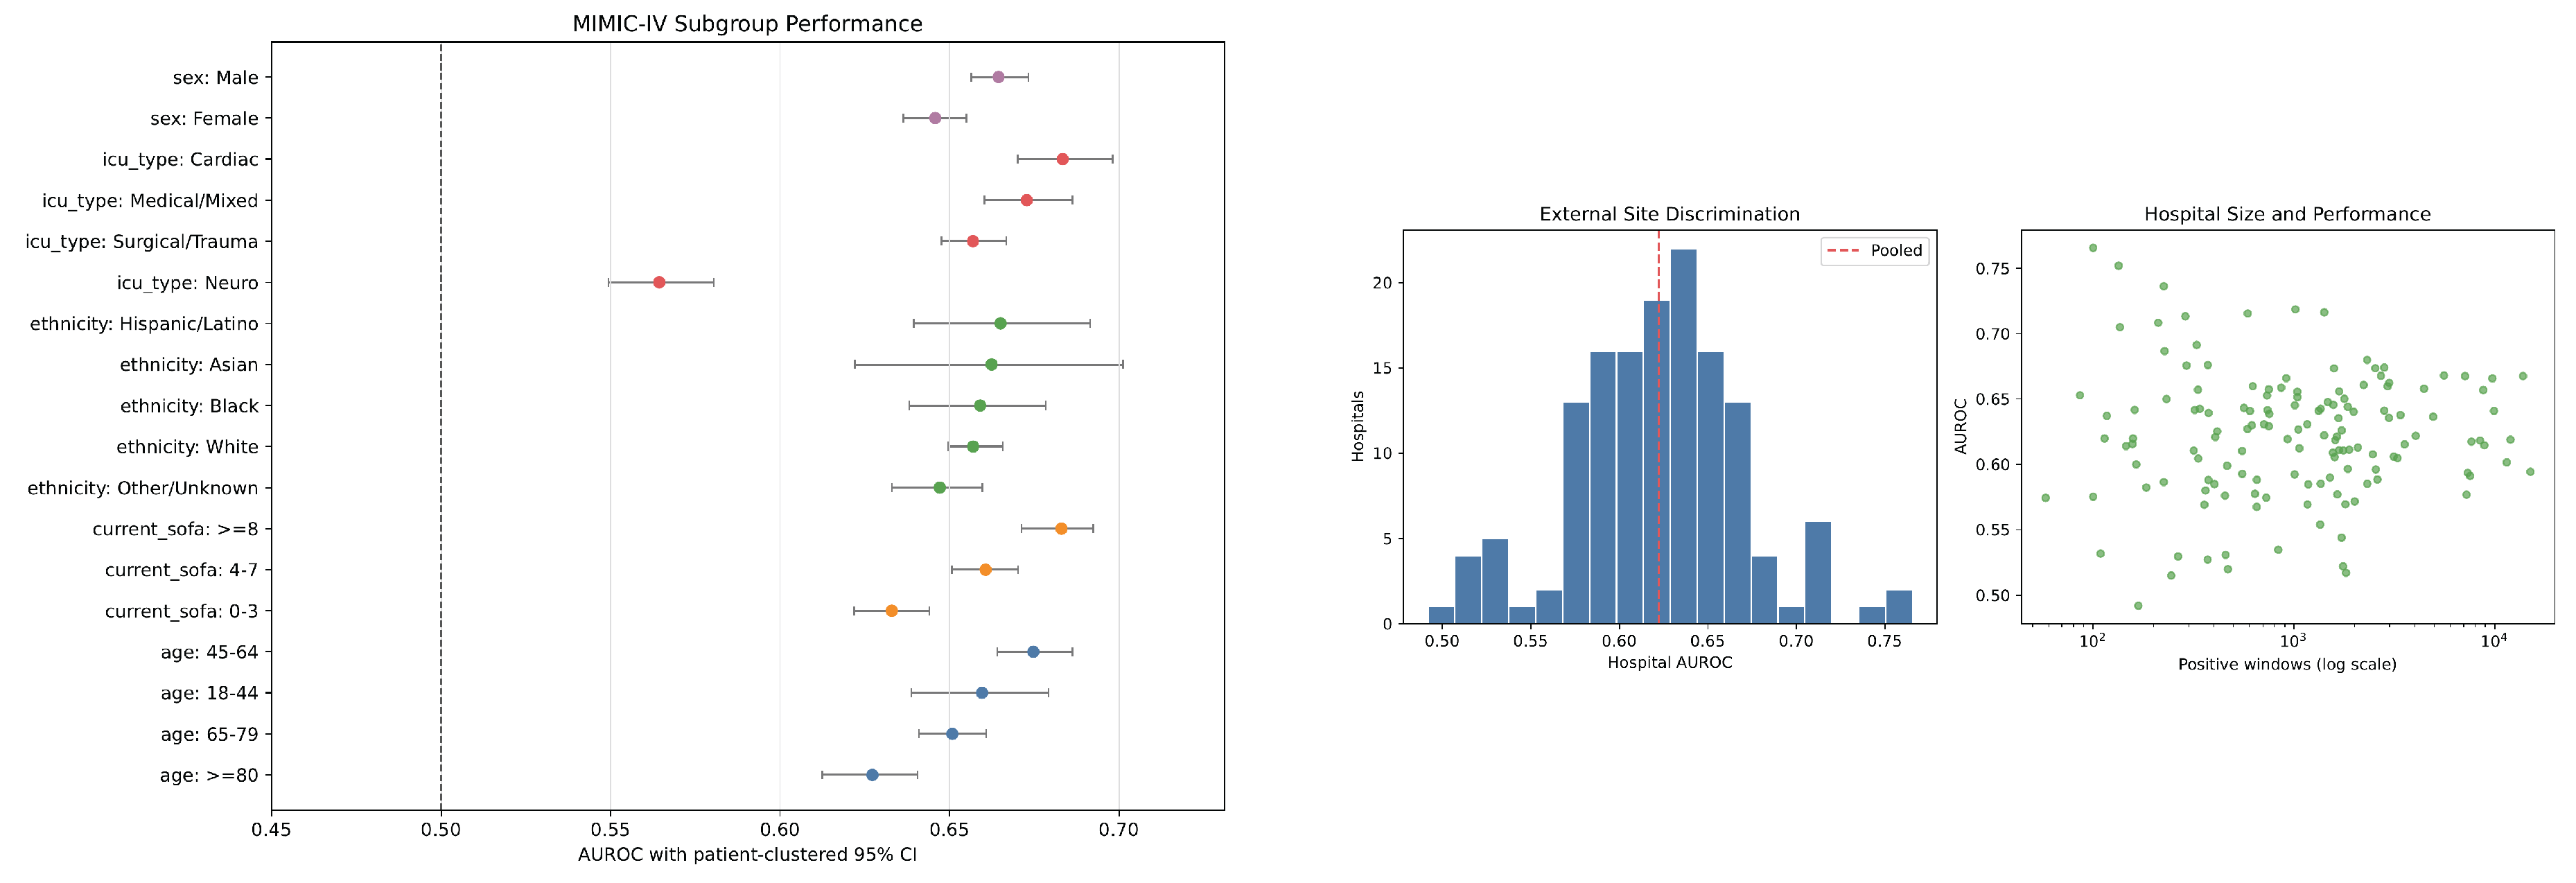
Table 1.
Cohort characteristics, eligible windows, and current-hour missingness before within-stay forward filling.
Table 1.
Cohort characteristics, eligible windows, and current-hour missingness before within-stay forward filling.
| Characteristic | MIMIC-IV train | MIMIC-IV validation | MIMIC-IV test | eICU-CRD external |
|---|---|---|---|---|
| Patients, n | 34,185 | 7,301 | 7,287 | 80,239 |
| ICU stays, n | 46,214 | 9,870 | 9,894 | 99,262 |
| Age, median [IQR], years | 67 [55–78] | 67 [55–77] | 67 [55–78] | 66 [54–77] |
| Female, n (%) | 14,803 (43.3) | 3,158 (43.3) | 3,162 (43.4) | 36,545 (45.5) |
| White, n (%) | 22,402 (65.5) | 4,827 (66.1) | 4,739 (65.0) | 61,943 (77.2) |
| Black, n (%) | 3,158 (9.2) | 651 (8.9) | 667 (9.2) | 9,069 (11.3) |
| Asian, n (%) | 1,015 (3.0) | 221 (3.0) | 218 (3.0) | 1,253 (1.6) |
| Hispanic, n (%) | 1,194 (3.5) | 260 (3.6) | 256 (3.5) | 2,945 (3.7) |
| Other/unknown, n (%) | 6,416 (18.8) | 1,342 (18.4) | 1,407 (19.3) | 5,029 (6.3) |
| ICU stay, median [IQR], days | 2.9 [1.9–5.1] | 2.8 [1.9–5.1] | 2.9 [1.9–5.2] | 2.8 [1.9–4.9] |
| Eligible windows, n | 3,843,400 | 819,573 | 830,839 | 6,215,890 |
| Positive windows, n (%) | 217,650 (5.7) | 47,638 (5.8) | 47,292 (5.7) | 294,949 (4.7) |
| Selected hourly missingness: MIMIC-IV / eICU-CRD (%) | ||||
| Heart rate | 6.1 / 3.5; respiratory rate 7.4 / 9.9; SpO2 8.0 / 7.8; FiO2 86.7 / 83.0 | |||
| Laboratory/organ variables | PaO2/FiO2 98.4 / 99.1; platelets 93.7 / 95.6; bilirubin 98.1 / 98.4; creatinine 93.1 / 94.9; lactate 96.3 / 99.0 | |||
Table 6.
Effect of temporal representation and observation-window length under the fixed 6-hour prediction horizon.
Table 6.
Effect of temporal representation and observation-window length under the fixed 6-hour prediction horizon.
| Representation | Observation window | AUROC | AUPRC |
|---|---|---|---|
| Explicit temporal FNN | 4 h | 0.6205 | 0.0942 |
| Explicit temporal FNN | 6 h | 0.6216 | 0.0941 |
| Explicit temporal FNN | 12 h | 0.6220 | 0.0943 |
| Explicit temporal FNN | 24 h | 0.6331 | 0.1060 |
| Sequence-only FNN | 24 h | 0.5780 | 0.0748 |
Values are means across three training seeds. The 95% seed intervals and implementation details are reported in Supplementary Table S5; these intervals are not patient-clustered confidence intervals.
Table 7.
SOFA outcome-definition, documentation-availability, and observed organ-component sensitivities on the MIMIC-IV test cohort.
Table 7.
SOFA outcome-definition, documentation-availability, and observed organ-component sensitivities on the MIMIC-IV test cohort.
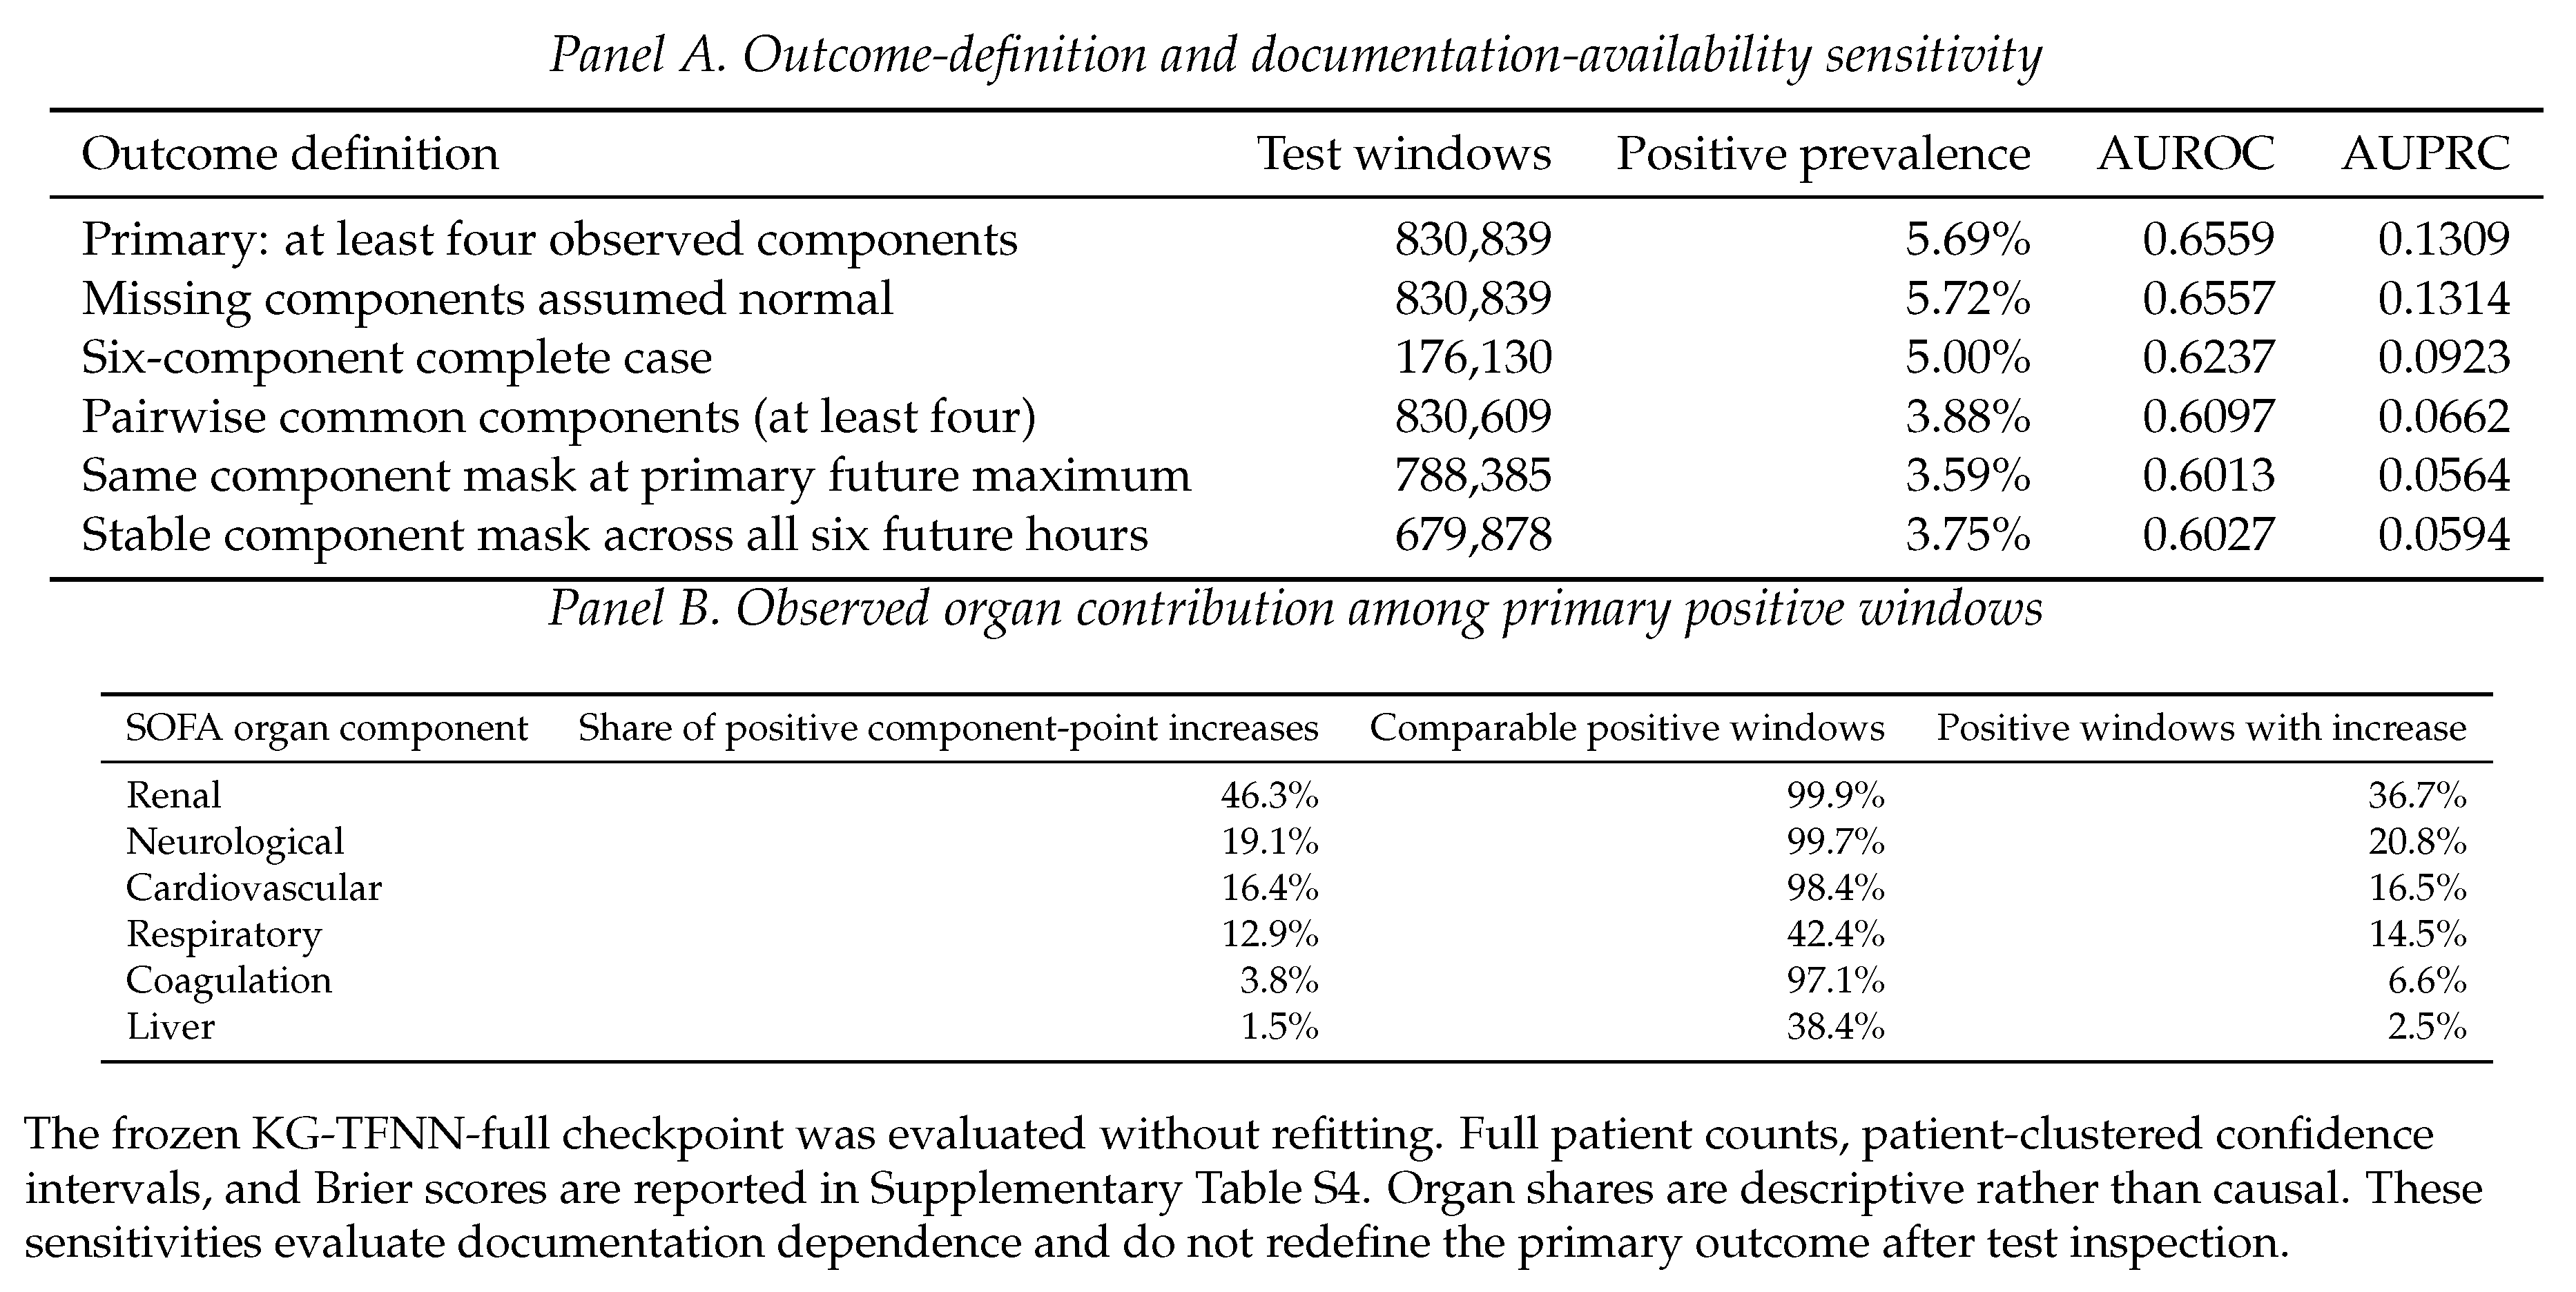
Table 8.
Validation-derived window operating points and MIMIC-IV event-level alarm burden. MIMIC-IV event analyses used the first evaluable event per stay and a 6-hour refractory period; eICU-CRD rows report frozen window-level transport only.
Table 8.
Validation-derived window operating points and MIMIC-IV event-level alarm burden. MIMIC-IV event analyses used the first evaluable event per stay and a 6-hour refractory period; eICU-CRD rows report frozen window-level transport only.
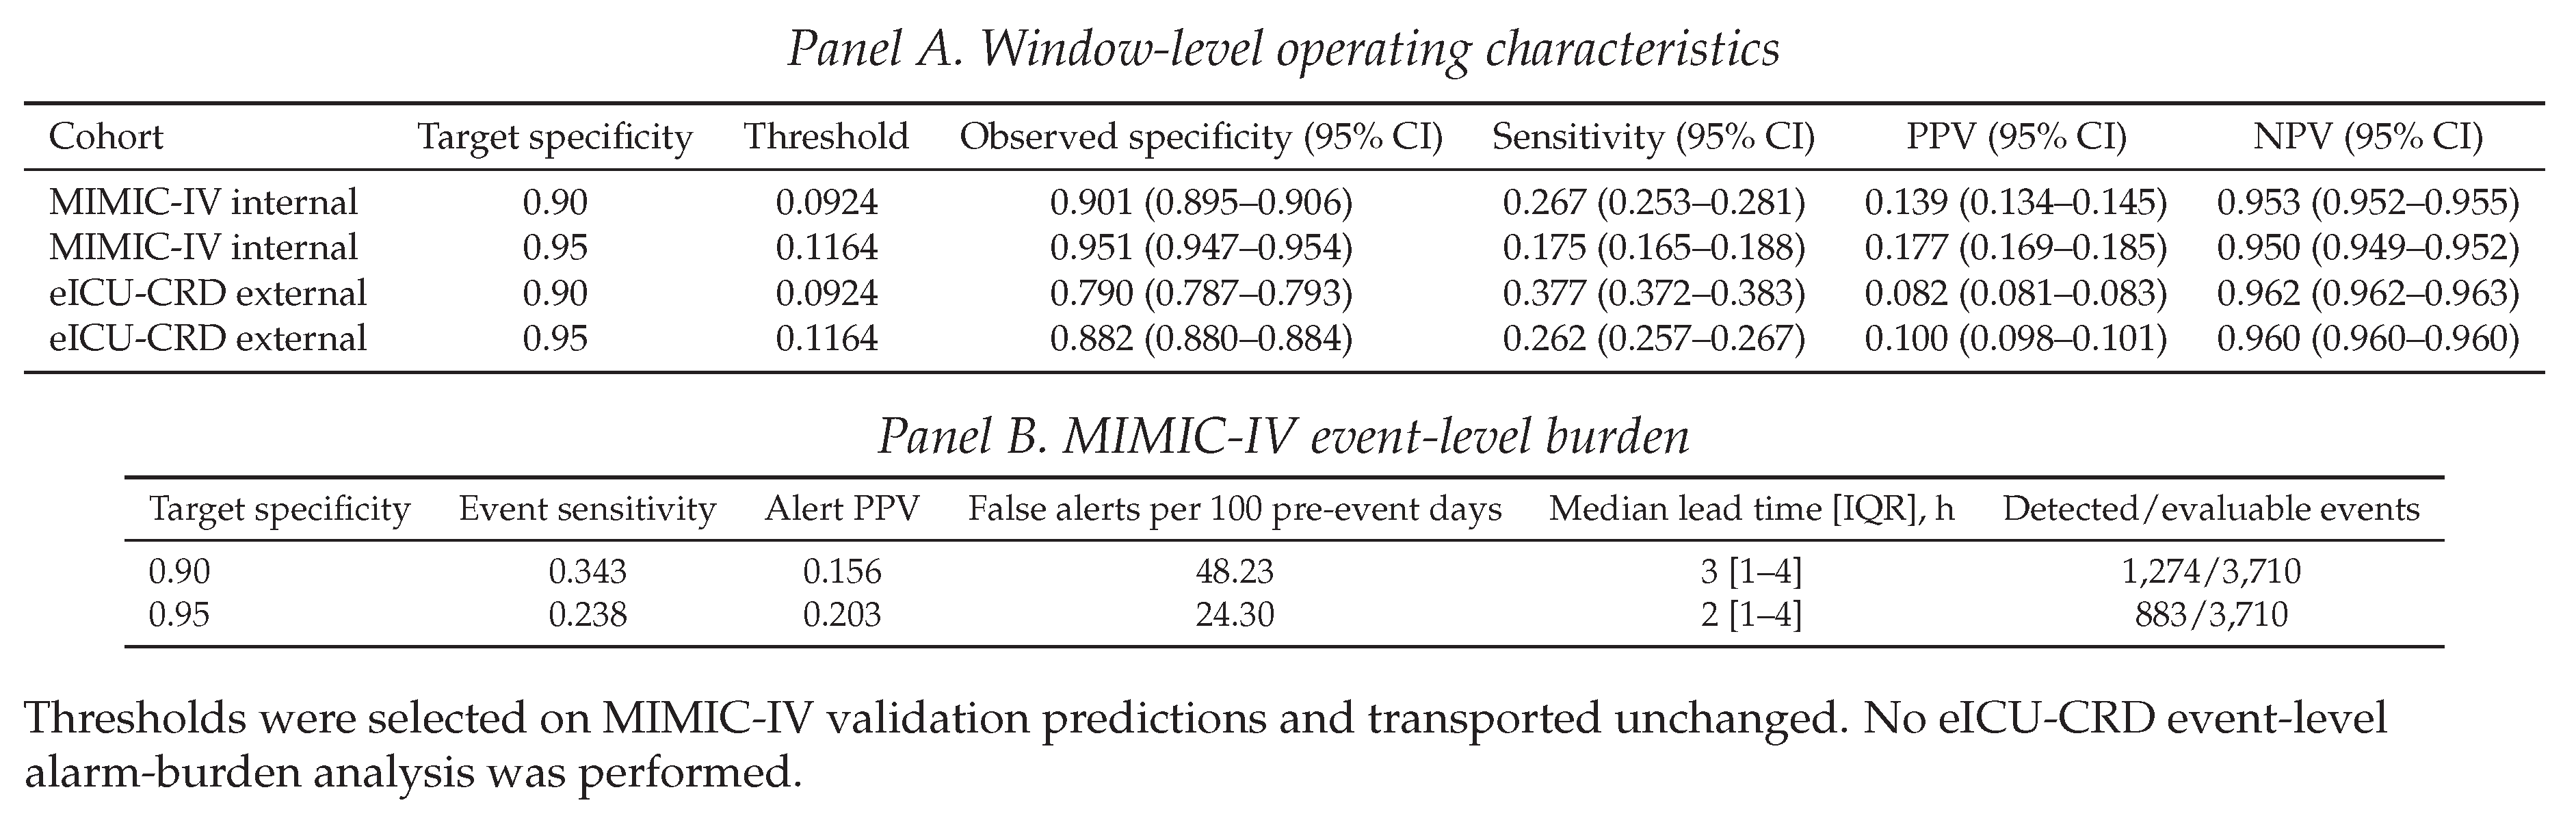
Table 9.
Hospital-level eICU-CRD sensitivity. Reportable hospitals had at least 100 patients and at least 50 positive and 50 negative windows; paired 1,000-replicate hospital-cluster bootstrap estimates used all 205 hospitals.
Table 9.
Hospital-level eICU-CRD sensitivity. Reportable hospitals had at least 100 patients and at least 50 positive and 50 negative windows; paired 1,000-replicate hospital-cluster bootstrap estimates used all 205 hospitals.
Disclaimer/Publisher’s Note: The statements, opinions and data contained in all publications are solely those of the individual author(s) and contributor(s) and not of MDPI and/or the editor(s). MDPI and/or the editor(s) disclaim responsibility for any injury to people or property resulting from any ideas, methods, instructions or products referred to in the content. |
© 2026 by the authors. Licensee MDPI, Basel, Switzerland. This article is an open access article distributed under the terms and conditions of the Creative Commons Attribution (CC BY) license (http://creativecommons.org/licenses/by/4.0/).
Copyright: This open access article is published under a Creative Commons CC BY 4.0 license, which permit the free download, distribution, and reuse, provided that the author and preprint are cited in any reuse.