

Submitted:
17 September 2026
Posted:
17 September 2026
You are already at the latest version
Abstract
Risk stratification in severe trauma remains a major clinical challenge: standard trauma scores (Injury Severity Score, ISS; Trauma and Injury Severity Score, TRISS) rely on anatomical and physiological data but lack metabolic components, potentially underestimating risk in haemodynamically compensated patients with underlying derangements. Alactic Base Excess (ABE) isolates the non-lactic fraction of metabolic acidosis by correcting base excess for lactate. We conducted a retrospective cohort study using the MIMIC-IV v3.1 database, including adult trauma patients with an ISS ≥16 and an arterial blood gas measurement within two hours of admission (n=134), to assess ABE’s independent and incremental prognostic value for in-hospital and 30-day mortality, handling missing covariates by multiple imputation (m=20). ABE was independently associated with in-hospital mortality after adjustment for age, New ISS (NISS), and mechanism of injury (odds ratio 0.84; 95% CI 0.745–0.946; p=0.004; AUC 0.643), and improved model fit beyond a clinical base model (p=0.002) and beyond TRISS (p=0.029), with no significant miscalibration. Findings were consistent for 30-day mortality and substantially stronger in a 60-minute sensitivity cohort (n=54; AUC 0.803; negative predictive value 95.5%). ABE offers modest incremental prognostic value beyond established trauma scores; its immediate availability from a routine blood gas positions it as a practical early adjunct at a point where no composite score is yet computable.
Keywords:
alactic base excess
; risk stratification
; mortality prediction
; intensive care
; metabolic acidosis
1. Introduction
Trauma is amongst the leading causes of avoidable death worldwide, responsible for approximately 4.4 million deaths—or roughly 8% of global mortality—and the leading cause of death in individuals aged 5–44 years [1].
Severely injured patients pose major challenges in the ICU, with rapidly evolving pathophysiological mechanisms making early and accurate risk stratification essential. Acid-base disturbances are amongst the most common and prognostically important problems observed in this patient group. Metabolic acidosis, driven by tissue hypoperfusion, is of particular clinical significance: it impairs myocardial contractility, reduces vasopressor response, and exacerbates coagulopathy [2].
Serum lactate and base excess (BE) are the two most widely used biochemical markers of metabolic derangement in major trauma. Both are routinely obtained from the first arterial blood gas (ABG) and have been independently validated as predictors of mortality, blood transfusion requirement, and organ failure in trauma and general care settings [4,5,6]. However, each provides an incomplete picture: lactate reflects the hypoxic component of acidosis but is confounded by adrenergic stimulation and impaired hepatic clearance. BE, on the other hand, integrates all metabolic acid-base contributions but cannot identify which process is responsible [7].
Alactic Base Excess (ABE), introduced by Gattinoni et al. in 2019, addresses this limitation by correcting BE for the quantifiable contribution of lactate [3]:
ABE (mmol/L) = Standard Base Excess (BE) + Lactate
Adding lactate to standard BE isolates the non-lactic component of metabolic acidosis, allowing identification of processes that might affect acid-base balance, such as hyperchloraemia from crystalloid resuscitation, unmeasured anion accumulation, and early renal bicarbonate loss. A persistently negative ABE signals metabolic derangements beyond haemorrhagic shock and may carry independent prognostic significance [3].
ABE predicts mortality in sepsis [8,9], mixed ICU shock [10], and acute myocardial infarction [11]. To date, however, no study has evaluated ABE in a specifically defined severe trauma cohort, despite substantially different acid-base pathophysiology. Current trauma scoring systems, such as the Injury Severity Score (ISS), New ISS (NISS), Revised Trauma Score (RTS), and Trauma and Injury Severity Score (TRISS), contain no metabolic components, representing a recognised gap in early risk assessment [12,13].
The goals of this study were to: (1) determine whether ABE at admission is an independent predictor of in-hospital (primary outcome) and 30-day mortality (secondary outcome) in severely injured trauma ICU patients, and compare its discriminatory performance against established trauma scores; and (2) assess whether ABE provides incremental prognostic value beyond a clinical base model. The main aim is biomarker evaluation; multivariable regression serves as the analytical framework. As a prediction model development analysis reported in accordance with TRIPOD+AI, no external validation cohort was available.
2. Materials and Methods
2.1. Study Design and Setting
This retrospective, observational cohort study used the Medical Information Mart for Intensive Care IV (MIMIC-IV) v3.1 database, which contains deidentified clinical data from adult ICU admissions at the Beth Israel Deaconess Medical Center (BIDMC), a tertiary academic trauma centre in Boston, MA, USA, spanning 2008–2022 [14]. The observational aspects of this study adhere to the STROBE reporting guidelines for observational research [15]. Prediction model development is reported in accordance with the TRIPOD+AI statement for transparent reporting of multivariable prediction models [16].
2.2. Ethical Approval
MIMIC-IV data collection was approved by the Institutional Review Board (IRB) of BIDMC and MIT (Protocol No. 2001-P-001699). All records are fully de-identified prior to release. PhysioNet access requires credentialed registration and CITI training. Local ethics review at the George Emil Palade University of Medicine, Pharmacy, Science and Technology of Târgu Mureș was waived on the basis of the retrospective, fully de-identified nature of the data. The study was conducted in accordance with the principles of the Declaration of Helsinki [17].
2.3. Participants
Adult patients were included if they: (1) were admitted to an ICU during the index hospitalisation; (2) had an ABG and serum lactate measurement within two hours of hospital admission; (3) had at least one trauma-related ICD-10 diagnosis code (S00–T88); and (4) had an ISS ≥16. Patients with pre-existing conditions significantly affecting acid-base homeostasis were excluded (full ICD-10-coded list: Table S1). Patients with missing ABE components or primary outcome data were also excluded.
2.4. Data Processing
Demographic, laboratory, vital sign and outcome data were extracted from MIMIC-IV v3.1 using structured SQL queries via Google BigQuery, linking relational tables by hospital admission identifier (hadm_id). Where multiple measurements fell within the admission window, the earliest recorded value was retained. Prior to analysis, lactate values were verified against raw database exports to detect locale-specific date-format artefacts (e.g., numeric values auto-converted to date strings in locale-Excel environments). Similarly, values inconsistent with physiologically plausible lactate concentrations were flagged as artefacts. Affected records were excluded from the 60-minute sensitivity cohort. Extraction queries are provided in the Supplementary Materials (File S2). No study protocol was prospectively prepared, and the study was not pre-registered.
Generative artificial intelligence (Claude Sonnet 4.6, Anthropic, San Francisco, CA, USA) was used to assist with drafting SQL extraction queries, R code generation, and preliminary bias assessment during data processing and analysis. All AI-assisted outputs were reviewed and validated by the authors, who take full responsibility for the content and accuracy of the analysis.
2.5. Variables and ABE Calculation
ABE was calculated as the sum of BE and lactate as per Equation (1) [3]. Mechanism of injury was classified as blunt, penetrating or other/unknown based on the primary trauma ICD-10 diagnosis code.
ISS and NISS were calculated via the ICDPIC-R package (v4.0) in R [18,19]. RTS was derived from admission GCS, SBP, and respiratory rate. TRISS probability of survival was calculated using the Boyd et al. (1987) coefficients [20], with GCS values derived from multiply imputed datasets for participants with missing admission data.
2.6. Outcomes
The primary outcome was in-hospital mortality, determined from discharge disposition data. 30-day mortality was the secondary outcome, combining in-hospital death records with post-discharge mortality data in MIMIC-IV to capture early post-discharge deaths attributable to the index injury.
2.7. Statistical Analysis
Continuous variables are presented as median [IQR], categorical variables as absolute frequencies and percentages. Comparisons between survivors and non-survivors used the Mann-Whitney U test and chi-squared or Fisher’s exact test, as appropriate.
Discrimination was assessed by ROC curve analysis with 95% CIs by DeLong’s method [21]. Standardised mean differences were calculated for key metabolic markers. The Youden index identified the optimal ABE threshold; sensitivity, specificity, PPV, and NPV were reported alongside. Pairwise AUC comparisons used DeLong’s test.
No formal sample size calculation was performed. All eligible patients within MIMIC-IV v3.1 were included (n=134; 39 primary outcome events). The events-per-variable ratio was 7.8 (five parameters: ABE, age, NISS, and two mechanism dummy variables), at the lower boundary of conventional recommendations for logistic regression stability [22].
Missing covariate data were handled by multiple imputation by chained equations (MICE; 20 datasets, predictive mean matching), pooled by Rubin’s rules [23]. GCS was missing in 47% of participants (predominantly intubation-related) and SBP in 10.4%. All primary predictors and outcome variables were complete.
All continuous predictors were entered without transformation; mechanism of injury as a three-level categorical variable (blunt as reference). Predictor sets were specified a priori [24]. No stepwise selection was performed. Two prespecified sensitivity analyses assessed consistency.
Univariable logistic regression was performed before constructing three multivariable logistic regression models. Model 1 included ABE, age, ISS, and mechanism of injury. Model 2 substituted NISS for ISS, and, given the recognised superiority of NISS in capturing multiple severe injuries, was designated the primary model [25,26]. Model 3 further built on Model 2 by additionally incorporating serum lactate. Given the Hosmer-Lemeshow test’s limited statistical power at small sample sizes [27], model calibration was additionally assessed by Brier score, CITL, and calibration slope.
Model calibration was additionally assessed by the Brier score, calibration-in-the-large (CITL), and calibration slope with 95% bootstrap CI (500 iterations). A LOESS calibration plot is provided in the Supplementary Materials (Figure S1). Bootstrap optimism correction (500 iterations, Harrell’s method) was applied to the primary model AUC to account for overfitting in the development dataset.
Incremental value of ABE beyond the base model (age + NISS + mechanism) was assessed by likelihood ratio test (LRT), net reclassification index (NRI), and integrated discrimination improvement (IDI) (500-iteration bootstrap, 95% CIs).
Integration of ABE into TRISS was assessed by adding ABE to a logistic model incorporating TRISS probability of survival, calculated using Boyd et al. (1987) coefficients. Incremental improvement was assessed by LRT, NRI and IDI [28].
Two sensitivity analyses were performed: one restricting ABE sampling to within 60 minutes of admission, and one excluding patients with a concurrent sepsis diagnosis (ICD-10: A40/41, R6520/R6521).
A two-tailed p<0.05 was considered statistically significant throughout. All analyses were performed in R (v4.5.1; key packages: mice, pROC, logistf, gtsummary, ResourceSelection, readxl).
3. Results
3.1. Cohort Characteristics
Of 134 patients meeting inclusion criteria (Figure S2), 75.4% were male, with median age of 47 years (IQR 29–64). Blunt trauma predominated (82.1%), mainly composed of motor vehicle collisions (n=50, 37.3%) and falls (n=44, 32.8%). Median ISS was 25 (IQR 17–32) and NISS 34 (IQR 25–41). In-hospital mortality was 29.1% (n=39) and 30-day mortality was 31.3% (n=42). Baseline characteristics are presented in Table 1.
3.2. ABE Distribution, Threshold Analysis and Univariable Performance
ABE ranged from −14.6 to +6.7 mmol/L across the cohort (median −2.2 mmol/L, IQR −5.0 to +0.3), with a left-skewed distribution consistent with a predominance of metabolic acidosis. Non-survivors had significantly lower ABE than survivors (median −3.5 [IQR −6.1 to −1.5] vs. −1.2 [IQR −4.4 to +0.5] mmol/L; p=0.010). The standardised mean difference for ABE (0.553) was smaller than for lactate (1.380) and BE (1.027), indicating that ABE carries a weaker univariable signal in this population.
Using the Youden index, the optimal ABE threshold for in-hospital mortality prediction was −1.45 mmol/L (sensitivity 76.9%, specificity 52.6%, PPV 40%, NPV 84.7%), consistent for 30-day mortality (NPV 81.4%).
Univariable analysis confirmed ABE as a significant predictor of in-hospital mortality (OR 0.870 per mmol/L, 95% CI 0.787–0.962, p=0.007).
3.3. Multivariable Analysis
In the primary multivariable model (ABE + age + NISS + mechanism), ABE was independently associated with in-hospital mortality (OR 0.840 per mmol/L, 95% CI 0.745–0.946; p=0.004; Table 2). Results were consistent for Model 1 (OR 0.842, p=0.004). When lactate was added as an additional covariate (Model 3), ABE was no longer independently associated with either outcome (OR 0.982, p=0.812), while lactate remained strongly significant (OR 1.631 per mmol/L, p<0.001), indicating that the prognostic signal of ABE is substantially mediated through its lactate component. All findings were consistent for 30-day mortality (primary model: OR 0.841, 95% CI 0.747–0.946; p=0.004).
All three models demonstrated adequate calibration (Hosmer-Lemeshow: Model 1 p=0.467; Model 2 p=0.843; Model 3 p=0.901; complete case, n=134). For the primary model, Brier score was 0.145 (scaled Brier 0.295), calibration-in-the-large was 0.000 (95% CI −0.455 to 0.437), and calibration slope was 1.000 (95% CI 0.650 to 1.413), confirming no systematic over- or under-prediction. A LOESS-smoothed calibration plot is provided in the Supplementary Materials (Figure S1).
The predicted probability of death was calculated as:
P(death) = 1 / (1 + e⁻ᴸ)
where L = -7.1885—0.1747(ABE) + 0.0517(Age) + 0.0792(NISS) + 1.8620(Pen) + 1.7002(Other)
with:
- ABE in mmol/L
- Age in years
- NISS in points
- Pen = 1 if mechanism is penetrating, 0 if not
- Other = 1 if mechanism is Other/Unknown, 0 if not
3.4. Discriminatory Performance and Incremental Value
ABE achieved AUC of 0.643 (95% CI 0.535–0.750) for in-hospital mortality, which was comparable to NISS (0.675; p=0.655), and superior to ISS (0.594; p=0.493), though significantly inferior to lactate (0.795; p=0.001) and BE (0.731; p<0.001). Full results are shown in Figure 1.
Adding ABE to the base clinical model improved the AUC from 0.799 to 0.826 (p=0.360). LRT confirmed significant incremental model fit improvement (LRT p=0.002), with NRI 0.681 (95% CI 0.346–1.015; p=0.002) and IDI 0.057 (p=0.020). Secondary outcome analyses were consistent (30-day: LRT p=0.002; NRI 0.590, p=0.002; IDI 0.054, p=0.024). Full metrics are shown in Table 3.
Bootstrap optimism correction (500 iterations, Harrell’s method) yielded adjusted AUCs of 0.793 for the primary model (apparent AUC 0.826; mean optimism 0.033) and 0.775 for the base model (apparent AUC 0.799; mean optimism 0.024), with an optimism-corrected ΔAUC attributable to ABE of 0.018.
3.5. TRISS Integration
TRISS probability of survival was calculated for all 134 patients using the Boyd et al. (1987) coefficients (AUC 0.717, 95% CI 0.628–0.806). Adding ABE increased AUC to 0.727 (DeLong p=0.727). Likelihood ratio testing confirmed significant incremental improvement (LRT p=0.029), IDI was 0.039 (p=0.040), and NRI was 0.328 (p=0.072). Results were consistent for 30-day mortality (LRT p=0.041; NRI 0.291, p=0.12; IDI 0.033, p=0.036). Primary outcome findings are summarised in Table 4.
3.6. Sensitivity Analysis
Of 61 patients (45.5%) with ABG values obtained within 60 minutes of admission, 54 had valid ABE after excluding seven date-format artefacts. In this early-measurement subset, ABE performance improved substantially: AUC 0.803 (95% CI 0.686–0.920), OR 0.610 per mmol/L (95% CI 0.409–0.798; p<0.001), and NPV 95.5% at an optimal threshold of −2.85 mmol/L (Figure S3). The in-hospital mortality rate (29.5%) was consistent with the primary cohort, suggesting comparable baseline mortality risk.
A secondary sensitivity analysis excluding the 8 patients with concurrent sepsis-related diagnoses (A40/A41, R6520, R6521) produced virtually identical results (n=126; AUC 0.637, 95% CI 0.528–0.747; OR 0.844, 95% CI 0.749–0.952; p=0.006; optimal threshold unchanged at −1.45 mmol/L), confirming that concurrent sepsis coding did not materially influence the primary findings.
4. Discussion
ABE at hospital admission was independently associated with in-hospital mortality in severely injured trauma ICU patients (age, NISS, and mechanism adjusted), with consistent findings for 30-day mortality. To our knowledge, this is the first ABE evaluation in a cohort specifically defined by severe traumatic injury (ISS ≥16).
These findings extend the existing ABE literature, currently dominated by sepsis [8,9,10], to the trauma setting. The signal strengthened substantially in the early-ABG sensitivity cohort (AUC 0.803, OR 0.610, NPV 95.5%), consistent with the rationale that earlier sampling effectively precedes resuscitation-related acid-base modifications.
The collinearity finding—ABE losing independence when lactate is added to the model—follows structurally from ABE’s mathematical derivation: when lactate is the primary driver of metabolic acidosis in haemorrhagic shock, BE and lactate necessarily co-vary, making them collinear by definition. ABE therefore primarily functions as a convenient composite marker rather than an independent signal of non-lactic acidosis in the acute trauma phase.
The ROC hierarchy (lactate outperforming ABE [AUC 0.795 vs. 0.643]) follows directly from this collinearity. More clinically meaningful is ABE’s comparison with anatomical scores: despite derivation from a single bedside calculation, it performed comparably to NISS (0.675) and outperformed ISS (0.594). Performance was broadly comparable to that in mixed shock ICU populations (AUC 0.687 [10]), suggesting that the prognostic signal is preserved but not enhanced in trauma.
The incremental value analysis supports a specific and practical role for ABE. While ABE did not significantly improve AUC beyond the base model by DeLong’s test, LRT confirmed genuine improvement in model fit (p=0.002), and the IDI (0.057, p=0.020) demonstrated that predicted risks were better separated between survivors and non-survivors when ABE was included. The dissociation between DeLong and LRT results suggests ABE improves probability separation in the intermediate range without re-ranking patients at the extremes—a meaningful improvement for clinical decision-making even where overall discrimination is unchanged. Net reclassification improvement was also significant (NRI 0.681, p=0.002), driven by improved classification in both event and non-event groups.
While LRT confirmed incremental improvement in TRISS model fit (p=0.029) and IDI demonstrated better probability separation (0.039; p=0.040), NRI did not reach significance (0.328; p=0.072), reflecting the limited statistical power in this cohort. Critically, ABE integration did not impair TRISS calibration (χ²=4.40, p=0.819), preserving the score’s prognostic architecture [29]. These TRISS integration findings require external validation before clinical implementation.
The critical clinical context for ABE is timing. ISS requires complete AIS coding and cannot be calculated in the first 30–60 minutes of a major trauma resuscitation. TRISS additionally requires an accurate GCS, which is unavailable in most intubated patients—a substantial proportion of severely injured ICU admissions [12]. ABE is available from the first blood draw, requiring no additional investigations, no specialist coding, and no computation beyond what the blood gas analysis already provides. The NPV of 84.7% at the optimal threshold (95.5% in the one-hour cohort) supports its potential utility as a rapid rule-out tool at a point where no other validated composite score is yet computable.
4.1. Strengths and Limitations
Strengths include MIMIC-IV’s publicly available data, complete primary variable availability, MICE for missing covariates, and four complementary incremental value metrics beyond AUC alone. The sensitivity analyses provide convergent validation.
Limitations include a single-centre cohort (n=134) limiting subgroup analyses and generalisability. BIDMC’s specific resuscitation protocols may not represent district-level or resource-limited settings. Performance estimates derive from the development dataset, and without external validation, some optimism in discrimination and calibration cannot be excluded. GCS was missing in 47% of patients due to intubation. TRISS coefficients predate modern damage control resuscitation. Patients sampled within 60 minutes may represent a higher-acuity subgroup, partly explaining the stronger discriminatory performance in that cohort. Acute alcohol intoxication and acute kidney injury were not applied as exclusion criteria. The former may alter ABE through ethanol-mediated impairment of lactate oxidation and alcoholic ketoacidosis in a proportion of patients, though systematic identification is impractical in MIMIC-IV and its high prevalence in major trauma limits generalisability of any exclusion. The latter was deliberately retained as a direct consequence of haemorrhagic shock rather than a pre-existing confounder, though it may independently contribute to ABE depression in the most severely injured patients. No formal analysis of model fairness across sociodemographic subgroups was conducted. The sample size precluded stratified performance estimates, and the BIDMC derivation cohort may not represent demographic diversity across trauma populations. ABE should be interpreted as a marker of physiological derangement, not a therapeutic target.
5. Conclusions
ABE at hospital admission was independently associated with in-hospital mortality in severely injured trauma ICU patients, with discriminatory performance comparable to established anatomical scoring systems as a standalone bedside marker, and adequate calibration across all tested models. Its prognostic signal is substantially attributable to the lactate component, positioning ABE as a convenient composite variable rather than an indicator of a distinct physiological process. The marker’s primary clinical value lies in its immediacy—calculable from a routine ABG before ISS or TRISS can be determined—and its NPV-based utility for early risk stratification. Prospective, multicentre validation in larger, geographically diverse cohorts is the essential next step.
Supplementary Materials
The following supporting information can be downloaded at the website of this paper posted on Preprints.org, Table S1: Exclusion diagnoses with ICD-10-CM codes and rationale; Figure S1: LOESS-smoothed calibration plot for the primary model; Figure S2: Participant flow diagram; Figure S3: Comparison of ABE discriminatory performance, primary versus 60-minute sensitivity cohort; File S1: R analysis script; File S2: SQL extraction queries; File S3: STROBE checklist; File S4: TRIPOD+AI checklist.
Author Contributions
Conceptualization, F.J.S. and O.E.B.; Methodology, F.J.S.; Software, F.J.S.; Validation, O.E.B.; Formal Analysis, F.J.S.; Investigation, F.J.S.; Data Curation, F.J.S.; Writing—Original Draft Preparation, F.J.S.; Writing—Review and Editing, O.E.B. and L.A.; Visualization, F.J.S.; Supervision, L.A. and O.E.B. All authors have read and agreed to the published version of the manuscript.
Funding
This research received no external funding. The authors intend to apply for open-access publishing fee support from the George Emil Palade University of Medicine, Pharmacy, Science and Technology of Târgu Mureș, Romania.
Institutional Review Board Statement
The study was conducted in accordance with the Declaration of Helsinki. MIMIC-IV data collection was approved by the Institutional Review Board of the Beth Israel Deaconess Medical Center and the Massachusetts Institute of Technology (Protocol No. 2001-P-001699, approved 2001); all records are fully de-identified prior to release. Ethical review at the George Emil Palade University of Medicine, Pharmacy, Science and Technology of Târgu Mureș was waived given the retrospective, fully de-identified nature of the data.
Informed Consent Statement
Patient consent was waived by the Institutional Review Board of the Beth Israel Deaconess Medical Center, as the study used a fully de-identified, publicly available secondary database and does not include any individually identifiable data, images, or other personal details.
Data Availability Statement
Restrictions apply to the availability of these data. Data were obtained from PhysioNet and are available at https://physionet.org/content/mimiciv/3.1/ with the permission of the MIMIC-IV data use agreement, following completion of required CITI training and credentialed registration. The R analysis script and SQL extraction queries used to generate and analyze the dataset for this study are available in the Supplementary Materials (Files S1 and S2).
Acknowledgments
Parts of this research were presented at the Marisiensis Congress 2026 and the UMFST-UMCH Research Days 2026. This article is a revised and expanded version of a paper entitled “Integration of Alactic Base Excess into Established Trauma Systems: Improving Early Risk Assessment in ICU Patients”, which was presented at Marisiensis Congress 2026, Targu Mures, 05/2026 [31].
Conflicts of Interest
The authors declare no conflicts of interest.
Abbreviations
The following abbreviations are used in this manuscript:
| ABE | Alactic base excess |
| ABG | Arterial blood gas |
| AI | Artificial intelligence |
| AIS | Abbreviated Injury Scale |
| AUC | Area under the receiver operating characteristic curve |
| BE | Base excess |
| BIDMC | Beth Israel Deaconess Medical Center |
| CI | Confidence interval |
| CITI | Collaborative Institutional Training Initiative |
| CITL | Calibration-in-the-large |
| CONSORT | Consolidated Standards of Reporting Trials |
| GCS | Glasgow Coma Scale |
| ICD-10 | International Classification of Diseases, 10th Revision |
| ICDPIC-R | International Classification of Diseases Programs for Injury Categorization (R package) |
| IDI | Integrated discrimination improvement |
| IQR | Interquartile range |
| IRB | Institutional Review Board |
| ISS | Injury Severity Score |
| LOESS | Locally estimated scatterplot smoothing |
| LOS | Length of stay |
| LRT | Likelihood ratio test |
| MICE | Multiple imputation by chained equations |
| MIMIC-IV | Medical Information Mart for Intensive Care IV |
| MIT | Massachusetts Institute of Technology |
| NISS | New Injury Severity Score |
| NPV | Negative predictive value |
| OR | Odds ratio |
| PPV | Positive predictive value |
| ROC | Receiver operating characteristic |
| RTS | Revised Trauma Score |
| SBP | Systolic blood pressure |
| SQL | Structured Query Language |
| STROBE | STrengthening the Reporting of OBservational studies in Epidemiology |
| TRIPOD+AI | Transparent Reporting of a multivariable prediction model for Individual Prognosis Or Diagnosis + Artificial Intelligence |
| TRISS | Trauma and Injury Severity Score |
References
- World Health Organization. Injuries and Violence; WHO Fact Sheet; WHO: Geneva, Switzerland, 2024; Available online: https://www.who.int/news-room/fact-sheets/detail/injuries-and-violence (accessed on 24 August 2026).
- Pape, H.C.; Moore, E.E.; McKinley, T.; Sauaia, A. Pathophysiology in patients with polytrauma. Injury 2022, 53, 2400–2412. [Google Scholar] [CrossRef] [PubMed]
- Gattinoni, L.; Vasques, F.; Camporota, L.; et al. Understanding lactatemia in human sepsis: potential impact for early management. Am. J. Respir. Crit. Care Med. 2019, 200, 582–589. [Google Scholar] [CrossRef] [PubMed]
- Baxter, J.; Cranfield, K.R.; Clark, G.; et al. Do lactate levels in the emergency department predict outcome in adult trauma patients? A systematic review. J. Trauma Acute Care Surg. 2016, 81, 555–566. [Google Scholar] [CrossRef] [PubMed]
- Ibrahim, I.; Chor, W.P.; Chue, K.M.; et al. Is arterial base deficit still a useful prognostic marker in trauma? A systematic review. Am. J. Emerg. Med. 2016, 34, 626–635. [Google Scholar] [CrossRef] [PubMed]
- Gutiérrez, H.B.; Arteaga Concepción, Y.; Soneira Pérez, J.; Díaz Lara, Y.; Rivero López, F.M.; Rosales Contreras, P. Prognostic value of serum lactate levels in critically ill patients in an intensive care unit. J. Crit. Care Med. (Targu Mures) 2020, 6, 59–64. [Google Scholar] [CrossRef] [PubMed]
- Langer, T.; Brusatori, S.; Gattinoni, L. Understanding base excess (BE): merits and pitfalls. Intensive Care Med. 2022, 48, 1080–1083. [Google Scholar] [CrossRef] [PubMed]
- Cantos, J.; Huespe, I.A.; Sinner, J.F.; et al. Alactic base excess is an independent predictor of death in sepsis: a propensity score analysis. J. Crit. Care 2023, 74, 154248. [Google Scholar] [CrossRef] [PubMed]
- Liu, J.; Chen, Y.; Yang, B.; et al. Association between alactic base excess on mortality in sepsis patients: a retrospective observational study. J. Intensive Care 2025, 13, 20. [Google Scholar] [CrossRef] [PubMed]
- Smuszkiewicz, P.; Jawień, N.; Szrama, J.; et al. Admission lactate concentration, base excess, and alactic base excess predict the 28-day inward mortality in shock patients. J. Clin. Med. 2022, 11, 6125. [Google Scholar] [CrossRef] [PubMed]
- Zhou, C.; Wang, Q. Association of alactic base excess with in-hospital mortality in patients with acute myocardial infarction: a retrospective cohort study. BMC Cardiovasc. Disord. 2024, 24, 447. [Google Scholar] [CrossRef] [PubMed]
- de Munter, L.; Polinder, S.; Lansink, K.W.W.; et al. Mortality prediction models in the general trauma population: a systematic review. Injury 2017, 48, 221–229. [Google Scholar] [CrossRef] [PubMed]
- Velonas, G.; Mantas, D.; Kassianidis, G.; Poulianidou, V.; Patrani, M. Evaluation of the Trauma and Injury Severity Score (TRISS) performance in intensive care trauma patients: a systematic review and meta-analysis. Cureus 2025. [Google Scholar] [CrossRef] [PubMed]
- Johnson, A.E.W.; Bulgarelli, L.; Shen, L.; et al. MIMIC-IV, a freely accessible electronic health record dataset. Sci. Data 2023, 10, 1. [Google Scholar] [CrossRef] [PubMed]
- von Elm, E.; Altman, D.G.; Egger, M.; et al. The Strengthening the Reporting of Observational Studies in Epidemiology (STROBE) statement: guidelines for reporting observational studies. Ann. Intern. Med. 2007, 147, 573–577. [Google Scholar] [CrossRef] [PubMed]
- Collins, G.S.; Moons, K.G.M.; Dhiman, P.; et al. TRIPOD+AI statement: updated guidance for reporting clinical prediction models that use regression or machine learning methods. BMJ 2024, 385, e078378. [Google Scholar] [CrossRef] [PubMed]
- World Medical Association. Declaration of Helsinki: ethical principles for medical research involving human subjects. JAMA 2013, 310, 2191–2194. [Google Scholar] [PubMed]
- Clark, D.E.; Black, A.W.; Skavdahl, D.H.; Hallagan, L.D. Open-access programs for injury categorisation using ICD-9 or ICD-10. Inj. Epidemiol. 2018, 5, 11. [Google Scholar] [CrossRef] [PubMed]
- Baker, S.P.; O’Neill, B.; Haddon, W.; Long, W.B. The injury severity score: a method for describing patients with multiple injuries and evaluating emergency care. J. Trauma 1974, 14, 187–196. [Google Scholar] [PubMed]
- Boyd, C.R.; Tolson, M.A.; Copes, W.S. Evaluating trauma care: the TRISS method. J. Trauma 1987, 27, 370–378. [Google Scholar] [PubMed]
- DeLong, E.R.; DeLong, D.M.; Clarke-Pearson, D.L. Comparing the areas under two or more correlated receiver operating characteristic curves. Biometrics 1988, 44, 837–845. [Google Scholar] [CrossRef] [PubMed]
- Peduzzi, P.; Concato, J.; Kemper, E.; Holford, T.R.; Feinstein, A.R. A simulation study of the number of events per variable in logistic regression analysis. J. Clin. Epidemiol. 1996, 49, 1373–1379. [Google Scholar] [CrossRef] [PubMed]
- van Buuren, S.; Groothuis-Oudshoorn, K. mice: multivariate imputation by chained equations in R. J. Stat. Softw. 2011, 45, 1–67. [Google Scholar] [CrossRef]
- Steyerberg, E.W. Clinical Prediction Models: A Practical Approach to Development, Validation, and Updating; Springer: New York, NY, USA, 2009. [Google Scholar]
- Osler, T.; Baker, S.P.; Long, W. A modification of the injury severity score that both improves accuracy and simplifies scoring. J. Trauma 1997, 43, 922–925. [Google Scholar] [CrossRef] [PubMed]
- Harwood, P.J.; Giannoudis, P.V.; Probst, C.; Van Griensven, M.; Krettek, C.; Pape, H.C. Which AIS based scoring system is the best predictor of outcome in orthopaedic blunt trauma patients? J. Trauma 2006, 60, 334–340. [Google Scholar] [CrossRef] [PubMed]
- Paul, P.; Pennell, M.L.; Lemeshow, S. Standardizing the power of the Hosmer-Lemeshow goodness of fit test in large data sets. Stat. Med. 2013, 32, 67–80. [Google Scholar] [CrossRef] [PubMed]
- Pencina, M.J.; D’Agostino, R.B., Sr.; D’Agostino, R.B., Jr.; Vasan, R.S. Evaluating the added predictive ability of a new marker: from area under the ROC curve to reclassification and beyond. Stat. Med. 2008, 27, 157–172. [Google Scholar] [CrossRef] [PubMed]
- Van Calster, B.; McLernon, D.J.; van Smeden, M.; et al. Calibration: the Achilles heel of predictive analytics. BMC Med. 2019, 17, 230. [Google Scholar] [CrossRef] [PubMed]
- Goldberger, A.L.; Amaral, L.A.N.; Glass, L.; et al. PhysioBank, PhysioToolkit, and PhysioNet: components of a new research resource for complex physiologic signals. Circulation 2000, 101, e215–e220. [Google Scholar] [PubMed]
- Schöllhorn, F.; Branea, O.E. Integration of Alactic Base Excess into Established Trauma Systems: Improving Early Risk Assessment in ICU Patients. Acta Marisiensis—Seria Medica 2026, 72(S1), 20–21. [Google Scholar]
Figure 1.
ROC curves for individual markers against in-hospital mortality.
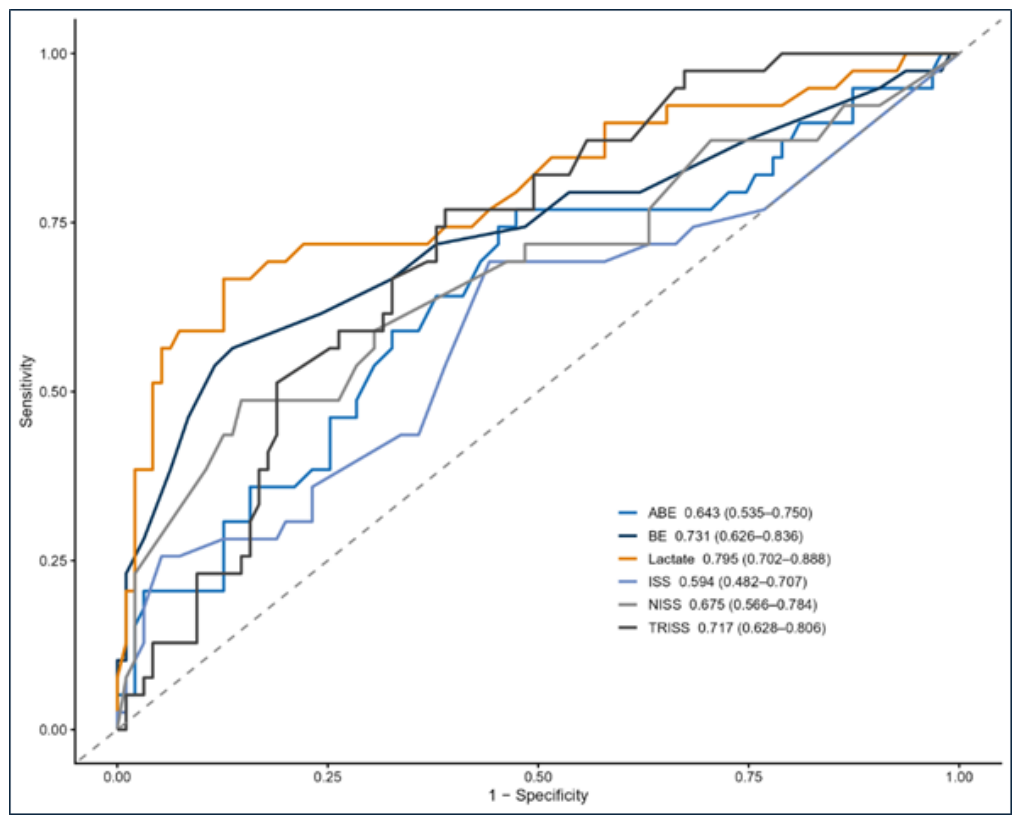

Table 1.
Baseline characteristics stratified by in-hospital mortality outcome.
| Variable | Overall (n = 134) | Survived (n = 95) | Died (n = 39) |
| Age, years — median [IQR] | 47 [29–64] | 43 [28–62] | 57 [39–77] a |
| Male sex — n (%) | 101 (75.4) | 74 (77.9) | 27 (69.2) |
| Blunt mechanism — n (%) | 110 (82.1) | 80 (84.2) | 30 (76.9) |
| ISS — median [IQR] | 25 [17–32] | 22 [17–29] | 26 [17–45] |
| NISS — median [IQR] | 34 [25–41] | 29 [22–41] | 38 [16–50] b |
| ABE, mmol/L — median [IQR] | −2.2 [−5, 0.3] | −1.2 [−4.4, 0.5] | −3.5 [−6.1, −1.5] b |
| BE, mmol/L — median [IQR] | −5 [−10, −2] | −4 [−7, −1] | −11 [−14, −4] c |
| Lactate, mmol/L — median [IQR] | 2.85 [1.80–5.10] | 2.50 [1.6–3.6] | 6.40 [2.7–8] c |
| GCS d — median [IQR] | 6 [3–11] | 9 [6–13] | 3 [3–6] c |
| SBP, mmHg e — median [IQR] | 123 [108–143] | 128 [113–146] | 109 [96–136] b |
| Hospital LOS, days — median [IQR] | 10.5 [3.4–20.8] | 14.3 [8.1–24.7] | 1.3 [0.3–4.4] c |
| Values expressed as median [IQR] unless otherwise stated. a p<0.05; b p<0.01; c p<0.001 (Mann-Whitney U test for continuous, chi-square for categorical variables). ABE: alactic base excess; BE: base excess; GCS: Glasgow Coma Scale; ISS: Injury Severity Score; LOS: length of stay; NISS: New Injury Severity Score; SBP: systolic blood pressure. d GCS missing in n=63 (47%); e SBP missing in n=14 (10.4%). All other variables complete. P-values are presented for descriptive purposes only and should be interpreted as exploratory; between-group comparisons were not specified. | |||
Table 2.
Primary multivariable logistic regression model (ABE + age + NISS + mechanism) for in-hospital mortality.
Table 2.
Primary multivariable logistic regression model (ABE + age + NISS + mechanism) for in-hospital mortality.
| Variable | OR | 95% CI | p-Value |
| ABE (per 1 mmol/L increase) | 0.840 | 0.745–0.946 | 0.004 |
| Age (per year) | 1.053 | 1.025–1.082 | <0.001 |
| NISS (per point) | 1.082 | 1.042–1.124 | <0.001 |
| Penetrating mechanism (vs. blunt) | 6.436 | 1.274–32.51 | 0.025 |
| Other/unknown mechanism (vs. blunt) | 5.475 | 1.098–27.31 | 0.038 |
| Results based on 20 multiply imputed datasets pooled by Rubin’s rules. OR: odds ratio; CI: confidence interval; ABE: alactic base excess; NISS: New Injury Severity Score. | |||
Table 3.
Incremental value of ABE.
| Metric | In-Hospital | 30-Day |
| AUC—Base model (95% CI) | 0.799 (0.713–0.886) | 0.791 (0.706–0.875) |
| AUC—Base + ABE (95% CI) | 0.826 (0.75–0.902) | 0.82 (0.746–0.893) |
| ΔAUC | 0.026 | 0.029 |
| DeLong p | 0.36 | 0.297 |
| LRT χ² | 9.254 | 9.389 |
| LRT p | 0.002 | 0.002 |
| NRI | 0.681 | 0.59 |
| NRI 95% CI | 0.346–1.015 | 0.23–0.927 |
| NRI p | 0.002 | 0.002 |
| NRI+ (events) | 0.333 | 0.286 |
| NRI− (non-events) | 0.347 | 0.304 |
| IDI | 0.057 | 0.054 |
| IDI 95% CI | 0.008–0.107 | 0.006–0.104 |
| IDI p | 0.02 | 0.024 |
| NRI: net reclassification improvement; IDI: integrated discrimination improvement; 500-iteration bootstrap; p-values test H0=0. Base model: age + NISS + mechanism. Results from pooled multiple imputation (m=20, Rubin’s rules). Bootstrap optimism-corrected AUC: primary model 0.793 (apparent 0.826, optimism 0.033); base model 0.775 (apparent 0.799, optimism 0.024); optimism-corrected ΔAUC 0.018. | ||
Table 4.
Discriminatory performance of TRISS alone versus TRISS augmented with ABE for in-hospital mortality.
Table 4.
Discriminatory performance of TRISS alone versus TRISS augmented with ABE for in-hospital mortality.
| Model | AUC (95% CI) | DeLong p | LRT p | NRI (95% CI; p) | IDI (95% CI; p) |
| TRISS alone | 0.717 (0.628–0.806) | – | – | – | – |
| TRISS + ABE | 0.727 (0.633–0.821) | 0.727 | 0.029 | 0.328 (−0.022–0.735; p=0.072) |
0.039 (0.003–0.076; p=0.04) |
| DeLong p-values are for comparison against the TRISS alone model. NRI and IDI from 500-iteration bootstrap; p-values test H0=0. Results from pooled multiple imputation (m=20, Rubin’s rules). LRT: likelihood ratio test; NRI: net reclassification improvement; IDI: integrated discrimination improvement; TRISS: Trauma and Injury Severity Score; ABE: alactic base excess. | |||||
Disclaimer/Publisher’s Note: The statements, opinions and data contained in all publications are solely those of the individual author(s) and contributor(s) and not of MDPI and/or the editor(s). MDPI and/or the editor(s) disclaim responsibility for any injury to people or property resulting from any ideas, methods, instructions or products referred to in the content. |
© 2026 by the authors. Licensee MDPI, Basel, Switzerland. This article is an open access article distributed under the terms and conditions of the Creative Commons Attribution (CC BY) license.
Copyright: This open access article is published under a Creative Commons CC BY 4.0 license, which permit the free download, distribution, and reuse, provided that the author and preprint are cited in any reuse.