

Submitted:
16 September 2026
Posted:
17 September 2026
You are already at the latest version
Abstract
In AI for Science, data‑driven discovery by LLM agents is more than reproducing a prescribed analysis: as intermediate results emerge, an agent must decide what to investigate next, how to test it, and which conclusions the evidence warrants. We present TruthInsight, a scientific harness for complex research tasks that maintains a trusted chain of evidence across the entire research process. The harness organizes a study around an evidence‑linked research record, where each scoped task logs its question, method, outputs, sources, and uncertainty, and a review contract separates automatic artifact verification from semantic adjudication of claims against evidence. Review‑guided evidence routing decides after each assessment whether to extend the current analysis, formulate another research question, or prepare the report, while periodic review resolves concerns through existing evidence or additional tasks, driving inquiry forward rather than toward a known answer. We compare TruthInsight with four baseline frameworks on a scientific‑discovery benchmark of 40 blinded tasks across ten domains, under one common base model and a six‑dimension rubric for evidence maturity. TruthInsight scores 69.35 against a baseline plateau of 58.40–60.27, ranks first on 33 of 40 tasks and among the top two on 37, and exceeds the strongest baseline by 9.09 points. The gain comes mainly from the weighted quality of the two best semantically distinct discoveries per task rather than from discovery count or novelty, and is concentrated in Evidence Auditability and Control Testing, where it reaches 89.15% and 69.22% against baseline highs of 80.68% and 15.78%. These results indicate that an explicit, end‑to‑end evidence‑warranting layer is what moves automated research from single‑task execution and reproduction toward verifiable scientific discovery.
Keywords:
scientific discovery agents
; scientific harness
; data-driven discovery
; review-guided evidence routing
; evidence-linked research records
; interactive data analysis
; evidence auditability
; control testing
; scientific discovery benchmark
1. Introduction
AI for Science increasingly delegates parts of data-driven research to large language model (LLM) agents, which combine literature interpretation, computational experimentation, data analysis, scientific software, and reporting in long-horizon workflows. Automating a research workflow, however, is not equivalent to making a scientific discovery, and reproducing a prescribed analysis faster is not equivalent to discovering what the data warrant. A system may synthesize plausible hypotheses from retrieved text without adding empirical support beyond the literature it consulted, or report descriptive statistics, correlations, and model outputs yet stop before testing whether an apparent finding survives uncertainty analysis, alternative explanations, confounds, artifacts, or changes in scope. We use the term evidence-mature data-driven discovery for the stricter objective: claims originate in executed analysis of the supplied data and become progressively more credible as decisive quantities are recomputed, uncertainty and applicability boundaries are stated, and relevant controls, competing explanations, artifacts, and corroborating methods are examined. Literature remains essential, but it guides questions, methods, controls, interpretation, and novelty assessment rather than supplying a known textual conclusion in place of evidence from the data. Accelerating prescribed workflows raises execution efficiency; raising discovery efficiency means increasing the rate at which candidate findings grounded in data become warranted claims.
Scientific objectives rarely translate directly into a complete analysis plan: explaining a phenomenon, testing a hypothesis, or identifying a relationship requires deciding, as results emerge, which observations are worth pursuing, which explanations need decisive tests, and when the current investigation is complete. Generic agent loops leave these decisions to uninterrupted generation. Successive prompts and summaries can lose the scope, assumptions, data boundary, and execution conditions of earlier results, and they present supported results, reliable conflicts, insufficient evidence, and execution failures in equally fluent text although each demands a different scientific response. A consequential claim may then have no traceable path back to the data, executed method, and artifacts that produced it. The central question of this work is therefore: how should a scientific harness for complex research tasks organize an iterative, evidence-responsive process—from research questions and tasks to executed results, reviewed claims, and next actions—so that a trusted chain of evidence is maintained throughout, and candidate findings grounded in data become warranted, revisable claims, with literature guiding inquiry rather than supplying target answers?
Prior systems address parts of this problem: persistent investigation state externalizes research progress, write-time admission controls memory contamination, provenance-oriented audit standards target traceability, and a growing family of discovery benchmarks evaluates research agents. These mechanisms are useful components but are not, individually, sufficient: state, memory gates, traceable reports, and multi-agent coordination do not by themselves adjudicate whether a claim is supported by executed evidence, and existing benchmarks largely reward execution, reproduction, or target-guided rediscovery rather than open-ended discovery. TruthInsight claims priority for none of these components individually; its contribution is to connect, within a single reusable research record, the provenance of an executed analysis, its proposed claim, the reviewed evidentiary status of the outcome, and the downstream action that status permits.
We present TruthInsight, an evidence-centered scientific harness for data-driven discovery. A study begins from a research goal and frozen data; literature within an authorized retrieval scope guides the evolving investigation, while claims about the supplied data remain anchored to executed and reviewable analyses. The harness organizes work around an evidence-linked research record: each scoped task records its question, inputs, method, executed outputs and diagnostics, sources, uncertainty, limitations, failures, proposed claim, and status, so that a trusted chain of evidence links data, analyses, and claims across the entire study. A review contract separates automatic artifact verification from semantic claim–evidence adjudication; after result checks, supported results inform conclusions, reliable conflicts prompt comparison, and insufficient evidence motivates further analysis or narrower claims, while execution failures trigger diagnosis and recovery. These constructs are operationalized as a research process bounded by initial data exploration and final research reporting, organized around an iterative four-operation loop: research-question formulation, research-task selection and design, task execution with result checks, and evidence assessment with scientific review.
To test whether review-guided routing improves discovery rather than execution, we evaluate TruthInsight on TruthInsightBench [1], a benchmark of 40 blinded, data-driven discovery tasks across ten scientific domains, scored by its open-source six-dimension rubric for evidence maturity. Under one common base model, task inputs, literature boundary, and reporting requirements, TruthInsight contributes 40 system–task evaluations that ran autonomously without human intervention, combined with the 160 fixed baseline evaluation records released with the benchmark for the four baseline frameworks used without task-specific modification. TruthInsight scores 69.35 against a baseline plateau of 58.40–60.27, ranks first on 33 of 40 tasks and among the top two on 37, and exceeds the strongest baseline by 9.09 points; its margin is carried by Evidence Auditability and Control Testing rather than by discovery count or novelty.
Our contributions are threefold:
- 1.
- An evidence-centered harness for data-driven discovery. We operationalize data-grounded, literature-guided inquiry as an iterative research process—a four-operation loop bounded by data exploration and research reporting—built around an evidence-linked research record and a review contract that keep claims anchored to executed analyses.
- 2.
- Review-guided evidence routing. The harness keeps supported results, reliable conflicts, insufficient evidence, and execution failures distinct and routes each to a different downstream scientific action; periodic fresh-context scientific review converts unresolved concerns into follow-up tasks.
- 3.
- Controlled complete-system evidence on a discovery benchmark. Under one common base model on 40 blinded data-driven tasks, a five-system comparison—40 TruthInsight evaluations combined with the 160 frozen baseline records released with the benchmark—shows TruthInsight scoring 69.35 against an execution-level plateau of 58.40–60.27, ranking first on 33 of 40 tasks, with its margin concentrated in Evidence Auditability and Control Testing.
2. Related Work
2.1. The Nature and Process of Scientific Discovery
A scientific discovery is not a single act but a process in which a candidate claim is generated and then progressively warranted. The classical distinction between the context of discovery and the context of justification separates hypothesis generation from the procedures through which hypotheses are tested and accepted or rejected [2]. Cognitive accounts model discovery as coordinated search over coupled hypothesis and experiment spaces [3], and the computational-discovery tradition from the early BACON systems onward shows that substantial parts of this process can be expressed as symbolic search without being reduced to it [4]. Strong inference requires competing hypotheses and decisive experiments that exclude some of them [5], while the falsificationist tradition regards a claim as scientific only insofar as it states the observations that would refute it [6].
These accounts motivate a distinction between two senses of “faster research”. Execution efficiency means completing prescribed analyses more quickly and with less manual effort. Discovery efficiency is the rate at which a candidate finding grounded in data becomes a warranted claim—one that withstands baselines, negative controls, competing explanations, and artifact checks, and gains independent corroboration; this warranting work is what the accounts above place at the center of science. TruthInsight’s review contract and evidence routing provide an operational counterpart to these accounts: evidentiary states and requirements for discriminating tests formalize elimination and justification, while candidate-hypothesis generation remains the responsibility of the underlying model.
2.2. AI for Scientific Discovery
Automated scientific-discovery systems already span staged end-to-end pipelines [7,8,9], hypothesis-evolution and domain-specific multi-agent systems that couple computational tools with, in several cases, wet-lab validation [10,11,12,13,14,15,16], and long-horizon data-driven analysis coordinated through structured world models, as in Kosmos [17]. A complementary line describes AI scientists as compound systems of collaborative agents, structured memory, scientific tools, and self-assessment [18]. These systems make persistence, shared state, traceable reports, and multi-agent coordination available as components, but they do not by themselves adjudicate whether a claim is warranted by executed evidence; independent audits further warn that leakage, metric misuse, post-hoc selection, missing trace logs, and unreliable LLM verification of manuscripts can obscure failure [19,20].
The closest prior art addresses particular components. StatefulDiscovery externalizes investigation state and couples frontier selection to evidence acquisition and claim adjudication [21]; ConsistencyGate applies repeated self-consistency checks before admitting candidate facts to persistent memory [22]; and the Auditable Autonomous Research standard treats provenance coverage, contradiction transparency, and audit effort as first-class targets for research agents [23]. TruthInsight claims priority for none of these mechanisms individually. Its narrower methodological contribution is to couple scientific artifact provenance with a reviewed evidentiary state inside a common task record and then route that state to a distinct downstream action, so that supported results, reliable conflicts, insufficient evidence, and execution failures remain distinct and actionable.
2.3. Evaluation Methods for Scientific Discovery
Most scientific-agent benchmarks organize tasks, data, and rubrics around a known target: MLAgentBench [24] and EXP-Bench [25] evaluate prescribed machine-learning and research experiments; ScienceAgentBench [26] and DiscoveryBench [27] supply specified tasks or discovery goals; PaperBench [28] and AstaBench [29] grade paper replication and broad research assistance; DiscoveryWorld [30] simulates interactive inquiry; and ResearchClawBench [31], NatureBench [32], and FIRE-Bench [33] anchor scoring to the source publication’s findings. Because automated scoring is itself part of evaluation, work on LLM-as-a-judge reliability documents position bias, self-preference, and other judge biases that uniform rubrics and protocolized review must control [34,35,36]. A central distinction is between reproduction, which begins from a known claim, method, or target and tests whether it can be recovered, and discovery, which begins from observations and requires identifying a phenomenon worth claiming, testing competing explanations, and delimiting the scope in which the claim holds.
TruthInsightBench [1] is built for the discovery setting: each task defines the scientific object and data boundary but withholds any target conclusion or standard analysis route, and its rubric converts the same evidence-warranting concerns into uniform task-construction and scoring criteria that rest most of the score on the evidence maturity of the system’s own discoveries. Reproduction serves only to establish task solvability during benchmark construction; the evaluated agent never sees the source conclusion. We adopt this benchmark for precisely this reason: it rewards the evidence-warranting behavior that TruthInsight is designed to produce rather than recovery of a withheld target, so an advantage over execution-oriented baselines cannot be attributed to target matching.
3. The TruthInsight Method
TruthInsight takes scientific objectives and scientific data as inputs. Initial exploration informs research questions, followed by a cycle of task selection and design, execution and result checks, and evidence assessment and scientific review (Figure 1). The assessment determines whether to extend the analysis of the current question, formulate another research question, or organize the completed research into a report. The following six subsections correspond to the inputs and exploration stage, the four research operations, and the reporting stage shown in Figure 1; together, they describe the version of the method evaluated in this paper.
3.1. Research Inputs and Data Exploration
The user provides two inputs. Scientific objectives specify the research direction, questions to address, and relevant requirements. Scientific data provide the research materials and may include descriptions of variables, sampling context, and conditions of use. The system derives research questions and analysis tasks from these inputs and revises them as research proceeds.
The system first reads the data to examine variables, units, data structure, missingness, and sampling context. Descriptive analyses produce initial observations when needed. Data exploration identifies the objects and units of comparison, including the relationships among rows, repeated measurements, and independent observations. Identifying these structures determines which questions the data can address and which conditions subsequent analyses must satisfy.
After initial exploration, the system selects methods suited to the scientific domain, data structure, and objectives. It specifies analytical assumptions, comparison baselines, and potential confounders. Method selection can draw on existing domain knowledge, supplemented by literature review when definitions, theory, or methodological justification are needed. The methods and analytical conditions can be revised as the investigation develops.
3.2. Research Question Formulation
Research questions translate scientific objectives into specific questions that the data can address. Drawing on initial observations and domain knowledge, the system identifies relationships to explain, models to compare, or conditions to test. When a candidate explanation needs to be tested, it formulates a hypothesis, states its observable predictions, and considers competing explanations. Exploratory research can instead begin with descriptive analysis, anomaly identification, or model comparison to identify phenomena that warrant further investigation.
A research question specifies what is to be answered, a hypothesis proposes a testable explanation, and a research task specifies what to do next. A question may involve several hypotheses, and one task may compare several explanations. Exploratory tasks can proceed before a specific hypothesis is available. New observations and evidence assessments from completed tasks inform refinements to the current question or the formulation of subsequent questions.
Literature review addresses these specific needs: establishing background and methods, comparing candidate explanations, or relating the scientific discoveries to prior work. Knowledge from the literature is distinguished from results obtained from the current data. Sources and uses of literature follow the information constraints of the task; the conditions used in this evaluation are specified in Section 4.1.
3.3. Research Task Selection and Design
Each selection round generates candidate tasks from the current research questions and existing results. Candidates may address unanswered questions, new observations, conflicting results, required methodological checks, or concerns raised in scientific review. Regular selection rounds generate 3–7 candidate research tasks; fewer candidates may be used when preparing the final report. Each candidate specifies its purpose, required data, the judgments its results could affect, execution cost, and dependencies.
The system compares candidate tasks by information gain, risk reduction, resolving dependencies, domain relevance, and execution cost (Table 1). Information gain estimates how much a result could distinguish explanations or change a judgment. Risk reduction estimates the value of checking incorrect premises or overly broad interpretations. The dependency-resolution factor estimates how much a task would enable subsequent research. The system assigns each factor an ordinal estimate from 1 to 5 based on the current question and existing results and combines the estimates using the listed weights. Cost has a negative weight, so a less costly task receives higher priority when research value is otherwise similar. This score guides the work undertaken next.
Candidate priorities are further adjusted according to the reason for proposing a task, including conflicts affecting central conclusions, unresolved review concerns, and domain requirements. The default is to select executable tasks with higher priority. Required methodological checks or prerequisites can alter this choice, with a reason given for the adjustment. The rule therefore retains model judgment about current research needs. Independent tasks addressing related research questions may run in parallel; tasks that depend on earlier results run sequentially. After completion, existing results and remaining questions are reassessed before the next task is selected.
Selected tasks are passed to execution agents through instructions specifying the research question, relevant data and prior results, methodological conditions, and the analyses to be performed. For hypothesis tests, the instructions also identify the explanations to compare and the outcomes that would distinguish them. Execution agents use this context to conduct the analysis. If the inputs or intermediate results conflict with a task premise, the discrepancy and its basis are returned to inform revisions.
3.4. Task Execution and Result Checks
Data analysis proceeds interactively. The system states the purpose of the current computation, executes a focused step, inspects numerical, graphical, or diagnostic outputs, and interprets them before selecting the next operation. Actual outputs may lead it to continue the analysis, adjust a method, or perform an additional check. Incremental execution incorporates checks of variable mappings, units, magnitudes, and model diagnostics into the analysis, so later operations depend on observed results.
Literature tasks search and read permitted materials, compare relevant methods and explanations, and return sources, conditions of applicability, and implications for the current question. At task completion, the system checks whether the returned content addresses the instructions. Data analyses report the main results, analytical conditions, any anomalies, and the basis for the reported interpretation. Literature reviews check whether sources support the statements attributed to them and whether their conclusions apply to the current investigation.
Artifact checks assess consistency among the data, execution, and outputs; a computational or literature result constitutes evidence when it is used to support or test a specific claim. Evidence assessment, described next, determines which scientific claims the results support. Validation on independent evidence requires testing with data or evidence separate from that used to form the claim; successful computation alone does not establish such validation. Execution errors are diagnosed and corrected within the analysis before the task resumes. An unsupported hypothesis, null result, or counterexample is a scientific result to interpret, rather than an execution error.
3.5. Evidence Assessment and Scientific Review
After each task, the system assesses results against the research question, prior predictions, and analytical conditions, then updates the conclusions. Supporting evidence is weighed together with other results. Conflicting results prompt checks of the objects studied, variable definitions, and comparison conditions before alternative explanations are considered. When the evidence does not resolve a question, the system identifies the analyses still needed or narrows the scope of the conclusion. Evidence assessment thus retains, revises, or rejects specific claims and identifies issues requiring further work.
Scientific review is a built-in check within the research process. It examines which analyses have been performed, whether their methodological assumptions hold, what conclusions the results support, and whether conflicting results or alternative explanations have been overlooked. In addition to evidence assessment after individual tasks, the system periodically reexamines the current analyses and reasoning and identifies concerns for further checking.
Periodic review uses a fresh context of the same base model, provided with a summary of the central claims, key numerical results, domain conditions, and unresolved issues but without the full preceding reasoning history. The model reviews this summary without executing tools and identifies concerns for follow-up. Subsequent processing checks the relevant analysis outputs and sources and conducts additional research when needed.
Figure 2 details how review concerns are handled. For each concern, the system checks the relevant analysis outputs, methods, and sources. If existing evidence addresses the concern, it updates the conclusion and its scope directly. If further research is needed, unresolved issues become candidate tasks and proceed through selection and design (Section 3.3), execution, and result checks (Section 3.4). The resulting evidence is then used to reassess the conclusion. Periodic review thus uses the same task mechanism to act on its feedback.
The updated evidence and conclusions determine the next action. If the current question needs further analysis, the system returns to task selection and design (02 in Figure 1). If the current question has been addressed but the scientific objectives require further investigation, it formulates a subsequent research question (01). If the scientific objectives have been sufficiently addressed, it proceeds to research reporting. Addressing a question may mean supporting an explanation, ruling out a hypothesis, or establishing conditions of applicability. These judgments guide the research direction beyond the initial task list.
3.6. Research Reporting
The system proceeds to reporting when the scientific objectives have been sufficiently addressed, central conclusions have supporting evidence, and consequential concerns and required methodological checks have been handled. After evidence assessment, the system decides whether the objectives have been sufficiently addressed and, if so, proceeds directly to reporting. If configured execution limits end the run, the report states conclusions within the scope of the completed work and identifies remaining questions.
The report is organized by scientific discovery. Each discovery identifies the object of study, quantitative results, supporting reasoning, and scope. Multiple analyses of the same question contribute to a common argument, including conflicting results that affect the conclusion. The report distinguishes prior knowledge in the literature, discoveries supported by the current data, and explanations requiring further testing. Evidence-supported null results and counterexamples can also constitute scientific discoveries.
Report preparation checks the consistency of key numerical results, figures, citations, and supporting analyses so that the text reflects the research performed. The final output presents scientific discoveries, supporting evidence and conditions of applicability, and further questions arising from the completed research.
4. Experiments
4.1. Experimental Setup and Evaluation Metrics
We evaluate the complete TruthInsight system in terms of overall task performance and the quality of its reported discoveries.
We use the 40 research tasks in TruthInsightBench [1], spanning astronomy, chemistry, computational mathematics, Earth science, energy science, information science, life science, materials science, neuroscience, and physics, with 3–5 tasks per domain. Each system receives the same scientific objectives and scientific data for a given task. Objectives are stated neutrally, and supplementary information such as variable descriptions is included with the scientific data. The source paper, its authors’ conclusions, hidden targets, and evaluation materials are withheld. Systems may consult literature first made public before the task cutoff to identify methods, interpret results, or compare prior work; their core scientific discoveries must be derived from the task data.
We compare TruthInsight with Claude Code v2.1.220, OpenScience v2.0.1, Codex CLI v0.149.0, and DeepSeek Harness v0.1.0rc7. All five systems use DeepSeek-V4-Flash with thinking disabled. The four baselines constitute the benchmark’s frozen comparison set—two general-purpose coding agents and two open research harnesses—and are used without modification; the labels refer to agent frameworks rather than to the models those frameworks use by default. Adding TruthInsight under the same base model and protocol directs the comparison at harness organization rather than base-model capability. External evaluation uses GLM-5.1 in its W4A8 quantized configuration, also with thinking disabled. System configurations and evaluation procedures follow the experimental settings of the benchmark; Appendix Section 7 lists the evaluated versions and configurations.
Each task–system pair contributes exactly one fixed evaluation record, yielding a complete comparison matrix. TruthInsight was run on all 40 tasks for this study; the 160 baseline records (four systems × 40 tasks) are the frozen evaluation records released with TruthInsightBench [1], produced under the same base model and protocol. All overall scores, score components, and dimension-level results below are computed from this matrix. Discovery quality is scored across six dimensions: Evidence Auditability (45 points), Robustness (15), Control Testing (15), Cross-Dataset Generalization (10), Novelty (10), and Falsifiability (5). Novelty assesses independent derivation and additions relative to the literature available before the cutoff; Cross-Dataset Generalization assesses validation on independent evidence. The full scoring specification is given in the benchmark.
For task scoring, semantically equivalent scientific discoveries are grouped, and the highest-scoring discovery in each group is retained. and are the highest and second-highest discovery quality scores after deduplication. The “top two” therefore refer to quality rank, not submission order. The score for system a on task t is
A missing or is assigned zero. The multi-discovery yield bonus rewards qualified discoveries: after deduplication, the first four discoveries with quality scores of at least 40 and no deterministic-error judgment receive 4, 2, 2, and 2 points, respectively, up to 10 points. The reference-coverage bonus awards up to 5 points for covering each of the two hidden reference discoveries, up to 10 points in total, with partial credit allowed. The deterministic-error penalty deducts 5 points, up to 10 in total, for each semantically distinct claim whose direction is clearly contradicted by executed results or key re-derivations but still asserted in the final report. The clip operation bounds the task score between 0 and 100. A system’s overall score is the arithmetic mean of its task scores (Equation 1) across the 40 tasks.
4.2. Overall Performance
TruthInsight achieves a mean task score of 69.35, compared with 58.40–60.27 for the four baselines (Figure 3). TruthInsight’s mean task score exceeds that of Claude Code, the highest-scoring baseline overall, by 9.09 points, with a 95% paired bootstrap interval of [6.79, 11.41]. The paired intervals for comparisons with the other three baselines also lie entirely above zero. The paired standardized effect sizes are 1.20, 1.33, 1.53, and 1.34 against the four baselines, and two-sided Wilcoxon signed-rank tests give for all four comparisons; the descriptive statistics, bootstrap intervals, effect sizes, and exact tests are tabulated in Appendix Section 8.
TruthInsight ranks first on 33 of the 40 tasks and among the top two on 37. It outscores Claude Code, OpenScience, Codex CLI, and DeepSeek Harness on 35, 38, 37, and 38 of the 40 tasks, respectively. A first-place rank requires outperforming every baseline on a task, whereas a paired win is defined relative to one specified baseline. TruthInsight is not ranked first on seven of the 40 tasks.
The advantage extends across scientific domains. TruthInsight has the highest mean score in each of the ten domains; Appendix Section 9 reports the domain-level results. We also recompute the margin against the strongest remaining baseline after removing one task or one domain at a time. Across the 40 leave-one-task-out and 10 leave-one-domain-out variants, the margin ranges from 8.58 to 9.57 points and from 8.54 to 9.80 points, respectively, so no single task or domain accounts for the overall margin.
Under the fixed scoring formula, TruthInsight’s weighted contribution from the top two discoveries exceeds that of Claude Code by 9.6725 points. The TruthInsight-minus-Claude-Code differences in the multi-discovery-yield and reference-coverage bonuses are and points, respectively; neither system incurs a deterministic-error penalty. These components sum to 9.0850 points. The negative reference-coverage difference means that TruthInsight receives less of this bonus than Claude Code; it is not an additional penalty. Appendix Section 10 reports the complete output-profile statistics—candidate-discovery counts, deduplicated groups, duplication rates, top-two quality, and reference-coverage counts—showing that TruthInsight is not the broadest system and does not lead on reference coverage, and that its advantage is concentrated in the evidence quality of its strongest discoveries.
4.3. Scientific Discovery Quality
Figure 4 compares the six quality dimensions across all candidate scientific discoveries. For each system, each discovery’s dimension score is normalized by that dimension’s maximum and then averaged across all of the system’s candidate discoveries, expressed as a percentage. The averages include both discoveries outside the task’s top two and discoveries merged during semantic deduplication. They therefore characterize the complete output set rather than explain the weighted top-two score gap.
The largest normalized difference is in Control Testing: TruthInsight scores 69.22%, compared with 11.45%–15.78% for the baselines, which corresponds to a 53.44-percentage-point margin over the highest-scoring baseline. This dimension assesses baseline comparisons, control analyses, and tests of competing explanations conducted to examine a discovery. Appendix Section 11 reports the exact dimension rates and decomposes Control Testing into its five scored items; the largest item-level gaps over the strongest baseline occur on competing explanations, negative controls, and simple baselines, whereas the confound and analysis-artifact check shows the smallest gap.
Evidence Auditability is 89.15% for TruthInsight and 78.19%–80.68% for the baselines. This dimension assesses the extent to which the evidence supporting a discovery is traceable and checkable, and whether the reported claims accurately reflect the analytical results.
Figure 4 also reports the remaining dimensions. TruthInsight scores 17.54% on Robustness, 2.13% on Cross-Dataset Generalization, and 36.83% on Falsifiability. Its Novelty score is 85.57%, which falls within the baseline range of 83.04%–87.27%. These dimensions assess distinct scientific requirements. The principal quantified advantages in this evaluation are in Control Testing and Evidence Auditability.
5. Conclusion and Future Work
We presented TruthInsight, an automated scientific discovery system that organizes research around scientific objectives, supplied data, and intermediate evidence: it connects task selection and execution with evidence assessment and scientific review so that conclusions and subsequent work are revised within one investigation, and a trusted chain of evidence is maintained throughout. Across 40 blinded tasks spanning ten domains, TruthInsight achieves a mean score of 69.35, exceeds the highest-scoring baseline by 9.09 points, and ranks first on 33 tasks. The main score gain comes from the weighted quality contribution of the top two discoveries, and analysis of all candidate discoveries identifies Control Testing and Evidence Auditability as the principal advantages, consistent with the design emphasis on comparing explanations and assessing evidence. The experiments compare the final outputs of complete systems and support the integrated workflow on the evaluated tasks, but they do not isolate the effects of task-selection strategies or scientific review. Future work can compare alternative task-selection strategies and review schedules to assess their effects on discovery quality and research efficiency, extend the comparison to research-specific multi-agent systems under the same protocol, and use independent data to test whether the reported discoveries extend beyond the analyzed evidence, thereby closing the loop with real scientific validation. As a scientific harness for complex research tasks, TruthInsight keeps a complete, traceable evidence chain across the full process, with the broader aim of moving AI for Science from single-task execution toward a sustained, verifiable, and reproducible end-to-end research process.
A. Authors
Core Authors. Zhibo Yang2, Chen Zhang2, Yuewei Zhang3, Yuanchun Zhou1, and Hao Wang1.
Contributors. Kai Xu1, Yan Ban1.
Main Affiliations.
1Computer Network Information Center, Chinese Academy of Sciences
2Jingdong Group
3Alibaba Cloud
B. Evaluated System Configurations
Table 2 lists the evaluated framework versions and the common execution conditions. All five systems run the same base model with thinking disabled; the external evaluator is a separate fixed model, also with thinking disabled. The four baseline configurations are those frozen in the benchmark release, and TruthInsight was evaluated under the same conditions.
C. Overall and Paired Comparison Statistics
Table 3 reports cross-task descriptive statistics for each system, computed from the unrounded task-level evaluation records. The cross-task standard deviation and the minimum–maximum task score describe heterogeneity across the 40 curated tasks.
Table 4 reports the paired comparisons. The 95% paired bootstrap intervals use 100,000 resamples of the 40 matched task-score vectors, where each resample draws the five systems’ scores on the same tasks together; the intervals quantify sensitivity to task composition rather than repeated-run variability. Wins–losses count tasks on which TruthInsight scores above or below each baseline; there are no ties. The paired standardized effect size is , the mean paired difference divided by the standard deviation of the paired differences. The two-sided Wilcoxon signed-rank tests use the exact method.
D. Performance Across Scientific Domains
Table 5 reports task counts and mean scores for the ten scientific domains. Each domain mean gives equal weight to the tasks within that domain, and domain means are displayed to two decimals. Because domains contain 3–5 tasks, the overall score in the main text weights all 40 tasks equally rather than averaging the ten domain means; recomputing the overall value from the displayed two-decimal domain means using the task counts as weights can therefore differ from the reported overall value by a few thousandths. All reported overall values are computed from unrounded task-level statistics, as stated in Section 4.1. The domain-level results describe the distribution of performance within the evaluated task set.
E. Discovery Breadth and Evidence Depth
Table 6 separates discovery breadth and semantic duplication from the evidence-quality contribution of the two highest-scoring semantically distinct groups selected within each task. Candidate discoveries count all scored discoveries before deduplication; deduplicated groups merge semantically equivalent claims; the duplication rate is the share of candidate discoveries merged into an existing group; and the top-two quality contribution is the per-task mean of the component, with a maximum of 80.
TruthInsight forms fewer deduplicated groups per task than the two broadest systems (Claude Code and DeepSeek Harness) and shows the highest semantic-duplication rate, but contributes the highest top-two quality, exceeding Claude Code by 9.672 points per task. Its output profile is therefore depth-first rather than breadth-maximizing.
Reference-discovery coverage provides a complementary breadth check. Across the 80 non-exhaustive reference discoveries (two per task), TruthInsight records 36 full, 20 partial, and 24 missed matches; the corresponding counts are 43 full, 21 partial, and 16 missed for Claude Code, and 44/22/14 for DeepSeek Harness. Comparable aggregates were not released for the other two baselines, so this measure does not support a complete five-system ranking. The available counts do not indicate a reference-coverage advantage for TruthInsight.
F. Six-Dimension Scores and Control-Test Decomposition
Table 7 reports the exact normalized rates displayed in Figure 4. The normalized rate for a dimension equals the obtained dimension points across all candidate discoveries divided by the number of discoveries times the dimension maximum. It describes the evidence structure of submitted discoveries; it is neither a task pass rate nor the system leaderboard score.
Table 8 decomposes Control Testing into its five scored items. Item scores are means over all candidate discoveries and are compared with the strongest baseline on each item. The largest gaps occur on competing explanations, negative controls, and simple baselines; the confound and analysis-artifact check shows the smallest gap.
References
- Yang, Zhibo; Zhang, Chen; Zhang, Yuewei; Wang, Hao. TruthInsightBench: An evidence-grounded benchmark for automated evaluation of open-ended scientific discovery agents, 2026. Available online: https://arxiv.org/abs/2609.05079.
- Reichenbach, Hans. Experience and Prediction: An Analysis of the Foundations and the Structure of Knowledge; University of Chicago Press: Chicago, IL, 1938. [Google Scholar]
- Klahr, David; Dunbar, Kevin. Dual space search during scientific reasoning. Cogn. Sci. 1988, 12(1), 1–48. [Google Scholar]
- Langley, Pat; Simon, Herbert A.; Bradshaw, Gary L.; Zytkow, Jan M. Scientific Discovery: Computational Explorations of the Creative Processes; MIT Press: Cambridge, MA, 1987. [Google Scholar]
- Platt, John R. Strong inference. Science 1964, 146(3642), 347–353. [Google Scholar] [CrossRef]
- Popper, Karl R. Conjectures and Refutations: The Growth of Scientific Knowledge; Routledge and Kegan Paul, London, 1963. [Google Scholar]
- Lu, Chris; Lu, Cong; Tjarko Lange, Robert; Yamada, Yutaro; Hu, Shengran; Foerster, Jakob; Ha, David; Clune, Jeff; et al. Towards end-to-end automation of AI research. Nature 2026, 651, 914–919. [Google Scholar] [CrossRef]
- Aygün, Eser; Belyaeva, Anastasiya; Comanici, Gheorghe; et al. An AI system to help scientists write expert-level empirical software. Nature 2026, 654, 909–916. [Google Scholar] [CrossRef]
- Tang, Jiabin; Xia, Lianghao; Li, Zhonghang; Huang, Chao. AI-Researcher: Autonomous scientific innovation. Adv. Neural Inf. Process. Syst. 2025, volume 38. Available online: https://proceedings.neurips.cc/paper_files/paper/2025/hash/0d904d300a105809a2114d727851e759-Abstract-Conference.html. [CrossRef]
- Ghareeb, Ali E.; Chang, Benjamin; Mitchener, Ludovico; Yiu, Angela; Szostkiewicz, Caralyn J.; Shved, Dmytro; Gyimesi, Gavin J.; Laurent, Jon M.; Wright, Samantha M.; Razzak, Muhammed T.; et al. A multi-agent system for automating scientific discovery. Nature 2026, 655, 497–505. [Google Scholar] [CrossRef]
- Gottweis, Juraj; Weng, Wei-Hung; Daryin, Alexander; Tu, Tao; Sirkovic, Petar; Myaskovsky, Artiom; Glowaty, Grzegorz; Weissenberger, Felix; Orlandi, Alessio; Popovici, Dan; et al. Accelerating scientific discovery with Co-Scientist. Nature 2026, 655, 487–496. [Google Scholar] [CrossRef]
- Huang, Kexin; Zhang, Serena; Wang, Hanchen; et al. Autonomous biomedical research with an artificial intelligence agent. Science 2026, 393(6813), eadz4351. [Google Scholar] [CrossRef]
- Swanson, Kyle; Wu, Wesley; Bulaong, N. L.; et al. The virtual lab of AI agents designs new SARS-CoV-2 nanobodies. Nature 2025, 646(8085), 716–723. [Google Scholar] [CrossRef]
- Bran, Andres M.; Cox, S.; Schilter, O.; et al. Augmenting large language models with chemistry tools. Nat. Mach. Intell. 2024, 6, 525–535. [Google Scholar] [CrossRef]
- Mandal, I.; Soni, J.; Zaki, M.; et al. Evaluating large language model agents for automation of atomic force microscopy. Nat. Commun. 2025, 16, 9104. [Google Scholar] [CrossRef]
- Pagel, S.; Jirasek, M.; Cronin, L. Verification and execution of the scientific literature via chemputation augmented by large language models. Commun. Chem. 2026, 9, 191. [Google Scholar] [CrossRef]
- Mitchener, Ludovico; Yiu, Angela; Chang, Benjamin; et al. Kosmos: An AI scientist for autonomous discovery. 2025. Available online: https://arxiv.org/abs/2511.02824.
- Gao, Shanghua; Fang, Ada; Huang, Yepeng; et al. Empowering biomedical discovery with AI agents. Cell 2024, 187(22), 6125–6151. [Google Scholar] [CrossRef]
- Luo, Ziming; Kasirzadeh, Atoosa; Shah, Nihar B. The more you automate, the less you see: Hidden pitfalls of AI scientist systems, 2025. NeurIPS 2025 AI4Science Workshop, Spotlight; Available online: https://arxiv.org/abs/2509.08713.
- Son, Guijin; Hong, Jiwoo; Fan, Honglu; Nam, Heejeong; Ko, Hyunwoo; Lim, Seungwon; Song, Jinyeop; Choi, Jinha; Paulo, Goncalo; Yu, Youngjae; Biderman, Stella. When AI co-scientists fail: SPOT—a benchmark for automated verification of scientific research. 2025. Available online: https://arxiv.org/abs/2505.11855.
- Chen, Jiayao; Liu, Shi; Yang, Linyi. StatefulDiscovery: Evidence-calibrated claim formation in open-ended scientific discovery, 2026. Available online: https://arxiv.org/abs/2606.11851.
- Zhang, Yan; Li, Shibo. ConsistencyGate: Preventing memory contamination in LLM agents via self-consistency admission control. 2026. Available online: https://arxiv.org/abs/2607.22962.
- Rasheed, Razeen A.; Banerjee, Somnath; Mukherjee, Animesh; Hazra, Rima. From fluent to verifiable: Claim-level auditability for deep research agents, 2026. Available online: https://arxiv.org/abs/2602.13855.
- Huang, Qian; Vora, J.; Liang, Percy; Leskovec, Jure. MLAgentBench: Evaluating language agents on machine learning experimentation. Proc. 41st Int. Conf. Mach. Learn. 2024, volume 235, pages 20271–20309. Available online: https://proceedings.mlr.press/v235/huang24y.html.
- Tser, Patrick; Kon, Jern; Ding, Qiuyi; Liu, Jiachen; Zhu, Xinyi; et al. EXP-Bench: Can AI conduct AI research experiments? International Conference on Learning Representations, 2026; Available online: https://proceedings.iclr.cc/paper_files/paper/2026/hash/c411f5b2d9c55f1685e72db224ad8b0e-Abstract-Conference.html.
- Chen, Ziru; Chen, Shijie; Ning, Yuting; et al. ScienceAgentBench: Toward rigorous assessment of language agents for data-driven scientific discovery. International Conference on Learning Representations, 2025; Available online: https://iclr.cc/virtual/2025/poster/32108.
- Prasad Majumder, Bodhisattwa; Surana, Harshit; Agarwal, Dhruv; et al. DiscoveryBench: Towards data-driven discovery with large language models. International Conference on Learning Representations, 2025; Available online: https://proceedings.iclr.cc/paper_files/paper/2025/hash/0d70af566e69f1dfb687791ecf955e28-Abstract-Conference.html.
- Starace, G.; Jaffe, O.; Sherburn, D.; et al. PaperBench: Evaluating AI’s ability to replicate AI research. Proc. 42nd Int. Conf. Mach. Learn. 2025, volume 267, pages 56843–56873. Available online: https://proceedings.mlr.press/v267/starace25a.html.
- Bragg, Jonathan; D’Arcy, Mike; Balepur, Nishant; et al. AstaBench: Rigorous benchmarking of AI agents with a scientific research suite. International Conference on Learning Representations, 2026; Available online: https://iclr.cc/virtual/2026/oral/10009972.
- Jansen, Peter A.; Côté, Marc-Alexandre; Khot, Tushar; Bransom, Erin; Mishra, Bhavana Dalvi; Majumder, Bodhisattwa Prasad; Tafjord, Oyvind; Clark, Peter. DiscoveryWorld: A virtual environment for developing and evaluating automated scientific discovery agents. Adv. Neural Inf. Process. Syst. 2024, volume 37. Available online: https://proceedings.neurips.cc/paper_files/paper/2024/hash/13836f251823945316ae067350a5c366-Abstract-Datasets_and_Benchmarks_Track.html. [CrossRef]
- Xu, Wanghan; Li, Shuo; Ye, Tianlin; et al. ResearchClawBench: A benchmark for end-to-end autonomous scientific research. 2026. Available online: https://arxiv.org/abs/2606.07591.
- Wang, Yuru; Cheng, Lejun; Zuo, Yuxin; et al. NatureBench: Can coding agents match the published SOTA of Nature-Family papers? 2026a. Available online: https://arxiv.org/abs/2606.24530.
- Wang, Zhen; Bai, Fan; Luo, Zhongyan; et al. FIRE-Bench: Evaluating AI agents on the rediscovery of scientific insights. In Proceedings of the 43rd International Conference on Machine Learning, 2026b; Available online: https://icml.cc/virtual/2026/poster/61975.
- Zheng, Lianmin; Chiang, Wei-Lin; Sheng, Ying; Zhuang, Siyuan; Wu, Zhanghao; Zhuang, Yonghao; Lin, Zi; Li, Zhuohan; Li, Dacheng; Xing, Eric P.; Zhang, Hao; Gonzalez, Joseph E.; Stoica, Ion. Judging LLM-as-a-judge with MT-Bench and chatbot arena. Adv. Neural Inf. Process. Syst.;Datasets Benchmarks Track. 2023, volume 36. Available online: https://papers.nips.cc/paper_files/paper/2023/hash/91f18a1287b398d378ef22505bf41832-Abstract-Datasets_and_Benchmarks.html. [CrossRef]
- Chen, Guiming Hardy; Chen, Shunian; Liu, Ziche; Jiang, Feng; Wang, Benyou. Humans or LLMs as the judge? a study on judgement bias. In Proceedings of the 2024 Conference on Empirical Methods in Natural Language Processing, 2024; pp. pages 8301–8327. Available online: https://aclanthology.org/2024.emnlp-main.474/. [CrossRef]
- Panickssery, Arjun; Bowman, Samuel R.; Feng, Shi. LLM evaluators recognize and favor their own generations. Adv. Neural Inf. Process. Syst. (NeurIPS) 2024, volume 37, 68772–68802. [Google Scholar] [CrossRef]
Figure 1.
The TruthInsight workflow. Initial exploration of the scientific data informs research question formulation (01) in relation to the scientific objectives. The system selects and designs tasks (02), executes them and checks the results (03), and then assesses the evidence and reviews the reasoning (04). Step 04 determines the next action: return to 02 when the current question needs further analysis; return to 01 when that question has been addressed but the scientific objectives require further investigation; or prepare a report when the objectives have been sufficiently addressed. Questions may be pursued through exploratory analysis, hypothesis testing, or literature review. The report organizes conclusions, supporting evidence, and scope by scientific discovery.
Figure 1.
The TruthInsight workflow. Initial exploration of the scientific data informs research question formulation (01) in relation to the scientific objectives. The system selects and designs tasks (02), executes them and checks the results (03), and then assesses the evidence and reviews the reasoning (04). Step 04 determines the next action: return to 02 when the current question needs further analysis; return to 01 when that question has been addressed but the scientific objectives require further investigation; or prepare a report when the objectives have been sufficiently addressed. Questions may be pursued through exploratory analysis, hypothesis testing, or literature review. The report organizes conclusions, supporting evidence, and scope by scientific discovery.
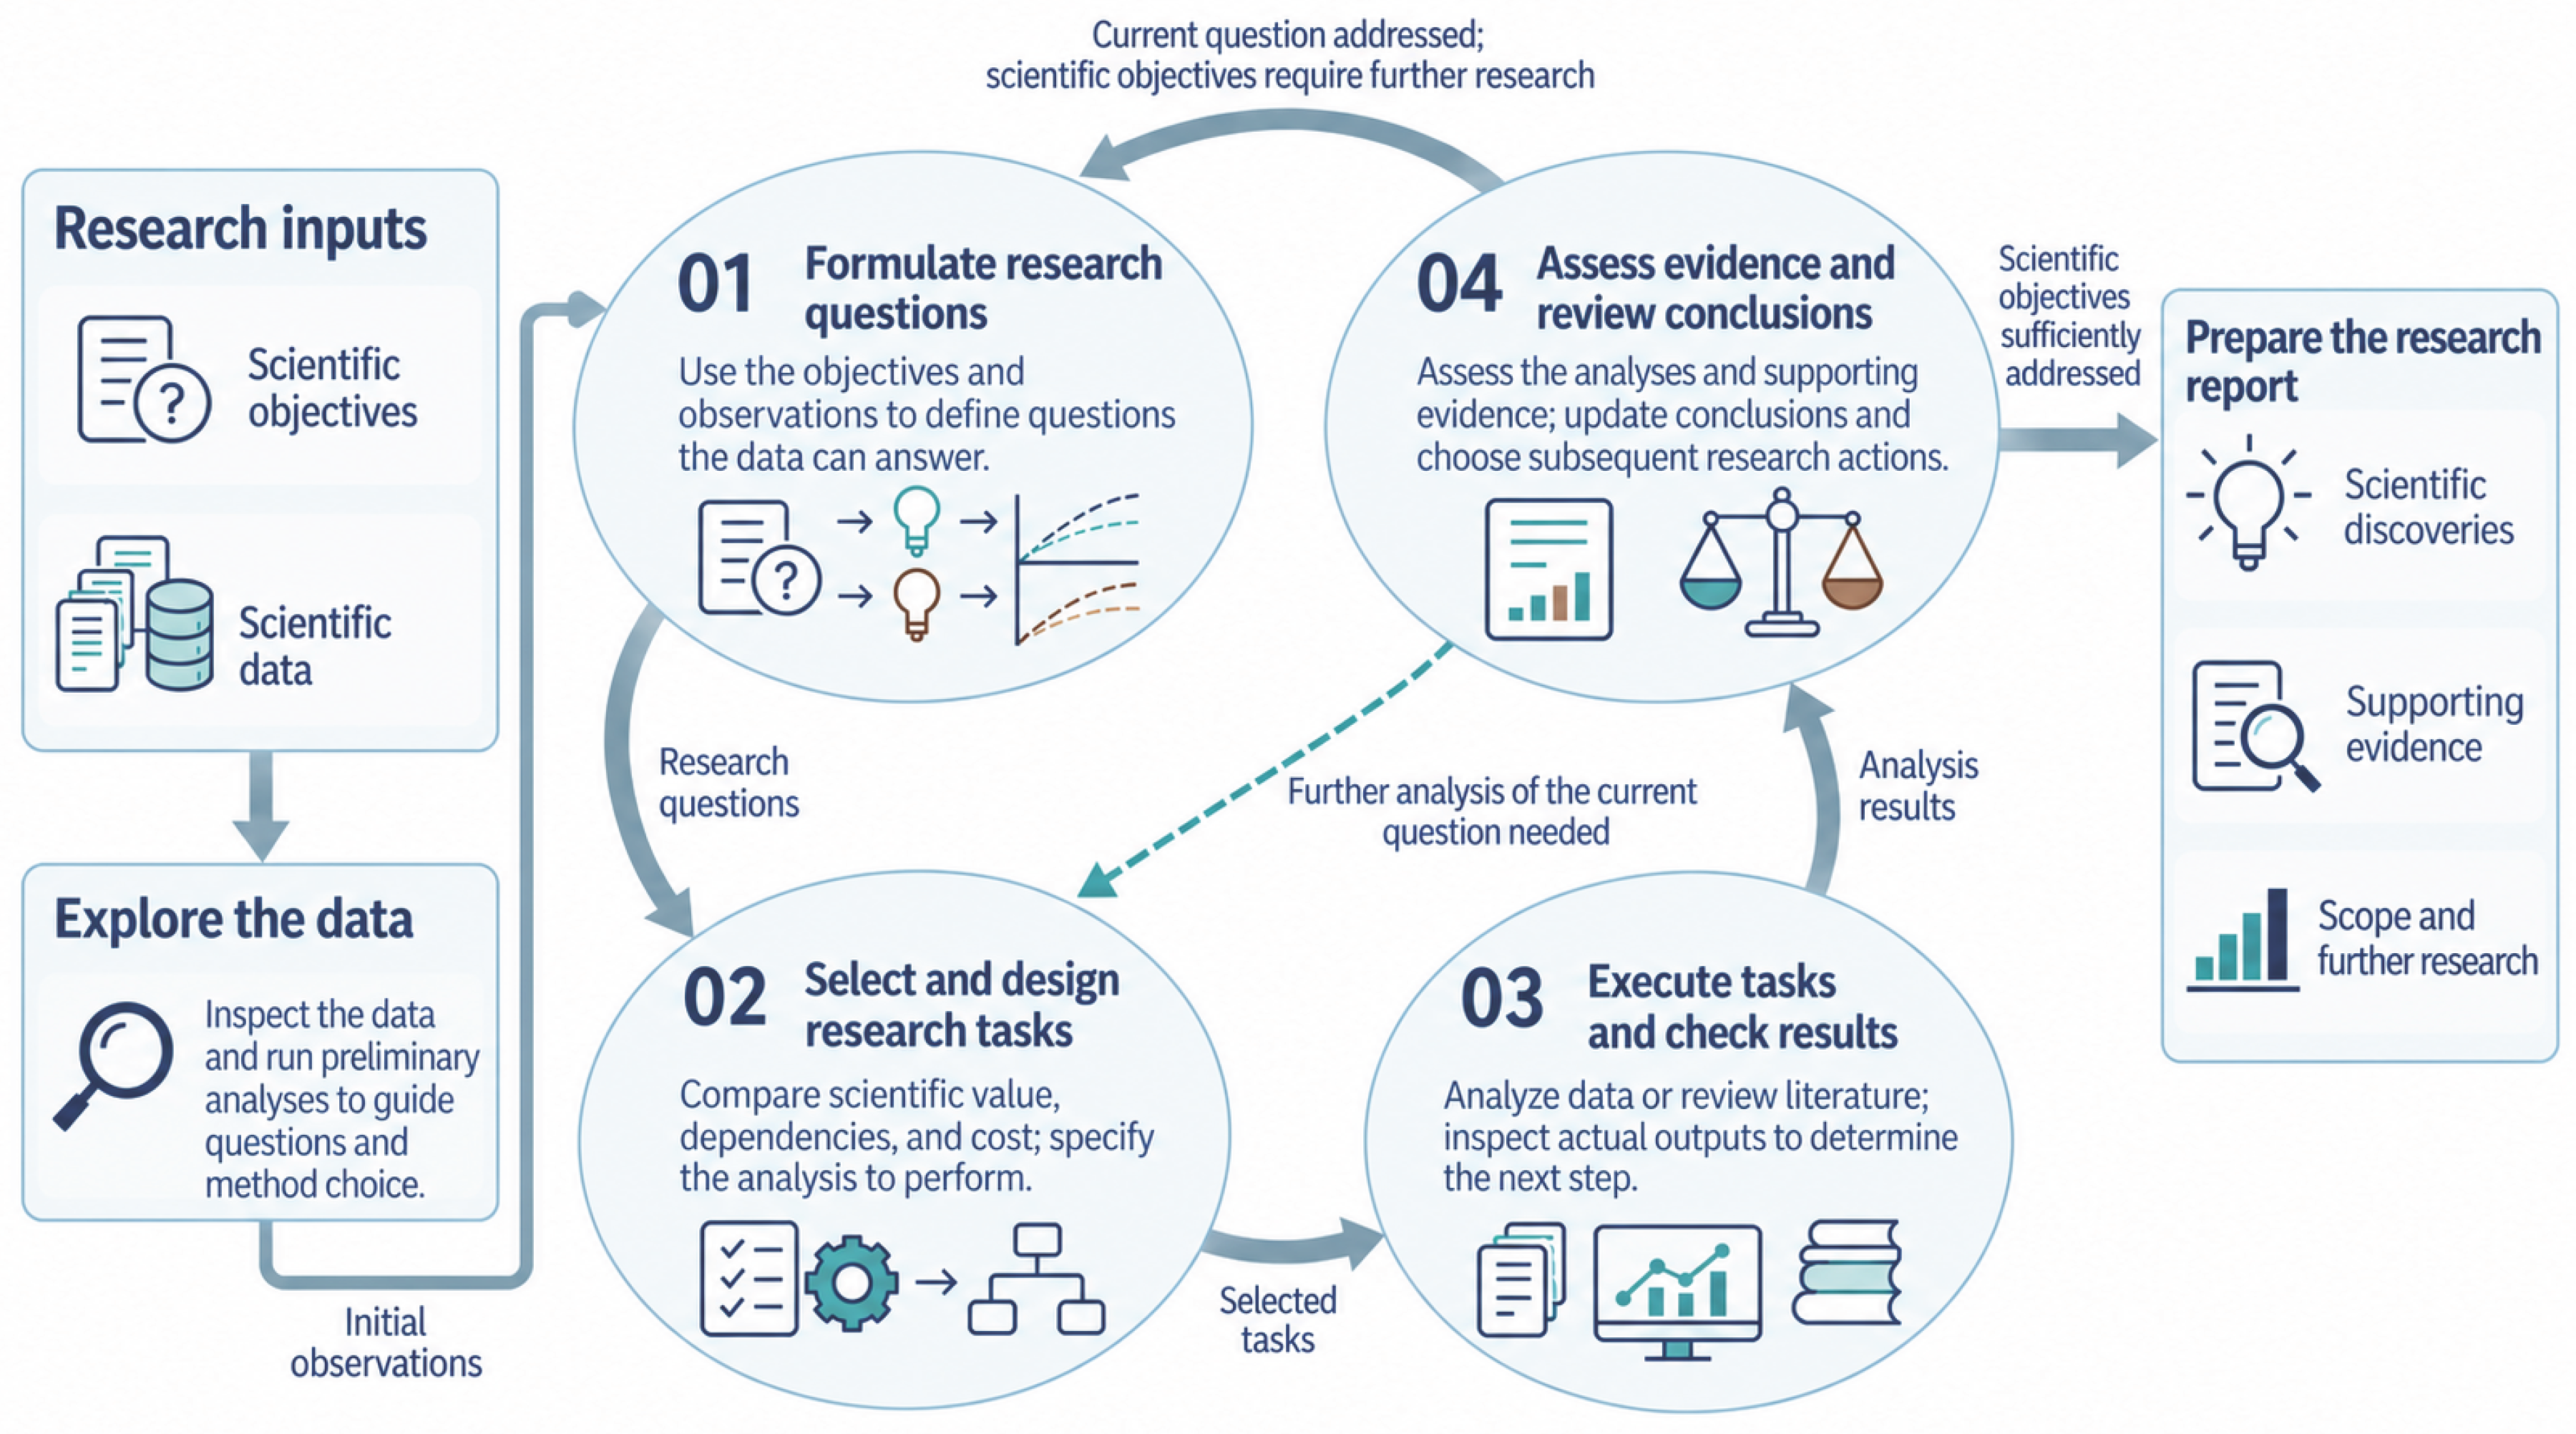
Figure 2.
Handling scientific review concerns within Step 04 of Figure 1. The system reviews the analyses and conclusions and then checks the existing evidence against each concern. If the evidence addresses a concern, the system updates the conclusion and its scope directly. Otherwise, task selection and execution supply additional evidence, which is then used to reassess the conclusion and determine the next research action.
Figure 2.
Handling scientific review concerns within Step 04 of Figure 1. The system reviews the analyses and conclusions and then checks the existing evidence against each concern. If the evidence addresses a concern, the system updates the conclusion and its scope directly. Otherwise, task selection and execution supply additional evidence, which is then used to reassess the conclusion and determine the next research action.
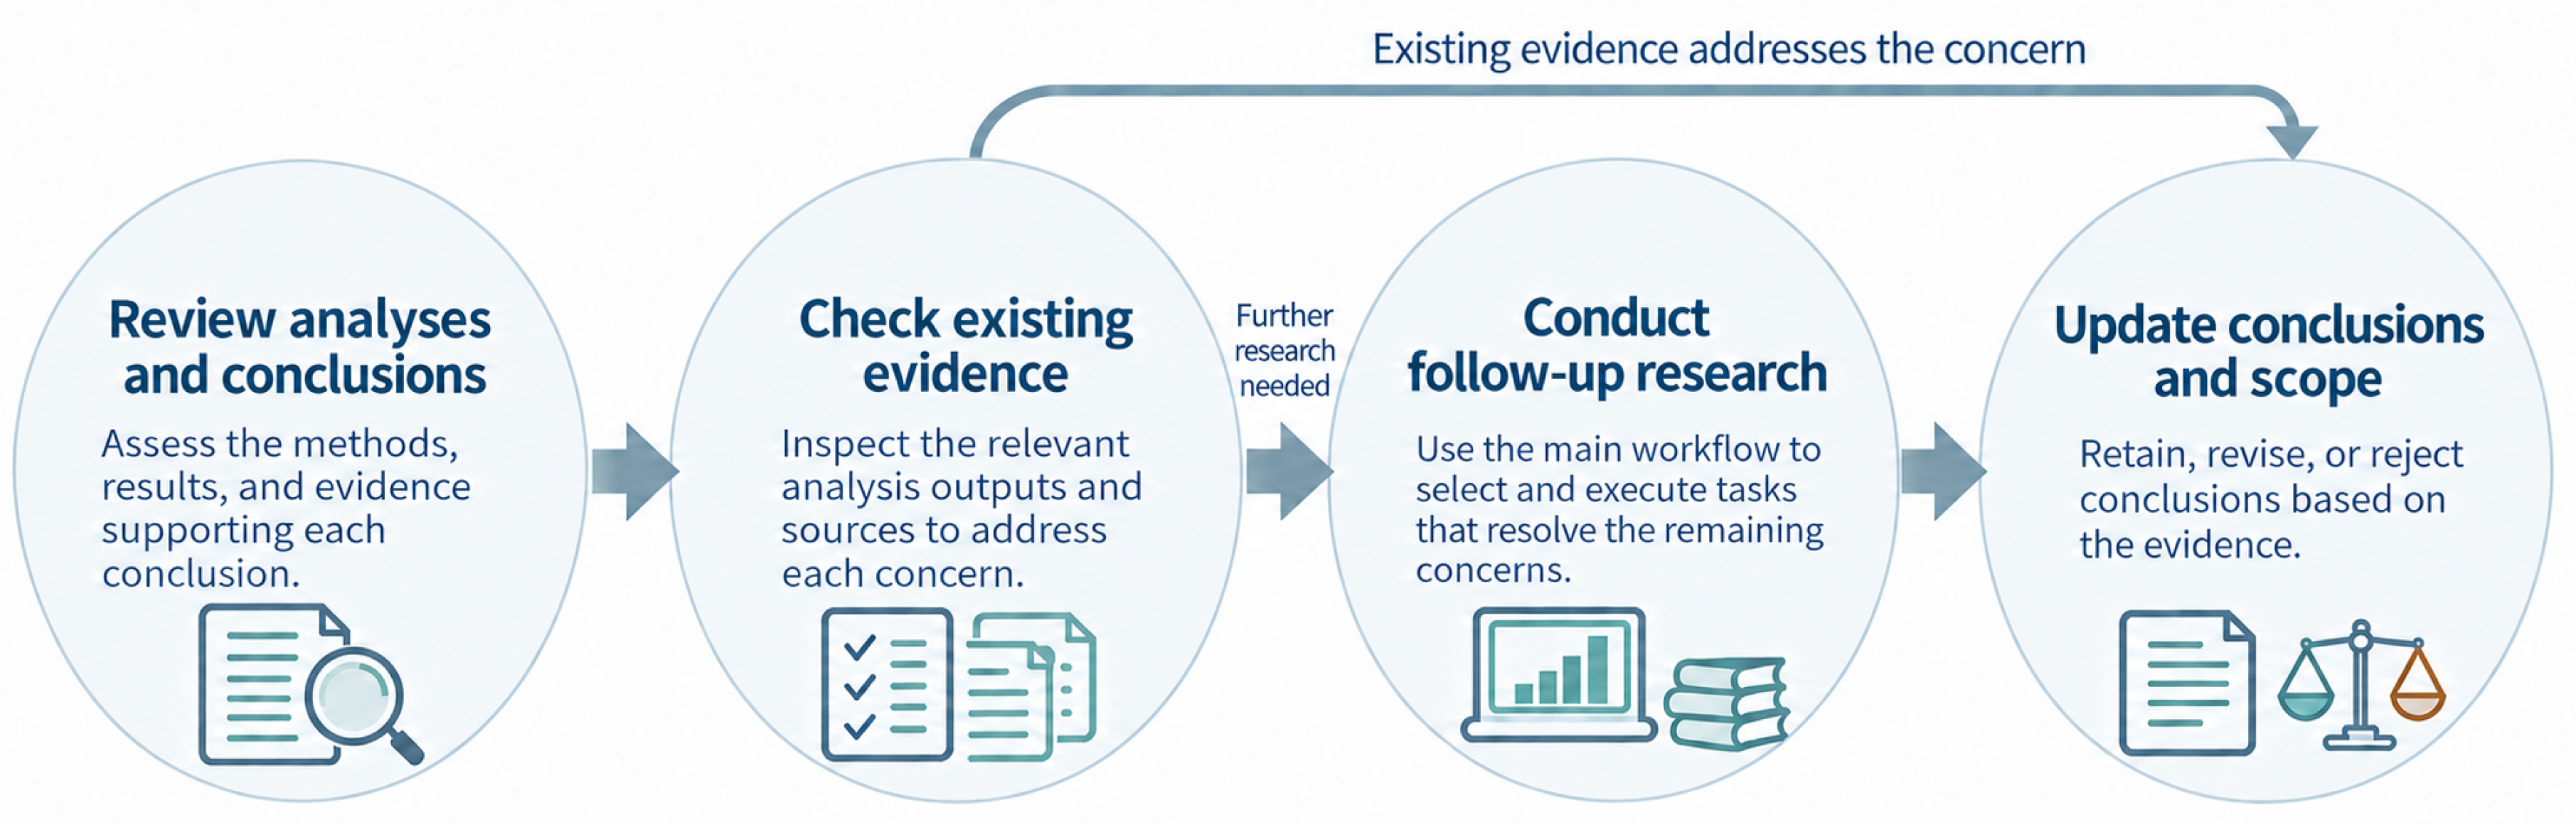
Figure 3.
Overall performance and paired task-score differences. Left: mean scores across the 40 tasks. Right: mean paired differences between TruthInsight and each baseline, with 95% paired bootstrap intervals. Both panels use the same task set; paired resampling preserves the correspondence between systems on each task.
Figure 3.
Overall performance and paired task-score differences. Left: mean scores across the 40 tasks. Right: mean paired differences between TruthInsight and each baseline, with 95% paired bootstrap intervals. Both panels use the same task set; paired resampling preserves the correspondence between systems on each task.
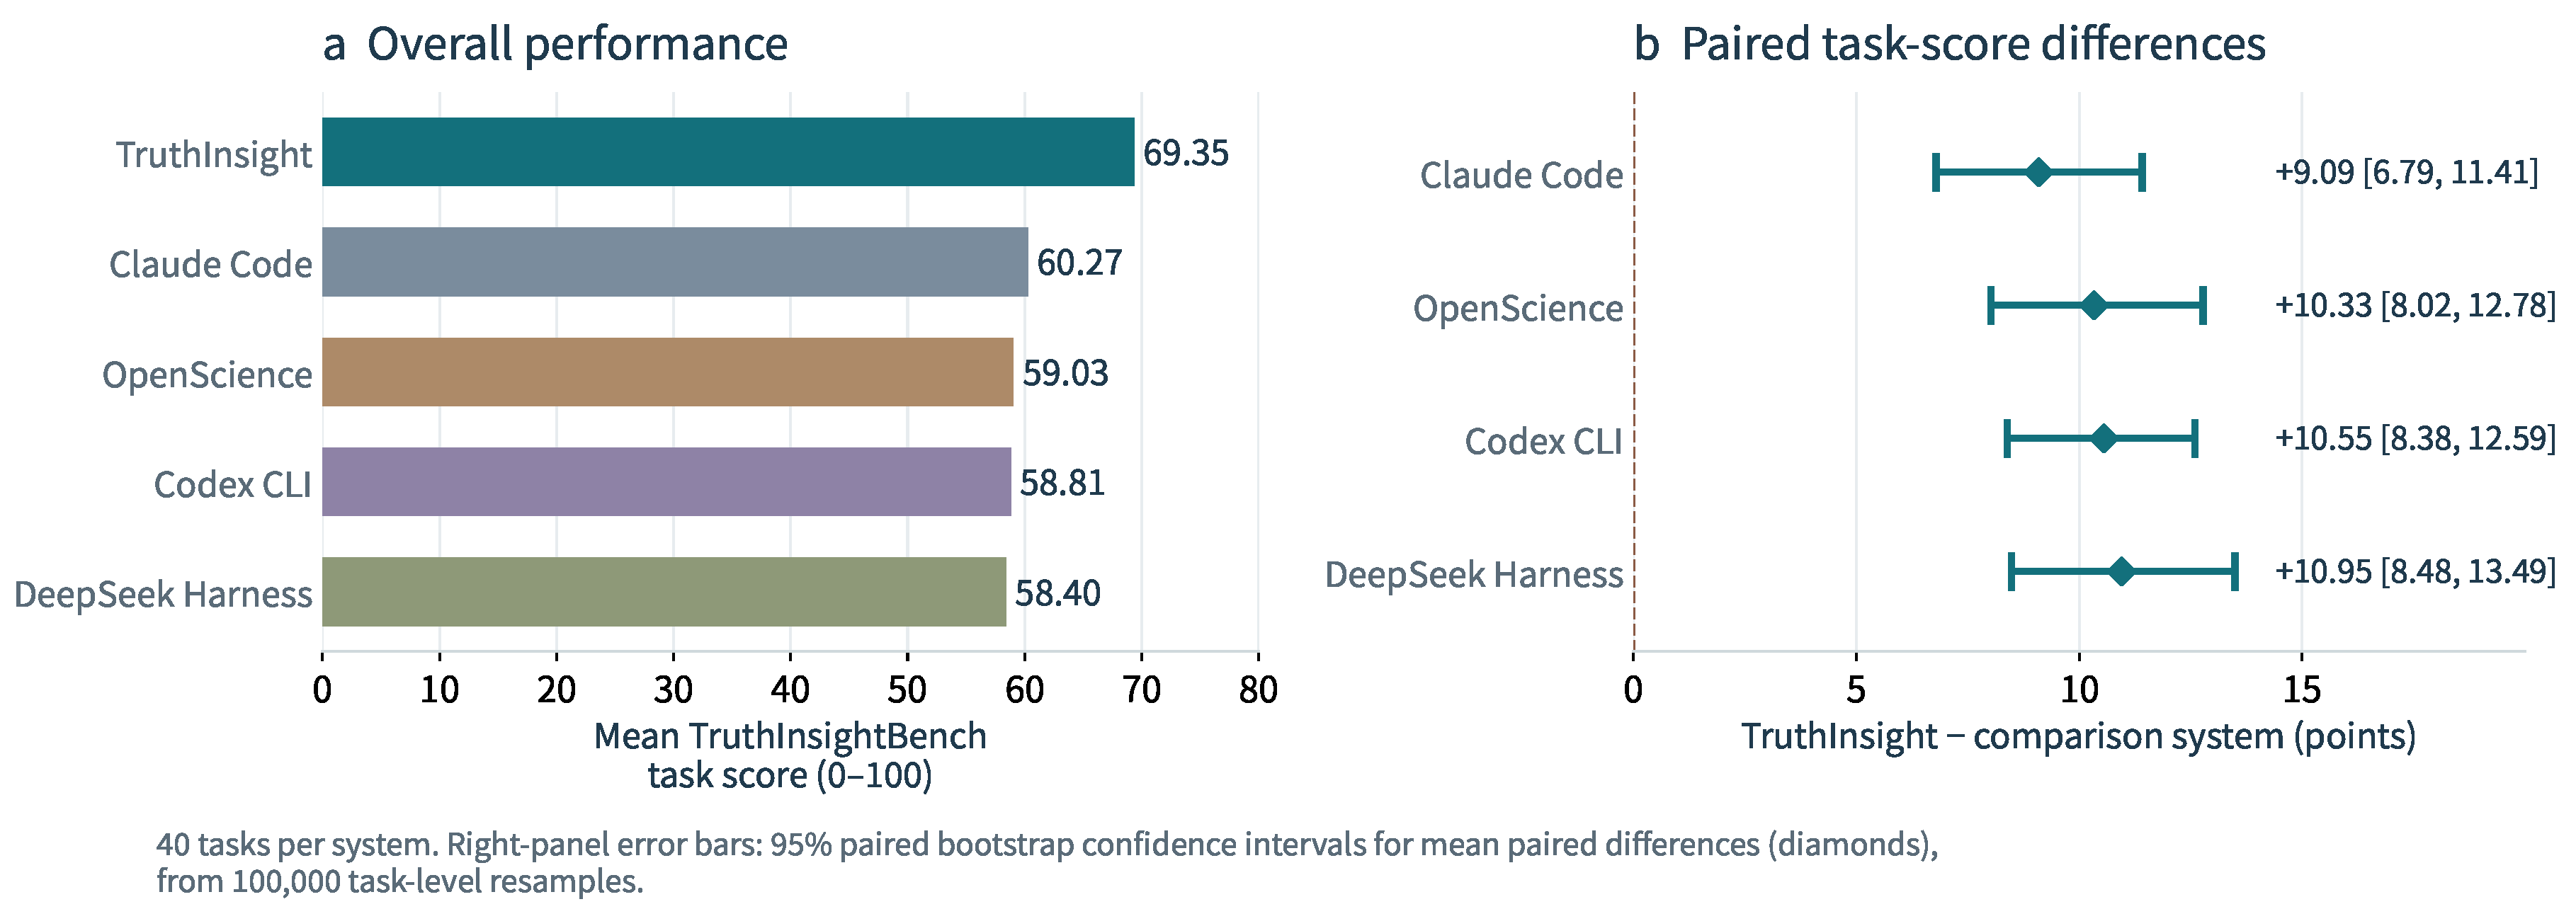
Figure 4.
Scientific discovery quality across six dimensions. Diamonds denote TruthInsight, circles denote individual baselines, and gray lines span the minimum and maximum baseline means. The horizontal axis gives the mean normalized dimension score (%) across all candidate scientific discoveries; higher values are better. Gray lines show the baseline range, not confidence intervals. The dimensions carry different weights in the discovery-quality score.
Figure 4.
Scientific discovery quality across six dimensions. Diamonds denote TruthInsight, circles denote individual baselines, and gray lines span the minimum and maximum baseline means. The horizontal axis gives the mean normalized dimension score (%) across all candidate scientific discoveries; higher values are better. Gray lines show the baseline range, not confidence intervals. The dimensions carry different weights in the discovery-quality score.
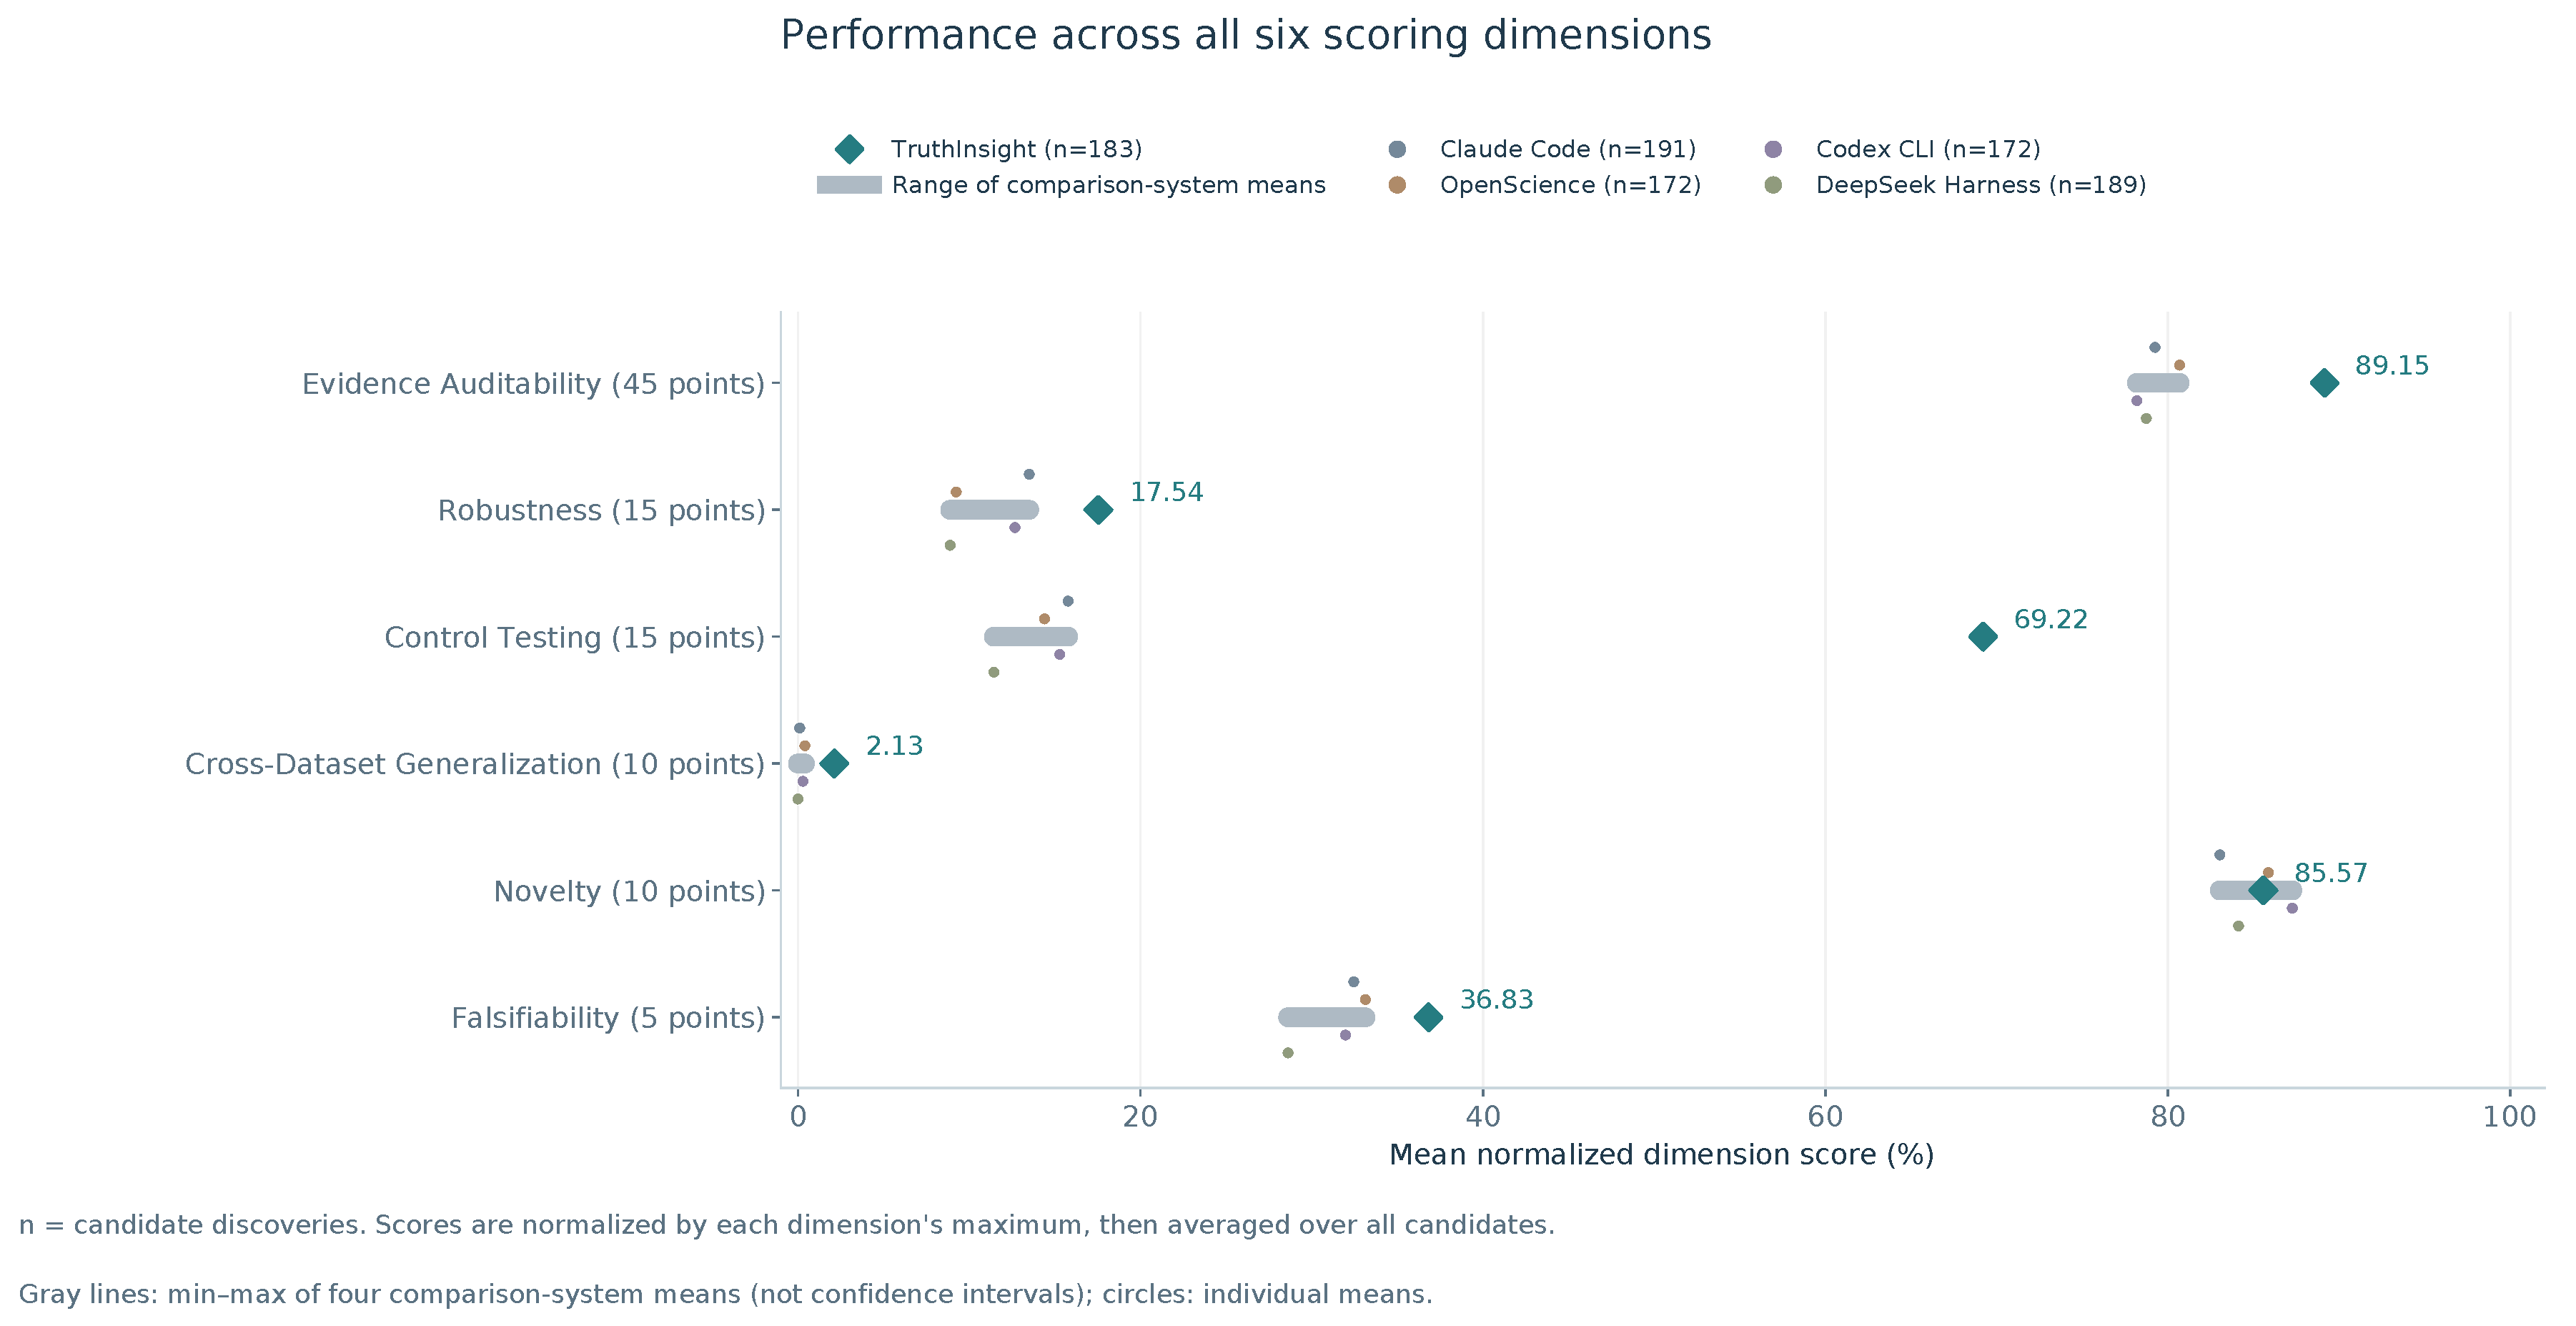

Table 1.
Factors and weights for ranking candidate tasks. Each factor receives an ordinal estimate from 1 to 5. The weights specify heuristic preferences for research task selection. Information gain denotes the expected value of a task for scientific judgment, rather than a calibrated information-theoretic quantity.
Table 1.
Factors and weights for ranking candidate tasks. Each factor receives an ordinal estimate from 1 to 5. The weights specify heuristic preferences for research task selection. Information gain denotes the expected value of a task for scientific judgment, rather than a calibrated information-theoretic quantity.
| Factor | Judgment about the candidate task | Weight |
| Information gain | Ability to distinguish explanations or change the current assessment | 2 |
| Risk reduction | Value for identifying faulty premises or overstated interpretations | 2 |
| Resolving dependencies | Contribution to prerequisites for other research tasks | 1.5 |
| Domain relevance | Relevance to the scientific question and methodological requirements | 1.5 |
| Execution cost | Expected computation, tool use, and time |
Table 2.
Evaluated system configurations. All five evaluated systems use DeepSeek-V4-Flash with thinking disabled; the external evaluator is GLM-5.1 in its W4A8 quantized configuration, also with thinking disabled.
Table 2.
Evaluated system configurations. All five evaluated systems use DeepSeek-V4-Flash with thinking disabled; the external evaluator is GLM-5.1 in its W4A8 quantized configuration, also with thinking disabled.
| System | Reported version | Common base model |
| TruthInsight | Research prototype | DeepSeek-V4-Flash |
| Claude Code | v2.1.220 | DeepSeek-V4-Flash |
| OpenScience | v2.0.1 | DeepSeek-V4-Flash |
| Codex CLI | v0.149.0 | DeepSeek-V4-Flash |
| DeepSeek Harness | v0.1.0rc7 | DeepSeek-V4-Flash |
| External evaluator | GLM-5.1 (W4A8) | — |
Table 3.
Descriptive statistics across the 40 tasks, computed from unrounded task scores.
| System | Mean | Cross-task SD | Min | Max | First / top-two tasks |
| TruthInsight | 69.3525 | 5.2060 | 53.8 | 80.1 | 33 / 37 |
| Claude Code | 60.2675 | 6.1589 | 44.3 | 72.9 | 3 / 15 |
| OpenScience | 59.0275 | 6.2804 | 36.2 | 67.4 | 1 / 9 |
| Codex CLI | 58.8050 | 5.0267 | 46.8 | 70.8 | 2 / 11 |
| DeepSeek Harness | 58.4000 | 6.7470 | 43.8 | 72.2 | 1 / 8 |
Table 4.
Paired comparisons of TruthInsight against each baseline across the 40 matched tasks. All four two-sided Wilcoxon signed-rank tests are significant at .
Table 4.
Paired comparisons of TruthInsight against each baseline across the 40 matched tasks. All four two-sided Wilcoxon signed-rank tests are significant at .
| TruthInsight minus | Mean diff. | 95% paired bootstrap CI | Wins–losses | Wilcoxon p | |
| Claude Code | +9.09 | [6.78, 11.41] | 35–5 | 1.20 | |
| OpenScience | +10.33 | [8.02, 12.75] | 38–2 | 1.33 | |
| Codex CLI | +10.55 | [8.37, 12.58] | 37–3 | 1.53 | |
| DeepSeek Harness | +10.95 | [8.48, 13.45] | 38–2 | 1.34 |
Table 5.
Performance across scientific domains. Values are mean task scores within each domain, on a 100-point scale; the Tasks column gives the number of tasks in that domain.
Table 5.
Performance across scientific domains. Values are mean task scores within each domain, on a 100-point scale; the Tasks column gives the number of tasks in that domain.
| Domain | Tasks | TruthInsight | Claude Code | OpenScience | Codex CLI | DeepSeek Harness |
| Astronomy | 3 | 70.67 | 56.17 | 51.30 | 56.90 | 58.50 |
| Chemistry | 3 | 70.07 | 61.57 | 61.80 | 60.83 | 57.63 |
| Computational mathematics | 4 | 71.45 | 57.50 | 60.40 | 56.85 | 56.10 |
| Earth science | 4 | 70.28 | 61.38 | 60.43 | 61.40 | 60.70 |
| Energy science | 4 | 68.40 | 61.70 | 62.15 | 59.35 | 55.35 |
| Information science | 4 | 69.98 | 60.45 | 61.25 | 58.93 | 61.98 |
| Life science | 5 | 69.90 | 62.68 | 62.06 | 58.44 | 62.06 |
| Materials science | 4 | 67.63 | 64.98 | 57.05 | 54.88 | 57.25 |
| Neuroscience | 4 | 69.58 | 56.43 | 59.25 | 60.33 | 58.58 |
| Physics | 5 | 66.64 | 58.88 | 53.88 | 59.98 | 55.50 |
Table 6.
Discovery breadth, semantic duplication, and evidence quality of the top two semantically distinct groups per task.
Table 6.
Discovery breadth, semantic duplication, and evidence quality of the top two semantically distinct groups per task.
| System | Candidate discoveries |
Deduplicated groups |
Groups per task |
Merged entries |
Duplication rate |
Top-two quality per task (max 80) |
| TruthInsight | 183 | 153 | 3.825 | 30 | 16.4% | 54.252 |
| Claude Code | 191 | 172 | 4.300 | 19 | 9.9% | 44.580 |
| OpenScience | 172 | 149 | 3.725 | 23 | 13.4% | 44.165 |
| Codex CLI | 172 | 146 | 3.650 | 26 | 15.1% | 44.105 |
| DeepSeek Harness | 189 | 163 | 4.075 | 26 | 13.8% | 43.325 |
Table 7.
Normalized six-dimension score rates (%). “DeepSeek H.” denotes DeepSeek Harness.
| Dimension | TruthInsight | Claude Code | OpenScience | Codex CLI | DeepSeek H. |
| Evidence Auditability | 89.15 | 79.25 | 80.68 | 78.19 | 78.74 |
| Robustness | 17.54 | 13.51 | 9.24 | 12.67 | 8.89 |
| Control Testing | 69.22 | 15.78 | 14.40 | 15.29 | 11.45 |
| Cross-Dataset Generalization | 2.13 | 0.10 | 0.41 | 0.29 | 0.00 |
| Novelty | 85.57 | 83.04 | 85.87 | 87.27 | 84.13 |
| Falsifiability | 36.83 | 32.46 | 33.14 | 31.98 | 28.62 |
Table 8.
Mean item scores for the five control-testing items, computed over all candidate discoveries, with the strongest baseline for each item.
Table 8.
Mean item scores for the five control-testing items, computed over all candidate discoveries, with the strongest baseline for each item.
| Control item | Max | TruthInsight | Best baseline | Difference |
| Simple baseline | 3 | 2.771 | 0.968 (Codex CLI) | +1.802 |
| Negative control | 3 | 2.123 | 0.297 (Codex CLI) | +1.826 |
| Competing explanations | 4 | 2.820 | 0.440 (Claude Code) | +2.380 |
| Confound and analysis-artifact test | 2 | 1.301 | 0.674 (Codex CLI) | +0.626 |
| Cross-method corroboration | 3 | 1.369 | 0.087 (Codex CLI / OpenScience) | +1.282 |
Disclaimer/Publisher’s Note: The statements, opinions and data contained in all publications are solely those of the individual author(s) and contributor(s) and not of MDPI and/or the editor(s). MDPI and/or the editor(s) disclaim responsibility for any injury to people or property resulting from any ideas, methods, instructions or products referred to in the content. |
© 2026 by the authors. Licensee MDPI, Basel, Switzerland. This article is an open access article distributed under the terms and conditions of the Creative Commons Attribution (CC BY) license (http://creativecommons.org/licenses/by/4.0/).
Copyright: This open access article is published under a Creative Commons CC BY 4.0 license, which permit the free download, distribution, and reuse, provided that the author and preprint are cited in any reuse.