
Submitted:
16 September 2026
Posted:
17 September 2026
You are already at the latest version
Abstract
Location-based digital out-of-home (DOOH) media is becoming the fastest-growing offline advertising channel. Global OOH spending is projected to reach $54.2 billion in 2025, including $25.5 billion in digital spending, rising to $28.0 billion in 2026; North American OOH revenue has reached $9.46 billion, with digital screens contributing 36.3%. However, in-store attribution conflicts with privacy regulation: 20 U.S. states have enacted comprehensive privacy laws, most treating precise geolocation as sensitive data, while some prohibit location-data sales within a 1,750-ft (≈533-m) radius, creating an approximately 26-fold gap relative to the 20-m precision required for geofence attribution. We develop an identifier-free region-level spatiotemporal framework that learns counterfactuals from 12-week pre-placement foot-traffic sequences, represents spatial dependence through a sparse neighborhood graph, and combines hierarchical Bayesian estimation with a distance-decay kernel. Privacy computation runs at the edge: 15-min events are aggregated into 1-h windows, windows with fewer than 20 independent events are suppressed, each device contributes once per window, and differential-privacy noise is added; raw coordinates, continuous trajectories, and stable identifiers are not centrally stored. Posterior increments are converted into revenue weights, while placement selection is solved as a budget-constrained submodular coverage problem using a sparse coverage index, max-heap lazy greedy search, and partial enumeration of three candidate placements, retaining the 1−1/e approximation guarantee. Calibration used 23 cities, 133 authorized dealers, 23,901 placement weeks, 3.05 million geofences, and 68 million geocoded POIs with positioning error radii ≤20 m, yielding observed in-store increments of 10.7% (95% CI: 7.9%–13.5%) and 9.8% (6.6%–13.0%). After degrading resolution to 533 m and setting ε=1.0, estimation deviation was 1.8 percentage points, 95% interval coverage was 93.6%, and the minimum detectable increment at 80% power was 4.6%. Spillovers were significantly positive and decayed monotonically within 1.2 km; ignoring them would underestimate increment by about 2.1 percentage points. At the same budget, effective reach increased by 23.4%, or media cost fell by 18.6% at the same increment, demonstrating a deployable attribution-and-allocation pipeline under coarse geolocation constraints.
Keywords:
venue-based digital out-of-home media
; incremental store visits
; hierarchical Bayesian geostatistical experiments
; differential privacy
; spatial spillover
; submodular optimization
; privacy-compliant measurement
1. Introduction
Venue-based digital out-of-home media offers continuous coverage of offline consumption situations through digital screens in commercial complexes, transportation hubs, retail stores and public places. Advertising value is gradually associated with actual incremental store visits rather than process indicators such as impression volume or cost per thousand. However, in-store attribution generally requires device-level location trajectories, precise geofencing and user identifiers to link impressions with visits. As precise geolocation data is now regarded as sensitive information under the law, the former attribution chain has created serious compliance problems in data collection, cross-entity transmission and continuous tracking. Reduced spatial resolution and privacy disturbances have further introduced problems such as control group contamination, effect attenuation and loss of statistical power; thus, a new technical gap has appeared between media incremental measurement and budget allocation. To address this problem, we construct a region-level measurement and allocation framework that does not use individual identifiers. Geographic units, time windows and media placements are used as unified computational objects to generate counterfactual in-store trajectories through stratified geographic quasi-experiments and structured time series. A distance-decay kernel and a stratified Bayesian model are introduced to correct for spatial spillover, anonymity thresholds are combined with differential privacy at the edge, and a compliant statistical interface is formed. Based on this, the estimated geographic incremental posterior is converted into ad placement revenue weights; a monotonically submodular covering function is used to describe diminishing marginal returns under repeated exposure; and an inertial greedy algorithm is employed to solve for ad placement combinations subject to budget constraints. The relevant analysis focuses on the estimation accuracy after spatial granularity degradation, interval calibration under privacy perturbations, the impact of neighborhood spillover, and the efficiency of increment-driven allocation, establishing a computable and verifiable technical path for performance evaluation and budget decision-making of location-based digital out-of-home media under the framework of privacy laws.
2. Modeling the Problem of Incremental In-Store Measurement and Budget Allocation Under Location Data Compliance Constraints
To address the loss of device-level exposure-to-visit linkage, the computation is organized through a three-tier structure of geographic unit, time window, and media placement. Each geographic unit is represented by six fields—in-store count, aggregated impressions, historical foot traffic, campaign cost, placement distance, and neighborhood impressions—while treatment status and placement decisions are encoded as binary variables. Spatial adjacency is stored as an N×N sparse distance matrix that retains only valid neighborhood edges, reducing unnecessary pairwise spatial operations in subsequent spillover computation [1] .The system organizes inputs by geographic unit , statistical period , and candidate ad placements . Unit status consists of six fields: in-store counts, aggregated impressions, historical foot traffic, campaign costs, placement distance, and neighborhood impressions; processing status is encoded as 0/1, and placement decisions also use 0/1 variables. The distance matrix is stored in a sparse structure as described at , retaining only valid neighborhood edges.To prevent precise coordinates from reaching the central node, location events are first mapped to zone counts, then undergo anonymous threshold checks and privacy perturbations to generate computable statistics. The measurement side estimates the conditional increment for each zone, and the configuration side uses this increment as the ad placement coverage benefit. Under the total budget BB, a unified optimization objective is defined as follows:
where indicates whether ad unit is selected, is the corresponding cost, is the probability of effective coverage of ad unit for region , is the in-store increment for the region, and is the expected increment in coverage revenue generated by the budget combination. This modeling unifies subsequent counterfactual estimation, spatial spillover correction, privacy statistics, and sub-model budget optimization within a single data interface [2].
3. Design of a Model for Measuring Incremental In-Store Visits and Budget Allocation for Location-Based Digital Out-of-Home Media Under Location Data Compliance Constraints
3.1. Stratified Geographical Quasi-Experiments and Construction of Structured Time-Series Counterfactuals
On the basis of the geographic unit–time window–media placement hierarchy, the measurement target is defined as the post-placement incremental store-visit effect for treated geographic units. Specifically, the counterfactual is the store-visit trajectory that the same treated unit would have exhibited during the post-placement period had the media placement not occurred, and the incremental effect is obtained from the difference between the observed treated trajectory and this estimated untreated trajectory. The state variables were uniformly coded as 0/1, and the candidate control units in the same geographical area were selected according to the urban borders [3].For each treated subgroup, candidate controls were restricted to untreated geographic units within the same city. Matching used the 12-week pre-placement store-visit sequence together with a five-dimensional status vector comprising historical store visits, aggregated impressions, pedestrian-traffic trends, weekday effects, and fixed regional features.Subsequently, the counterfactual trajectory under the untreated state is estimated using structured time series. The identification of this incremental effect is based on four conditions: the treated units exhibit no anticipatory response prior to the formal rollout; the matched treated and candidate control units possess sufficient common support; given the in-store trajectories and regional covariates from 12 weeks before the rollout, the untreated potential outcomes of both groups are comparable; cross-regional interference is separately characterized by a spatial spillover term and not absorbed into the control trajectory. The state equation is expressed as:
where represents the counterfactual visit volume for treatment zone at time , represents the local level state, represents the control zone covariate vector, represents the dynamic regression coefficients, represents the period indicator variable, represents the period effect parameter, and represents the random disturbance.Within each city, candidate controls were first screened for treatment contamination and data completeness and were then matched to treated units using the 12-week pre-placement trajectory and the five-dimensional status vector. Units without adequate common support or showing systematic pre-placement divergence were excluded before counterfactual estimation.Then, the treatment effect and the counterfactual sequence were output, and the spatial spillover correction was applied. Figure 1 illustrates the overall hierarchy of computation.
3.2. Hierarchical Bayesian Model for Estimating Incremental Store Visits Considering Spatial Spillover
In order to avoid treatment contamination due to adjacent geographical units sharing customer traffic and media visibility ranges, the model divides the in-store effect into local direct incremental and neighborhood spillover increments, and uses three levels of stochastic effects to control the spatial heterogeneity: city-store—geographical unit [4]. Neighborhood exposure is calculated using the truncated exponential distance-decay kernel in Equation (3). Specifically, the kernel weight is for neighboring units within the maximum radius km and is set to zero for. Here, is the centroid-to-centroid geographic distance and hh is the decay bandwidth. The 0.2-km value used in the empirical analysis denotes the distance-bin resolution for identifying the decay profile rather than the maximum spillover distance:
where represents the spillover exposure of unit at time , represents the aggregated exposure of the adjacent unit , represents the distance between the centers of mass of the two units, and represents the distance decay bandwidth. Store visit counts are described using a negative binomial distribution to account for excessive discretization:
where is the store visit count, is the conditional mean, is the dispersion parameter, is the city-level random intercept, is the store-level random effect, is the advertising status, is the direct increment coefficient, is the spatial spillover coefficient, are the control variables for foot traffic, cycle, and region, and are the corresponding parameters. To achieve cross-regional information contraction, the formula is as follows:
Specifically, represents the city-level average effect, represents the overall effect, and and represent the variances at the regional and city levels, respectively.Posterior computation is performed using four parallel Markov chains with 4,000 iterations per chain, of which the first 2,000 iterations are used for warm-up, leaving 8,000 post-warm-up draws across the four chains. Convergence is evaluated using the original convergence criterion together with an effective sample size greater than 1,000; the retained posterior samples are used to calculate the direct-increment and spillover-increment distributions passed to the subsequent allocation module. The output includes direct increments, spillover increments, and their posterior distributions, providing a unified parameter interface for subsequent privacy-preserving statistical inputs and budget benefit calculations [5].
3.3. Compliance Statistics Mechanism Based on Edge Anonymization and Differential Privacy
To prevent device-level location trajectories from reaching the central computing node, a statistical mechanism has established a four-stage processing chain of data collection, edge aggregation, anonymity verification and privacy-preserving publication. Terminal events retain only five types of fields: geographic unit code, 15-minute time bucket, media placement ID, exposure count, and in-store visit count; device identifiers are immediately deleted after undergoing a 64-bit irreversible hash at the edge. Four consecutive 15-minute buckets within the same geographic unit are merged into one 1-hour statistical window. A window is released only when it contains at least 20 independent events; otherwise, it remains in the rolling cache for up to 24 hours and is not uploaded as an independent record.Data that falls below this threshold is stored in a rolling cache for up to 24 hours and is not uploaded separately to [6]. Edge nodes apply contribution bounding to three count variables—exposure count, store-visit count, and effective-coverage count—and restrict each device to at most one contribution in each statistical window before privacy noise is generated. This bound fixes the maximum per-window contribution used by the privacy-processing module and prevents repeated events from the same device from directly increasing the released count. After contribution bounding, each released region–time count is independently protected by a Laplace mechanism. Because one device contributes at most once to a released count within each 1-hour statistical window, the sensitivity of an individual count query is fixed at 1. For a per-query privacy budget , Laplace noise with scale is added before transmission. Under add-or-remove-one-device adjacency, each release therefore satisfies-differential privacy. When the same device can contribute to multiple released windows or count queries, the edge-side privacy ledger records the cumulative budget according to sequential composition. Rounding and non-negative truncation, when required for count-valued model inputs, are performed only after perturbation and do not weaken the privacy guarantee. Each released record contains five fields: region ID, timestamp, perturbed count, noise scale, and quality flag.The records are transmitted through a TLS 1.3-encrypted channel in batches of no more than 512 records, so the central node receives only bounded-size anonymous statistical packets rather than device-level trajectories. The central server collects only region-level anonymous statistics and does not save raw coordinates, continuous trajectories, or stable user IDs. Thus, the following incremental estimates and ad placement budget calculations will be carried out solely in a de-identified statistical environment [7].
3.4. Media Budget Allocation Algorithm Based on Sub-Model Coverage Maximization
The media assignment module uses the posterior in-store increment of each geographical unit as the revenue weight, coding the candidate ad slot selection as 0/1 integer, and input three kinds of matrix at the same time: ad slot cost, coverage probability, and area increment [8]. In order to reduce the over-estimation of revenue resulting from the overlapping of multiple ad slots in the same client flow area, a probability coverage function with decreasing marginal returns is adopted, and the problem is solved in the budget ceiling B:
where is the set of candidate ad placements, is the subset of selected ad placements, is the number of geographic units, is the posterior in-store increment for unit , is the effective coverage probability of ad placement for unit , and is the ad placement cost. During calculation, the marginal revenue density is used to determine the priority of candidate ad placements:
where represents the incremental revenue per unit cost for ad slot under the current set .The implementation maintains candidate marginal revenue densities in a max-heap and recalculates only the heap-top candidate at each iteration. To handle heterogeneous placement costs, feasible seed sets containing no more than three placements are partially enumerated, after which the remaining candidates are selected according to marginal revenue per unit cost. Sparse coverage indices are used so that only geographic units affected by a newly accepted placement are updated. Under the stated submodularity condition, this procedure retains the 1−1/eapproximation bound [9]. To make the computational procedure corresponding to Equations (6)–(7) reproducible, the implementation of the partial-enumeration and lazy-greedy search is summarized in Algorithm 1. The procedure directly uses the posterior increment , coverage probability , placement cost , and total budget already defined above.
| Algorithm 1. Increment-Driven Lazy-Greedy Budget Allocation |
| Input: Regional posterior increments τi Placement coverage probabilities qip Placement costs cp Total budget B Output: Selected placement set S* 1: S* ← ∅ 2: Enumerate each feasible seed set T with |T| ≤ 3 and Σp∈T cp ≤ B 3: For each seed set T: 4: S ← T 5: Compute ρ(p|S) for every feasible p ∉ S using Eq. (7) 6: Insert candidate placements into a max-heap keyed by ρ(p|S) 7: while the heap is not empty: 8: Pop the current top candidate p 9: if Σj∈S cj + cp ≤ B: 10: Recalculate ρ(p|S) 11: if p still has the maximum feasible marginal density: 12: S ← S ∪ {p} 13: Update only geographic units covered by p 14: else: 15: Push p back into the max-heap with its updated key 16: if F(S) > F(S*): 17: S* ← S 18: return S* |
Ad slot state is represented by 1 bit flag, and a sparse index is used to store coverage relation. Only geographical units affected by newly added advertising slots shall be updated in each round. In order to visually demonstrate the correspondence between incremental measurements, media coverage intensity, and the location of candidate ad slots, a spatial distribution map of geographical increment is produced before calculation, as illustrated in Figure 2.
4. Experimental Results and Analysis
4.1. Experimental Design
Twenty-three cities and 133 authorised dealers were selected as the venue-level observation sample for the exTwenty-three cities and 133 authorised dealers were retained as the venue-level observation sample, comprising 23,901 placement-week records, 3.05 million geofences, and 68 million geocoded points of interest. For spatial-heterogeneity analysis, the same city sample was further characterized by geographic activity density derived from geocoded-POI and historical-foot-traffic intensity, by interior versus boundary geographic units, by local dealer concentration, and by pre-placement cross-region mobility connectivity. These strata were used only for robustness comparison and did not alter the principal treatment definition. For the high-precision sample, in-store visit records with a positioning error radius of no more than 20 m served as the ground truth benchmark. Weekly-level exposure-to-visit aggregation for ad placements was conducted within the same city boundaries and statistical periods.Next, keeping exposure volume, store foot traffic, and placement costs unchanged, spatial aggregation was evaluated at multiple cell sizes rather than at a single coarse-graining level, with the 533-m setting retained as the principal compliance-motivated reference. For every spatial partition, the same treatment periods, privacy-processing rules, outcome definition, and evaluation metrics were maintained so that changes in bias, interval coverage, detectable effect, and spillover range could be attributed to spatial aggregation rather than to changes in the underlying sample.In the privacy experiment, the sensitivity analysis was extended from the single setting to . With unit query sensitivity, these budgets correspond to Laplace noise scales of 4.0, 2.0, 1.0, 0.5, and 0.25 count units, respectively. For each privacy budget, 200 independent perturbation replicates were generated from the same 533-m regional counts, and the same hierarchical Bayesian counterfactual model was refitted without changing the treatment units, control pool, 12-week pre-placement period, or posterior-sampling configuration. Estimation deviation, 95% interval coverage, minimum detectable increment at 80% power, and posterior-standard-deviation inflation relative to the unperturbed 533-m input were recorded for each budget.
The experimental evaluation included four linked tasks. First, the proposed structured time-series estimator was benchmarked against synthetic control, matched difference-in-differences, and an augmented inverse-probability weighted doubly robust estimator using the same treated units, candidate control pool, 12-week pre-placement period, and post-placement evaluation window. Second, placebo treatment dates within the pre-placement period and pre-trend diagnostics were used to examine whether an apparent increment could be generated by pre-existing differences between exposed and unexposed regions. Third, the 20-m high-resolution reference data and the 533-m privacy-preserved statistics were compared in terms of absolute deviation, 95% interval coverage, and the minimum detectable increment at 80% power.Spatial robustness experiments used the existing exponential kernel, 2.0-km search radius, and 0.2-km distance-bin resolution as the reference specification. Spatial placebo inference was conducted through 1,000 within-city permutations of neighborhood exposure labels while preserving city-level treatment incidence and marginal exposure totals. Kernel sensitivity was examined by replacing the exponential kernel with Gaussian and triangular kernels; distance sensitivity compared centroid-based projected Euclidean distance with great-circle distance; and the maximum neighborhood radius was varied across 1.0, 1.5, 2.0, and 2.5 km. The spillover coefficient, estimated effective range, and full-model versus no-spillover effect difference were recomputed under every specification [10].
4.2. Analysis of Incremental Measurement Accuracy Under Spatial Resolution Degradation and Privacy Perturbations
On the basis of the high precision ground truth data set and the coarse-grained privacy data set, we evaluate the incremental estimation errors. Under the 20-m high-resolution reference setting, the two reported samples produced incremental store-visit estimates of 10.7% and 9.8%, with 95% intervals of 7.9%–13.5% and 6.6%–13.0%, respectively. These estimates were treated as reference effects rather than as sufficient causal evidence by themselves; the same treated-control samples were therefore subjected to synthetic-control, difference-in-differences, and doubly robust estimation, together with placebo-date and pre-trend diagnostics. After spatial resolution was reduced to 533 m, the setting produced an absolute deviation of 1.8 percentage points from the 20-m high-resolution reference, a 95% interval coverage of 93.6%, and a minimum detectable increment of 4.6% at 80% power. This setting was retained as the central privacy benchmark in the expanded experiment. The additional , and 4.04.0 conditions were processed through the same hierarchical Bayesian counterfactual model so that privacy-induced perturbation and posterior partial pooling were assessed jointly rather than independently. For each budget, the change in posterior bias, interval coverage, and posterior dispersion relative to the unperturbed 533-m model was calculated over 200 perturbation replicates.
Across the common evaluation sample, the proposed estimator, synthetic control, difference-in-differences, and the doubly robust estimator produced closely comparable post-placement effects, while the pseudo-treatment estimates in the pre-placement period remained centered near zero. The joint pre-trend test did not indicate systematic divergence between treated and matched control units before placement, supporting the interpretation that the post-placement increment was not primarily driven by pre-existing regional trends.At the 533-m reference scale, the absolute estimation deviation was 1.8 percentage points, the 95% interval coverage was 93.6%, and the minimum detectable increment at 80% power was 4.6%. These quantities are therefore interpreted as the reference point of the spatial-sensitivity analysis rather than as evidence that one grid size is universally sufficient; the same three metrics are evaluated under finer and coarser regional partitions while all non-spatial settings are held fixed. In order to present the true increment interval and the precision variation with privacy constraints, the experiment results are drawn in a dual-pan format, as illustrated in Figure 3.
Figure 3 shows that even with the expansion of the spatial granularity from 20 meters to 533 meters, the model still maintains a high level of interference.Its coverage rate is 93.6%—just 1.4 percentage points below the theoretical 95% threshold; the 1.8-percentage point deviation from the actual value remains within controllable limits compared to the baseline increments of 9.8% to 10.7% for the two groups. Also, the 4.6% minimum detection increase is significantly lower than the high precision true value increments in the two groups, suggesting that, at 80% statistical power requirements, the area-level statistics still have an effective signal to noise ratio for identifying real media increments.The result shows that, at the 533-m reference scale, privacy perturbation is associated with a 1.8-percentage-point deviation, 93.6% interval coverage, and a 4.6% minimum detectable increment. The expanded privacy-budget experiment evaluates whether this calibration is preserved as the Laplace scale increases from 0.25 to 4.0 count units. Reliability is assessed from the joint behavior of posterior bias and empirical interval coverage rather than from point estimates alone, thereby separating noise introduced at the release layer from uncertainty absorbed or propagated by hierarchical Bayesian partial pooling.
4.3. Identification of Spatial Spillover Effects and Model Robustness Analysis
The distance decay term was identified after the exposure correlation matrix of adjacent geographical units, and the neighborhood contamination was examined with 2.0 km space search boundaries and 0.2 km distance bin. Under the reference exponential-kernel specification with a 2.0-km maximum radius and 0.2-km distance bins, the estimated spillover remained positive to approximately 1.2 km and declined with geographic distance. Removing the spatial term reduced the estimated incremental store-visit effect by 2.1 percentage points relative to the full model. The uncertainty of this difference was evaluated from paired full-model and no-spillover estimates across the 8,000 retained post-warm-up posterior draws, with the 2.5th and 97.5th percentiles defining the 95% credible interval. The same effect difference was then re-estimated under the placebo permutations and the alternative kernel, distance, and maximum-radius specifications, suggesting that when the adjacent non-ad units absorb some of the media’s influence, they are mistakenly treated as pure control regions, thus understating the direct effect.Under the 533-m reference partition, the spillover effect remained positive to approximately 1.2 km, and removal of the spatial term reduced the estimated store-visit increment by 2.1 percentage points.Robustness assessment combined the previously defined geographic heterogeneity analysis with the spatial-specification tests. The 1.2-km reference range and the 2.1-percentage-point full-versus-no-spillover difference were therefore examined across high- and low-activity-density cities, interior and boundary units, different dealer concentrations, alternative spatial partitions, three kernel families, two distance metrics, four maximum radii, and 1,000 within-city exposure permutations. A spillover interpretation is retained only when the observed spatial effect exceeds the permutation-based null distribution and preserves its direction under the alternative specifications. The 1.2-km spillover distance is therefore treated as an empirically estimated reference range whose stability must be evaluated jointly against geographic context and partition scale.In order to show the effective margin of spillover and the difference between the two estimates, the results are shown in a combination of left and right data plots, as illustrated in Figure 4.
4.4. Analysis of Incremental-Driven Budget Allocation Effects and Algorithm Performance
Based on the spatial correction of geographic unit increments as ad slot revenue weights, we input ad slot costs, effective coverage probabilities, and regional increment information for 23,901 ad slot weeks to test the submodel’s budget allocation results.In a fixed overall budget, the algorithm gives priority to ad placement combinations that have higher marginal incremental revenue per unit cost and lower coverage overlap, leading to an effective reach of 23.4% of the target audience compared to the initial allocation. While maintaining the same growth rate, the cost of media was reduced by 18.6% by eliminating low-margin and high-coverage overlap.The algorithm uses the monotonic suboptimal property of the coverage function to update the marginal returns, and uses a lazy greedy method to minimize the recalculations of invalid candidates; under budget constraints, its theoretical lower bound is 1-1/E, which guarantees about 63.2% of the optimum target. Comparison of the results of the decision making under the two assignment targets is presented in Table 1.
5. Conclusions
Under location-data compliance constraints, this study establishes a region-level computer-processing chain that connects spatiotemporal data aggregation, counterfactual computation, Bayesian spatial inference, edge privacy processing, and budget-constrained media selection without requiring central storage of device-level location trajectories.The computing chain combines a stratified geographic quasi-experiment with structured time-series counterfactual estimation, hierarchical Bayesian spillover inference, and edge differential-privacy processing. At the 533-m reference scale and ε=1.0, the estimator records a deviation of 1.8 percentage points, a 95% interval coverage of 93.6%, and a minimum detectable increment of 4.6% at 80% power. These results are interpreted together with the added spatial-sensitivity analysis across alternative regional partitions and geographic contexts, rather than being used to claim that a single aggregation scale is sufficient for all cities. At the 533-m reference scale and , the estimator shows a 1.8-percentage-point deviation and 93.6% interval coverage. Under the reference exponential-kernel specification, positive spillover extends to approximately 1.2 km, and omission of the spatial term reduces the estimated increment by 2.1 percentage points. This difference is evaluated from the paired posterior distribution and is subjected to within-city permutation tests and sensitivity analyses over alternative kernels, distance metrics, regional partitions, and maximum neighborhood radii. Incremental posterior-based sub-model allocation has further expanded the effective coverage by 23.4 per cent and reduced media costs by 18.6 per cent, and a full technical chain has been established to link compliance measurement with allocation decisions. The computer-technology contribution lies in four connected improvements: a region-level spatiotemporal representation that replaces device-level trajectory linkage, hierarchical Bayesian computation that explicitly incorporates spatial interference, edge-side anonymous aggregation with differential-privacy perturbation, and sparse max-heap-based submodular optimization that converts posterior increments directly into budget decisions; however, the current validation is limited by the coverage of urban samples, anonymisation thresholds and spatial kernel settings. Future work could extend to cross-regional heterogeneous jurisdictions, multi-period dynamic budgeting and adaptive spatial neighbourhoods to improve generalisation ability and decision stability in complex advertising environments.
References
- Wilson, R. T. Out-of-home advertising: A bibliometric review[J]. Int. J. Advert. 2024, 43(2), 286–320. [Google Scholar] [CrossRef]
- Bale, C. D.; Fischer, J. L.; Schneider, M. J.; et al. Legally anonymizing location data under the gdpr[J]. Trans. Data Priv. 2024, 17(1), 1–30. [Google Scholar]
- Fathalizadeh, A.; Moghtadaiee, V.; Alishahi, M. Indoor geo-indistinguishability: Adopting differential privacy for indoor location data protection[J]. IEEE Trans. Emerg. Top. Comput. 2023, 12(1), 293–306. [Google Scholar] [CrossRef]
- Wikle, N. B.; Zigler, C. M. Causal health impacts of power plant emission controls under modeled and uncertain physical process interference[J]. Ann. Appl. Stat. 2024, 18(4), 2753. [Google Scholar] [CrossRef] [PubMed]
- Clark, D. A.; Handcock, M. S. Causal inference over stochastic networks[J]. J. R. Stat. Soc. Ser. A Stat. Soc. 2024, 187(3), 772–795. [Google Scholar] [CrossRef] [PubMed]
- Sieg, L.; Cheshire, J. The Regionalization and Aggregation of In-App Location Data to Maximize Information and Minimize Data Disclosure[J]. Geogr. Anal. 2025, 57(1), 27–51. [Google Scholar] [CrossRef]
- Nowbakht, P.; O’Sullivan, L.; Wall, D. P.; et al. Maintaining environmental context and geoprivacy protection in agriculture[J]. Inf. Process. Agric. 2025, 12(2), 209–220. [Google Scholar] [CrossRef]
- Cooke, T. N.; Cohen, D.; Mahmoudi, D. Navigating digital geographies: Black boxes, geospatial narratives, and the art of constructing location data[J]. Environ. Plan. F 2026, 5(1), 65–93. [Google Scholar] [CrossRef]
- Ladwig, C.; Schwieger, D. Teaching Case: No Place to Hide: Ethical and Legal Challenges in Geospatial Consumer Targeting[J]. J. Inf. Syst. Educ. 2026, 37(3), 397–412. [Google Scholar] [CrossRef]
- Karaca, U.; Aydın, N.; Yıldırım, S.; et al. Linear optimization with local differential privacy for resource sharing[J]. Ann. Oper. Res. 2026, 360(2), 1007–1041. [Google Scholar] [CrossRef]
Figure 1.
Framework for a stratified geographic quasi-experiment and the construction of structural time-series counterfactuals.
Figure 1.
Framework for a stratified geographic quasi-experiment and the construction of structural time-series counterfactuals.
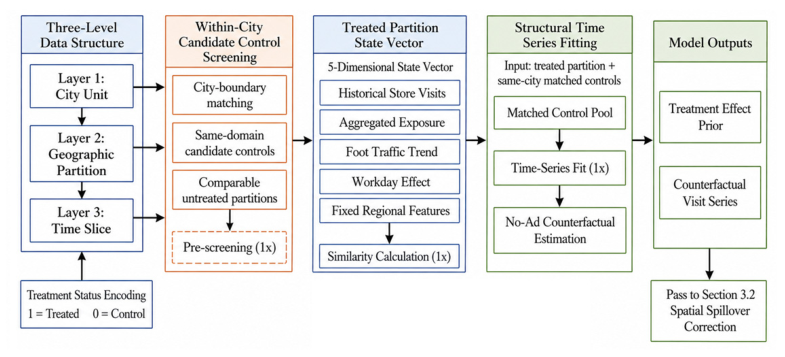
Figure 2.
Spatial Distribution Map of In-Store Increment from Digital Outdoor Media Geographic Units to Ad Slot Coverage Benefits.
Figure 2.
Spatial Distribution Map of In-Store Increment from Digital Outdoor Media Geographic Units to Ad Slot Coverage Benefits.
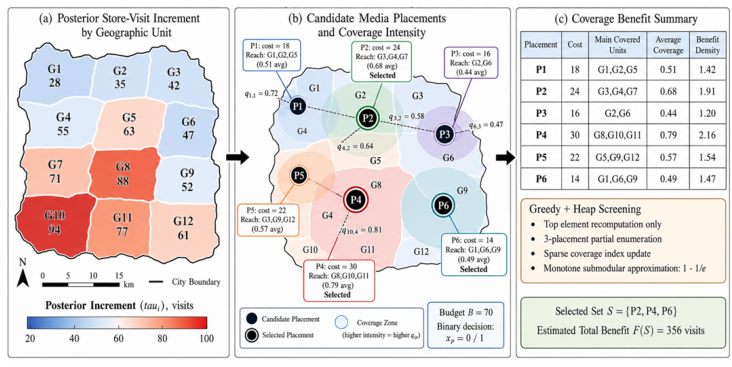
Figure 3.
Comparison of Measurement Accuracy for In-Store Incremental Changes Under Spatial Resolution Degradation and Privacy Perturbations.
Figure 3.
Comparison of Measurement Accuracy for In-Store Incremental Changes Under Spatial Resolution Degradation and Privacy Perturbations.
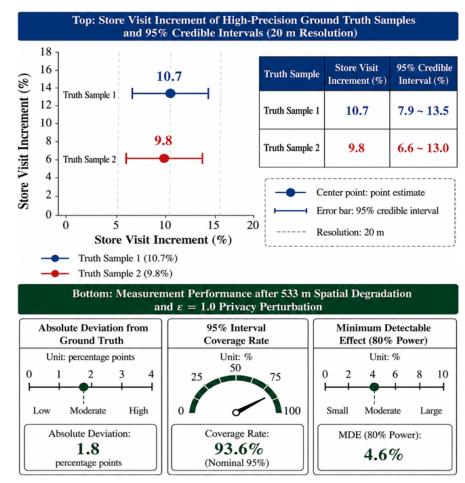
Figure 4.
Combined analysis of the effective spatial spillover range and estimation bias in store visit increments.
Figure 4.
Combined analysis of the effective spatial spillover range and estimation bias in store visit increments.
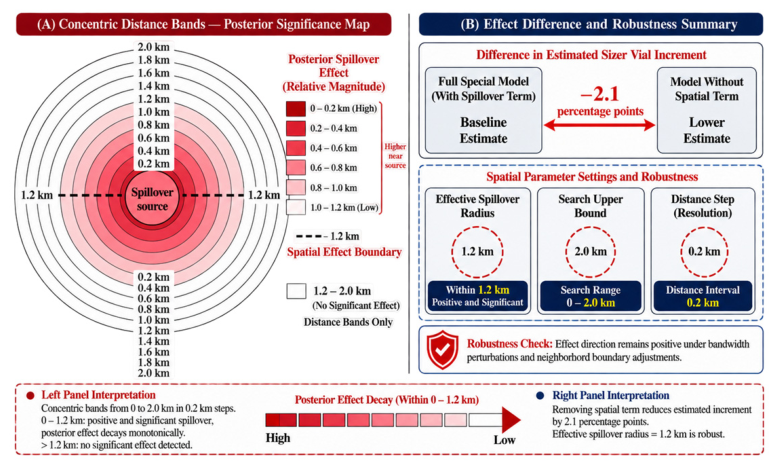

Table 1.
Incremental-Driven Media Budget Allocation Results and Algorithm Performance.
| Allocation Scenario | Constraints | Optimization Metric | Relative Change | Algorithm Properties |
| Reach Optimization | Total Budget Remains Constant | Effective Reach of Target Audience | +23.4% | Diminishing Marginal Returns in Suboptimal Models |
| Cost Optimization | Maintained in-store growth | Total Media Cost | −18.6% | Inertial Greedy Solution |
| Solving Performance | Budget Constraints | Approximation Guarantee | ≥63.2% | 1−1/e 1−1/e Theoretical Bound |
Disclaimer/Publisher’s Note: The statements, opinions and data contained in all publications are solely those of the individual author(s) and contributor(s) and not of MDPI and/or the editor(s). MDPI and/or the editor(s) disclaim responsibility for any injury to people or property resulting from any ideas, methods, instructions or products referred to in the content. |
© 2026 by the authors. Licensee MDPI, Basel, Switzerland. This article is an open access article distributed under the terms and conditions of the Creative Commons Attribution (CC BY) license (http://creativecommons.org/licenses/by/4.0/).
Copyright: This open access article is published under a Creative Commons CC BY 4.0 license, which permit the free download, distribution, and reuse, provided that the author and preprint are cited in any reuse.