

Submitted:
15 September 2026
Posted:
17 September 2026
You are already at the latest version
Abstract
The open-source evaluation of deep geothermal projects faces a structural gap between the physical analysis of subsurface reservoir conditions and the surface-level techno-economic assessment, traditionally bridged through inefficient manual coupling. To address this, an automated computational workflow controlled through a Python coupling interface was developed to integrate 3D thermo-hydraulic reservoir simulations in MRST (MATLAB Reservoir Simulation Toolbox) with the techno-economic tool GEOPHIRES-X. The architecture relies on synchronous batch-mode execution, incorporating a structural bypass of the native homogeneous subsurface models of GEOPHIRES-X. The resulting coupled workflow enables the automatic transfer of MRST reservoir simulation outputs, together with selected geometric parameters required for CAPEX calculations, to the GEOPHIRES-X techno-economic module. The workflow was tested with a case study of a deep geothermal doublet consisting of two J-type directional wells targeting a Jurassic reservoir in the Camp Basin, Catalonia (NE Spain). The coupled analysis quantified the impact of reservoir heterogeneity and three-dimensional flow and heat transport that are not captured by standalone analytical tools: explicit 3D representation of vertical anisotropy and buoyancy effects resulted in a 39.3% reduction in deliverable thermal power. Consequently, compared to the uncoupled baseline, the fully coupled model resulted in a 91.2% reduction in Net Present Value (NPV) and a 71.9% increase in the Levelized Cost of Heat (LCOH), reaching 0.1141 €/kWhₜₕ. Additionally, an automated One-Factor-at-a-Time (OFAT) sensitivity analysis demonstrated that economic performance in the study area is more sensitive to surface operational variables than to the subsurface geological parameters considered. Finally, the proposed open-source coupling framework provides an auditable and reproducible interface between existing reservoir simulation and techno-economic tools, such as MRST and GEOPHIRES-X, enabling faster and more integrated geothermal assessments than separate model execution.
Keywords:
coupling framework
; deep geothermal energy
; thermo-hydraulic simulation
; techno-economic analysis
; MRST
; GEOPHIRES-X
1. Introduction
Geothermal energy is increasingly recognized as a critical renewable resource for industrial decarbonization through baseload power generation and direct heat use. However, in low-enthalpy systems (70°C-90°C), where available exergy is constrained, commercial project feasibility strongly depends on minimizing distribution costs and accurately forecasting the long-term thermodynamic behavior of the reservoir. To be economically competitive against conventional fossil fuels, such projects require a rigorous initial techno-economic feasibility analysis.
A review of the current state of the research field reveals a structural disconnect between subsurface physics-based reservoir simulation models and techno-economical assessment tools (TEA). Standard TEA tools, such as GEOPHIRES-X, are computationally efficient but typically rely on one-dimensional or semi-analytical reservoir models (e.g., [1]) assuming homogeneous, isotropic media. However, these simplified representations present major limitations when capturing 3D reservoir spatial heterogeneity, complex fluid and heat flow behavior, permeability anisotropy, and realistic well geometries. In contrast, open-source high-fidelity numerical simulators, such as MATLAB Reservoir Simulation Toolbox (MRST) [2], can accurately model 3D geothermic grids and thermo-hydraulic behavior [3], resolving mass and energy conservation equations in heterogenic porous media. This has been demonstrated, for example, in doublet and aquifer thermal energy storage systems [3], as well as in regional-scale geothermal potential screening workflows using structured multigrid simulations [4].
Bridging the gap between sophisticated 3D reservoir simulators and TEA approaches currently presents software and licensing barriers. Full thermo-hydraulic-economic workflows often rely on commercial or closed-source platforms (such as TOUGH2/TOUGH3 or CMG coupled with external cost spreadsheets [5], limiting reproducibility and widespread academic or early-stage exploratory use. While there are advanced open-source subsurface codes (e.g., OpenGeoSys, PFLOTRAN, DuMuX), they generally lack integrated economic assessment modules. By contrast, specialized open-source TEA tools, such as GEOPHIRES-X, provide comprehensive surface facility and economic costing modules but lack native 3D distributed-parameter reservoir simulation capabilities. This makes the modular, open-source thermo-hydraulic-economic framework of MRST an ideal candidate for integration with TEA platforms.
To overcome this limitation, this study presents a new automated computational workflow controlled via Python that couples the 3D thermo-hydraulic reservoir simulations in MRST with the techno-economic assessment framework of GEOPHIRES-X. The workflow algorithmically overrides the native analytical subsurface estimations of GEOPHIRES-X by directly providing dynamically calculated thermal vectors and geometrically corrected capital expenditure (CAPEX) parameters derived from high-resolution MRST simulations.
The proposed workflow is demonstrated using a case study considering a scenario of a hypothetical J-type directional doublet deployed in the highly transmissive karstified Jurassic dolostone reservoir located in the Camp Basin (Catalunya, NE Spain). The main findings demonstrate that uncoupled analytical models may provide an overly optimistic assessment of project viability, potentially overestimating profitability and underestimating the levelized cost of heat (LCOH). By explicitly capturing 3D reservoir-scale physical and geological constraints, this coupled techno-economic framework helps correct biased financial projections and mitigate capital allocation risks in complex geothermal projects.
2. State of the Art and Theoretical Framework
2.1. Low-to-Medium Enthalpy Geothermal Systems
Low- to medium-enthalpy geothermal systems, characterized by temperatures below 150°C, are primarily used for direct industrial heat or district heating, rather than for electricity generation [6]. The inherent thermodynamic challenge of these systems is their low exergy; the extracted fluid contains substantial thermal energy but a low capacity to perform useful work. Consequently, economic viability depends on minimizing distribution distances and integrating high-temperature heat pumps (HTHPs) to amplify the heat vector to meet specific industrial process demands. Exploitation typically relies on a doublet configuration (a production well and an injection well) that maintains the system's hydrostatic pressure and ensures resource sustainability. However, this geometry introduces the risk of premature thermal breakthrough, requiring precise spatial planning based on the petrophysical heterogeneity of the target aquifer.
2.2. Evolution of Geothermal Reservoir Simulation
Numerical simulation of geothermal reservoirs requires the coupled solution of mass and energy conservation equations in porous media, incorporating the dynamic properties of fluids and geological anisotropy. Historically, the industry standard has relied on tools such as the TOUGH2 Geothermal Reservoir Simulator to handle non-isothermal multiphase flows [7]. However, in recent years, the MATLAB Reservoir Simulation Toolbox (MRST) has consolidated its position as a leading industry-standard open-source framework. Recent studies have extensively validated the MRST geothermal module; for instance, Memon and Makauskas [8] utilized the framework to precisely track thermal front dynamics over time, while Nan et al. [9] and Shi et al. [10] coupled MRST with embedded discrete fracture models (EDFM) to rigorously simulate complex hydrothermal processes and heat transfer in fractured geothermal reservoirs.
Unlike simpler analytical models, MRST employs finite-volume methods that natively support 3D petrophysical heterogeneity. This capability is not merely an optional refinement but a physical necessity. Recent literature highlights that capturing scales of heterogeneity and sedimentary architecture, as well as employing adequate grid resolution, is critical to accurately predicting fluid and heat flow [11]. Furthermore, studies such as those by Jia et al. [12] and Gao et al. [13] demonstrate how flow distribution is fundamentally dictated by pore sizes and complex fracture networks in highly heterogeneous carbonate reservoirs. Consequently, attempting to model highly transmissive, structurally anisotropic formations - such as the karstified Jurassic dolostone reservoir in the Camp Basin - using isotropic assumptions inevitably compromises the physical validity of the extracted thermal vectors.
2.3. GEOPHIRES-X and the Existing TOUGH2 Coupling: Limitations and the TOUGH3 Gap
The open-source GEOPHIRES techno-economic evaluation tool, designed for the integrated technical and economic assessment of geothermal projects, has evolved from its initial implementation (v1.0) through GEOPHIRES-2 described by [5] to the currently maintained GEOPHIRES-X platform [14]. GEOPHIRES-X combines reservoir, wellbore, and surface-plant technical models with capital (CAPEX) and operational (OPEX) cost correlations to estimate the levelized cost of energy (LCOE), net present value (NPV), and the lifetime thermal/electrical output of a geothermal project, supporting multiple end-use configurations (direct-use heat, electricity, and cogeneration).
By default, the tool employs simplified analytical models that assume homogeneous and isotropic rock masses to characterize reservoir behavior, coupled with a set of standardized economic models to perform the techno-economic calculations. For more advanced reservoir-modeling coupling possibilities, GEOPHIRES-X already permits substituting these analytical models with a numerical simulation via an existing coupling to the proprietary, license-based reservoir simulator TOUGH2. However, this integration presents notable limitations: it operates through a single-pass, unidirectional subprocess call to a locally installed executable, and relies on a comparatively rigid grid-construction routine that constrains the representation of three-dimensional geological bodies and their heterogeneities, such as fractures. Furthermore, this coupling remains tied specifically to TOUGH2's legacy output format; its successor, TOUGH3 [15] which consolidates the serial and massively parallel (TOUGH2-MP) codebases and is likewise distributed under a paid license from the Lawrence Berkeley National Laboratory (LBNL), is not natively supported, and integrating it requires manual source-code modifications to GEOPHIRES-X's reservoir-parsing routines.
2.4. The Coupling Gap in Techno-Economic Assessment
Proving the thermodynamic feasibility of a geothermal doublet is insufficient without demonstrating its financial viability through indicators such as Net Present Value (NPV), Levelized Cost of Heat (LCOH), and Internal Rate of Return (IRR). Open-source techno-economic tools, particularly GEOPHIRES-X, are widely used to estimate these indicators by calculating long-term capital expenditures (CAPEX), such as drilling costs and operational expenditure (OPEX), including pumping requirements. However, as previously noted, GEOPHIRES-X natively relies on simplified analytical subsurface models that assume homogeneous and isotropic rock masses.
A comprehensive review of the current literature reveals a persistent structural gap in the computational integration of these open-source tools. While significant advancements have been made in coupling MRST with external solvers to resolve complex multiphysics problems, this integration efforts remain overwhelmingly confined to the physical and mechanical domains. Recent developments include hydro-mechanical coupling in fractured rocks [16,17], the integration of peridynamics for hydraulic fracturing simulation [18], and advanced coupled numerical models to assess caprock geochemical integrity [19]. Even in state-of-the-art efforts that attempt to bridge subsurface physics with surface infrastructure optimization, such as the integration of physics-based reduced-order models into mixed-integer linear programming (MILP) frameworks for carbon capture supply chains [20], the focus remains on macroscopic network design.
However, the dynamic integration via a coupling interface between 3D thermo-hydraulic numerical models and open-source techno-economic evaluation tools at the operational project level remains largely unexplored. Currently, bridging these domains requires error-prone manual data transcription. This decentralized approach creates an operational bottleneck that effectively hinders large-scale, automated parametric sensitivity analyses. Furthermore, by extending idealized analytical assumptions to complex sedimentary basins, standard techno-economic tools fail to capture the true confinement of the thermal plume. This structural limitation systematically introduces significant predictive errors regarding the deliverable thermal power, highlighting the critical need for a fully automated, physically constrained techno-economic coupling strategy.
3. Materials and Methods
To bridge the gap in open-source geothermal assessment between physical reservoir characterization and techno-economic modeling tools, this work develops and implements an automated computational workflow coupling 3D reservoir simulation with techno-economic analysis. The methodology is structured around three main components: first, the characterization of the 3D thermo-hydraulic numerical model and the techno-economic engine; second, the design and implementation of the Python-based coupling architecture and the necessary mathematical data transformations; and finally, the parametric configuration of the specific case study.
3.1. 3D Thermo-Hydraulic Modeling (MRST)
In this study, fluid flow and heat transport at the 3D reservoir scale are simulated using the open-source MATLAB Reservoir Simulation Toolbox (MRST), specifically its Geothermal module [21]. MRST supports a range of 3D structural and geological grid representations, including voxel-based, Cartesian, corner-point, and unstructured polyhedral grids, for subsurface flow and transport simulations. Here, a 3D voxet geological grid model is imported into the simulation framework, and lithological information is decoded using binary bitmasks to identify and isolate the target reservoir units.
The governing equation used for energy conservation in the coupled fluid-rock system is defined as:
where is the porosity, and are the fluid and rock densities, and represent the specific heat capacities, is the effective thermal conductivity, and is the energy source term. On the other hand, mass conservation is governed by the continuity equation coupled with Darcy's law:
where is the Darcy velocity, is the permeability tensor, is the dynamic viscosity, and represents the well mass source terms.
Furthermore, the numerical resolution also discretizes the 3D grid telescopically, thereby maximizing cell resolution strictly around the wellbores while applying boundary conditions at the edges. An important physical constraint integrated into the model is the presence of halocline, whereby salinity increases markedly with depth, increasing the non-linearity of the system.
Non-linearities are resolved iteratively via the Newton-Raphson method, while the resulting linear systems are solved using the Generalized Minimal Residual method (GMRES) [22]. The complete physical simulation workflow, logically structured into inputs, processing, and outputs, is detailed in Figure 1.
3.2. Techno-Economic Engine and Algorithmic Bypass (GEOPHIRES-X)
GEOPHIRES-X [14] is structurally designed to carry out analytical subsurface evaluations that assume homogeneous and isotropic media. The core innovation of this workflow is the algorithmic bypass of these native functions to enforce the assimilation of numerical results.
Upon execution, the Python coupling interface overrides the standard evaluation and injects the serialized T(t) array directly into the GEOPHIRES-X reservoir submodule. This bypass forces downstream modules to operate strictly under the high-fidelity physical constraints derived from MRST:
- Surface Plant Decoupling: The surface plant module is dimensioned considering the integration of a high-temperature heat pump (HTHP). Crucially, it isolates the compressor's electrical consumption (
) strictly as an Operational Expenditure (OPEX). This physical decoupling prevents common accounting artifacts in analytical models, where an increase in thermodynamic efficiency (COP) counterintuitively reduces the calculated net thermal revenue.
- Financial Consolidation: The economic module integrates the CAPEX and its geometric multiplier
, and aggregates the annual OPEX over the project's lifetime. It then processes the discounted cash flows to calculate the Net Present Value (NPV) and Levelized Cost of Heat (LCOH). All raw financial outputs native to GEOPHIRES-X (calculated in USD) were converted to Euros (EUR) using the European Central Bank average monthly exchange rate for May 2026 (1.00 EUR = 1.16 USD) [23] to reflect the European context of the case study. Figure 2 illustrates the sequential execution of these modified submodules, demonstrating how external data dictates the economic evaluation.
3.3. System Architecture and Interoperability Strategy
The methodology of this study is based on a loose-coupling strategy implemented through a Python controller. This architecture is designed to isolate physical numerical modeling from financial evaluation, ensuring that each simulation iteration remains independent, auditable, and reproducible, without permanently modifying the core source code of either evaluation engine.
The integration of MATLAB (for physical simulation) and Python (for orchestration and financial evaluation) presents a structural interoperability challenge. To address this, the workflow operates through a highly structured sequence of synchronous system calls and on-disk data serialization (Figure 3):
- Parametric Serialization: The Python coupling interface initiates the sequence by dynamically generating an 𝚖𝚛𝚜𝚝_𝚙𝚊𝚛𝚊𝚖𝚜. 𝚓𝚜𝚘𝚗 file. This file contains the geometric, operational, and petrophysical variables specific to the current iteration, as well as those intended for analysis, allowing the workflow to modify the physical model externally.
- Execution and Concurrency Management: Python launches the MATLAB environment in batch mode via a 𝚜𝚞𝚋𝚙𝚛𝚘𝚌𝚎𝚜𝚜 routine. Running in batch mode is critical, as it disables graphical rendering, reventing memory saturation during large-scale sensitivity analyses. To protect the workflow from divergent numerical iterations, the controller enforces a strict 900-second timeout protocol.
- Internal Interception: A dedicated MATLAB wrapper script (𝚠𝚛𝚊𝚙𝚙𝚎𝚛_𝚖𝚛𝚜𝚝. 𝚖 ) intercepts the JSON data upon initialization. This wrapper structures the execution within a 𝑡𝑟𝑦/𝑐𝑎𝑡𝑐ℎ block, ensuring that if a specific parametric combination fails to converge, the simulation is safely aborted, the error is logged, and the coupling interface seamlessly proceeds to the next iteration.
3.4. Interface Data Translation and Geometric Corrections
A direct transfer of raw output data from the physical simulator to the financial engine is unfeasible due to inherent differences stemming from both their native computational languages and the way they discretize time and space. Consequently, MRST is programmed to perform three critical intermediate mathematical transformations before exporting the data:
First, to address the temporal mismatch between MRST's adaptive time-stepping and the fixed-period cash flow requirements of GEOPHIRES-X, the physical simulator extracts and interpolates the continuous production temperature curve into a regularized vector of 121 equidistant temporal points over the 30-year horizon.
Second, GEOPHIRES-X requires constant hydraulic resistances to estimate long-term pumping power. To reconcile this with the dynamic nature of the model, MRST analyzes the bottom-hole pressure (BHP) curves and, based on this, calculates stabilized and time-averaged Productivity (PI) and Injectivity (II) indices.
Third, analytical economic tools underestimate drilling-related Capital Expenditures (CAPEX) for directional wells by relying on True Vertical Depth (TVD) correlations. To correct this, MRST extracts the actual Measured Depth (MD) of the simulated wellbores from its 3D geometric grid, subsequently applying a polynomial cost correlation to both the TVD and the MD. The ratio between these costs generates a Well Drilling Adjustment Factor , defined formally as:
where the polynomial coefficients for large-diameter deviated wells are established as , , and . These values correspond to the baseline empirical cost correlations natively implemented in the Economics.py module of the GEOPHIRES-X source code [14].
3.5. The geological setting of the Camp Basin
The workflow was applied to the Camp Basin case study (Catalonia, NE Spain) (Figure 4), a Neogene basin located within the Catalan Coastal Ranges. The basin comprises Paleogene and Neogene sediments, deep Mesozoic aquifers, and a fractured Paleozoic basement composed mainly of granitoids. The specific geothermal target area is in the Mas del Batlle industrial zone, west of the urban center of the city of Reus (Figure 5, pink circle inside red rectangle).
A regional-scale 3D geological and thermal model with relatively coarse spatial resolution of the basin is available through the ICGC Geoíndex 3D Geological Resources Viewer [24]. The geological model was built in 3DGeomodeller® from the available geological information and refined through geophysical inversion of gravity and magnetic data. This geological framework was subsequently used to develop a preliminary 3D conductive thermal model of the whole Camp basin [24].
The regional-scale 3D model shows a progressive deepening of the Mesozoic succession toward the northwest and the Camp Fault. Beneath the selected target area, the Jurassic carbonate aquifer is interpreted to occur at depths of approximately 1,850–2,450 m. These values should be regarded as approximate because no deep boreholes are available in this part of the basin and the relatively coarse spatial resolution of the regional model introduces additional uncertainty at the local scale. The regional thermal model indicates a geothermal gradient of 30.31 °C/km, consistent with the available temperature measurements from the Reus-1, Reus-2, and Reus-3 wells. Assuming a mean surface temperature of 15 °C, the uppermost ~150 m of the reservoir, considered the main transmissive interval and located approximately between 1,850 and 2,000 m depth, would correspond to temperatures of approximately 71–76 °C. Temperatures increase with depth within the Jurassic succession, with the regional 3D thermal model predicting maximum reservoir temperatures of up to ~85 °C in the deepest sections of the aquifer.
The closest direct subsurface information comes from the Reus-1, Reus-2, and Reus-3 wells, located approximately 4–4.5 km southeast of the target area. These are the only historical deep wells in the basin that reach the Mesozoic aquifers and intersect the Jurassic succession. Reus-1 drilled by APEX–CAMPSA–SHELL in 1976, reached a total depth of 2,228 m [25] while Reus-2 and Reus-3 reached 1,700 m [26] and 1,690 m [27], respectively.
The Jurassic formation is approximately 240–260 m thick in Reus-1 and Reus-2, reaching approximately 261 m in Reus-1 and 241 m in Reus-2, where it extends from approximately 1,388 to 1,629 m. In contrast, Reus-3 encountered only about 38 m of Jurassic rocks, as the well is located near the fault-bounded margin of a structural paleohigh previously investigated during the years 1996-2001 for geological gas storage [28]. Toward the northwest, however, the regional 3D model indicates renewed deepening and thickening of the Jurassic succession beneath the target area [24]. The upper part of the Jurassic succession consists mainly of fractured, karstified, and locally brecciated dolomitic carbonates and represents the main aquifer interval. Based on the available geological and hydraulic evidence, the uppermost ~150 m were interpreted as the principal transmissive interval [25].
Production tests conducted in Reus-2 show substantial vertical variations in the hydraulic properties of the Jurassic reservoir. A test covering the main dolomitic interval (1,389–1,589 m) yielded an estimated permeability of 2,930 mD, whereas the uppermost tested interval (1,389–1,430 m) yielded an estimated permeability of 13,200 mD [26]. These results support the interpretation of the upper karstified dolostone as the most transmissive part of the Jurassic aquifer. To constrain vertical flow within the reservoir, strong permeability anisotropy, expressed by the horizontal-to-vertical permeability ratio (kh/kv = 100), characterizes the formation and was thus imposed in the numerical model, which is consistent with values reported for petrophysically analogous carbonate geothermal systems [19].
The available hydrochemical data show some variability in formation-water mineralization. Analyses from the Reus-1 well report two groups of salinity values, approximately 22–25 g/L and 31–32 g/L [25]. The original Reus-1 report describes the Jurassic formation waters as compositionally similar to those found in oil fields of the Gulf of Valencia and reports a total salinity of around 31 g/L, comparable to formation waters from the offshore Amposta-1 oil field. According to the Sulin classification, these Ca–Cl waters are classified as fossil, stagnant formation waters [28].
More recent formation-water analyses are available from the Reus-2 production tests [26]. The sum of the major dissolved constituents gives a TDS concentration of approximately 22.7 g/L for the upper test interval (1,389–1,430 m; electrical conductivity of 32,700 µS/cm) and 23.3 g/L for the broader tested interval (1,389–1,654 m; electrical conductivity of 33,400 µS/cm). Both samples therefore indicate a consistent formation-water mineralization of approximately 23 g/L. Consequently, a representative reservoir salinity of 23 g/kg best reflects the fluid conditions of the targeted modeled area, and was adopted. This value was selected primarily from the Reus-2 data because these analyses are more recent, derive from documented production-test samples, and were obtained closer to the modeled target area.
3.6. Configuration for Reservoir and Techno-Economic Modeling and Parametric Sensitivity Analysis
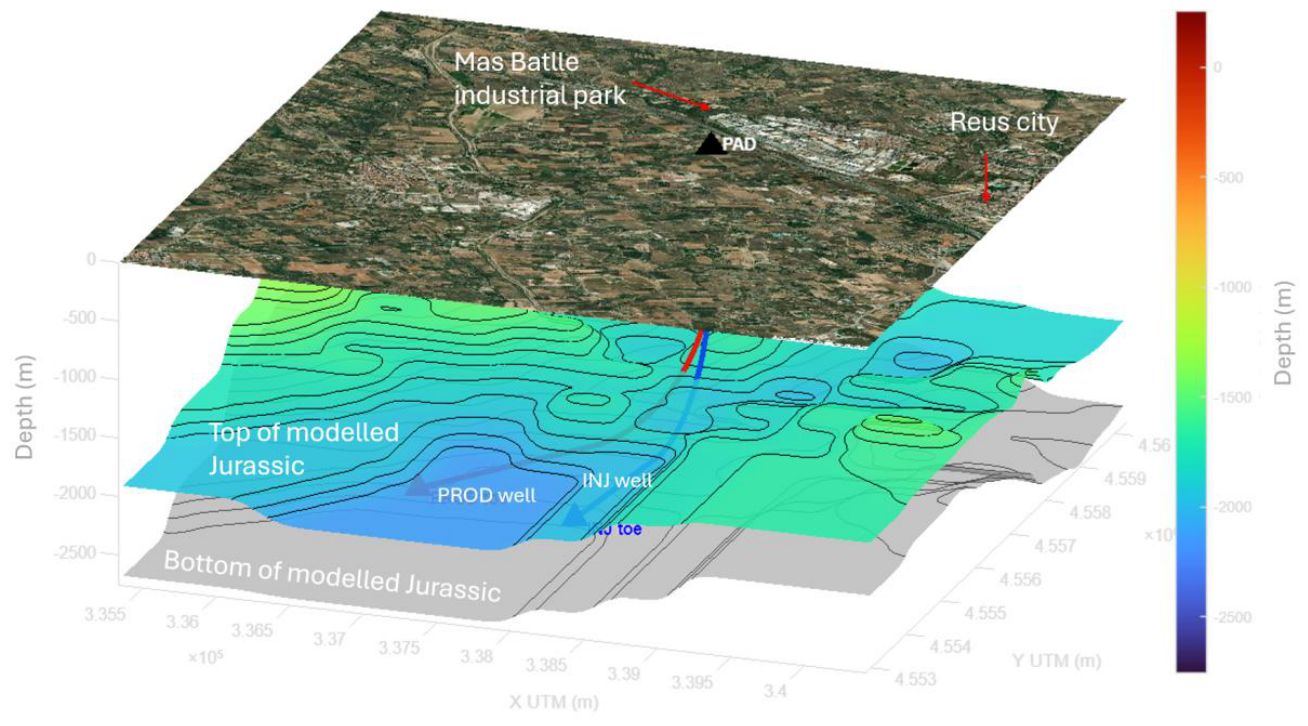
The modeled area considered in the case study is shown by the red rectangle in Figure 5. The geothermal target is located in the subsurface immediately southwest of the Mas del Batlle industrial zone, west of the urban center of the city of Reus. The hypothetical production (red) and injection (blue) wells are designed to be directionally drilled from the industrial zone toward the southwest (SW) to reach the target reservoir.
Given the absence of deep boreholes directly within the target area and the associated spatial uncertainty, the geological, hydraulic, thermal, and hydrochemical properties derived from the Reus wells situated to the south were used as representative reservoir parameters in MRST for this case study. Constant-pressure boundary conditions were imposed along the model boundaries in the MRST simulations.
Due to urban constraints, a hypothetical energy consumption point is established at the Mas Batlle industrial park, designing a J-type directional doublet to extract a base constant flow of with a single drilling pad close to the consumption area. The Kick-Off Point (KOP) was set at a depth of 1,000 m. To prevent premature thermal short-circuiting, a minimum subsurface separation of at least 1,000 m between targets was enforced. This geometric requirement yields an extreme Measured Depth (MD) of approximately 4,800 m compared to a True Vertical Depth (TVD) of 2,257 m (resulting in an MD/TVD ratio of 2.13). The production well considers ), and the injection well .
Figure 6.
3D view of the hypothetical geothermal doublet location considered in the MRST model, showing the deviated production and injection wells, together with the top and bottom surfaces of the Jurassic formation. The target reservoir considered in this case study corresponds to the uppermost 150 m of the Jurassic formation. The Jurassic top/bottom surfaces were extracted from the available regional-scale 3D geological–geothermal model [24].
Figure 6.
3D view of the hypothetical geothermal doublet location considered in the MRST model, showing the deviated production and injection wells, together with the top and bottom surfaces of the Jurassic formation. The target reservoir considered in this case study corresponds to the uppermost 150 m of the Jurassic formation. The Jurassic top/bottom surfaces were extracted from the available regional-scale 3D geological–geothermal model [24].
Regarding the techno-economic analysis, the workflow natively estimates a baseline drilling capital cost based on the True Vertical Depth (. To correctly account for the J-type well geometry, the actual monetary costs of the deviated trajectories are evaluated using their Measured Depths ( and ) in the polynomial cost correlation (Equation 4). The ratio of this combined deviated drilling cost to the vertical baseline cost yields a dimensionless adjustment multiplier of , which is then written directly into the GEOPHIRES-X input file.
The economic baseline considers a discount rate of 7%. This value was derived using the Weighted Average Cost of Capital (WACC) methodology, consistently aligned with the statutory rates of return established by the Spanish regulatory framework for renewable energies [29], supplemented by a 1% First-Of-A-Kind (FOAK) risk premium.
The plant utilization factor is set at 0.85 (approximately 7,500 hours/year), with a reinjection temperature of . In this hypothetical scenario, a high-temperature, large-scale heat pump (HTHP) is integrated into the geothermal system to upgrade the available low-to-medium temperature geothermal fluid (70–90 °C) in the natural Jurassic reservoir to supply temperatures above 100 °C [30], thereby extending its potential use to high-temperature district heating and industrial processes. A very conservative seasonal Coefficient of performance (COP) of 2.5 was pre-fixed.
The OPEX includes a 2.5 times adjustment factor for wellfield maintenance to mitigate scaling risks associated with the high-salinity halocline.
Finally, a comprehensive risk assessment was automated using a One-Factor-at-a-Time (OFAT) sensitivity analysis over 11 parameters, applying uniform symmetrical variations. To optimize computational efficiency, the Python coupling interface implements an execution separation strategy: Level 1 for economic variables (freezing the physical simulation and rapidly iterating only GEOPHIRES-X), and Level 2 for geological variables (triggering the complete coupled sequence).
The simulation is discretized over a 30-year operational horizon divided into 128 adaptive time steps.
4. Results
4.1. Workflow Validation: Quantification of Analytical Bias
The primary validation of the developed workflow is based on quantifying the predictive divergence between a standalone analytical evaluation (using the internal models of GEOPHIRES-X for both physical and economic modeling) and the fully coupled numerical approach (MRST + GEOPHIRES-X). Both simulations were subjected to identical geometric, operational, and financial baseline parameters for the Camp Basin case study.

Table 1.
Comparison of techno-economic indicators between the standalone analytical model and the coupled numerical workflow for the base case scenario.
Table 1.
Comparison of techno-economic indicators between the standalone analytical model and the coupled numerical workflow for the base case scenario.
| Indicator | Standalone Analytical | Coupled Workflow | Absolute ∆ | Relative ∆ |
|---|---|---|---|---|
| Net Present Value [MEUR] | 36.19 | 3.18 | -33.01 | -91.2% |
| Internal Rate of Return [%] | 15.88 | 9.01 | -6.87 pp | - |
| LCOH [€/kWhₜₕ] | 0.0664 | 0.1141 | +0.0477 | +71.9% |
| Payback Period [Years] | 8.08 | 11.95 | +3.87 | +47.9% |
| Net Mean Thermal Power [MWt] | 12.77 | 7.75 | -5.02 | -39.3% |
| Total CAPEX [MEUR] | 31.22 | 28.67 | -2.55 | -8.2% |
The magnitude of the deviation confirms that relying exclusively on standalone analytical tools introduces a critical financial bias. Compared to the analytical baseline, the fully coupled simulation reveals a 91.2% reduction in NPV (dropping from 36.19 to 3.18 MEUR) and a 71.9% increase in LCOH. The root cause of this divergence is the estimation of deliverable thermal power, where the standalone tool assumes a perfectly homogeneous and isotropic medium, calculating an idealized value of 12.77 MWt. In contrast, the coupled MRST simulation captures the actual non-homogeneous flow paths, vertical anisotropy, and salinity-induced buoyancy effects. These physical constraints restrict the actual extracted thermal power to 7.75 MWt (a 39.3% reduction). This massive reduction in thermal yield cascades through the economic module, drastically decreasing annual revenues and downgrading the project from highly profitable to only marginally viable.
4.2. Thermo-Hydraulic Dynamics of the Coupled Model
The physical scope of the workflow was validated over a 30-year operational horizon. Despite the continuous extraction of 50 L/s, the J-type directional doublet demonstrates high thermal stability. The bottom-hole production temperature experiences a drop of (from to ) over the project's lifetime.
Regarding pressures, the highly transmissive carbonate formation establishes steady-state bottom-hole pressures of 225.5 bar at the producer and 229.1 bar at the injector, indicating excellent long-term injectivity facilitated by the high permeability of the target zone (2,930 mD), which results in minimal parasitic pumping losses.
Assuming a natural reservoir temperature of 75 °C as a basis for energy calculations, and adopting an adjusted coefficient of performance (COP) of 2.5 together with a Carnot efficiency factor of 42%, as reported in previous studies [31], the resulting production temperature on the consumer side could reach approximately 145 °C. Large-scale and high-temperature heat pumps (HTHPs), as analyzed by [30], range widely in maturity depending on output temperature and design. Standard industrial heat pumps delivering up to 100 °C–160 °C reach TRL 8 to 9 (market-available and proven in operation). The estimated production temperature of approximately 145 °C therefore falls comfortably within the range of high-temperature heat pumps that are already commercially mature.
The resulting spatial distribution of the thermal plume (Figure 7) confirms that the optimal 1,200 m separation reached by the simulation effectively prevents the generation of a thermal short-circuit. Finally, the plume remains confined within the upper 150 m of the Jurassic top, driven by permeability stratification and structural anisotropy.
. The visualization validates the geometric design, confirming the confinement of the plume and the efficacy of the 1,200 m well separation in preventing thermal breakthrough.
4.3. Automated Parametric Sensitivity and Risk Hierarchy
Through the Python coupling interface, a One-Factor-at-a-Time (OFAT) sensitivity analysis loop was executed to generate risk profiles for the NPV and LCOH. The variables were subjected to uniform variations relative to the base case to ensure symmetric comparability (Figure 8).
To provide absolute quantitative context to the risk hierarchy, Table 2 details the operational bounds of the most influential parameters under the variation scenario.
The automated sensitivity analysis revealed a counterintuitive risk hierarchy for the targeted highly transmissive karstified Jurassic dolostone reservoir in the Camp Basin. Reservoir parameters, such as permeability, and spatial heterogeneity, showed a relatively limited influence on the project profitability, resulting in maximum NPV variations of less than . Consequently, while the inherent geological uncertainty of the subsurface remains high, the overall techno-economic performance of the project is relatively insensitive to variations in these properties within the explored parameter ranges.
Instead, the results indicate that financial risk is primarily controlled by surface thermodynamics, plant operations, and macroeconomic parameters. Reinjection temperature emerged as the technical variable with the greatest impact: reducing it from to maximizes heat extraction and raises the NPV to MEUR, whereas increasing it to limits thermal recovery, and results in a negative NPV of MEUR. Consequently, the coupled workflow suggests that for the highly transmissive reservoir conditions considered in this study, project optimization should primarily focus on maximizing useful heat extraction while carefully managing the potential geochemical risks associated with lower reinjection temperatures, particularly mineral precipitation and scaling resulting from temperature-induced changes in fluid–rock equilibrium. While reducing geological uncertainty through exploration remains fundamental for technical de-risking, these results highlight that optimizing surface thermodynamics and operational parameters is also critical for maximizing the financial viability of the project.
5. Discussion
The results of this study support the initial working hypothesis that techno-economic assessments based on simplified, uncoupled analytical reservoir models may introduce significant biases when applied to geologically complex geothermal systems. In the Camp Basin case study, the 3D MRST simulations captured reservoir-scale constraints associated with strong vertical anisotropy (kh/kv = 100) and the specific geometry of the J-type doublet, resulting in a 39.3% reduction in deliverable thermal power compared with the analytical representation. When these physically constrained thermal outputs were incorporated into GEOPHIRES-X, the estimated project profitability decreased accordingly.
In its standalone configuration, GEOPHIRES-X relies on simplified analytical reservoir representations based on idealized and homogeneous conditions. More detailed reservoir behavior can be incorporated through coupling with numerical reservoir simulators such as the license-based TOUGH2, as demonstrated in previous studies. While simplified analytical approaches remain appropriate for preliminary assessments, the results of this case study indicate that their application to geologically and structurally complex 3D reservoir settings may lead to overly optimistic estimates of project profitability and, consequently, financial viability. The loose-coupling strategy developed here provides a fully open-source alternative by linking MRST and GEOPHIRES-X through a Python-based interface, enabling the automated transfer of reservoir simulation outputs to the techno-economic model and facilitating systematic sensitivity analyses without manual data transcription.
The OFAT sensitivity analysis identified reinjection temperature as the operational parameter exerting the strongest influence on project economics within the investigated ranges. Reducing the reinjection temperature from 50 °C to 40 °C increases useful heat extraction and improves NPV. However, this apparent economic benefit must be considered alongside potential operational and geochemical constraints. In highly saline geothermal fluids (>22 g/kg TDS), lower reinjection temperatures may alter fluid–mineral equilibria and potentially promote CaCO₃ precipitation and scaling, with associated implications for chemical treatment, wellfield maintenance, and OPEX. Since these geochemical processes were not explicitly modeled in the present workflow, the economically optimal reinjection temperature should not necessarily be interpreted as the technically optimal operating condition.
The thermal stability observed over the 30-year simulation horizon (ΔT = 0.35 °C) should also be interpreted in the context of the adopted numerical setup. Constant-pressure boundary conditions and the lateral truncation of the regional Camp Basin geological grid, implemented to reduce computational load and memory requirements, may contribute to the relatively limited thermal decline observed during the simulation period. Although this configuration is adequate for demonstrating the coupled workflow, future site-specific assessments should investigate long-term thermal drawdown using alternative boundary conditions, including closed or semi-closed configurations, and larger-scale basin geometries.
The sensitivity analysis itself also presents methodological limitations. The One-Factor-at-a-Time (OFAT) approach is computationally efficient and useful for identifying first-order sensitivities, but it does not capture nonlinear interactions or correlations among parameters. A logical extension of the workflow would therefore be the implementation of stochastic approaches, such as Monte Carlo simulations, in which probability distributions are assigned to uncertain input parameters to derive probabilistic estimates of NPV and LCOH (e.g., P10, P50, and P90). Furthermore, the relatively limited influence of geological parameters on NPV observed in this study should not be interpreted as reduced geological uncertainty. Rather, it reflects the exceptionally high transmissivity of the targeted karstified Jurassic dolostone reservoir within the parameter ranges investigated. Application of the workflow to tighter, matrix-dominated sedimentary reservoirs could reveal substantially different geological, operational, and economic sensitivity hierarchies.
From a broader energy-transition perspective, the proposed architecture provides an auditable, reproducible, automated, and fully open-source framework for integrating 3D reservoir physics into geothermal techno-economic assessment. Its Python-based coupling interface enables systematic screening and comparison of multiple development scenarios while retaining the physical constraints represented by numerical reservoir simulations and avoiding dependence on proprietary reservoir simulation software. This capability may be particularly valuable for early-stage assessment and investment decision-making for geothermal resources targeting district heating and industrial heat decarbonization.
6. Conclusions
This study developed and demonstrated an automated, fully open-source computational workflow that couples the 3D thermo-hydraulic reservoir simulation capabilities of MRST with the techno-economic evaluation framework of GEOPHIRES-X. The workflow enables physically constrained simulated reservoir outputs to be directly incorporated into techno-economic assessments, bypassing the simplified analytical reservoir representation used in the standalone configuration.
The application of the workflow to a hypothetical J-type geothermal doublet targeting the karstified Jurassic dolostone reservoir in the Camp Basin led to three main conclusions:
- Impact of reservoir representation on project economics: The standalone analytical approach overestimated the NPV by and underestimated the LCOH by compared with the fully coupled MRST-GEOPHIRES-X simulation, demonstrating that reservoir representation can materially affect estimates of the project viability.
- Importance of 3D physical constraints: The 3D reservoir simulation captured the effects of the J-type well geometry and strong vertical anisotropy on thermal plume development, resulting in a reduction in deliverable thermal power, relative to isotropic analytical assumptions.
- Shift in techno-economic sensitivity: Under the highly transmissive reservoir conditions investigated, uncertainties in subsurface geological parameters such as permeability had a relatively limited influence on project economics within the ranges investigated. Instead, the sensitivity analysis identified operational parameters, particularly reinjection temperature, as dominant controls on economic performance.
Overall, the proposed MRST-GEOPHIRES-X workflow provides a reproducible and fully open-source framework for evaluating how 3D subsurface physical constraints propagate into geothermal project economics and for systematically exploring alternative development scenarios. The results highlight the value of incorporating detailed reservoir physics into techno-economic assessments, particularly when evaluating geologically complex geothermal systems at the local or prospect scale.
Author Contributions
Conceptualization, D.V.L and I.H.; methodology, D.V.L and I.H.; software, D.V.L; validation, I.H. and E.G.R.; formal analysis, D.V.L; investigation, D.V.L; resources, I.H.; data curation, D.V.L; writing—original draft preparation, D.V.L; writing—review and editing, I.H. and E.G.R.; visualization, D.V.L; supervision, I.H. and E.G.R.; project administration, I.H.; funding acquisition, I.H. All authors have read and agreed to the published version of the manuscript.
Funding
This research was funded by the Institut Cartogràfic i Geològic de Catalunya (ICGC) through a student grant awarded to the first author, D.V., within the Master’s Degree in Renewable Energy and Energy Sustainability, Faculty of Physics, University of Barcelona (UB), 08028 Barcelona, Spain.
Data Availability Statement
The original contributions presented in this study are included in the article. Further inquiries can be directed to the corresponding authors.
Acknowledgments
During the preparation of this manuscript, the author(s) used Gemini (versions 3.1 Pro and 3.6 Flash) and Claude (Sonnet 5) for the purposes of text translation, paragraph restructuring, and improving overall section organization and readability. The authors have reviewed and edited the output and take full responsibility for the content of this publication.
Conflicts of Interest
The authors declare no conflict of interest.
Abbreviations
The following abbreviations are used in this manuscript:
| BHP | Bottom-Hole Pressure |
| CAPEX | Capital Expenditure |
| COP | Coefficient of Performance |
| ICGC | Institut Cartogràfic i Geològic de Catalunya |
| LCOH | Levelized Cost of Heat |
| HTHP | High-Temperature Heat Pump |
| MD | Measured Depth |
| MRST | MATLAB Reservoir Simulation Toolbox |
| NPV | Net Present Value |
| OFAT | One-Factor-at-a-Time |
| OPEX | Operational Expenditure |
| TVD | True Vertical Depth |
| WACC | Weighted Average Cost of Capital |
References
- Lowell, R.; Gringarten, A. Comments on “Theory of Heat Extraction from Fractured Hot Dry Rock” by A. C. Gringarten et Al. J. Geophys. Res. 1976, 81, 359–360. [Google Scholar] [CrossRef]
- Lie, K.-A. An Introduction to Reservoir Simulation Using MATLAB/GNU Octave: User Guide for the MATLAB Reservoir Simulation Toolbox (MRST); Cambridge University Press, 2019. [Google Scholar]
- Collignon, M.; Klemetsdal, Ø.S.; Møyner, O.; Alcanié, M.; Rinaldi, A.P.; Nilsen, H.; Lupi, M. Evaluating Thermal Losses and Storage Capacity in High-Temperature Aquifer Thermal Energy Storage (HT-ATES) Systems with Well Operating Limits: Insights from a Study-Case in the Greater Geneva Basin, Switzerland. Geothermics 2020, 85, 101773. [Google Scholar] [CrossRef]
- Khedekar, V.V.; Memon, A.R.A.N.; Pal, M. Efficient Geothermal Reservoir Simulation Using Deep Learning Surrogates and Multiscale Interpolation Techniques. Processes 2026, 14, 1248. [Google Scholar] [CrossRef]
- Beckers, K.F.; McCabe, K. GEOPHIRES v2.0: Updated Geothermal Techno-Economic Simulation Tool. Geotherm. Energy 2019, 7, 5. [Google Scholar] [CrossRef]
- European Geothermal Energy Council (EGEC). EGEC Geothermal Market Report 2024: Key Findings; EGEC, 2024. [Google Scholar]
- Pruess, K.; Oldenburg, C.; Moridis, G. TOUGH2 User’s Guide, Version 2.0; Lawrence Berkeley National Laboratory, 1999. [Google Scholar]
- Memon, A.R.; Makauskas, P. Modeling Thermal Front Dynamics in Geothermal Reservoirs Using an Open-Source MRST-MATLAB Simulation Framework. Adv. Carbon Capture Util. Storage 2026, 3, 1–5. [Google Scholar] [CrossRef]
- Nan, T.; Hu, T.; Wang, Z.; Zhang, J.; Yin, J.; Xie, Y.; Wu, J.; Lu, C. Modeling Hydro-Thermal Processes in Fractured Geothermal Reservoirs Using Embedded Discrete Fracture Model (EDFM) and MRST. Adv. Water Resour. 2025, 206, 105120. [Google Scholar] [CrossRef]
- Shi, D.; Cheng, S.; Wang, Q.; Liu, D.; Yin, F.; Xu, X.; Guo, X.; Weng, Z. Comparative Analysis and Application of Mass and Heat Transfer Simulation in Fractured Reservoirs Based on Two Fracture Models. Processes 2024, 12, 2399. [Google Scholar] [CrossRef]
- Aghaei, H.; Colombera, L.; Yan, N.; Mountney, N.P.; Andersen, O.; Di Giulio, A. Capturing Scales of Heterogeneity in Models of Fluvial Geothermal Reservoirs: Grid Resolution, Upscaling Strategies, and Hierarchies of Sedimentary Architecture. Adv. Water Resour. 2026, 209, 105217. [Google Scholar] [CrossRef]
- Jia, P.; Guo, H.; Gao, H. Studying the Impact of Pore Sizes on Gas Flow and Distribution in Volatile Carbonate Reservoirs Using a New Triple-Porosity Model. Phys. Fluids 2024, 36, 103103. [Google Scholar] [CrossRef]
- Gao, M.; Sun, W.; Xu, J.; Li, J. Reduced-Order Modeling for Subsurface Flow Simulation in Fractured Reservoirs. SPE J. 2025, 30, 391–408. [Google Scholar] [CrossRef]
- National Laboratory of the Rockies. GEOPHIRES-X: Open-Source Geothermal Techno-Economic Simulator. 2026. Available online: https://github.com/NREL/GEOPHIRES-X (accessed on 18 August 2026).
- Jung, Y.; Pau, G.S.H.; Finsterle, S.; Doughty, C. TOUGH3 User’s Guide, Version 1.0; Lawrence Berkeley National Laboratory: Berkeley, CA, USA, 2018. [Google Scholar]
- Liu, X.; Geng, S.; Sun, J.; Li, Y.; Guo, Q.; Zhan, Q. Novel Coupled Hydromechanical Model Considering Multiple Flow Mechanisms for Simulating Underground Hydrogen Storage in Depleted Low-Permeability Gas Reservoir. Int. J. Hydrogen Energy 2024, 85, 526–538. [Google Scholar] [CrossRef]
- Cardona, A.; Finkbeiner, T.; Santamarina, J.C. Hydro-Mechanical Coupling in Fractured Rocks: A Numerical Study Using the Implicit Joint-Continuum Model. Int. J. Rock Mech. Min. Sci. 2026, 200, 106460. [Google Scholar] [CrossRef]
- Liao, X.; Zhou, J.; Wang, P.; Liu, F.; Shang, X. Coupling of Peridynamics and MRST for Simulation of Hydraulic Fracturing in Porous Media. Comput. Geotech. 2026, 191, 107760. [Google Scholar] [CrossRef]
- Antwi, K.; Amber, I.; Oluyemi, G. A Coupled Numerical Model to Assess the Caprock Geochemical Integrity and Porosity Change of an Underground Hydrogen Gas Storage System. Int. J. Hydrogen Energy 2025, 109, 624–635. [Google Scholar] [CrossRef]
- Bertoni, L.; Møyner, O.; Wiegner, J.; Gazzani, M. Optimizing Carbon Capture and Storage Infrastructure Including Physics-Based Reservoir Modelling. Comput. Chem. Eng. 2025, 202, 109293. [Google Scholar] [CrossRef]
- Collignon, M.; Klemetsdal, Ø.S.; Møyner, O. Simulation of Geothermal Systems Using MRST. In Advanced Modelling with the MATLAB Reservoir Simulation Toolbox; Lie, K.-A., Møyner, O., Eds.; Cambridge University Press, 2021; pp. 491–514. [Google Scholar]
- Saad, Y.; Schultz, M.H. GMRES: A Generalized Minimal Residual Algorithm for Solving Nonsymmetric Linear Systems. SIAM J. Sci. Stat. Comput. 1986, 7, 856–869. [Google Scholar] [CrossRef]
- European Central Bank (ECB) Euro Foreign Exchange Reference Rates: US Dollar (USD). Monthly Average. 2026.
- Institut Cartogràfic i Geològic de Catalunya (ICGC). Deep Geothermal Resource Assessment in the Mesozoic Reservoirs of the Camp Basin; ICGC: Barcelona, Spain, 2023; Available online: https://datacloud.icgc.cat/datacloud/descarregues-web/bd/pubs/icgc_TR_0001_23_en.pdf (accessed on 19 August 2026).
- Echánove, I.; Núñez, A.; Piérard, H. Informe Geológico Final Del Sondeo Reus-1; American Petrofina Exploration Company: Sucursal Española: Spain, 1976. [Google Scholar]
- Enagás Informe Geológico Del Sondeo Reus-2; Enagás: Spain, 1999.
- Enagás Informe Geológico Del Sondeo Reus-3; Enagás: Spain, 2001.
- Enagás-Aurensa. Proyecto de Almacenamientos Subterráneos de Gas: Reus; Enagás: Spain, 1996. [Google Scholar]
- Gobierno de España Real Decreto-Ley 17/2019, de 22 de Noviembre, Por El Que Se Adoptan Medidas Urgentes Para La Adaptación de Parámetros Retributivos Que Afectan al Sistema Eléctrico. Boletín Of. Del Estado 2019, 128615–128646.
- Elwardany, M.; Turja, A.I.; Hasan, M.M.; Nassif, N. High-Temperature Heat Pumps for Industrial Decarbonization: Technologies, Integration Strategies, and Future Perspectives. Chem. Eng. Process.-Process Intensif. 2026, 225, 110806. [Google Scholar] [CrossRef]
- Gustafson, J.O.; Smith, J.D.; Beyers, S.M.; Al Aswad, J.A.; Jordan, T.E.; Tester, J.W. Earth Source Heat: Feasibility of Deep Direct-Use of Geothermal Energy on the Cornell Campus. GRC Trans. 2018, 42, 1379–1394. [Google Scholar]
Figure 1.
Flowchart of the physical subsurface simulation performed by MRST, detailing the ingestion of 3D geological models, the numerical resolution of coupled mass and energy equations, and the serialized outputs.
Figure 1.
Flowchart of the physical subsurface simulation performed by MRST, detailing the ingestion of 3D geological models, the numerical resolution of coupled mass and energy equations, and the serialized outputs.
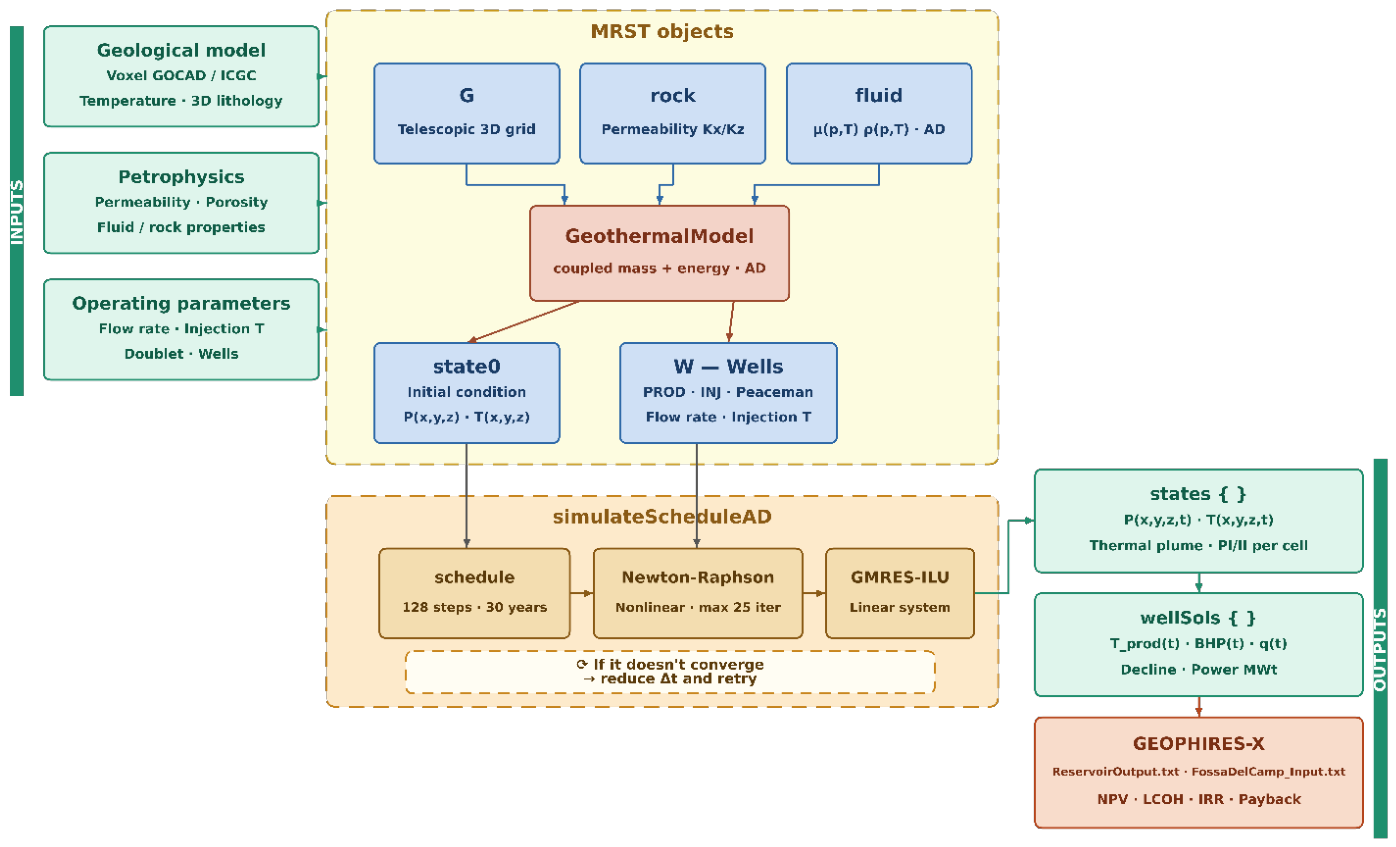
Figure 2.
Flowchart of the Phyton-based techno-economic simulation architecture within GEOPHIRES-X- The diagram illustrates the algorithmic bypass of the native analytical routines through the direct ingestion of the externally calculated thermal vector (T(t)) from MRST, which drives the sequential execution of the wellbore, surface plant, and economic submodules.
Figure 2.
Flowchart of the Phyton-based techno-economic simulation architecture within GEOPHIRES-X- The diagram illustrates the algorithmic bypass of the native analytical routines through the direct ingestion of the externally calculated thermal vector (T(t)) from MRST, which drives the sequential execution of the wellbore, surface plant, and economic submodules.
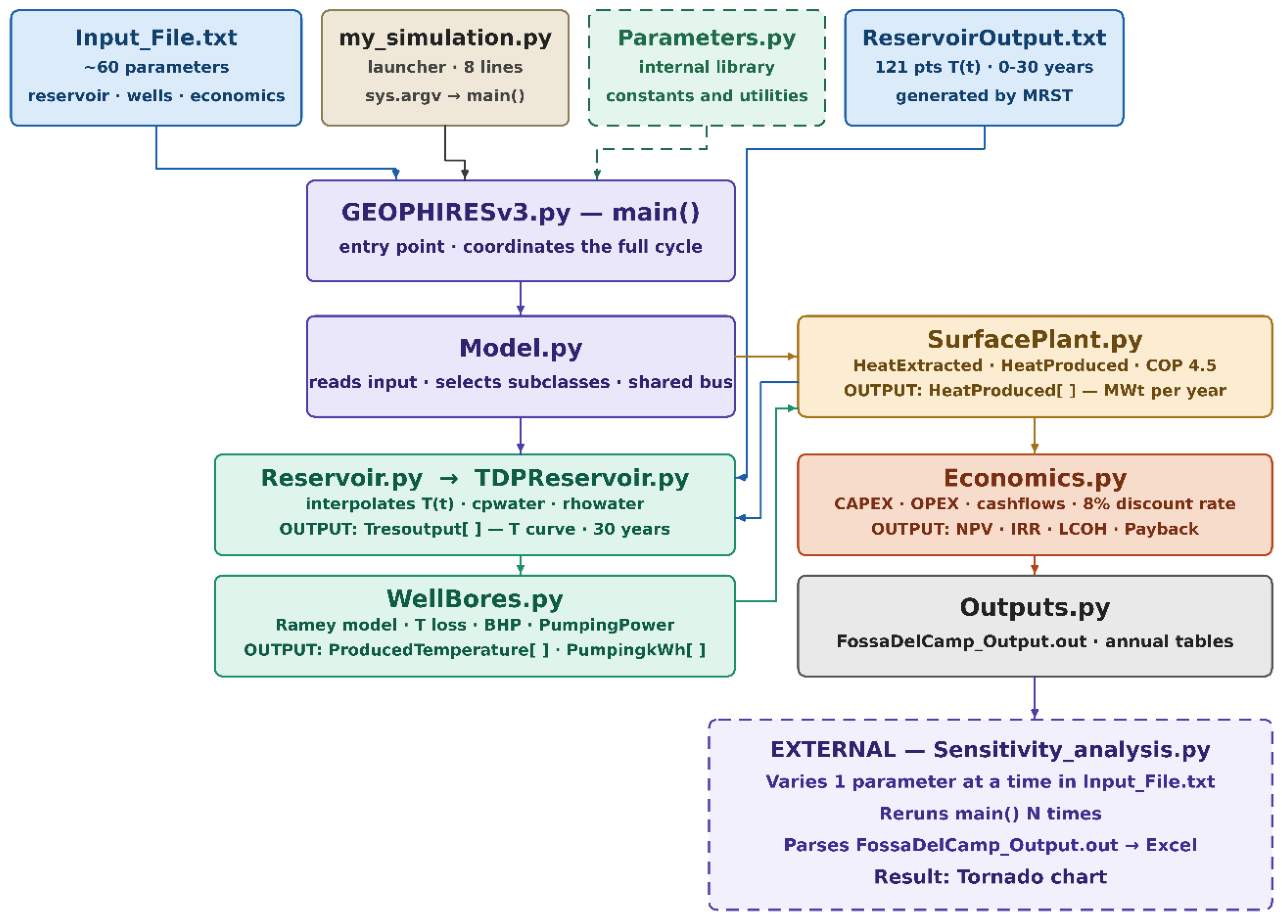
Figure 3.
Configuration of the Python-based automation framework. The diagram illustrates the loose-coupling strategy, where Python orchestrates the automated data transfer, specifically the thermal vector (T(t)) and productivity indices (PI/II), between the MRST physical simulation and the GEOPHIRES-X economic evaluation to generate a global sensitivity analysis, all without human intervention.
Figure 3.
Configuration of the Python-based automation framework. The diagram illustrates the loose-coupling strategy, where Python orchestrates the automated data transfer, specifically the thermal vector (T(t)) and productivity indices (PI/II), between the MRST physical simulation and the GEOPHIRES-X economic evaluation to generate a global sensitivity analysis, all without human intervention.
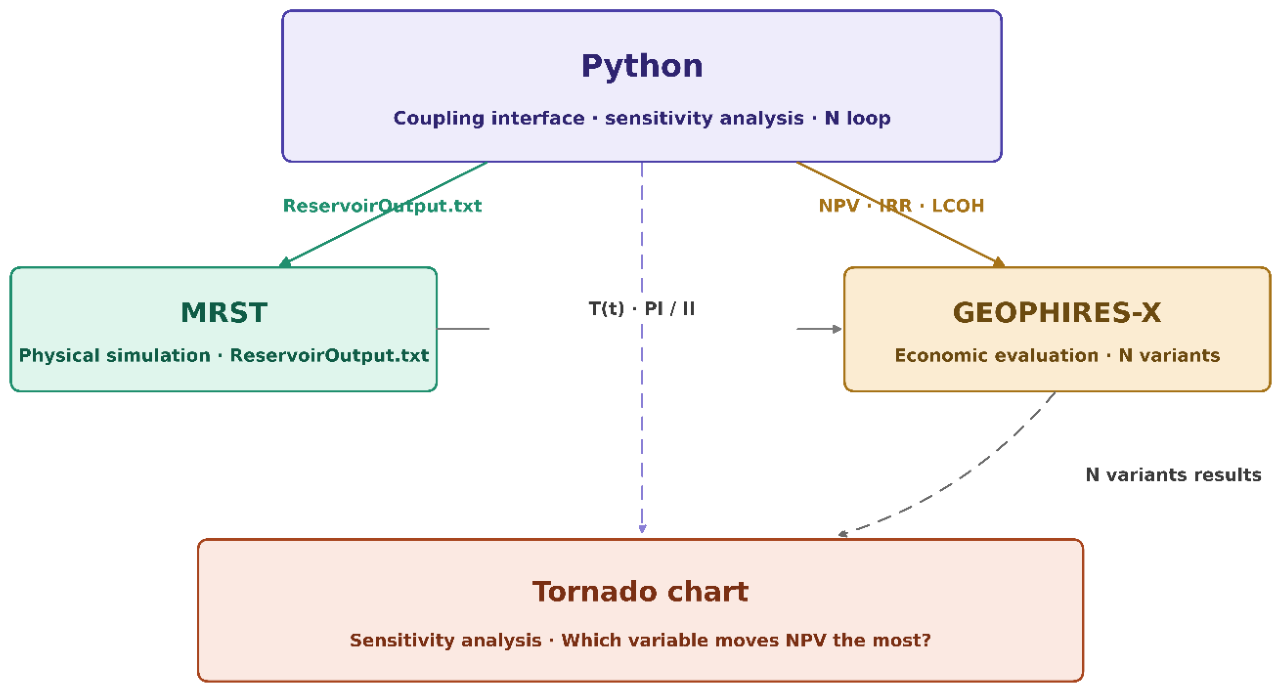
Figure 4.
Situation of the study area – Camp Basin, in NE, Spain.; 3D regional-scale geological model: Surfaces, Voxels, Thermal model (adapted from [24]).
Figure 4.
Situation of the study area – Camp Basin, in NE, Spain.; 3D regional-scale geological model: Surfaces, Voxels, Thermal model (adapted from [24]).
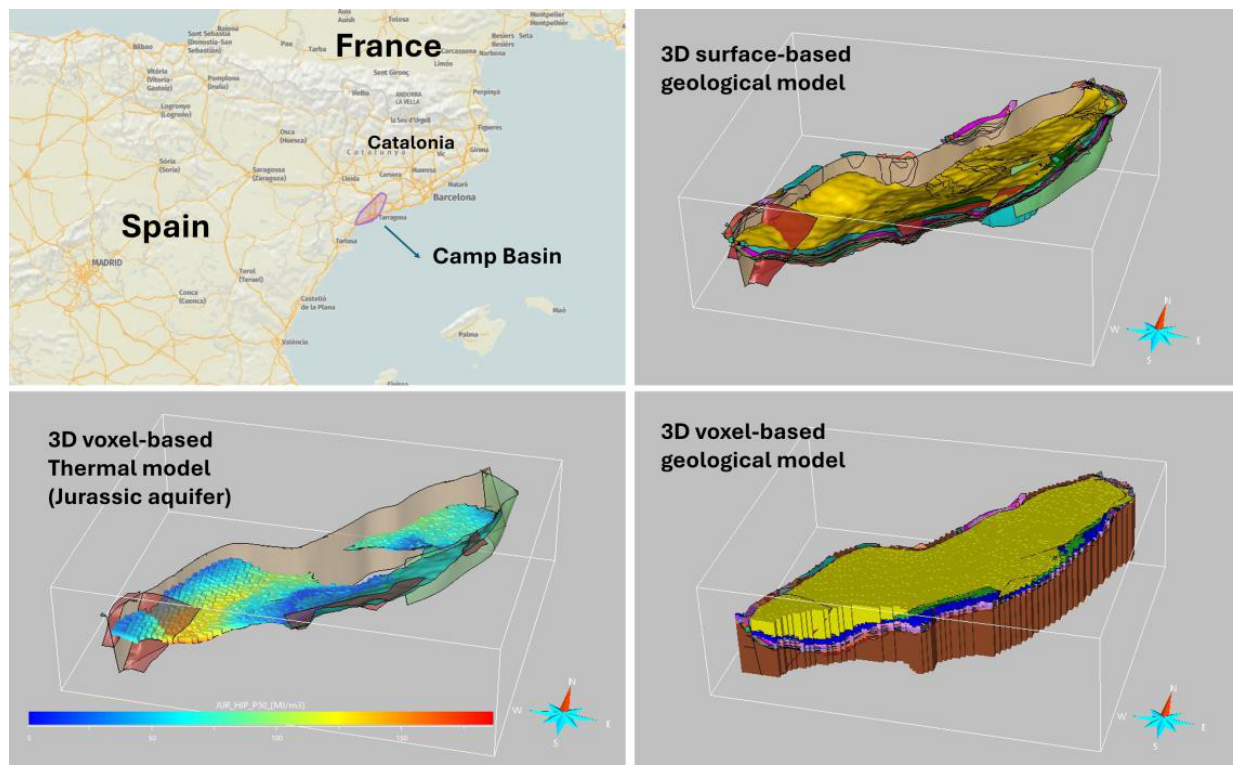
Figure 5.
Geological map of the Camp Basin and virtual geological cross-section derived from the regional-scale 3D geological model, showing the Miocene deposits in filling the basin, the underlying Mesozoic succession (Jurassic, Triassic (K)euper, (M)uschelkalk, and (B)untsandstein), the Paleozoic Basement and indication of the SW-NE Camp Fault. The cross-section also shows the location of the Reus-1, Reus-2, and Reus-3 deep wells, together with the deviated injection–production doublet implemented in the 3D MRST reservoir simulation.
Figure 5.
Geological map of the Camp Basin and virtual geological cross-section derived from the regional-scale 3D geological model, showing the Miocene deposits in filling the basin, the underlying Mesozoic succession (Jurassic, Triassic (K)euper, (M)uschelkalk, and (B)untsandstein), the Paleozoic Basement and indication of the SW-NE Camp Fault. The cross-section also shows the location of the Reus-1, Reus-2, and Reus-3 deep wells, together with the deviated injection–production doublet implemented in the 3D MRST reservoir simulation.
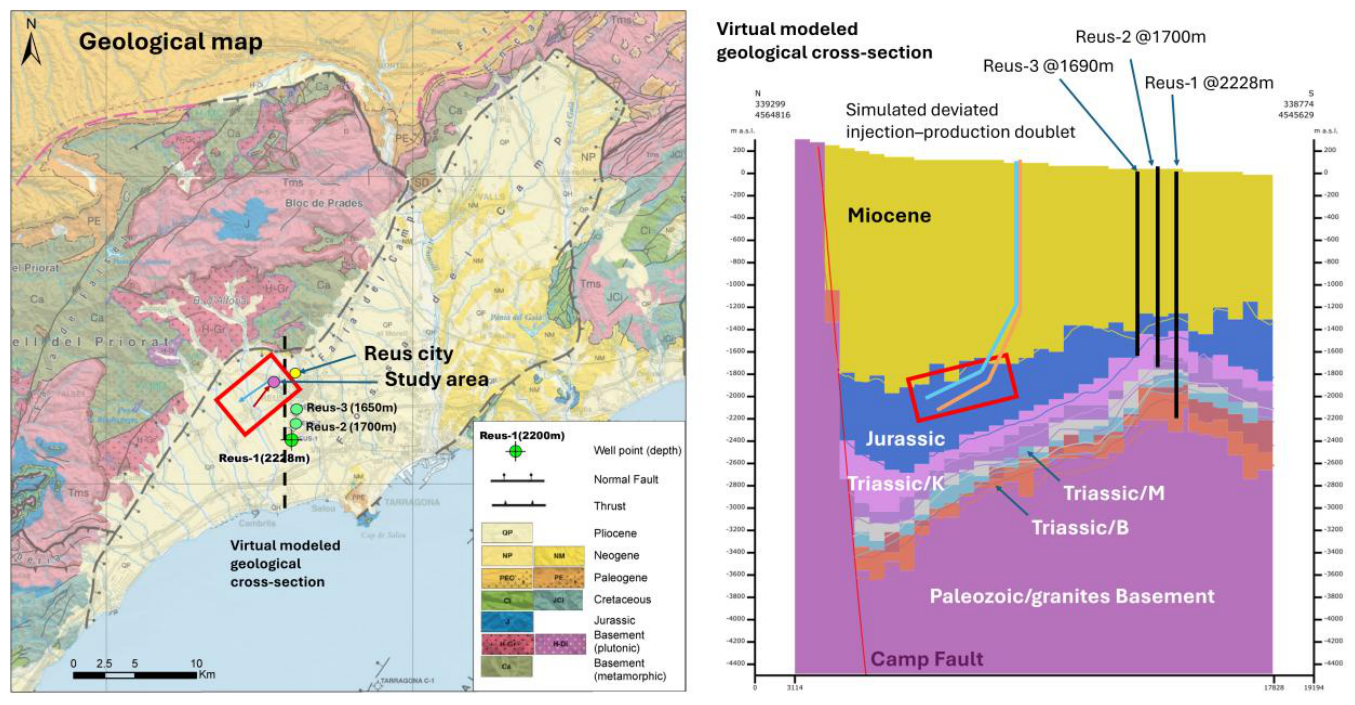
Figure 7.
Spatial distribution of the 3D thermal plume within the Jurassic aquifer at year 30
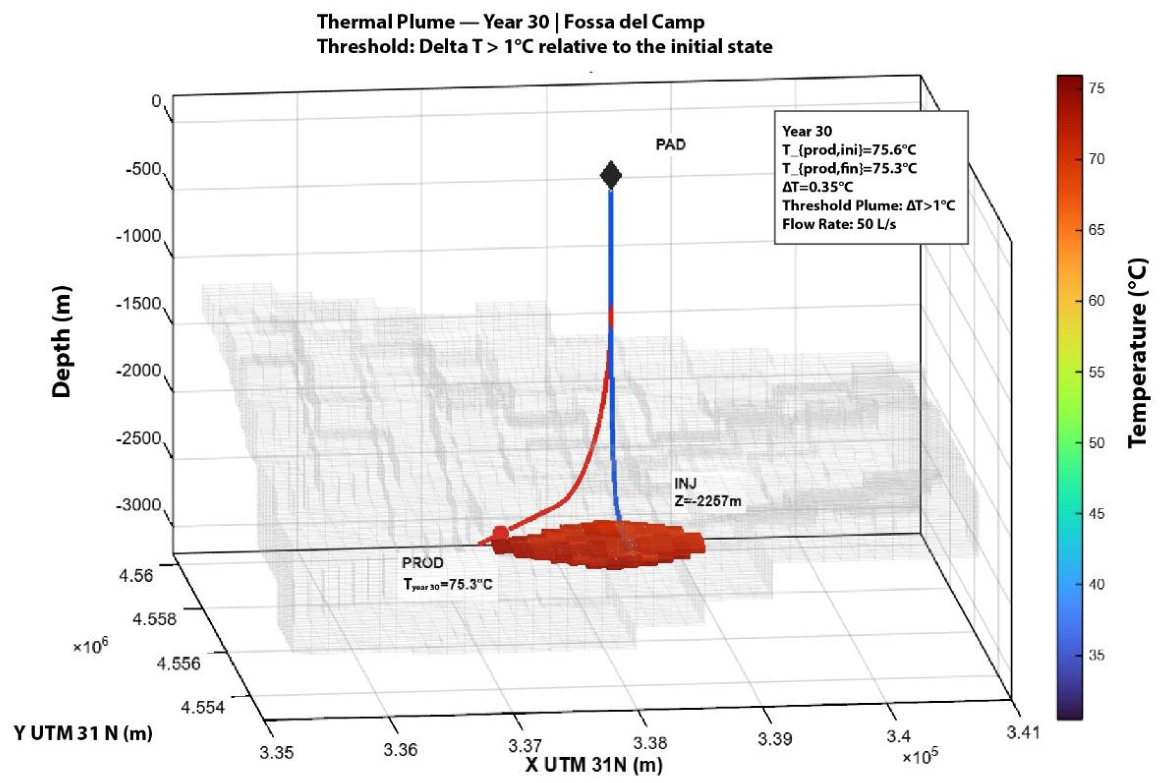
Figure 8.
Automated One-Factor-at-a-Time (OFAT) sensitivity analysis results. Impact of parametric variations on the Net Present Value (NPV). Impact on the Levelized Cost of Heat (LCOH). It can be observed that geological parameters demonstrate minimal influence compared to operational and surface constraints.
Figure 8.
Automated One-Factor-at-a-Time (OFAT) sensitivity analysis results. Impact of parametric variations on the Net Present Value (NPV). Impact on the Levelized Cost of Heat (LCOH). It can be observed that geological parameters demonstrate minimal influence compared to operational and surface constraints.
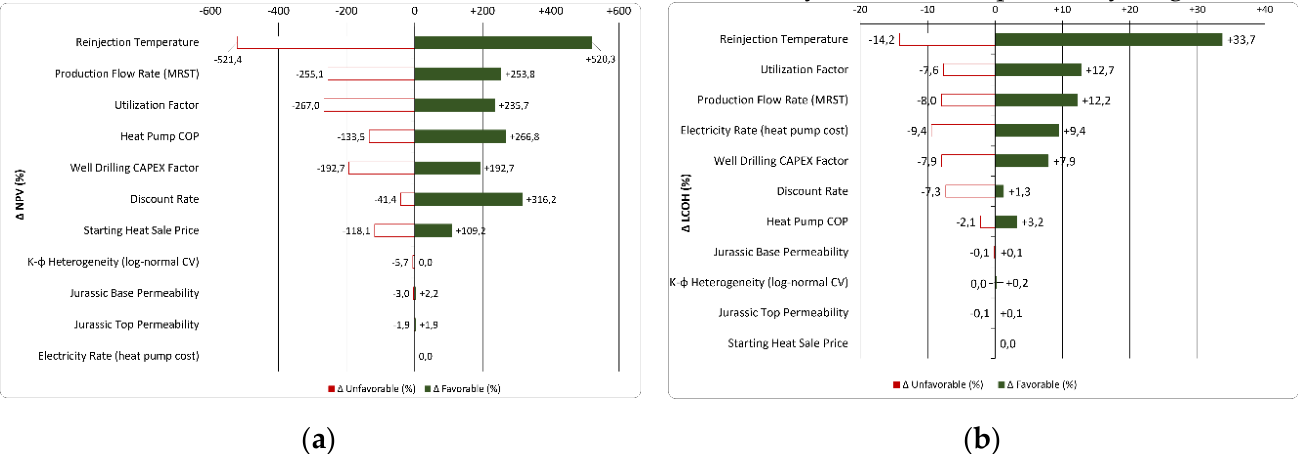
Table 2.
Absolute bounds of NPV and LCOH under the sensitivity analysis.
| Parameter | Min NPV (MEUR) | Max NPV (MEUR) | Min LCOH (€/kWhₜₕ) |
Max LCOH (€/kWhₜₕ) |
|---|---|---|---|---|
| Reinjection Temperature | -13.40 | 19.80 | 0.098 | 0.153 |
| Production Flow Rate | -4.93 | 11.25 | 0.105 | 0.128 |
| Utilization Factor | -5.31 | 11.68 | 0.105 | 0.129 |
| Heat Pump COP | -1.07 | 11.66 | 0.112 | 0.118 |
| Discount Rate | 2.17 | 15.40 | 0.106 | 0.124 |
Disclaimer/Publisher’s Note: The statements, opinions and data contained in all publications are solely those of the individual author(s) and contributor(s) and not of MDPI and/or the editor(s). MDPI and/or the editor(s) disclaim responsibility for any injury to people or property resulting from any ideas, methods, instructions or products referred to in the content. |
© 2026 by the authors. Licensee MDPI, Basel, Switzerland. This article is an open access article distributed under the terms and conditions of the Creative Commons Attribution (CC BY) license (http://creativecommons.org/licenses/by/4.0/).
Copyright: This open access article is published under a Creative Commons CC BY 4.0 license, which permit the free download, distribution, and reuse, provided that the author and preprint are cited in any reuse.