

Submitted:
07 September 2026
Posted:
17 September 2026
You are already at the latest version
Abstract
Background: Diabetic cardiomyopathy is an under-recognized complication of type 1 diabetes mellitus (T1DM), often co-existing with diabetic nephropathy. This study investigates whether patients with T1DM and end-stage renal disease (ESRD) undergoing simultaneous pancreas-kidney transplantation (SPKT) show echocardiographic signs of cardiomyopathy prior to surgery and explores whether cardiac changes are more attributable to diabetes itself or to chronic kidney disease. Methods: We retrospectively analyzed preoperative echocardiographic data of 16 SPKT patients with T1DM and ESRD, using 2D speckle tracking for strain assessment. Data were compared to individually matched control groups: (1) ESRD patients without diabetes (n=20) and (2) healthy controls (n=48). Left and right ventricular/atrial function and structure were analyzed, including 2D speckle-tracking analysis. A mixed-effects model adjusted for age, sex, coronary artery disease, and hypertension. Results: SPKT patients exhibited significant structural changes of the left heart, including increased left ventricular mass and left atrial volume index, alongside reduced global longitudinal strain (GLS), global radial strain (GRS), and global circumferential strain (GCS) compared to healthy controls. GRS and GCS were significantly lower in the SPKT group than in the ERSD group without diabetes. Left atrial strain and strain rates were reduced in both disease groups. Right ventricular and atrial strain parameters did not significantly differ between groups. Mixed model analysis confirmed significant strain differences in the left ventricle even after adjusting for confounders. Conclusions: T1DM patients with end-stage nephropathy awaiting SPKT show early echocardiographic signs of diabetic cardiomyopathy despite preserved LVEF, with predominant involvement of the left heart. Compared to non-diabetic ESRD patients, the diabetic cohort exhibited greater impairment in left ventricular strain parameters, supporting a pathophysiologic role of diabetes independent of kidney disease. Speckle-tracking analysis proved to be a sensitive method to detect subclinical myocardial dysfunction in this high-risk population.
Keywords:
diabetic cardiomyopathy
; speckle tracking echocardiography
; strain
; diabetes mellitus type 1
; pancreas-kidney transplantation
; end-stage renal disease
1. Introduction
Diabetes mellitus type 1 (T1DM) is a chronic autoimmune disease marked by insulin deficiency and associated with high morbidity due to long-term microvascular complications [1]. Diabetic nephropathy affects approximately 30–40% of patients with T1DM and remains a leading cause of end-stage renal disease (ESRD) [2]. In selected severe cases, simultaneous pancreas-kidney transplantation (SPKT) is considered the optimal therapeutic approach, aiming to restore both, normoglycemia and kidney function [3,4].
A less understood, but increasingly recognized complication of T1DM is diabetic cardiomyopathy, a primary myocardial disease independent of hypertension, coronary artery disease, or valvular abnormalities. It is characterized by concentric left ventricular hypertrophy, interstitial fibrosis, and diastolic or systolic dysfunction, with preserved ejection fraction in early stages [5,6,7,8,9].
Cardiovascular disease remains the leading cause of death in diabetic patients, and emerging evidence suggests that myocardial dysfunction in diabetic cardiomyopathy may begin long before symptoms or traditional echocardiographic abnormalities become apparent. Two-dimensional speckle tracking echocardiography has emerged as a powerful technique to detect subclinical myocardial impairment by analyzing myocardial deformation in multiple directions, including global longitudinal strain (GLS), circumferential strain (GCS), and radial strain (GRS)[10,11].
However, the specific contribution of diabetes versus uremia in the development of myocardial dysfunction remains unclear, particularly in the context of T1DM patients with diabetic nephropathy awaiting SPKT [12,13,14]. This study aims to evaluate echocardiographic and speckle tracking findings in SPKT candidates and compare them with matched controls with ESRD but no diabetes, and healthy individuals, to differentiate diabetic from uremic cardiomyopathy.
2. Methods
This retrospective observational study was conducted at the Department of Cardiology, Charité Campus Virchow-Klinikum, Berlin. The study protocol conforms to the ethical guidelines of the 1975 Declaration of Helsinki. This study was approved by the local ethics committee (#EA4/202/19).
We screened all patients who underwent SPKT between January 1, 2005, and December 31, 2018. Only patients with T1DM, ESRD, and a transthoracic echocardiogram with 2D speckle tracking imaging prior to transplantation were included. Out of 335 initial cases, only 16 met all inclusion criteria and formed the SPKT group.
Two control groups were individually matched to the SPKT patients based on age (±2 years) and sex: (1) an ESRD control group without diabetes (n=20), and (2) a healthy control group without diabetes or kidney disease and with normal echocardiographic findings (n=48). Data were extracted from the SAP and TBase systems, and echocardiograms were analyzed using EchoPAC software.
Conventional echocardiographic parameters included evaluation of left and right ventricular systolic function, chamber dimensions, and diastolic function. 2D speckle tracking analysis provided global longitudinal strain (GLS), global circumferential strain (GCS), and global radial strain (GRS) for the left ventricle, GLS for the right ventricle, as well as peak atrial longitudinal strain (PALS) and strain rates for the left and right atrium. The strain values are given in absolute numbers.
Statistical analysis was performed using SPSS. Group comparisons were conducted with t-tests or ANOVA as appropriate. A linear mixed-effects model was used to adjust for confounding variables such as age, sex, hypertension, and coronary artery disease. A p-value < 0.05 was considered statistically significant.
3. Results
A total of 16 patients with T1DM and ESRD who underwent SPKT met all inclusion criteria (SPKT group). The control groups included 20 matched ESRD patients without diabetes and 48 healthy individuals (healthy controls). The mean age across all groups was similar due to matching (mean age 42 years), and there was a balanced sex distribution.
3.1. Demographic and Clinical Characteristics
Baseline demographics showed no significant differences between SPKT and ESRD groups in terms of age, sex, hypertension, or coronary artery disease (Table 1). Body mass index (BMI) was slightly lower in the SPKT. All SPKT patients had longstanding T1DM (>20 years) and advanced kidney disease.
3.2. Echocardiographic Standard Parameters
Left ventricular (LV) morphology and function (Table 2) showed significant group differences. Patients in the ESRD group had the largest LV dimensions (LVEDD and LVESD), and both SPKT and ESRD patients exhibited significantly increased LV wall thickness (IVS, PW) and LV mass (LVM, LVMI) compared to controls. Diastolic function parameters (E, A, E/A ratio, DT, e’ sept/lat) were significantly impaired in SPKT and ESRD patients, with notably elevated E/e′ ratios, suggesting increased filling pressures. Left ventricular ejection fraction (LVEF) was significantly reduced in SPKT and ESRD patients compared to controls, but still within the range of preserved ejection fraction.
Left atrial (LA) remodeling (Table 3) was more pronounced in both patient groups. LA volumes and indices (LAVol max/pre-a/min and LAVI max/pre-a/min) were significantly higher in SPKT and ESRD patients compared to controls. Notably, LA pre-a length and volume parameters were particularly enlarged in the SPKT group.
Right ventricular (RV) structure and function (Table 4) also differed significantly across groups. RV basal and mid diameters (RVEDD) were significantly larger in both SPKT and ESRD groups compared to controls. RV areas were significantly enlarged in the patient groups. Systolic function parameters such as TAPSE and tissue Doppler velocity (s’) were reduced in SPKT and ESRD groups compared to controls, though fractional area change (FAC) remained preserved across all groups. Estimated pulmonary pressures (TR velocity, sPAP) showed a trend toward elevation in patient groups, but differences did not reach statistical significance.
Right atrial (RA) geometry (Table 5) showed significantly increased RA area, volume, and indexed volume in SPKT and ERSD patients compared to controls, with no differences observed between SPKT and ESRD.
3.3. Strain Analysis
Left ventricular strain analysis revealed significantly impaired deformation in both patient groups compared to healthy controls (Table 6). Global longitudinal strain (GLS), assessed at basal, mid, and apical segments, was markedly reduced in both patient groups relative to controls (p < 0.001 for all), with no significant difference between SPKT and ESRD patients. Average GLS showed the most pronounced impairment in SPKT patients (-10.69 ± 2.42%) compared to controls (-17.19 ± 1.68%; p < 0.001). Global circumferential strain (GCS) and global radial strain (GRS) were also significantly reduced in both patient groups versus controls (p < 0.001). Notably, GCS was lower in SPKT compared to ESRD patients (p = 0.002), while GRS was significantly higher in controls than in ESRD patients (p = 0.047), suggesting progressive loss of contractile reserve in chronic kidney disease, aggravated by the diabetic substrate.
Left atrial strain parameters were significantly impaired in both patient groups (Table 7). Peak atrial contraction strain (PACS) was most reduced in the ESRD group (-11.57 ± 4.22%) compared to both controls and SPKT patients (p = 0.002). Peak atrial longitudinal strain (PALS), as well as atrial strain rates during systole (SRs), early diastole (SRe), and atrial contraction (SRa), were significantly lower in both patient groups compared to controls (all p < 0.05).
Right ventricular strain analysis did not reveal significant differences between groups (Table 8). RV global longitudinal strain (GLS) including free wall, endocardial, midmyocardial, and epicardial components were not significantly different across groups.
Right atrial strain analysis (Table 9) revealed impaired atrial contraction strain (SRa) in both patient groups compared to controls. RA strain parameters (PACS, PALS, SRs, SRe) showed no statistically significant differences across groups, although a trend toward reduced reservoir and conduit function was noted in the SPKT and ESRD groups.
3.4. Predictors of Left Ventricular Myocardial Strain
To identify independent predictors of impaired myocardial deformation, mixed-effects linear models were constructed for global longitudinal strain (GLS), global circumferential strain (GCS), and global radial strain (GRS), with clinical group (SKPT/ESRD/control), age, sex, hypertension, and coronary artery disease as covariates.
GLS was significantly associated with clinical group status (β = –5.68, p < 0.001), indicating that patients with end-stage renal disease—particularly those with diabetes—had substantially reduced longitudinal function. None of the other covariates, including age, sex, hypertension, or coronary artery disease, showed a significant influence on GLS (Figure 1).
GCS was also independently associated with group status (β = –8.51, p = 0.004), confirming impaired circumferential fiber shortening in the patient groups. In addition, female sex was associated with lower GCS values (β = –4.69, p = 0.018), suggesting potential sex-based differences in circumferential strain mechanics. Age, hypertension, and coronary artery disease were not significant predictors in the model (Figure 2).
In contrast, GRS showed a positive association with patient group (β = 14.78, p = 0.009), reflecting paradoxically higher radial strain values in the ESRD groups, potentially due to compensatory mechanisms. Age was inversely associated with GRS (β = –0.66, p = 0.007), indicating declining radial deformation with increasing age. Other covariates, including sex, hypertension, and coronary artery disease, were not significantly associated with GRS (Figure 3).
These findings highlight that strain impairments—particularly in the longitudinal and circumferential domains—are primarily driven by disease group affiliation rather than classical cardiovascular risk factors, whereas age appears to selectively influence radial deformation capacity.
4. Discussion
This study provides novel insights into myocardial structure and function in a unique cohort of T1DM patients with advanced diabetic nephropathy awaiting SPKT. It presents a detailed echocardiographic analysis comparing patients with T1DM and ESRD awaiting SKPT, patients with ESRD without diabetes, and healthy controls. Using conventional and 2D speckle-tracking echocardiography, we identified subclinical systolic dysfunction in the SPKT cohort, particularly in left ventricular deformation parameters such as GLS, GRS, and GCS, despite preserved LVEF.
Our findings support the hypothesis that diabetes plus renal failure exerts a stronger impairment of systolic myocardial function than renal failure alone, implicating an additional negative impact of hyperglycemia. Although both SPKT and ESRD patients had signs of hypertrophy and atrial enlargement, strain values in the SPKT group were more severely impaired, especially GRS and GCS.
Left heart structural and functional differences were pronounced in both patient groups compared to healthy controls. Although LVEF remained within normal limits, patients in both groups (SPKT and ESRD) showed significantly reduced GLS, GCS, and GRS, suggesting early systolic dysfunction undetectable by conventional metrics. Notably, GCS and GRS were even more impaired in the SPKT group, implying a more advanced stage of myocardial remodeling in these patients, potentially attributable to the combined effects of diabetic and uremic cardiomyopathy.
Concentric left ventricular hypertrophy was observed in both patient groups, with elevated left ventricular mass (LVM), mass index (LVMI), and left ventricular enddiastolic volume (LVEDV) more pronounced in ESRD patients. Left atrial volume index (LAVI) and strain measures (PALS, PACS, strain rates) were also significantly increased or reduced, respectively, particularly in the ESRD group, indicating elevated left ventricular filling pressures due to diastolic dysfunction and ESRD associated hypervolemia. However, despite equally high E/e’parameters SPKT patients showed smaller LVEDV values, suggesting advanced diastolic dysfunction without evident cardiac hypervolemia. This underscores the diabetogenic impact on cardiac function apart from ESRD and volume state. In addition, these results mark the utility of atrial strain as a sensitive marker for early diastolic impairment in patients with diabetes and/or renal disease [15,16].
The early impairment of systolic deformation—especially GLS —prior to measurable changes in LVEF underscores the utility of speckle tracking as a sensitive diagnostic method. These findings are consistent with prior studies demonstrating that GLS deteriorates earlier than conventional EF metrics in diabetes [17,18,19].
Prior studies have demonstrated that both entities, diabetic and uremic cardiomyopathy, are associated with LV hypertrophy, diastolic and systolic dysfunction, and myocardial fibrosis. Subclinical systolic dysfunction is often first detectable through impaired longitudinal strain, particularly in the absence of LVEF changes. Several studies in children and adults with type 1 diabetes have shown significantly impaired GLS and GCS values, even early after diagnosis [20,21]. Similarly, patients with ESRD exhibit early myocardial impairment detectable by strain imaging, regardless of preserved EF [22].
This present study not only confirms that cardiac function is impaired in patients with T1DM and ESRD, but contributes novel evidence that both diabetes and renal disease exert independent and synergistic effects on cardiac mechanics—even in relatively young and asymptomatic patients.
The distinction between SKPT and ESRD patients further supports differential myocardial remodeling pathways. ESRD patients exhibited more severe left ventricular filling pressures, likely related to longer dialysis exposure, chronic uremic remodeling and additive hypervolemia. SPKT patients had more pronounced systolic dysfunction and equally impaired diastolic dysfunction function parameters despite compensated ventricular size, possibly driven by microvascular complications of long-standing diabetes, suggesting that diabetes exerts a stronger impact on cardiac functionthan kidney failure alone. Chronic hyperglycemia is a central driver in the pathogenesis. Persistently elevated glucose promotes the accumulation of advanced glycation end-products, which in turn amplify oxidative stress and inflammation. By binding to their receptors on cardiomyocytes and fibroblasts, AGEs activate intracellular signaling cascades that foster fibrosis, hypertrophy, and apoptosis [23,24,25].
Using a mixed-effects model, we showed that SKPT patients had significantly reduced LV GLS, GCS, and GRS values compared to matched healthy controls, even after adjusting for age, sex, hypertension, and coronary artery disease. Importantly, older age and male sex were independently associated with reduced strain values—consistent with prior literature. Interestingly, coronary artery disease and hypertension were not significantly associated with strain impairment in this cohort.
Right heart strain parameters were preserved in both pathological groups, pointing toward a left-dominant pathology. While left atrial strain measures were also reduced, these did not remain significant after multivariable adjustment, indicating confounding effects such as age, sex, and cardiovascular comorbidities.
Limitations of the study include its retrospective, single-center design and small sample size. The rarity of SPKT and the difficulty in obtaining high-quality echocardiographic images limited the number of included patients. Moreover, echocardiograms were acquired by different operators, introducing potential variability.
To our knowledge, this is the first study to systematically evaluate speckle tracking parameters in SPKT candidates. The findings advocate for the inclusion of advanced echocardiographic strain analysis in pre-transplant evaluations, potentially improving risk stratification and therapeutic planning.
5. Conclusion
Patients with type 1 diabetes and diabetic nephropathy awaiting simultaneous pancreas-kidney transplantation exhibit early markers of diabetic cardiomyopathy that appear to be primarily attributable to diabetes itself, independent of renal dysfunction. In particular, deformation parameters such as global longitudinal strain, global radial strain, and global circumferential strain offer enhanced diagnostic sensitivity and should be considered valuable tools for the early detection of subclinical myocardial dysfunction in this high-risk population.
Author Contributions
Concept/design – KZ, LJL, Data analysis/interpretation – KZ, LJL, KH, Drafting article - KZ, Critical revision of article – LJL, FH, IH, AK, Data collection – KZ, LJL, KH, FH, IH, AK.
Funding
This research did not receive any specific grant from funding agencies in the public, commercial, or not-for-profit sectors.
Institutional Review Board Statement
The study protocol conforms to the ethical guidelines of the 1975 Declaration of Helsinki. This study was approved by the local ethics committee (#EA4/202/19, date: 2020.02.25).
Informed Consent Statement
Informed consent was obtained from all subjects involved in the study.
Data Availability Statement
The data presented in this study are available on request.
Conflicts of interest
None.
References
- Eisenbarth GS. Type I diabetes mellitus. A chronic autoimmune disease. N Engl J Med. 1986;314(21):1360–8.
- Alicic RZ, Rooney MT, Tuttle KR. Diabetic Kidney Disease: Challenges, Progress, and Possibilities. Clin J Am Soc Nephrol. 2017;12(12):2032–45.
- Montagud-Marrahi E, Molina-Andujar A, Pane A, Ruiz S, Amor AJ, Esmatjes E, et al. Impact of Simultaneous Pancreas-kidney Transplantation on Cardiovascular Risk in Patients With Diabetes. Transplantation. 2022;106(1):158–66.
- Kandaswamy R, Stock PG, Gustafson SK, Skeans MA, Urban R, Fox A, et al. OPTN/SRTR 2018 Annual Data Report: Pancreas. Am J Transplant. 2020;20 Suppl s1:131–92.
- Ganguly PK, Pierce GN, Dhalla KS, Dhalla NS. Defective sarcoplasmic reticular calcium transport in diabetic cardiomyopathy. Am J Physiol. 1983;244(6):E528–35.
- Trachanas K, Sideris S, Aggeli C, Poulidakis E, Gatzoulis K, Tousoulis D, et al. Diabetic cardiomyopathy: from pathophysiology to treatment. Hellenic J Cardiol. 2014;55(5):411–21.
- Lorenzo-Almoros A, Tunon J, Orejas M, Cortes M, Egido J, Lorenzo O. Diagnostic approaches for diabetic cardiomyopathy. Cardiovasc Diabetol. 2017;16(1):28.
- Bertoni AG, Tsai A, Kasper EK, Brancati FL. Diabetes and idiopathic cardiomyopathy: a nationwide case-control study. Diabetes Care. 2003;26(10):2791–5.
- Boudina S, Abel ED. Diabetic cardiomyopathy revisited. Circulation. 2007;115(25):3213–23.
- Leitman M, Lysyansky P, Sidenko S, Shir V, Peleg E, Binenbaum M, et al. Two-dimensional strain-a novel software for real-time quantitative echocardiographic assessment of myocardial function. J Am Soc Echocardiogr. 2004;17(10):1021–9.
- Gorcsan J, 3rd, Tanaka H. Echocardiographic assessment of myocardial strain. J Am Coll Cardiol. 2011;58(14):1401–13.
- Alhaj E, Alhaj N, Rahman I, Niazi TO, Berkowitz R, Klapholz M. Uremic cardiomyopathy: an underdiagnosed disease. Congest Heart Fail. 2013;19(4):E40–5.
- London GM, Pannier B, Guerin AP, Blacher J, Marchais SJ, Darne B, et al. Alterations of left ventricular hypertrophy in and survival of patients receiving hemodialysis: follow-up of an interventional study. J Am Soc Nephrol. 2001;12(12):2759–67.
- Wang X, Shapiro JI. Evolving concepts in the pathogenesis of uraemic cardiomyopathy. Nat Rev Nephrol. 2019;15(3):159–75.
- Paoletti E, Zoccali C. A look at the upper heart chamber: the left atrium in chronic kidney disease. Nephrol Dial Transplant. 2014;29(10):1847–53.
- Liu Y, Wang K, Su D, Cong T, Cheng Y, Zhang Y, et al. Noninvasive assessment of left atrial phasic function in patients with hypertension and diabetes using two-dimensional speckle tracking and volumetric parameters. Echocardiography. 2014;31(6):727–35.
- Nakai H, Takeuchi M, Nishikage T, Lang RM, Otsuji Y. Subclinical left ventricular dysfunction in asymptomatic diabetic patients assessed by two-dimensional speckle tracking echocardiography: correlation with diabetic duration. Eur J Echocardiogr. 2009;10(8):926–32.
- Liu YW, Su CT, Huang YY, Yang CS, Huang JW, Yang MT, et al. Left ventricular systolic strain in chronic kidney disease and hemodialysis patients. Am J Nephrol. 2011;33(1):84–90.
- Yan P, Li H, Hao C, Shi H, Gu Y, Huang G, et al. 2D-speckle tracking echocardiography contributes to early identification of impaired left ventricular myocardial function in patients with chronic kidney disease. Nephron Clin Pract. 2011;118(3):c232–40.
- Hensel KO, Grimmer F, Roskopf M, Jenke AC, Wirth S, Heusch A. Subclinical Alterations of Cardiac Mechanics Present Early in the Course of Pediatric Type 1 Diabetes Mellitus: A Prospective Blinded Speckle Tracking Stress Echocardiography Study. J Diabetes Res. 2016;2016:2583747.
- Berceanu M, Mirea O, Donoiu I, Militaru C, Saftoiu A, Istratoaie O. Myocardial Function Assessed by Multi-Layered Two-Dimensional Speckle Tracking Analysis in Asymptomatic Young Subjects with Diabetes Mellitus Type 1. Cardiology. 2020;145(2):80–7.
- Kramann R, Erpenbeck J, Schneider RK, Rohl AB, Hein M, Brandenburg VM, et al. Speckle tracking echocardiography detects uremic cardiomyopathy early and predicts cardiovascular mortality in ESRD. J Am Soc Nephrol. 2014;25(10):2351–65.
- Stanley WC, Recchia FA, Lopaschuk GD. Myocardial substrate metabolism in the normal and failing heart. Physiol Rev. 2005;85(3):1093–129.
- Rizza V, Tondi L, Patti AM, Cecchi D, Lombardi M, Perone F, et al. Diabetic cardiomyopathy: pathophysiology, imaging assessment and therapeutical strategies. Int J Cardiol Cardiovasc Risk Prev. 2024;23:200338.
- Bugger H, Abel ED. Molecular mechanisms of diabetic cardiomyopathy. Diabetologia. 2014;57(4):660–71.
Figure 1.
Mixed model: Dependent variable – GLS.
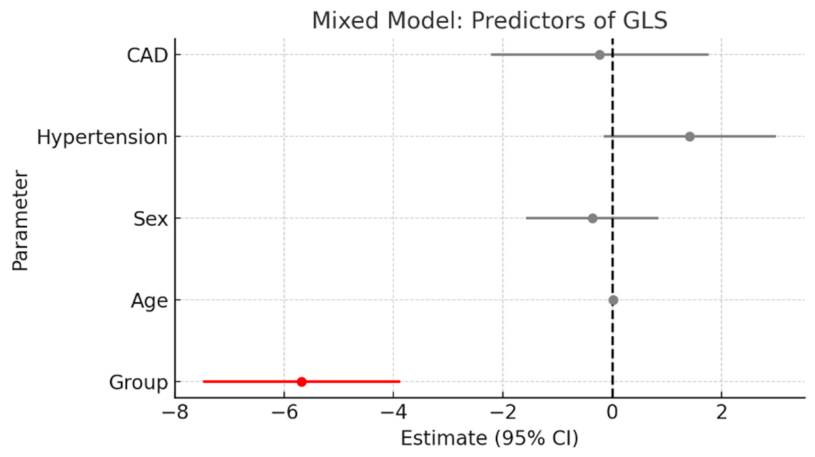
Figure 2.
Mixed model: Dependent variable – GCS.
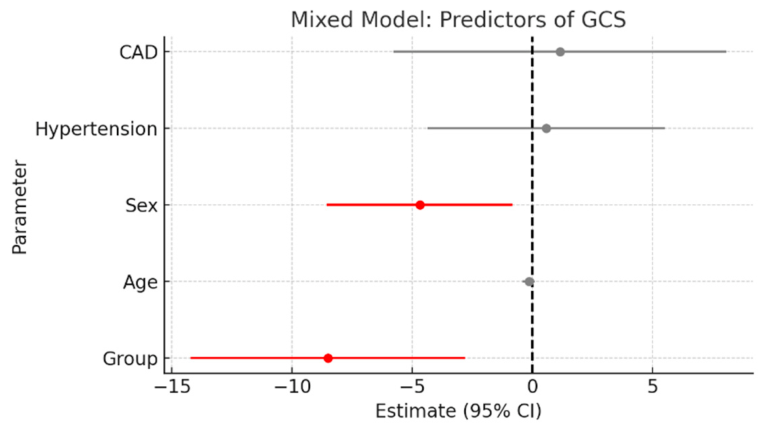
Figure 3.
Mixed model: Dependent variable – GRS.
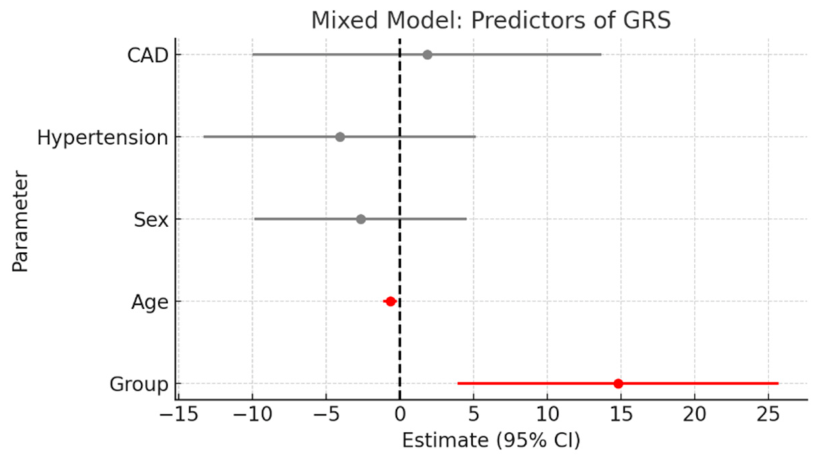

Table 1.
Demographic and Clinical Data of Study Population.
| Variable | SPKT (n=16) | ESRD (n=20) | Controls (n=48) |
| Age (years) | 39 ± 9 | 40 ± 10 | 38 ± 9 |
| Male sex (%) | 8 (50.0%) | 13 (65.0%) | 24 (50.0%) |
| BMI (kg/m²) | 22.8 ± 2.6 | 24.0 ± 5.0 | 23.9 ± 4.0 |
| Type 1 diabetes mellitus (%) | 16 (100%) | 0 (0.0%) | 0 (0.0%) |
| Peritoneal dialysis (%) | 3 (18.8%) | 4 (20.0%) | 0 (0.0%) |
| Hemodialysis (%) | 7 (43.8%) | 15 (75.0%) | 0 (0.0%) |
| Time on dialysis (months) | 29.1 ± 54.6 | 49.5 ± 46.3 | 0.0 ± 0.0 |
| Duration of T1DM (years) | 26.1 ± 9.6 | 0.0 ± 0.0 | 0.0 ± 0.0 |
| Hypertension (%) | 15 (93.8%) | 18 (90.0%) | 8 (16.7%) |
| Coronary artery disease (%) | 5 (31.3%) | 4 (20.0%) | 1 (2.1%) |
| Myocardial infarction (%) | 0 (0.0%) | 1 (5.0%) | 0 (0.0%) |
| Ischemic stroke (%) | 1 (6.3%) | 0 (0.0%) | 1 (5.0%) |
| Creatinine (mg/dL) | 6.4 ± 2.7 | 8.8 ± 3.4 | 0.8 ± 0.2 |
| GFR (ml/min/1.73m²) | 14.9 ± 4.2 | 16.9 ± 8.0 | 87.8 ± 7.2 |
| HbA1c (%) | 7.59 ± 1.57 | 5.1 ± 0.44 | 5.24 ± 0.31 |
BMI = body mass index; DM = diabetes mellitus; eGFR = estimated glomerular filtration rate; HbA1c = hemoglobin A1c; HD = hemodialysis; CAD = coronary artery disease; PD = peritoneal dialysis.
Table 2.
Echocardiographic parameters of the left ventricle.
| Parameter | SPKT | ESRD | Controls | p value | SPKT vs. Control | SPKT vs. ESRD | ESRD vs. Control |
| Aortic sinus (mm) | 2.91 ± 0.29 | 2.82 ± 0.43 | 2.71 ± 0.38 | 0.113 | – | – | – |
| LVEDD (mm) | 4.41 ± 0.60 | 5.19 ± 0.83 | 4.60 ± 0.47 | 0.005 | 0.518 | 0.005 | 0.042 |
| LVESD (mm) | 2.47 ± 0.73 | 3.29 ± 0.76 | 2.85 ± 0.58 | 0.003 | 0.056 | 0.002 | 0.216 |
| IVS (mm) | 1.20 ± 0.23 | 1.24 ± 0.25 | 0.92 ± 0.17 | <0.001 | <0.001 | 1.000 | <0.001 |
| PW (mm) | 1.20 ± 0.26 | 1.11 ± 0.26 | 0.92 ± 0.16 | <0.001 | <0.001 | 0.957 | 0.005 |
| RWT | 0.56 ± 0.17 | 0.44 ± 0.13 | 0.40 ± 0.07 | 0.001 | <0.001 | 0.063 | 0.623 |
| LVM (g) | 195.87 ± 58.82 | 248.31 ± 90.16 | 146.87 ± 45.82 | <0.001 | 0.023 | 0.399 | <0.001 |
| LVMI (g/m²) | 110.23 ± 30.94 | 130.43 ± 45.71 | 78.04 ± 19.00 | <0.001 | 0.001 | 0.919 | <0.001 |
| E (m/s) | 0.94 ± 0.16 | 0.87 ± 0.31 | 0.78 ± 0.18 | 0.024 | 0.020 | 0.390 | 0.867 |
| A (m/s) | 0.80 ± 0.21 | 0.74 ± 0.34 | 0.52 ± 0.15 | <0.001 | <0.001 | 0.791 | 0.006 |
| E/A ratio | 1.25 ± 0.41 | 1.38 ± 1.01 | 1.63 ± 0.67 | 0.012 | 0.124 | 1.000 | 0.023 |
| DT (ms) | 155.83 ± 45.27 | 193.76 ± 55.56 | 192.61 ± 36.24 | 0.038 | 0.043 | 0.102 | 1.000 |
| e’ sept (m/s) | 0.07 ± 0.02 | 0.08 ± 0.02 | 0.11 ± 0.03 | <0.001 | <0.001 | 1.000 | 0.001 |
| e’ lat (m/s) | 0.10 ± 0.01 | 0.09 ± 0.02 | 0.15 ± 0.05 | <0.001 | 0.006 | 1.000 | <0.001 |
| e’ mean (m/s) | 0.09 ± 0.02 | 0.085 ± 0.02 | 0.13 ± 0.03 | <0.001 | 0.002 | 1.000 | <0.001 |
| E/e’ | 11.12 ± 2.23 | 11.79 ± 6.70 | 6.25 ± 1.98 | <0.001 | <0.001 | 1.000 | 0.001 |
| LVEF (%) | 53.69 ± 12.52 | 55.60 ± 12.26 | 61.32 ± 4.79 | 0.037 | 0.061 | 1.000 | 0.269 |
Aortic sinus = sinus of Valsalva diameter; LVEDD = left ventricular end-diastolic diameter; LVESD = left ventricular end-systolic diameter; IVS = interventricular septal thickness; PW = posterior wall thickness; RWT = relative wall thickness; LVM = left ventricular mass; LVMI = left ventricular mass index; E = peak early transmitral flow velocity; A = late transmitral flow velocity; DT = deceleration time; e’ sept/lat = early diastolic mitral annular velocity (septal/lateral); LVEF = left ventricular ejection fraction.
Table 3.
Echocardiographic parameters of the left atrium.
| Parameter | SPKT | ESRD | Controls | p value | SPKT vs. Control | SPKT vs. ESRD | ESRD vs. Control |
| LA length max (cm) | 5.03 ± 0.70 | 5.41 ± 1.22 | 4.57 ± 0.72 | 0.001 | 0.096 | 0.882 | 0.001 |
| LA length pre-a (cm) | 4.65 ± 0.86 | 4.86 ± 1.25 | 3.83 ± 0.69 | <0.001 | 0.005 | 1.000 | <0.001 |
| LA length min (cm) | 4.06 ± 0.79 | 4.62 ± 1.27 | 3.42 ± 0.72 | <0.001 | 0.025 | 1.000 | <0.001 |
| LAVol max (ml) | 57.06 ± 14.29 | 70.88 ± 35.61 | 36.50 ± 9.69 | <0.001 | <0.001 | 1.000 | <0.001 |
| LAVol pre-a (ml) | 44.11 ± 13.85 | 49.43 ± 31.89 | 22.67 ± 7.77 | <0.001 | <0.001 | 1.000 | 0.001 |
| LAVol min (ml) | 23.98 ± 8.06 | 36.48 ± 29.85 | 13.92 ± 4.89 | <0.001 | 0.001 | 1.000 | <0.001 |
| LAVI max (ml/m²) | 32.02 ± 7.46 | 35.51 ± 14.31 | 19.75 ± 4.44 | <0.001 | <0.001 | 1.000 | <0.001 |
| LAVI pre-a (ml/m²) | 24.69 ± 7.41 | 23.78 ± 12.89 | 12.32 ± 3.67 | <0.001 | <0.001 | 1.000 | 0.001 |
| LAVI min (ml/m²) | 13.45 ± 4.38 | 16.76 ± 10.11 | 7.47 ± 2.35 | <0.001 | <0.001 | 1.000 | <0.001 |
pre-a = before atrial contraction; LAVol = left atrial volume; LAVI = left atrial volume index.
Table 4.
Echocardiographic parameters of the right ventricle.
| Parameter | SPKT | ESRD | Controls | p value | SPKT vs. Control | SPKT vs. ESRD | ESRD vs. Control |
| RVEDD basal (cm) | 3.41 ± 0.51 | 3.59 ± 0.78 | 3.02 ± 0.51 | 0.002 | 0.030 | 1.000 | 0.006 |
| RVEDD mid (cm) | 3.23 ± 0.83 | 3.01 ± 0.59 | 2.70 ± 0.51 | 0.030 | 0.068 | 1.000 | 0.171 |
| RVT (cm) | 0.37 ± 0.06 | 0.46 ± 0.06 | 0.35 ± 0.07 | <0.001 | 0.421 | 0.023 | 0.001 |
| RVEDA (cm²) | 18.71 ± 3.50 | 17.01 ± 5.26 | 15.28 ± 4.41 | 0.016 | 0.014 | 0.399 | 0.709 |
| RVESA (cm²) | 12.34 ± 3.07 | 10.64 ± 4.37 | 9.33 ± 3.21 | 0.006 | 0.004 | 0.170 | 0.854 |
| FAC (%) | 37.56 ± 21.06 | 38.38 ± 9.61 | 38.59 ± 12.08 | 0.345 | – | – | – |
| TAPSE (cm) | 2.54 ± 0.32 | 2.15 ± 0.66 | 2.28 ± 0.47 | 0.044 | 0.309 | 0.038 | 0.564 |
| s’ (cm/s) | 0.13 ± 0.02 | 0.11 ± 0.03 | 0.14 ± 0.02 | 0.001 | 0.535 | 0.193 | 0.001 |
| TR (m/s) | 2.15 ± 0.43 | 2.26 ± 0.43 | 1.99 ± 0.35 | 0.092 | – | – | – |
| sPAP (mmHg) | 18.57 ± 7.05 | 21.19 ± 7.69 | 16.60 ± 5.58 | 0.113 | – | – | – |
| VCI max (cm) | 1.59 ± 0.37 | 2.04 ± 0.52 | 1.73 ± 0.33 | 0.102 | – | – | – |
| VCI min (cm) | 0.99 ± 0.43 | 1.22 ± 0.55 | 0.93 ± 0.29 | 0.276 | – | – | – |
RVEDD = right ventricular end-diastolic diameter; RVT = right ventricular wall thickness; RVEDA = right ventricular end-diastolic area; RVESA = right ventricular end-systolic area; FAC = fractional area change; TAPSE = tricuspid annular plane systolic excursion; s’ = tissue Doppler velocity at the tricuspid annulus; TR = tricuspid regurgitation velocity; sPAP = systolic pulmonary arterial pressure; VCI = inferior vena cava.
Table 5.
Echocardiographic parameters of the right atrium.
| Parameter | SPKT | ESRD | Controls | p value | SPKT vs. Control | SPKT vs. ESRD | ESRD vs. Control |
| RAA (cm²) | 15.64 ± 3.02 | 16.78 ± 6.40 |
13.19 ± 2.36 | 0.004 | 0.024 | 1.000 | 0.023 |
| RAVol (ml) | 44.37 ± 15.55 | 50.37 ± 33.06 | 33.13 ± 9.99 | 0.005 | 0.026 | 1.000 | 0.028 |
| RAVI (ml/m²) | 24.76 ± 6.99 |
23.67 ± 8.77 | 18.04 ± 4.39 | 0.001 | 0.003 | 1.000 | 0.030 |
RAA = right atrial area; RAVol = right atrial volume; RAVI = right atrial volume index.
Table 6.
Left Ventricular Strain Analysis.
| Parameter | SPKT | ESRD | Controls | p value | SPKT vs. Control | SPKT vs. ESRD | ESRD vs. Control |
| GLS basal (%) | 13.07 ± 2.69 | 14.68 ± 4.87 | 19.78 ± 1.89 | <0.001 | <0.001 | 0.377 | <0.001 |
| GLS mid (%) | 15.97 ± 3.09 | 17.18 ± 5.56 | 22.85 ± 2.24 | <0.001 | <0.001 | 0.480 | <0.001 |
| GLS apical (%) | 13.07 ± 2.69 | 14.65 ± 4.87 | 19.79 ± 1.88 | <0.001 | <0.001 | 0.431 | <0.001 |
| GLS average (%) | 10.69 ± 2.42 | 12.72 ± 4.37 | 17.19 ± 1.68 | <0.001 | <0.001 | 0.316 | <0.001 |
| GCS (%) | 10.73 ± 3.67 | 19.27 ± 8.17 | 20.09 ± 7.18 | <0.001 | <0.001 | 0.002 | 1.000 |
| GRS (%) | 13.37 ± 13.30 | 25.19 ± 12.75 | 30.67 ± 12.96 | <0.001 | <0.001 | 0.047 | 0.524 |
GLS = global longitudinal strain; GCS = global circumferential strain; GRS = global radial strain.
Table 7.
Left atrial strain and strain rates.
| Parameter | SPKT | ESRD | Controls | p value | SPKT vs. Control | SPKT vs. ESRD | ESRD vs. Control |
| LA PACS | 18.54 ± 7.67 | 11.57 ± 4.22 |
16.91 ± 5.67 | 0.002 | 1.000 | 0.009 | 0.003 |
| LA PALS | 26.69 ± 8.69 | 25.98 ± 11.04 | 39.29 ± 11.56 | <0.001 | 0.001 | 1.000 | 0.001 |
| LA SRs | 1.25 ± 0.36 | 1.17 ± 0.42 | 1.72 ± 0.49 | <0.001 | 0.003 | 1.000 | <0.001 |
| LA SRe | 1.02 ± 0.64 | 1.22 ± 0.67 | 2.17 ± 0.91 | <0.001 | <0.001 | 1.000 | <0.001 |
| LA SRa | 1.65 ± 0.56 | 1.61 ± 0.57 |
2.13 ± 0.71 | 0.013 | 0.068 | 1.000 | 0.048 |
LA PACS – left atrial pre-atrial contraction strain; LA PALS – left atrial peak atrial longitudinal strain; SRs – strain rate during systole; SRe – strain rate during early diastole; SRa – strain rate during atrial contraction.
Table 8.
Right ventricular strain analysis.
| Parameter | SPKT | ESRD | Controls | p value | SPKT vs. Control | SPKT vs. ESRD | ESRD vs. Control |
| RV GLS (%) | 18.33 ± 7.41 | 16.48 ± 6.41 | 19.28 ± 4.75 | 0.315 | – | – | – |
| RV GLS free wall (%) | 23.98 ± 9.25 | 20.07 ± 8.93 | 22.77 ± 6.86 | 0.281 | – | – | – |
| RV GLS endocardial (%) | 21.14 ± 8.29 | 19.33 ± 6.69 | 22.12 ± 5.43 | 0.318 | – | – | – |
| RV GLS midmyocardial (%) | 18.33 ± 7.41 | 16.25 ± 6.51 | 19.23 ± 4.79 | 0.280 | – | – | – |
| RV GLS epicardial (%) | 15.93 ± 7.09 | 14.38 ± 6.34 | 17.41 ± 4.40 | 0.307 | – | – | – |
RV GLS = right ventricular global longitudinal strain.
Table 9.
Right atrial strain and strain rates.
| Parameter | SPKT | ESRD | Controls | p value | SPKT vs. Control | SPKT vs. ESRD | ESRD vs. Control |
| RA PACS (%) | 19.67 ± 14.64 | 14.69 ± 9.65 | 13.93 ± 5.97 | 0.717 | – | – | – |
| RA PALS (%) | 31.07 ± 17.75 | 28.94 ± 18.98 | 33.89 ± 12.96 | 0.229 | – | – | – |
| RA SRs (1/s) | 1.64 ± 0.67 | 1.43 ± 0.74 | 1.59 ± 0.50 | 0.396 | – | – | – |
| RA SRe (1/s) | 1.49 ± 0.88 | 1.91 ± 0.96 | 1.66 ± 0.67 | 0.431 | – | – | – |
| RA SRa (1/s) | 0.89 ± 0.83 | 0.98 ± 0.44 | 1.35 ± 0.58 | 0.006 | 0.016 | 1.000 | 0.071 |
RA = right atrium; PACS = peak atrial contraction strain; PALS = peak atrial longitudinal strain; SRs = systolic strain rate; SRe = early diastolic strain rate; SRa = late diastolic strain rate.
Disclaimer/Publisher’s Note: The statements, opinions and data contained in all publications are solely those of the individual author(s) and contributor(s) and not of MDPI and/or the editor(s). MDPI and/or the editor(s) disclaim responsibility for any injury to people or property resulting from any ideas, methods, instructions or products referred to in the content. |
© 2026 by the authors. Licensee MDPI, Basel, Switzerland. This article is an open access article distributed under the terms and conditions of the Creative Commons Attribution (CC BY) license (http://creativecommons.org/licenses/by/4.0/).
Copyright: This open access article is published under a Creative Commons CC BY 4.0 license, which permit the free download, distribution, and reuse, provided that the author and preprint are cited in any reuse.