

Submitted:
11 September 2026
Posted:
17 September 2026
You are already at the latest version
Abstract
Limosilactobacillus reuteri DSM 17938 feeding to healthy newborn mice modulates gut microbiota and boosts beneficial metabolites. We assessed whether DSM 17938 supplementation in pregnant dams alters breast milk (BM) metabolites and shapes the infant gut metabolomic profile, aimed to improve offspring immunity and overall health. To do this, we evaluated metabolite changes in BM from lactating dams carrying Thy1.2 congenic marker, and in stool from their cross-fostered Thy1.1 pups. Stool samples showed a significantly higher number of altered metabolites (of which 272 were up- and 199 were down-regulated) compared to BM-fed (9 up- and 82 down-regulated). Compared to water-treated controls, BM from DSM 17938-treated dams showed significant upregulation of several anti-inflammatory metabolites, including phosphonolpyruvate (PEP), tryptophan-derived indoles, and the stable adenosine metabolite inosine. Additionally, leucine and glycine were upregulated, reflecting their roles in metabolic regulation. In the stools of cross-fostered pups raised by DSM 17938-treated dams, upregulated fecal metabolites included dipeptides, vitamins, inosine, and the polyamines spermine and spermidine, which actively protect the intestinal epithelium against mucosal injury. Maternal DSM 17938 supplementation altered BM composition by enhancing pathways in immune regulation, neurodevelopment, and metabolic function. Crucially, these metabolic shifts were reflected downstream in the stools of cross-fostered pups, underscoring their potential role in supporting infant gut health.
Keywords:
probiotic
; gut microbiota
; fecal metabolites
; maternal-infant transmission
; cross-fostering
; metabolite
; adenosine
; inosine
1. Introduction
Breast milk (BM) is a biologically active and dynamic source of nutrition for the developing infant, contributing to growth, immune protection, and neurocognitive development. Its composition is influenced by maternal factors including maternal diet, nutrient stores, and localized activity of lactocytes, immune cells, and microbes [1].
The mammary gland microbiome is partly shaped by the maternal gut microbiome through the entero-mammary pathway, whereby nonpathogenic gut bacteria are taken up by dendritic cells (DCs), pass through the mesenteric lymph nodes, and translocate to the mammary glands [2]. This process may be enhanced during late pregnancy and early lactation, when coordinated adaptations occur across multiple organ systems, including the cardiovascular, gastrointestinal (GI), and mammary systems [2]. In particular, reduced GI motility, increased perfusion of the uterus, gut, and mammary glands, and enhanced mesenteric vascular and lymphatic flow may facilitate the movement of intestinal bacteria to the mammary glands [2,3].
Probiotic supplementation is a potential strategy to influence the maternal gut microbiome and, in turn, BM composition. Probiotic Limosilactobacillus reuteri DSM 17938 (DSM 17938) was derived from a strain that was modified by removing two antibiotic resistance plasmids from ATCC 55730, which was isolated from a Peruvian mother’s BM [4]. We previously showed that oral administration of DSM 17938 has potent anti-inflammatory effects, achieved by modulating gut microbiota and their associated metabolites, including adenosine/inosine, amino acids and amino-acid-derived metabolites [5,6,7]. These metabolites interact with immune cells to promote beneficial immune responses and/or with the intestinal epithelium to enhance barrier function. These responses were found in several disease models, including neonatal necrotizing enterocolitis (NEC); the scurfy phenotype characterized by regulatory T cell (Treg) deficiency (a model of human IPEX syndrome), and experimental autoimmune encephalomyelitis (EAE) (a Th1/Th17-driven-model of multiple sclerosis) [5,8,9,10,11,12,13,14,15]. In addition, DSM 17938 feeding of healthy newborn mice modulates gut microbiota and boosts regulatory immune responses in the intestinal mucosa [7,16].
However, it is not known whether this specific probiotic supplementation during pregnancy can alter BM metabolites and subsequently shape the metabolic profile of the infant gut. Here, we aimed to evaluate the impact of maternal DSM 17938 supplementation during pregnancy on BM metabolite composition and on the metabolic profile of the infant gut. To investigate this, pregnant Thy1.2 congenic dams were orally administered either DSM 17938 or water as a control. Following parturition, newborn Thy1.1 congenic mice were cross-fostered to these lactating Thy1.2 dams. Metabolic profiling was subsequently performed on both the BM and the stools of the cross-fostered pups. Cross-fostering was designed to minimize potential effects of transplacental immunity, ensuring that any potential differences in newborn gut metabolomic profiles are attributed to milk-derived factors alone [17]. We hypothesized that, through the entero-mammary pathway, maternal probiotic administration would modify BM composition and lead to beneficial changes in neonatal gut metabolic profiles.
2. Materials and Methods
Mice. Mice with the congenic marker Thy1.2 (B6.Cg-Foxp3tm2Tch/J, JAX 006772) and Thy1.1 (B6.PL-Thy1a/CyJ, JAX 000406) were purchased from Jackson Laboratory (Bar Harbor, ME) and were allowed to acclimatize for 2 weeks after arrival. Breeding pairs were then established to generate pups for experimental use. The mice were housed under a 12-h light/12-h dark cycle at temperature of 18oC-23oC with 40%-60% humidity. Food and water were provided ad libitum in a specific pathogen-free (SPF) animal facility at the University of Texas Health Science Center at Houston (UTHealth Houston). This study was conducted in accordance with the recommendation of the Guide for the Care and Use of Laboratory Animals of the National Institutes of Health (NIH). The Institutional Animal Care and Use Committee (IACUC) of UTHealth Houston approved the study (protocol number: AWC-23-0118).
Probiotic preparation, supplementation and newborn mice cross-fostering. Human BM-derived L reuteri DSM 17938 was provided by BioGaia AB (Stockholm, Sweden) and prepared as described in prior publications [18,19]. Briefly, DSM 17938 was anaerobically cultured in an optimal deMan-Rogosa-Sharpe (MRS) medium (DifcoTM Lactobacilli MRS Broth, BD, Franklin Lakes, NJ) at 37oC for 24h and then plated on MRS agar (DifcoTM Lactobacilli MRS Agar) in serial dilutions and grown anaerobically at 37oC for 48-72h. Quantitative analysis of bacteria in the culture medium was performed by comparing the optical density (OD) at 600nm of cultures at known concentrations using a standard curve generated from bacterial colony-forming units (CFU)/mL grown on MRS agar. Cultured DSM 17938 was prepared for each feeding daily at the calculated CFU required.
The experimental design and its workflow are summarized in Figure 1. The experimental group consisted of pregnant Thy1.2 dams that were fed with DSM 17938 at a concentration of 107 CFU/day in 100 µL, daily, by oral gavage, starting from confirmation of pregnancy until delivery. This was compared to the control group of Thy1.2 dams that were fed with 100 µL of water daily for the same duration. The pregnant dams were randomly assigned as treatment group or control group. BM was collected from dams and immediately stored at -80oC for further global metabolomic analysis.
Thy1.1 mice were bred to generate Thy1.1 pups. Immediately after birth, the pups were cross-fostered to Thy1.2 dams and nursed by either probiotic-fed dams or water-fed dams. Cross-fostering was randomly performed.
Breast milk expression and stool collection for global metabolomics analysis. In preparation for milk collection, dams were separated from their pups for 3 hours. They were then anesthetized by inhaling 4-5% of isoflurane for induction, and then 1-2% of isoflurane for maintenance with indirect heat from lamps for supplemental warmth and administered intraperitoneally 0.05 mg/kg of oxytocin to stimulate letdown. Milk was subsequently collected from 2-4 teats using an adapted murine breast pump device built from a human breast pump using protocol previously published with modifications [20]. BM was collected on postpartum day10±3, total volume expressed from 2 days were pooled to meet the minimum volume requirements for metabolomic profiling (Metabolon Inc. Morrisville, NC). BM samples collected from maternal water-fed dams were named as BM_Water, n=5; BM samples collected from maternal probiotic-fed dams were named as BM_LRM, n=8.
Colon/rectum containing stool contents of cross-fostered Thy1.1 pups were collected on day of life 7 (d7) after mice were euthanized by inhalant anesthetic overdosage (5% isoflurane) and vital organ removal. Collected samples were immediately stored at -80oC for further metabolomic analysis. Both male and female newborn mice were included from at least two dams in each group. To meet the minimum weight requirements for stool metabolomic profiling, colon/rectum contents from two pups in the same study group were pooled into a single sample. Stool samples collected from Thy1.1 pups fostered by Th1.2 dams that received water during pregnancy were named as D7Thy1.1-CM, n=6 (from 12 pups); from Thy1.1 pups fostered by Th1.2 dams that received probiotic DSM 17938 during pregnancy were named as D7Thy1.1-LRM, n=8 (from 16 pups).
Sample size estimation and statistical analysis. To determine the appropriate sample size for untargeted global metabolomics profiling of mouse BM and stool samples via the Metabolon Global Discovery Panel, a high-dimensional power analysis was performed. Based on empirical benchmarks for tightly controlled inbred mouse models and alignment with Metabolon’s experimental design guidelines, a sample size of n= 5-8 mice per experimental group was selected. This cohort size is optimized to achieve a statistical power of 80% to detect a minimum effect size of ≥ 1.3-fold change (FC) in highly variable metabolite features. Multiple testing was accounted for by controlling the False Discovery Rate (FDR) at < 0.05 using the Benjamini-Hochberg correction (www.metabolon.com/study-design/chapter-3-building-your-metabolomic-study) [21].
Two types of statistical analysis were performed for identified biochemicals: (1) significance tests and (2) classification analysis. Standard statistical analyses are performed in ArrayStudio/Jupyter Notebook on log transformed data. For those analyses not standard in ArrayStudio/Jupyter Notebook, the programs R (http://cran.r-project.org/) or JMP were used. Principal component analysis (PCA) and p value and q value were calculated. Following imputation of missing values, with the minimum observed value for each compound, and log transformation, Welch’s two-sample t-tests were used to identify biochemicals that differed significantly between experimental groups. The numbers of biochemicals that achieved statistical significance (p ≤ 0.05), as well as those approaching significance (0.05 < p < 0.10) were included for analysis (www.metabolon.com/study-design/chapter-6-metabolomics-study-analysis-interpretation-insights), further graphs performed by using GraphPad Prism version 11.0,0 (GraphPad Software, San Diego, CA).
Correlation networks analysis. Biochemicals with p < 0.10 in both milk (from Thy1.2 dam fed with probiotic, LRM vs. fed with water , Water) and stool (from Thy1.1 pups nursed by LRM-dam vs. Thy1.1 pups nursed by Water-dam) were selected for creating correlation networks within milk or stool respectively. The performance (p-values and log2 FCs) of these biochemicals in milk and in stool were summarized and plotted using MATLAB. The selected biochemicals’ pathway designations and biological functions include six subgroups, i.e. amino acid and dipeptide, Fatty acid and diacylglycerol, co-factor and vitamin, lysophospholipid, purine/pyrimidine metabolite, and unassigned that were specifically analyzed. For each compartment, R function cor produced Spearman’s Rho and corresponding p-values within each pair of biochemicals in the selected group. The resulted two square matrices of correlation (one for milk and one for stool) were visualized using MORPHEUS from the Broad institute, with each row annotated with metabolic pathway membership and subgroup designations. We further selected two subgroups, i.e. purine/pyrimidine metabolite as well as the combined co-factor, vitamin and unassigned, to observe the rewiring of correlation networks between milk and stool. For each of the two subgroups, two undirected graphs (one for milk and one for stool) were created using Spearman’s Rho with two-tailed p-value < 0.05 (ρ2 > 0.3136 for milk, and ρ2 > 0.2916 for stool), and the graphs were visualized using Cytoscape [18,22].
3. Results
3.1. Probiotic Supplementation Led to Changes in Breast Milk Metabolic Profiles
The BM dataset comprises a total of 911 biochemicals, 835 compounds of named biochemicals and 76 compounds of unnamed biochemicals.
Compared the group of BM from probiotic-fed dams to water-fed dams, we found total 91 biochemicals of changes with p ≤ 0.05 including 9 upregulated and 82 down-regulated; we found total 68 biochemicals with p values between 0.05 and 0.10 (Table 1). In addition to identifying metabolites with significant p-values, we evaluated the FC and checked for significant outliers within each biochemical class. This approach prevents outliers from skewing the statistical significance, ensuring we do not overlook physiologically important metabolites for future validation. To identify altered BM metabolites, we applied a FC threshold of ≥ 1.3 (up-regulated) or ≤ 0.5 (down-regulated) alongside a significance threshold of p ≤ 0.05, or a trend toward significance defined as p < 0.10. Based on these criteria, our analysis focused on 21 up-regulated and 34 down-regulated metabolites. The volcano plot in Figure 2 shows metabolites that are up-regulated or down-regulated in the BM of mice following oral administration of the probiotic DSM 17938 during pregnancy.
Upregulated metabolites by probiotic DSM 17938 in BM are involved in several major biological pathways including immune and metabolic regulations, while downregulated metabolites were involved in lipid metabolism including diacylglycerols, monoacylglycerols and lysophospholipids.
3.1.1. Glycolytic Intermediates Such as Phosphoenolpyruvate (PEP) and Upstream Metabolites
3.1.2. Purine Nucleosides
Upregulated purine nucleosides in BM by oral administration of DSM 17938 include inosine and guanosine and 5-Aminoimidazole-4-(N-succinylcarboxamide) ribonucleotide (also known as phosphoribosylaminoimidazolesuccinocarboxamide, SAICAR) which is a critical metabolic intermediate in the de novo purine nucleotide biosynthesis pathway [23] (Figure 2 and Figure 4).
3.1.3. Other Beneficial Metabolites
3.2. Pups Nursed by Probiotic-Fed Dams Demonstrated Different Stool Metabolic Profiles Compared to Pups Nursed by Water-Fed Dams
The present feces dataset comprises a total of 1,726 biochemicals, 1,423 compounds of named biochemicals and 303 compounds of unknown biochemicals. Compared the group of stools of cross-fostered pups that were nursed by probiotic-fed dams (D7Thy1.1-LRM) to pups nursed by water-fed dams (D7Thy1.1-CM), we found total 471 biochemicals of changes with p ≤ 0.05 including 272 upregulated and 199 down-regulated; we found total 165 biochemicals with p values between 0.05 and 0.10 (Table 2).
After applying FC cut off at ≥ 2 (upregulated) and ≤ 0.5 (downregulated), there were a total of 95 statistically significant upregulated and 34 statistically significant downregulated stool metabolites. Volcano plot in Figure 6 shows metabolites up or down regulated in feces of pups affected by probiotic-fed dams.
3.2.1. Polyamines
3.2.2. Purine Nucleosides and Metabolites in Purine Metabolism Pathways
Stool inosine increased approximately 10-fold, which is significantly increased in pups nursed by probiotic-fed dams compared to those nursed by water-fed control dams (p=0.0043); alongside other metabolites involved in purine metabolism, whereas the FC of urate was less than 0.5, indicating downregulation (Figure 8). The alterations in key purine metabolites observed in stool paralleled those found in BM, as shown in the purine metabolism pathway in Figure 4.
3.2.3. Products of Glycolysis, Cofactors and Vitamins
Stool glycolytic product pyruvate was upregulated while glucose 6-phosphate was downregulated (Figure 9 left panel). As shown in Figure 3 glycolysis pathway, changes in stool mirrored those in BM. We also observed that several cofactors and vitamins were upregulated with increased FCs (Figure 9 right panel) in the stool of pups nursed by probiotic-fed dams compared to water-fed dams.
3.2.4. Fatty Acid Esters of Hydroxy Fatty Acids (FAHFA)
3.3. Dam BM and Fostered Newborn Stool Exhibited Distinct Metabolic Network Rewiring Profiles
We observed that there are 48 metabolites altered in both BM and newborn stool after maternal probiotic treatment. The summarized direction and magnitude of metabolite changes in Figure 11A indicates that concordant changes dominate with a substantial number of metabolites that decrease in BM also decrease in dam-forstered newborn stool samples, suggesting some transfer of the milk signal into the gut. However, there are also metabolites that diverge after entering the gut that include 18 metabolites down-regulated in BM, but upregulated in newborn stools (Figure 11A-the contigency table).
Metabolic network rewiring analysis of selected metabolites (Figure 11B) revealed distinct structural and functional differences between the stool and milk metabolomes, highlighting the following five aspects: (i) Network Density: The stool network was substantially denser than the milk network, featuring a higher number of significant correlations and tightly coordinated metabolic interactions within the intestinal environment. (ii) Emergence of Key Hubs: Several metabolites transitioned from isolated or minor nodes in milk to major hubs in stool. Notably, argininate formed one of the largest, most connected nodes, indicating a central role in gut amino acid metabolism. Similarly, urea and urate shifted from isolated positions in milk to major hubs in stool, reflecting extensive microbial nitrogen processing and enhanced purine turnover coordination. (ii) Purine Restructuring: Purine metabolism underwent strong restructuring in stool; the highly connected metabolites guanosine and inosine were strongly up-regulated, whereas urate was strongly down-regulated. (iv) Correlation Shift: Stool networks exhibited a simultaneous increase in both positive and negative correlations. (v) Heme Degradation: Biliverdin shifted from being disconnected in milk to more highly connected in stool, suggesting increased interaction between heme degradation pathways and host-microbial metabolism in the gut.
4. Discussion
It is known that maternal probiotic consumption can alter BM microbes and human milk oligosaccharide (HMO) composition [24,25]. But in addition, the current study demonstrates that oral administration of the probiotic L. reuteri DSM 17938 during pregnancy alters the metabolic profile of BM. During lactation, these beneficial milk metabolites significantly impact cross-fostered newborn mice, shaping their gut metabolic profiles which would be predicted to support early GI and overall systemic health.
Probiotic supplementation led to a significant upregulation of the glycolysis sub-pathway. This was evidenced by elevated BM levels of phosphoenolpyruvate (PEP) and several upstream metabolites, including glucose-1,6-diphosphate, 3-phosphoglycerate, and 2-phosphoglycerate, alongside increased stool levels of the glycolytic end-product, pyruvate. These shifts suggest an overall enhancement of glycolytic activity. The upregulation of BM PEP may carry profound biological implications, as emerging evidence demonstrates its role in mitigating autoimmunity, enhancing antiviral immunity, and decreasing age-related neuroinflammation. For instance, in EAE, a murine model of multiple sclerosis, PEP supplementation elevated intracellular PEP concentrations in Th17 cells. This subsequently reduced clinical symptoms and autoimmunity by inhibiting Th17 differentiation and IL-17A expression. Furthermore, PEP has been shown to suppress cytokine production by both Th17 and Th2 cells [26]. PEP also exhibits robust antiviral properties. In mice infected with vesicular stomatitis virus (VSV), PEP treatment restricted viral replication and decreased the expression of downstream pro-inflammatory cytokines (including IL-6, TNF-α, TNF-β, and IFN-α) by promoting apoptosis-associated tyrosine kinase (AATK) expression. Notably, PEP treatment dramatically reduced mortality demonstrating 90% of treated mice survived beyond 5 days post-infection, compared to only 20% in the untreated control group [27]. More recently, PEP was identified as a protective factor against age-related chronic systemic inflammation and neuroinflammation [28]. These data highlight the multifaceted biological functions of PEP beyond traditional glycolysis; it is highly plausible that the observed increase in BM PEP may positively influence infant immune and cognitive development.
We observed a trend toward increased BM levels of several purine metabolism products by probiotic supplementation, including SAICAR and the purine nucleosides guanosine and inosine. Notably, a parallel regulatory pattern was observed in neonatal pup stools; pups nursed by probiotic-fed dams exhibited an upregulation of guanosine and other nucleosides, including a marked increase in fecal inosine, compared to pups of water-fed dams. This enrichment aligns with a unique feature identified in the probiotic DSM 17938 that its ability to generate adenosine and inosine via probiotic-derived 5′-ectonucleotidase (5′-NT), an enzyme capable of converting ATP and AMP to adenosine [12]. While adenosine is biologically unstable with a half-life of less than 10 seconds, inosine serves as its biostable derivative and remains detectable for up to 15 hours [10]. In our previous study utilizing Treg-deficient scurfy mice, DSM 17938 exerted major therapeutic effects through the adenosine/inosine–adenosine receptor 2A axis, effectively inhibiting Th1 and Th2 development [9,10]. Furthermore, oral administration of inosine to these Treg-deficient mice reduced disease severity and prolonged survival [9,10]. Oral administration of DSM 17938 to healthy newborn mice similarly elevated plasma inosine levels approximately 1.5-fold compared to water-fed controls [7]. Taken together, adenosine and inosine exert broad anti-inflammatory effects by upregulating Treg functions and suppressing Th1 and Th17 subsets. Metabolically, inosine is known to induce the browning of white adipose tissue while promoting mitogenesis, thermogenic regulation, and energy expenditure in brown adipose tissue [29]. Inosine also interacts with surface receptors on neurons and glia to exert robust neuroprotective effects [30]. In mice subjected to chronic unpredictable stress, oral administration of inosine decreased total immobility time (a behavioral marker correlating with depression-like behavior), consistent with its role as a neuromodulator [30,31]. Furthermore, in vitro studies demonstrate a dose-dependent effect of inosine on enhancing neurite outgrowth and cell viability in neocortical neurons [30,32].
Given that DSM 17938 directly generates inosine, the substantial increase in pup stool levels is striking but anticipated. We hypothesize that maternal supplementation with DSM 17938 promotes inosine generation in BM through the entero-mammary axis. As the pups ingest this milk, which contains both pre-formed inosine and translocated DSM 17938 bacteria, inosine production is further amplified within the infant gut, culminating in the remarkable increase observed in fecal inosine.
In analyzing neonatal stool samples, we noted a pronounced increase in two key polyamines, spermine (with the FC increase of 15.8, p=0.00001) and spermidine (FC 10.2, p=0.0006). These metabolites are linked to a wide range of physiologic processes at widely varying levels [33]. Polyamines are found in all living organisms, generated from L-ornithine and decarboxylation of amino acids. Total body polyamines are derived primarily from dietary sources and to a lesser extent from de novo biosynthesis. The intestinal microbiome also plays a crucial role in maintaining local and systemic polyamine levels, with several bacteria genera, including Lactobacillus, Bifidobacterium, and Enterococcus, that are known to synthesize polyamines from dietary and host-derived amino acids [34]. Polyamines participate in nucleic acid synthesis and maintenance, transcription, translation, and cell signaling [35]. Within the gut, spermidine and spermine support intestinal epithelial cell proliferation and mucosal barrier function. These metabolites also exert broad anti-inflammatory effects by promoting polarization of macrophages (MΦ) towards M2, which are involved in anti-inflammation and tissue repair, and away from proinflammatory M1 [36].
At postnatal d7, spermine and spermidine act as vital chemical triggers that accelerate the structural and functional maturation of the newborn small intestine, directly optimizing its capacity to absorb nutrients. These polyamines expand the gut’s digestive surface area by stimulating villus elongation and crypt deepening, while simultaneously upregulating critical brush-border enzymes like lactase and alkaline phosphatase for efficient macromolecule breakdown. Furthermore, they reinforce cell tight junctions to transition the neonatal gut from an immature, highly permeable “leaky” state into a secure barrier. By also promoting a healthy Bifidobacterium-rich microbiome, spermine and spermidine establish a self-sustaining metabolic environment crucial for systemic infant growth.
Collectively, the elevated levels of spermine and spermidine in neonatal stool suggest greater polyamine availability within the gut of pups nursed by probiotic-fed dams. This is highly promising, given the multitude of systemic benefits associated with total body polyamine pools. Furthermore, the absence of significant polyamine changes in BM suggests that the surge in neonatal stool polyamines is driven by de novo host biosynthesis and intestinal microbiome production, rather than by direct dietary intake.
Fatty acid esters of hydroxy fatty acids (FAHFAs), specifically LAHSA, OAHSA and PAHSA, are lipid-bound lipids which have beneficial effects in neonates. They generally act as potent, localized anti-inflammatory molecules, supporting gut barrier integrity, and keeping hyperactive immune cells (such as MΦs) in check to prevent unnecessary systemic tissue stress [37,38]. These metabolites were significantly downregulated in pups nursed by probiotic-fed dams compared to the water-fed control group, which suggests that maternal probiotic intervention significantly reprograms the infant lipidomic profile, potentially allowing accelerated intestinal absorption or microbial utilization of these functional fatty acid esters. Exposure to probiotic-modified maternal milk profoundly reshaped the neonatal purine metabolome, resulting in a striking 10-fold surge in fecal inosine levels. This substantial metabolic/microbial shift toward active purine processing and polyamine production is likely to alter the baseline availability of bacterial enzymes and fatty acid substrates [39]. Such metabolic redirection consequently impacts the downstream synthesis and degradation of FAHFAs [39,40].
Metabolic network profiling of 48 altered metabolites in both BM and neonatal stools reveals that maternal probiotic treatment modified BM composition, inducing a coordinated metabolic shift in the neonatal gut. This shift is characterized by changed purine turnover (inosine, guanosine, urate), enhanced cofactor/redox metabolism (FMN), and remodeled nitrogen metabolism (urea, arginine). Ultimately, the denser stool correlation networks suggest that these pathways are functionally integrated within the intestinal ecosystem through host-microbe metabolic interactions. Therefore, future studies should characterize the functional microbiome changes in both BM and neonatal stools over longer interventions to fully map this host-microbe metabolic integration.
This study is subject to several analytical and methodological limitations. (i) While global metabolomics provides relative levels, based on peak intensities, absolute concentrations should be measured in future studies to validate these metabolic changes. (ii) Because a two-group comparison at a single time point offers only a static snapshot, it misses the dynamic metabolic flux, reaction rates, and kinetic shifts that may truly differentiate the groups. Consequently, future longitudinal studies are required to capture these temporal dynamics. (iii) The network only shows correlations, not causality. To establish causality, future studies should actively manipulate this system using targeted experimental interventions (such as exogenous supplementation or pharmacological inhibition), genetic tools (such as CRISPR knockouts), and stable isotope tracing to track directional metabolic flux.
5. Conclusions
Prenatal administration of DSM 17938 alters BM composition, upregulating biochemical pathways involved in immune regulation, neurodevelopment, and metabolic function. These protective shifts are reflected downstream in the fecal metabolome of cross-fostered pups, ultimately supporting early neonatal development and overall gut health. Key metabolite changes in BM and pup stool are worthy of further investigation including phosphoenolpyruvate, inosine, spermine/spermidine, and hydroxy fatty acids.
Author Contributions
Conceptualization, Y.L.; methodology, N.K.H., S.G., M.N.M.; formal analysis, N.K.H., S.G., Z.Y., Y.L.; investigation, N.K.H., S.G., Y.L.; data curation, Z.Y.; writing—original draft preparation, N.K.H.; writing—review and editing, Z.Y., J.M.R., Y.L.; visualization, N.K.H., Z.Y.; supervision, Y.L.; funding acquisition, J.M.R., Y.L. All authors have read and agreed to the published version of the manuscript.
Funding
This research was funded by NIH/National Institute of Allergy and Infectious Diseases (NIAID), R21AI182934 (to Y.L.); and in part by NIH/National Institute of Diabetes and Digestive and Kidney Diseases (NIDDK), P30DK056338 of the Texas Medical Center Digestive Diseases Center (to J.M.R.)
Institutional Review Board Statement
The animal study protocol was approved by the Institutional Animal Care and Use Committee (IACUC) of UTHealth Houston (protocol number: AWC-23-0118, date of approval: January 30, 2024).
Informed Consent Statement
Not applicable
Data Availability Statement
The original contributions presented in the study are included in the article. Further inquiries can be directed at the corresponding author.
Acknowledgments
We thank Brenna Servantes from the Division of Neonatal-Perinatal Medicine, Department of Pediatrics, McGovern Medical School at UTHealth Houston for her assistance with the initial collection of mouse breast milk.
Conflicts of Interest
The authors declare no conflict of interest.
References
- Yi, D. Y.; Kim, S. Y. Human Breast Milk Composition and Function in Human Health: From Nutritional Components to Microbiome and MicroRNAs. Nutrients 2021, 13(9), 3094. [Google Scholar] [CrossRef] [PubMed]
- Zimmermann, P.; Curtis, N. Breast milk microbiota: A review of the factors that influence composition. J. Infect. 2020, 81(1), 17–47. [Google Scholar] [CrossRef] [PubMed]
- Rodriguez, J. M. The origin of human milk bacteria: is there a bacterial entero-mammary pathway during late pregnancy and lactation? Adv. Nutr. 2014, 5(6), 779–784. [Google Scholar] [CrossRef] [PubMed]
- Rosander, A.; Connolly, E.; Roos, S. Removal of antibiotic resistance gene-carrying plasmids from Lactobacillus reuteri ATCC 55730 and characterization of the resulting daughter strain, L. reuteri DSM 17938. Appl. Environ. Microbiol. 2008, 74(19), 6032–6040. [Google Scholar] [CrossRef] [PubMed]
- Liu, Y.; Hoang, T. K.; Taylor, C. M.; Park, E. S.; Freeborn, J.; Luo, M.; Roos, S.; Rhoads, J. M. Limosilactobacillus reuteri and Lacticaseibacillus rhamnosus GG differentially affect gut microbes and metabolites in mice with Treg deficiency. Am. J. Physiol. Gastrointest. Liver Physiol. 2021, 320(6), G969–G981. [Google Scholar] [CrossRef] [PubMed]
- Liu, Y.; Tian, X.; Daniel, R. C.; Okeugo, B.; Armbrister, S. A.; Luo, M.; Taylor, C. M.; Wu, G.; Rhoads, J. M. Impact of probiotic Limosilactobacillus reuteri DSM 17938 on amino acid metabolism in the healthy newborn mouse. Amino Acids 2022, 54(10), 1383–1401. [Google Scholar] [CrossRef] [PubMed]
- Liu, Y.; Tian, X.; He, B.; Hoang, T. K.; Taylor, C. M.; Blanchard, E.; Freeborn, J.; Park, S.; Luo, M.; Couturier, J.; et al. Lactobacillus reuteri DSM 17938 feeding of healthy newborn mice regulates immune responses while modulating gut microbiota and boosting beneficial metabolites. Am. J. Physiol. Gastrointest. Liver Physiol. 2019, 317(6), G824–G838. [Google Scholar] [CrossRef] [PubMed]
- He, B.; Hoang, T. K.; Tian, X.; Taylor, C. M.; Blanchard, E.; Luo, M.; Bhattacharjee, M. B.; Freeborn, J.; Park, S.; Couturier, J.; et al. Lactobacillus reuteri Reduces the Severity of Experimental Autoimmune Encephalomyelitis in Mice by Modulating Gut Microbiota. Front Immunol. 2019, 10, 385. [Google Scholar] [CrossRef] [PubMed]
- He, B.; Hoang, T. K.; Tran, D. Q.; Rhoads, J. M.; Liu, Y. Adenosine A2A Receptor Deletion Blocks the Beneficial Effects of Lactobacillus reuteri in Regulatory T-Deficient Scurfy Mice. Front Immunol. 2017, 8, 1680. [Google Scholar] [CrossRef] [PubMed]
- He, B.; Hoang, T. K.; Wang, T.; Ferris, M.; Taylor, C. M.; Tian, X.; Luo, M.; Tran, D. Q.; Zhou, J.; Tatevian, N.; et al. Resetting microbiota by Lactobacillus reuteri inhibits T reg deficiency-induced autoimmunity via adenosine A2A receptors. J. Exp. Med. 2017, 214(1), 107–123. [Google Scholar] [CrossRef] [PubMed]
- Hoang, T. K.; He, B.; Wang, T.; Tran, D. Q.; Rhoads, J. M.; Liu, Y. Protective effect of Lactobacillus reuteri DSM 17938 against experimental necrotizing enterocolitis is mediated by Toll-like receptor 2. Am. J. Physiol. Gastrointest. Liver Physiol. 2018, 315(2), G231–G240. [Google Scholar] [CrossRef] [PubMed]
- Liu, Y.; Armbrister, S. A.; Okeugo, B.; Mills, T. W.; Daniel, R. C.; Oh, J. H.; van Pijkeren, J. P.; Park, E. S.; Saleh, Z. M.; Lahiri, S.; et al. Probiotic-Derived Ecto-5’-Nucleotidase Produces Anti-Inflammatory Adenosine Metabolites in Treg-Deficient Scurfy Mice. Probiotics Antimicrob. Proteins 2023, 15(4), 1001–1013. [Google Scholar] [CrossRef] [PubMed]
- Liu, Y.; Fatheree, N. Y.; Dingle, B. M.; Tran, D. Q.; Rhoads, J. M. Lactobacillus reuteri DSM 17938 changes the frequency of Foxp3+ regulatory T cells in the intestine and mesenteric lymph node in experimental necrotizing enterocolitis. PLoS ONE 2013, 8(2), e56547. [Google Scholar] [CrossRef] [PubMed]
- Liu, Y.; Fatheree, N. Y.; Mangalat, N.; Rhoads, J. M. Lactobacillus reuteri strains reduce incidence and severity of experimental necrotizing enterocolitis via modulation of TLR4 and NF-kappaB signaling in the intestine. Am. J. Physiol. Gastrointest. Liver Physiol. 2012, 302(6), G608–617. [Google Scholar] [CrossRef] [PubMed]
- Liu, Y.; Tran, D. Q.; Fatheree, N. Y.; Marc Rhoads, J. Lactobacillus reuteri DSM 17938 differentially modulates effector memory T cells and Foxp3+ regulatory T cells in a mouse model of necrotizing enterocolitis. Am. J. Physiol. Gastrointest. Liver Physiol. 2014, 307(2), G177–186. [Google Scholar] [CrossRef] [PubMed]
- Daniel, R. C.; Okeugo, B.; Armbrister, S. A.; Saleh, Z. M.; Wang, J.; Luo, M.; Taylor, C. M.; Lundberg, L. E.; Giorgberidze, S.; Yin, Z.; et al. Limosilactobacillus reuteri Strains Differentially Stimulate Immunity in Response to Human Milk Oligosaccharides in Newborn Mice. Probiotics Antimicrob. Proteins 2025. [Google Scholar] [CrossRef] [PubMed]
- Daft, J. G.; Ptacek, T.; Kumar, R.; Morrow, C.; Lorenz, R. G. Cross-fostering immediately after birth induces a permanent microbiota shift that is shaped by the nursing mother. Microbiome 2015, 3, 17. [Google Scholar] [CrossRef] [PubMed]
- Fadhel Alvarez, A.; Yin, Z.; Okeugo, B.; Banerjee, A.; Luo, M.; Taylor, C. M.; Giorgberidze, S.; Harne, V.; Majji, R.; Munroe, M. N.; et al. Limosilactobacillus reuteri alleviates proinflammatory T-cell-mediated liver injury and transcriptomic changes in immunocompromised mice. Front Immunol. 2026, 17, 1713120. [Google Scholar] [CrossRef] [PubMed]
- Saleh, Z. M.; Okeugo, B.; Venna, V. R.; Blixt, F. W.; Quaicoe, V. A.; Park, E. S.; Giorgberidze, S.; Luo, M.; Taylor, C. M.; Rhoads, J. M.; et al. Limosilactobacillus reuteri ameliorates maternal separation stress in newborn mice and alters subsequent adult behaviour. Benef. Microbes 2024, 16(2), 221–235. [Google Scholar] [CrossRef] [PubMed]
- Meyer, C.; Alcorn, J. L. Protocol for expression of murine milk using modified human breast pump parts. STAR Protoc. 2023, 4(3), 102475. [Google Scholar] [CrossRef] [PubMed]
- Bragazzi, N. L.; Dobani, S.; Rinaldi de Alvarenga, J. F.; Mignogna, C.; Del Rio, D.; Mena, P. A priori sample size determination and power analysis in metabolic phenotyping and integrative metabolomics: an application framework based on a systematic review of literature. Metabolomics 2026, 22(4). [Google Scholar] [CrossRef] [PubMed]
- Su, G.; Morris, J. H.; Demchak, B.; Bader, G. D. Biological network exploration with Cytoscape 3. Curr. Protoc. Bioinform. 2014, 47, 8.13.11–24. [Google Scholar] [CrossRef] [PubMed]
- Souckova, O.; Skopova, V.; Baresova, V.; Sedlak, D.; Bleyer, A. J.; Kmoch, S.; Zikanova, M. Metabolites of De Novo Purine Synthesis: Metabolic Regulators and Cytotoxic Compounds. Metabolites 2022, 12(12), 1210. [Google Scholar] [CrossRef] [PubMed]
- Seppo, A. E.; Kukkonen, A. K.; Kuitunen, M.; Savilahti, E.; Yonemitsu, C.; Bode, L.; Järvinen, K. M. Association of Maternal Probiotic Supplementation With Human Milk Oligosaccharide Composition. JAMA Pediatr. 2019, 173(3), 286–288. [Google Scholar] [CrossRef] [PubMed]
- Moubareck, C. A. Human Milk Microbiota and Oligosaccharides: A Glimpse into Benefits, Diversity, and Correlations. Nutrients 2021, 13(4), 1123. [Google Scholar] [CrossRef] [PubMed]
- Huang, T. Y.; Hirota, M.; Sasaki, D.; Kalra, R. S.; Chien, H. C.; Tamai, M.; Sarkar, S.; Mi, Y.; Miyagi, M.; Seto, Y.; et al. Phosphoenolpyruvate regulates the Th17 transcriptional program and inhibits autoimmunity. Cell Rep. 2023, 42(3), 112205. [Google Scholar] [CrossRef] [PubMed]
- Zhao, L.; Song, R.; Liu, Y. Glycolytic metabolite phosphoenolpyruvate protects host from viral infection through promoting AATK expression. Eur. J. Immunol. 2023, 53(12), e2350536. [Google Scholar] [CrossRef] [PubMed]
- Song, Z.; Hu, H.; Zhang, W.; Zheng, X.; Liang, L.; Zhao, B.; Song, G.; Li, J.; Li, S.; Wen, Y.; et al. The glycolytic metabolite phosphoenolpyruvate restricts cGAS-driven inflammation to promote healthy aging. Nat. Aging 2026, 6(4), 831–848. [Google Scholar] [CrossRef] [PubMed]
- Pfeifer, A.; Mikhael, M.; Niemann, B. Inosine: novel activator of brown adipose tissue and energy homeostasis. Trends Cell Biol. 2024, 34(1), 72–82. [Google Scholar] [CrossRef] [PubMed]
- Muto, J.; Lee, H.; Lee, H.; Uwaya, A.; Park, J.; Nakajima, S.; Nagata, K.; Ohno, M.; Ohsawa, I.; Mikami, T. Oral administration of inosine produces antidepressant-like effects in mice. Sci. Rep. 2014, 4, 4199. [Google Scholar] [CrossRef] [PubMed]
- Liu, X.; Teng, T.; Li, X.; Fan, L.; Xiang, Y.; Jiang, Y.; Du, K.; Zhang, Y.; Zhou, X.; Xie, P. Impact of Inosine on Chronic Unpredictable Mild Stress-Induced Depressive and Anxiety-Like Behaviors With the Alteration of Gut Microbiota. In Frontiers in Cellular and Infection Microbiology 2021,; Original Research, 2021; Volume 11. [Google Scholar] [CrossRef] [PubMed]
- Benowitz, L. I.; Goldberg, D. E.; Irwin, N. Inosine stimulates axon growth in vitro and in the adult CNS. Prog. Brain Res. 2002, 137, 389–399. [Google Scholar] [CrossRef] [PubMed]
- Xuan, M.; Gu, X.; Li, J.; Huang, D.; Xue, C.; He, Y. Polyamines: their significance for maintaining health and contributing to diseases. Cell Commun. Signal 2023, 21(1), 348. [Google Scholar] [CrossRef] [PubMed]
- Mahalingam, S. S.; Pandiyan, P. Polyamines: Key Players in Immunometabolism and Immune Regulation. J. Cell Immunol. 2024, 6(5), 196–208. [Google Scholar] [CrossRef] [PubMed]
- Sagar, N. A.; Tarafdar, S.; Agarwal, S.; Tarafdar, A.; Sharma, S. Polyamines: Functions, Metabolism, and Role in Human Disease Management. Med. Sci. 2021, 9(2), 44. [Google Scholar] [CrossRef] [PubMed]
- Liu, R.; Li, X.; Ma, H.; Yang, Q.; Shang, Q.; Song, L.; Zheng, Z.; Zhang, S.; Pan, Y.; Huang, P.; et al. Spermidine endows macrophages anti-inflammatory properties by inducing mitochondrial superoxide-dependent AMPK activation, Hif-1α upregulation and autophagy. Free Radic. Biol. Med. 2020, 161, 339–350. [Google Scholar] [CrossRef] [PubMed]
- Bertran, L.; Rusu, E. C.; Aguilar, C.; Auguet, T.; Richart, C. Exploring the role of fatty acid esters of hydroxy fatty acids in metabolic dysfunction-associated steatotic liver disease in morbidly obese women. Dig. Liver Dis. 2025, 57(2), 526–534. [Google Scholar] [CrossRef] [PubMed]
- Yu, X.; Li, Y.; Cong, F.; Huang, B.; Liu, X.; Nguyen, G. K. T.; Wu, Y.; Han, D.; Wang, J. 12-PAHSA alleviated intestinal inflammation and barrier damage by promoting M2 macrophage polarization. J. Funct. Foods 2026, 142, 107328. [Google Scholar] [CrossRef]
- Vatanen, T.; Jabbar, K. S.; Ruohtula, T.; Honkanen, J.; Avila-Pacheco, J.; Siljander, H.; Stražar, M.; Oikarinen, S.; Hyöty, H.; Ilonen, J.; et al. Mobile genetic elements from the maternal microbiome shape infant gut microbial assembly and metabolism. Cell 2022, 185(26), 4921–4936.e4915. [Google Scholar] [CrossRef] [PubMed]
- Nelson, A. B.; Chow, L. S.; Stagg, D. B.; Gillingham, J. R.; Evans, M. D.; Pan, M.; Hughey, C. C.; Myers, C. L.; Han, X.; Crawford, P. A.; et al. Acute aerobic exercise reveals that FAHFAs distinguish the metabolomes of overweight and normal-weight runners. JCI Insight 2022, 7(7), e158037. [Google Scholar] [CrossRef] [PubMed]
Figure 1.
Methodology and Study Design: Thy1.2 dams were fed either probiotic DSM 17938 or water during pregnancy. Newborn Thy1.1 mice were then cross-fostered to the Thy1.2 dams. Subsequently, BM from the lactating dams and colon/rectum samples (containing stool) from the pups were collected for analysis (Top panel). The specific procedure for BM collection is outlined in the bottom left panel, while the metabolic profiling workflow (for both milk and stool) is shown in the bottom right panel.
Figure 1.
Methodology and Study Design: Thy1.2 dams were fed either probiotic DSM 17938 or water during pregnancy. Newborn Thy1.1 mice were then cross-fostered to the Thy1.2 dams. Subsequently, BM from the lactating dams and colon/rectum samples (containing stool) from the pups were collected for analysis (Top panel). The specific procedure for BM collection is outlined in the bottom left panel, while the metabolic profiling workflow (for both milk and stool) is shown in the bottom right panel.
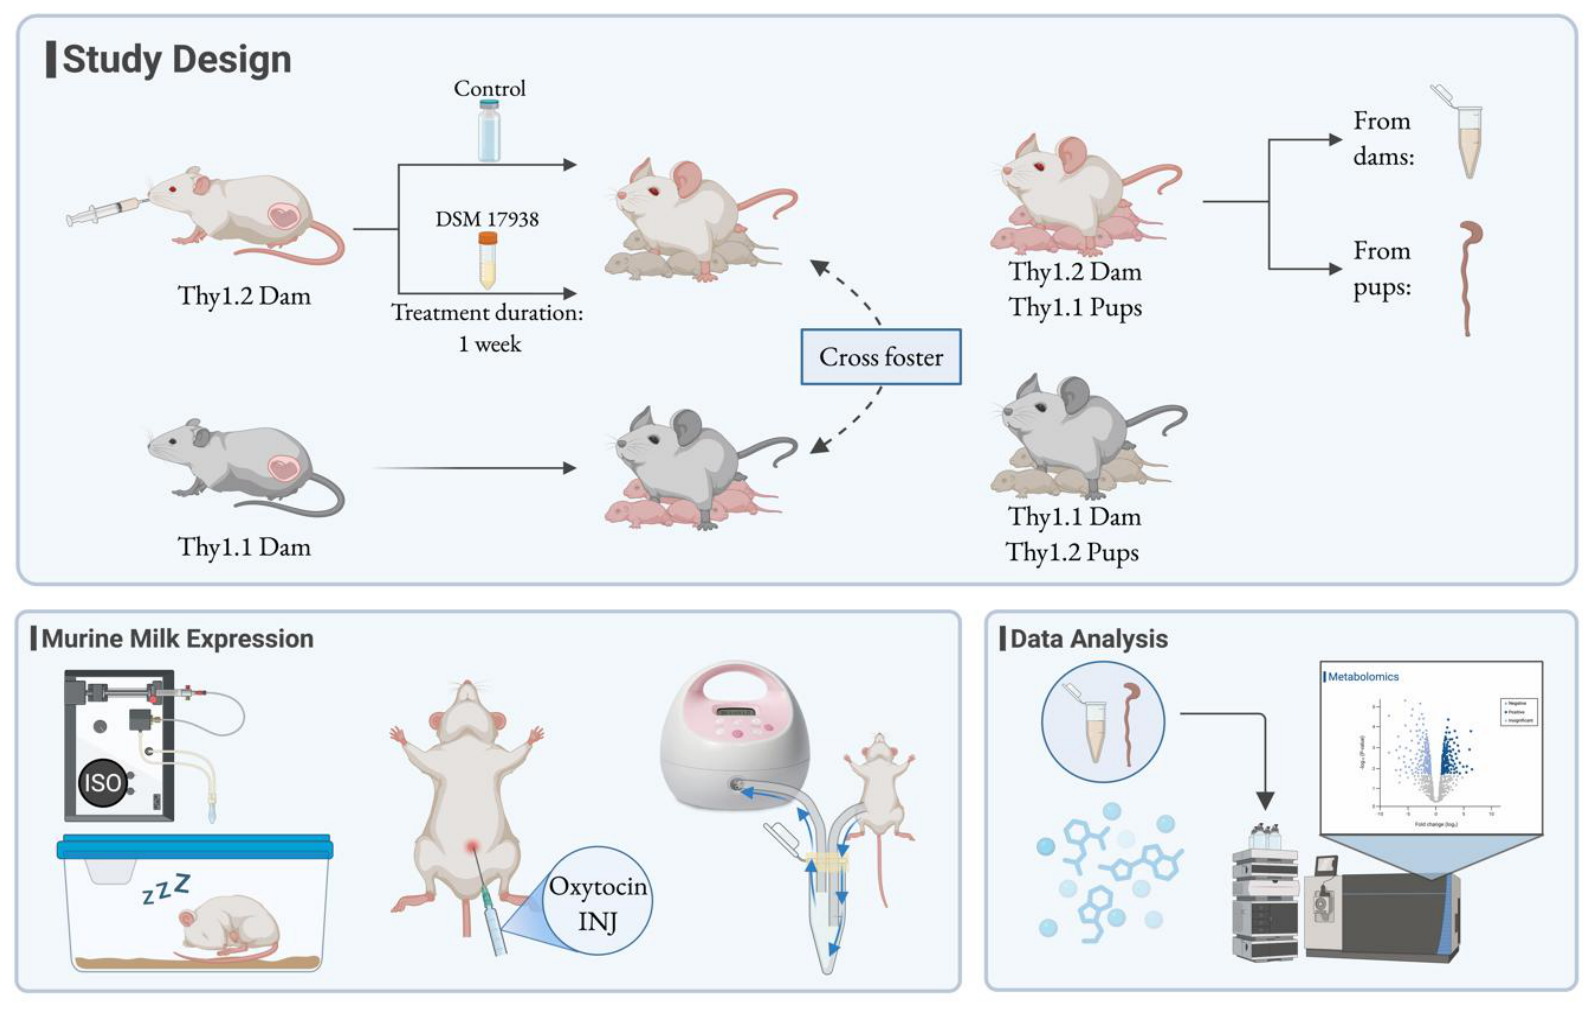
Figure 2.
Volcano plot of altered BM metabolites following maternal probiotic administration. The x-axis represents the Log2 fold change, and the y-axis represents the -log 10 (p-value), comparing BM from dams fed the probiotic (BM_LRM) with those fed with water (BM_Water). Each dot represents an identified metabolite. Red dots indicate significantly upregulated metabolites, while blue dots indicate significantly downregulated metabolites.
Figure 2.
Volcano plot of altered BM metabolites following maternal probiotic administration. The x-axis represents the Log2 fold change, and the y-axis represents the -log 10 (p-value), comparing BM from dams fed the probiotic (BM_LRM) with those fed with water (BM_Water). Each dot represents an identified metabolite. Red dots indicate significantly upregulated metabolites, while blue dots indicate significantly downregulated metabolites.
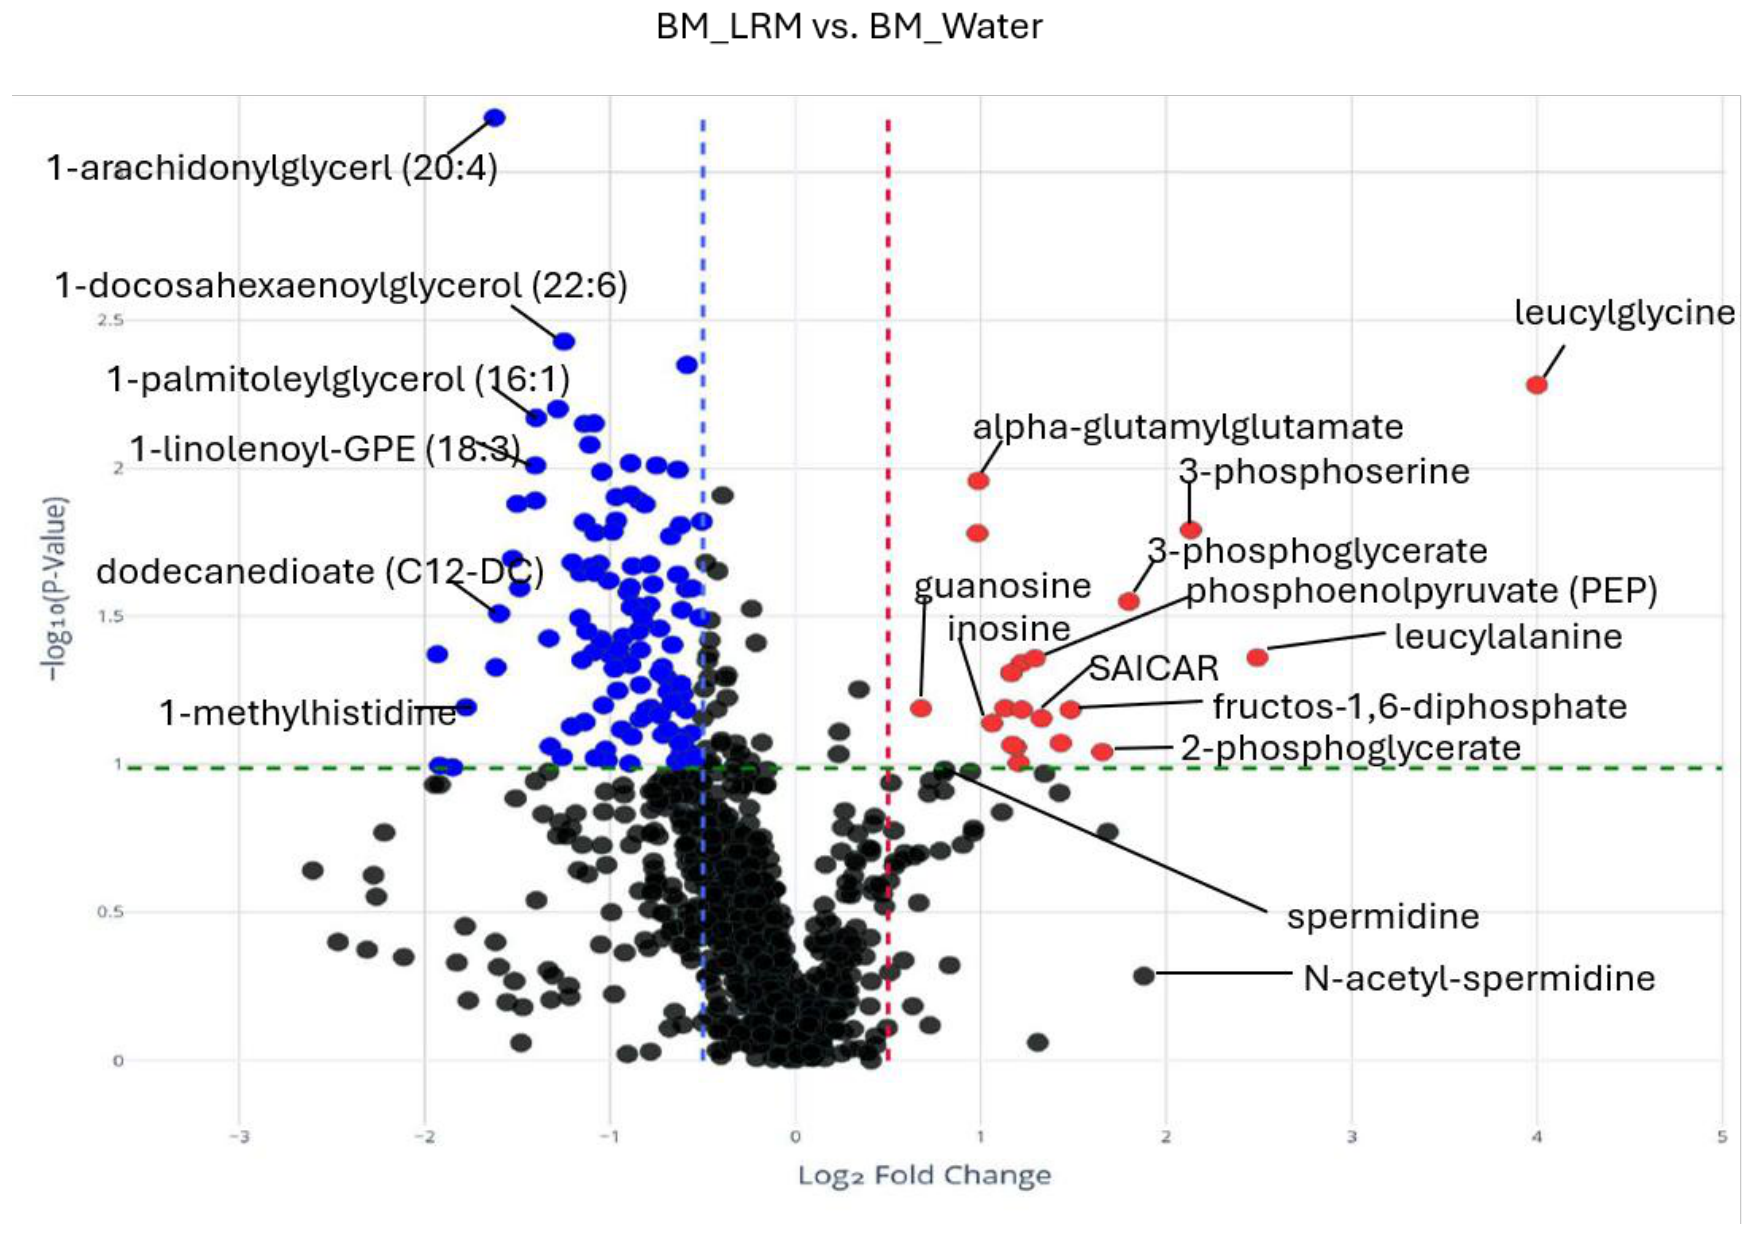
Figure 3.
Alterations in glycolytic metabolites within BM following maternal probiotic administration. Left Panel: Box plots illustrate increased abundance of key glycolytic intermediates including Fructose-1,6-bisphosphate, 3-Phosphoglycerate, 2-Phosphoglycerate, and Phosphoenolpyruvate (PEP) in BM from dams treated with the probiotic strain (BM_LRM, n=8) compared to treated with water (BM_Water, n=5), p values are indicated. Right Panel: Schematic mapping of the glycolysis pathway highlighting metabolic shifts. Green arrows indicate upregulation, while red arrows indicate downregulation. Icons denote the respective sample type where the change was observed, representing either BM (tube icon) or pup stool (stool icon).
Figure 3.
Alterations in glycolytic metabolites within BM following maternal probiotic administration. Left Panel: Box plots illustrate increased abundance of key glycolytic intermediates including Fructose-1,6-bisphosphate, 3-Phosphoglycerate, 2-Phosphoglycerate, and Phosphoenolpyruvate (PEP) in BM from dams treated with the probiotic strain (BM_LRM, n=8) compared to treated with water (BM_Water, n=5), p values are indicated. Right Panel: Schematic mapping of the glycolysis pathway highlighting metabolic shifts. Green arrows indicate upregulation, while red arrows indicate downregulation. Icons denote the respective sample type where the change was observed, representing either BM (tube icon) or pup stool (stool icon).
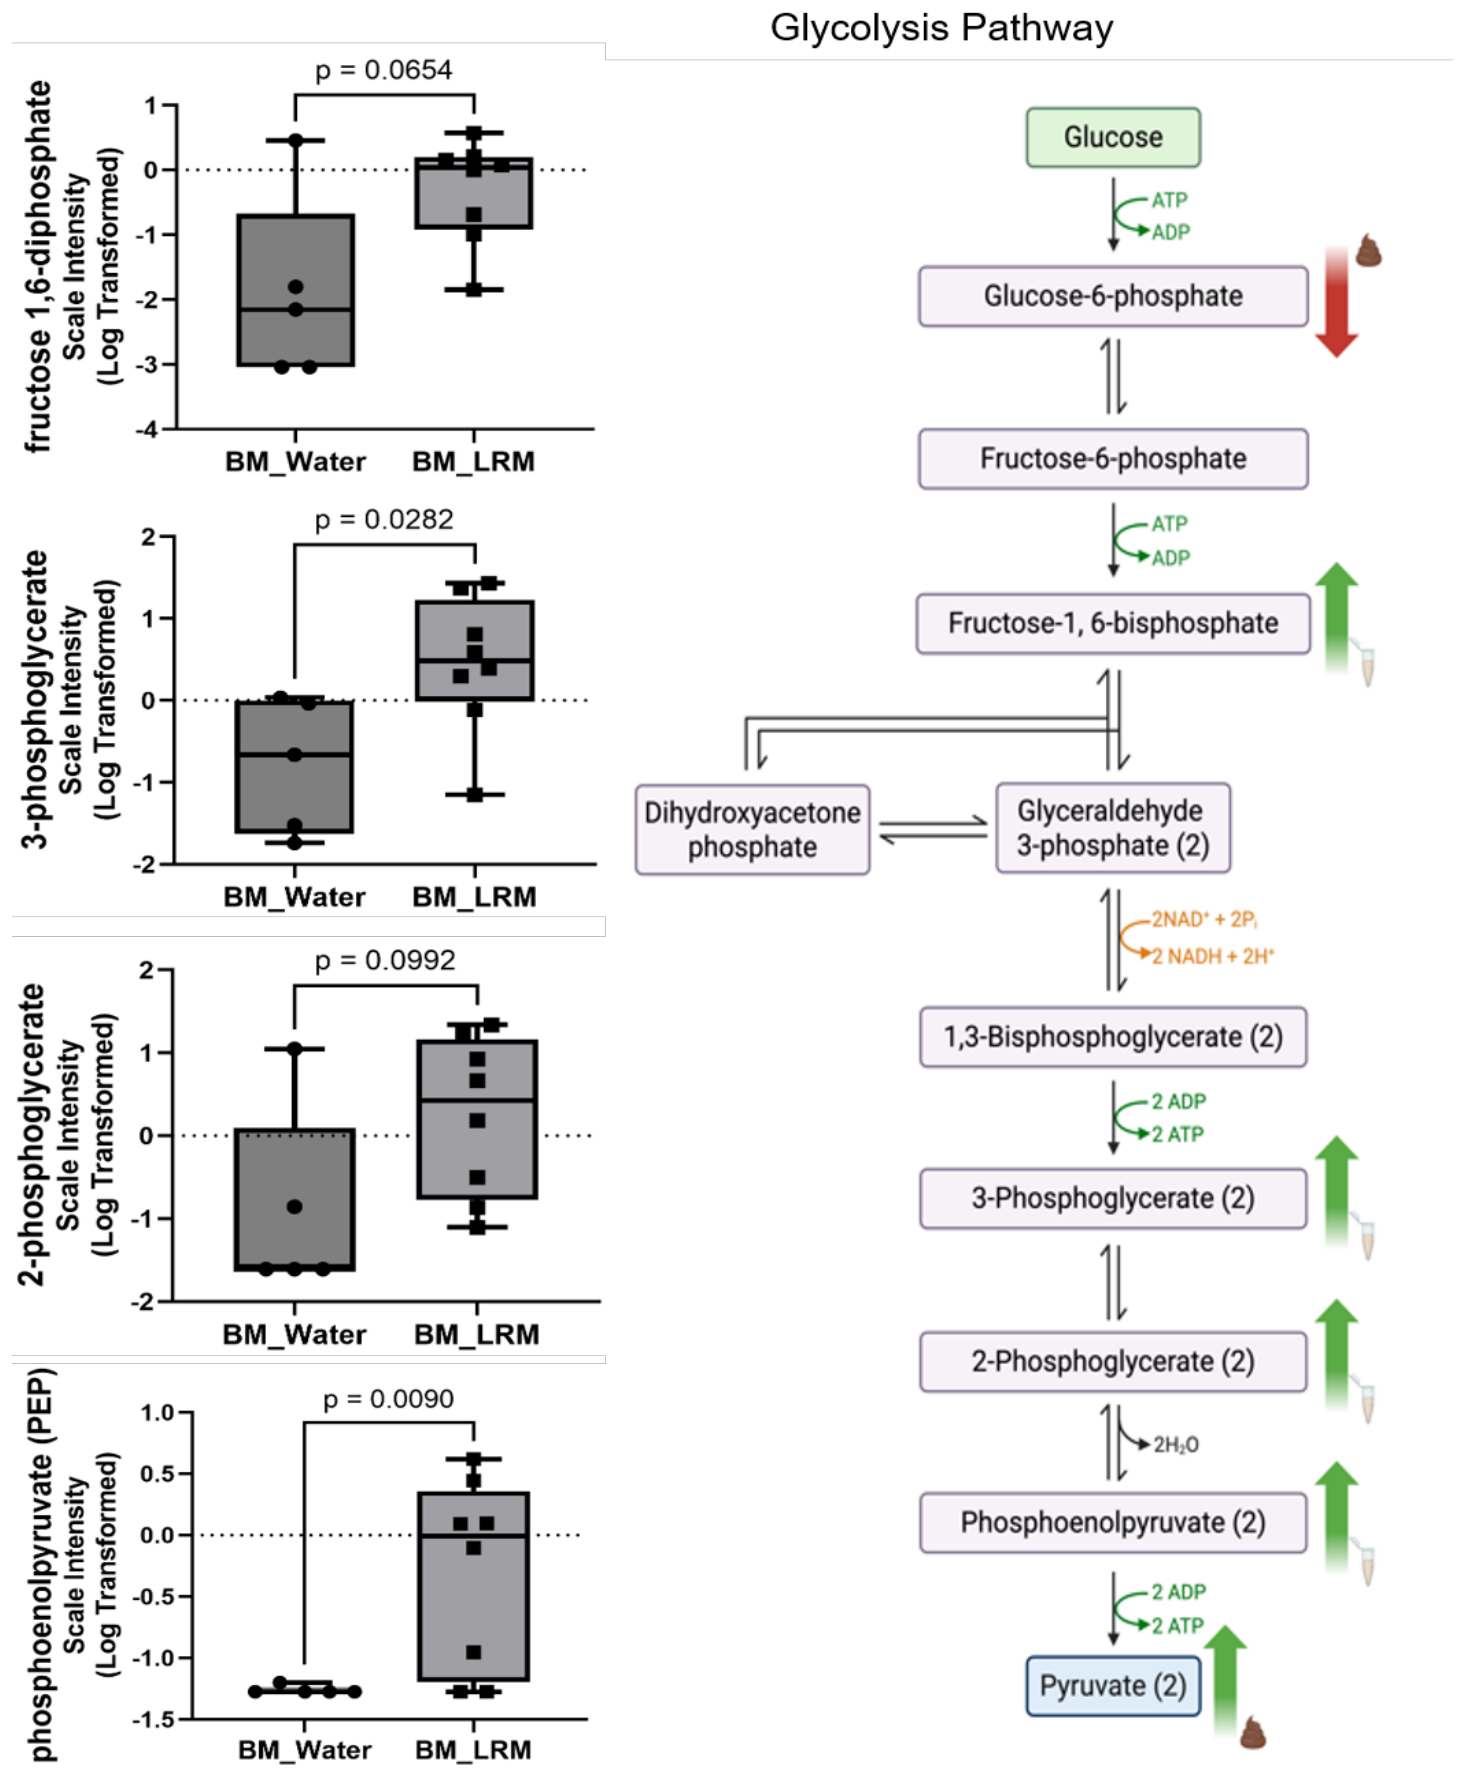
Figure 4.
Alterations in purine metabolites in BM following maternal probiotic administration. Left Panel: Box plots illustrate increased abundance of inosine, guanosine and SAICAR in BM from dams treated with the probiotic strain (BM_LRM, n=8) compared to treated with water (BM_Water, n=5), p values are indicated. Right Panel: Schematic mapping of the purine metabolism pathway highlighting metabolic shifts. Green arrows indicate upregulation. Icons denote the respective sample type where the change was observed, representing either BM (tube icon) or pup stool (stool icon).
Figure 4.
Alterations in purine metabolites in BM following maternal probiotic administration. Left Panel: Box plots illustrate increased abundance of inosine, guanosine and SAICAR in BM from dams treated with the probiotic strain (BM_LRM, n=8) compared to treated with water (BM_Water, n=5), p values are indicated. Right Panel: Schematic mapping of the purine metabolism pathway highlighting metabolic shifts. Green arrows indicate upregulation. Icons denote the respective sample type where the change was observed, representing either BM (tube icon) or pup stool (stool icon).
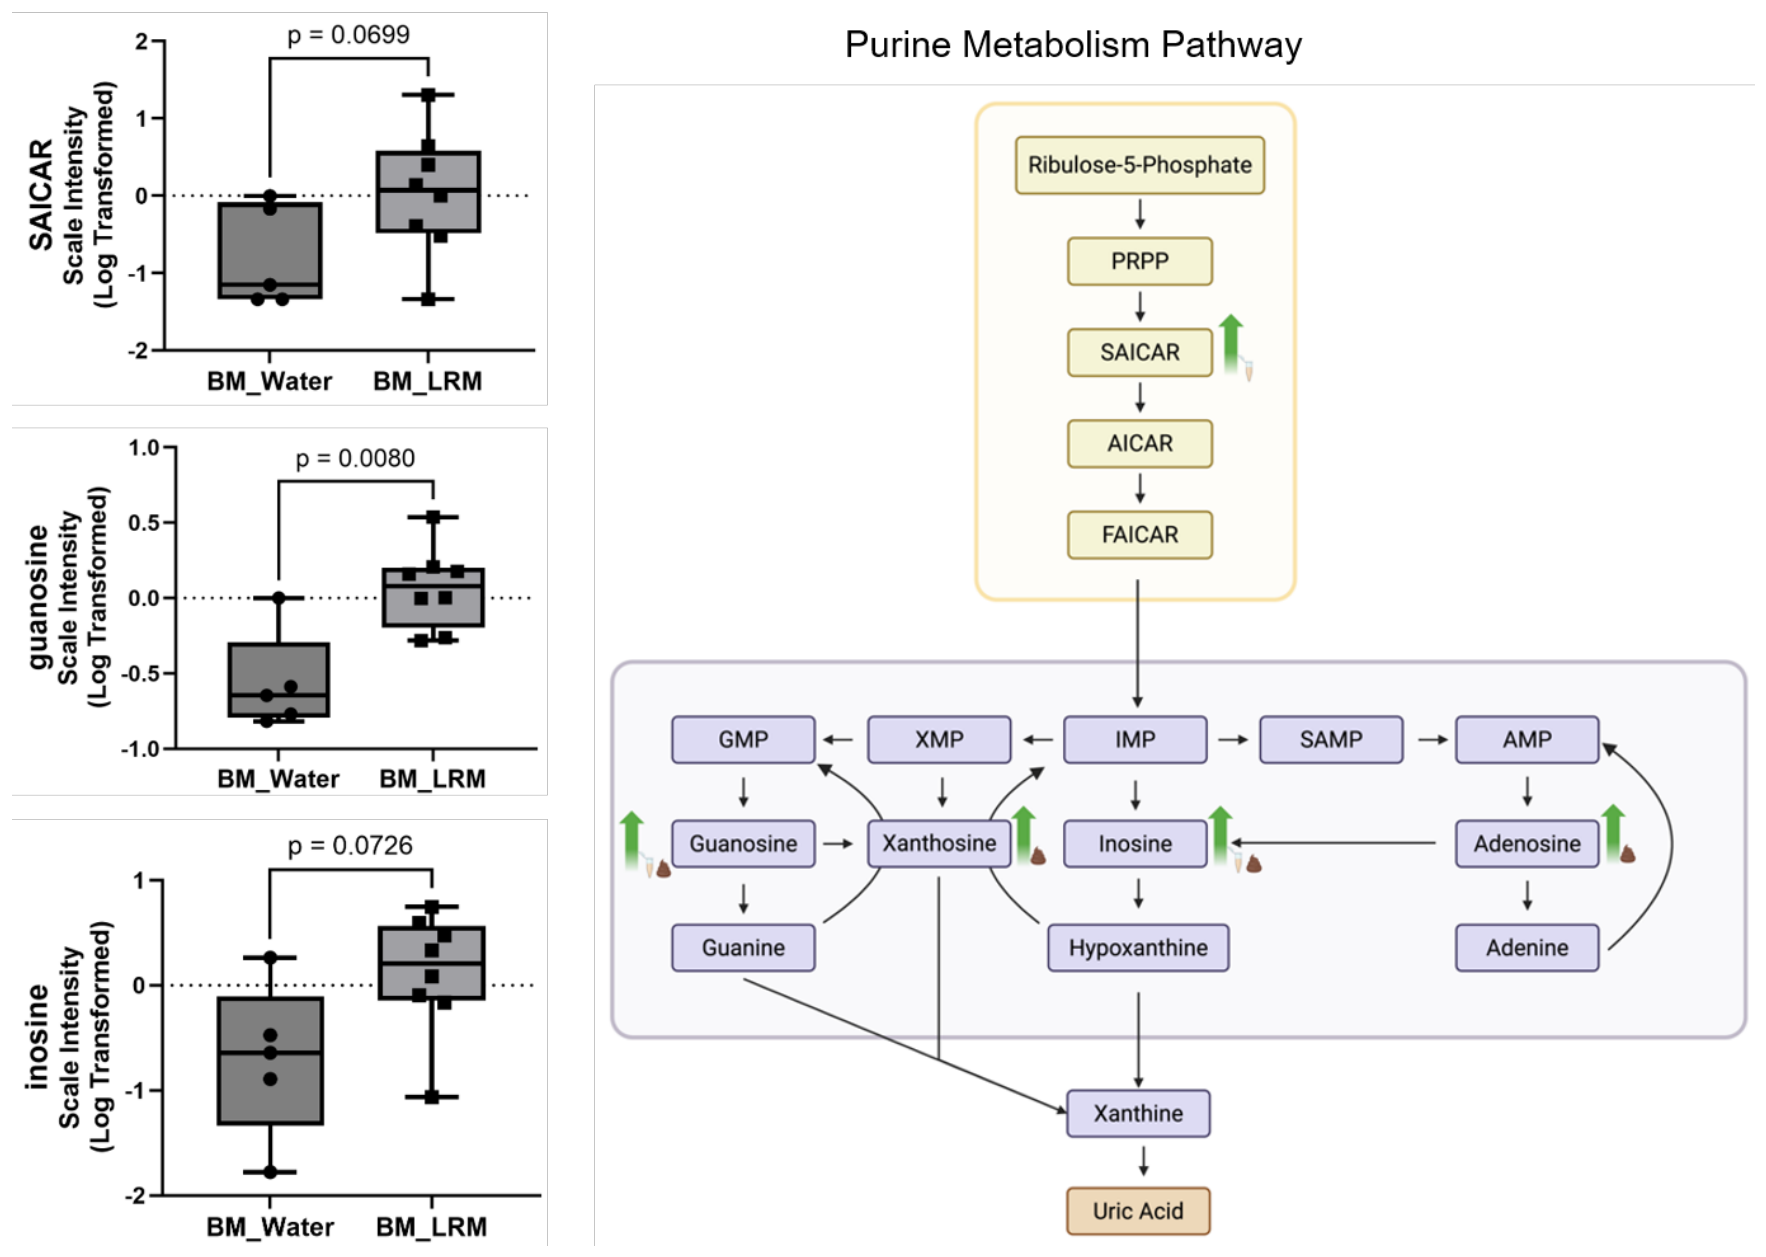
Figure 5.
Increased abundance of indole and dipeptide metabolites in BM following maternal probiotic administration. Box plots display increased abundance of Indoleacetate, Leucylglycine, Leucylalanine, and Glutamylglutamate in BM samples from dams treated with the probiotic strain (BM_LRM, n=8) compared to treated with water (BM_Water, n=5), p values are indicated.
Figure 5.
Increased abundance of indole and dipeptide metabolites in BM following maternal probiotic administration. Box plots display increased abundance of Indoleacetate, Leucylglycine, Leucylalanine, and Glutamylglutamate in BM samples from dams treated with the probiotic strain (BM_LRM, n=8) compared to treated with water (BM_Water, n=5), p values are indicated.
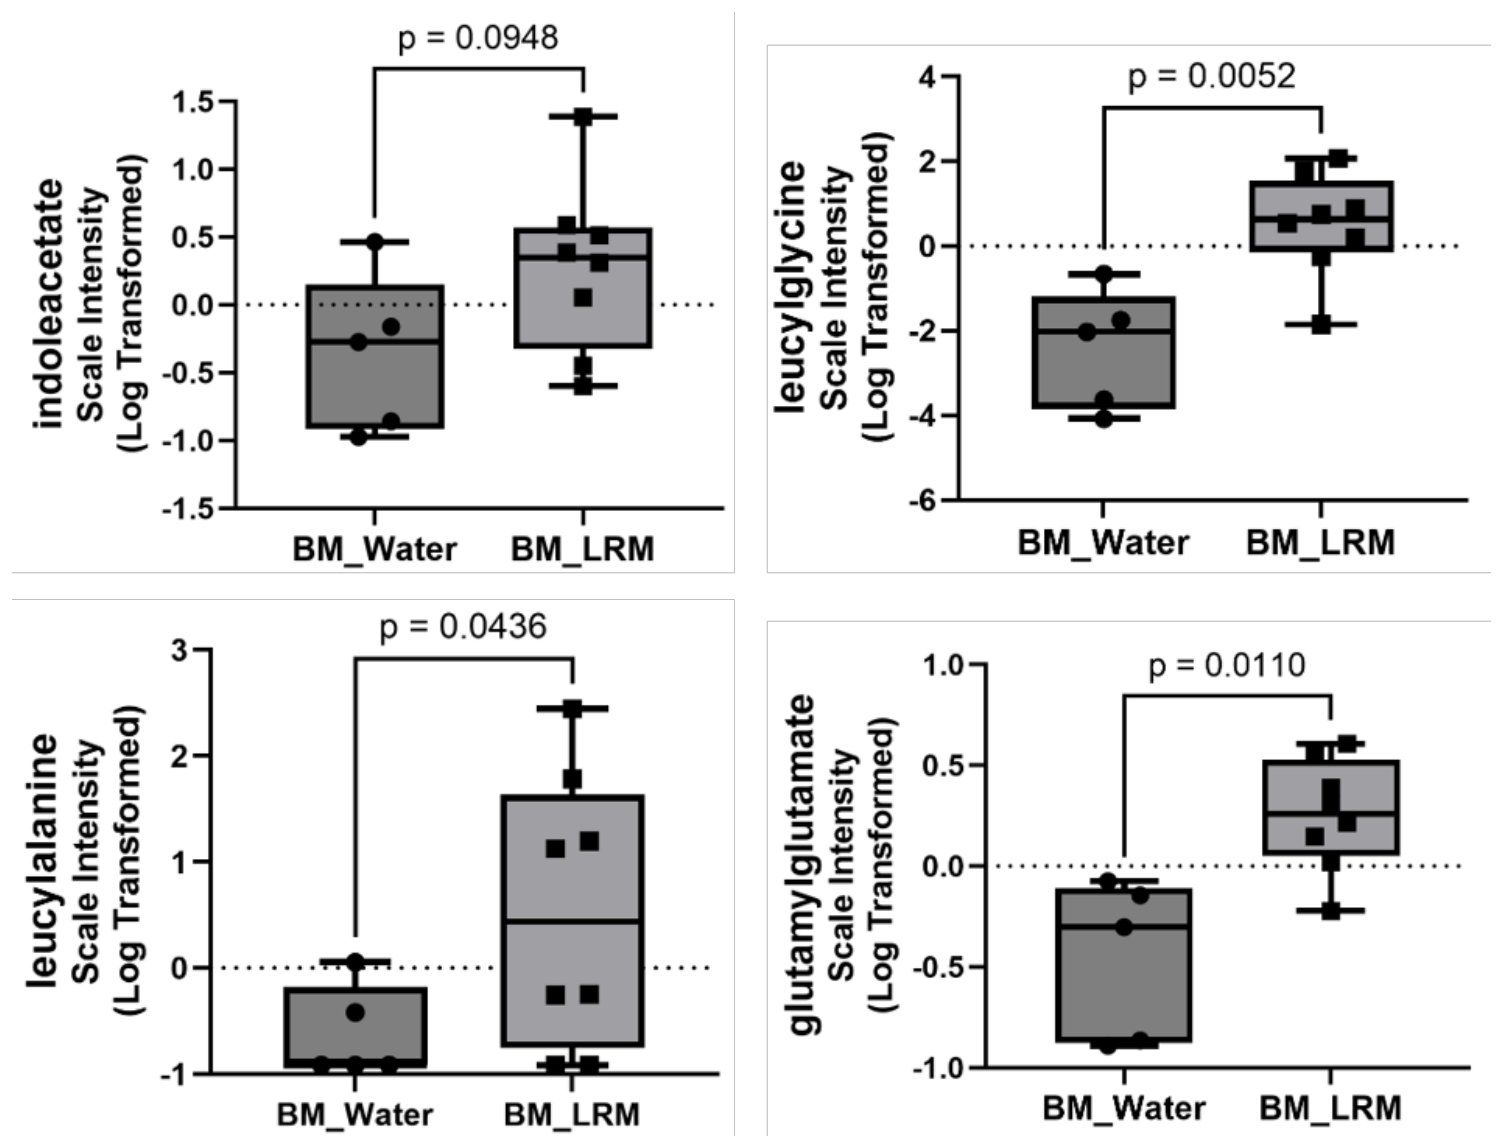
Figure 6.
Volcano plot of altered fecal metabolites on Thy1.1 pups nursed by Thy1.2 dam. The x-axis represents the Log2 fold change, and the y-axis represents the -log 10 (p-value), comparing stools from d7 Thy1.1 pups fostered by dams that fed the probiotic (D7Thy1.1-LRM) to those fed water (D7Thy1.1-CM) during pregnancy. Each dot represents an identified metabolite. Red dots indicate significantly upregulated metabolites, while blue dots indicate significantly downregulated metabolites.
Figure 6.
Volcano plot of altered fecal metabolites on Thy1.1 pups nursed by Thy1.2 dam. The x-axis represents the Log2 fold change, and the y-axis represents the -log 10 (p-value), comparing stools from d7 Thy1.1 pups fostered by dams that fed the probiotic (D7Thy1.1-LRM) to those fed water (D7Thy1.1-CM) during pregnancy. Each dot represents an identified metabolite. Red dots indicate significantly upregulated metabolites, while blue dots indicate significantly downregulated metabolites.
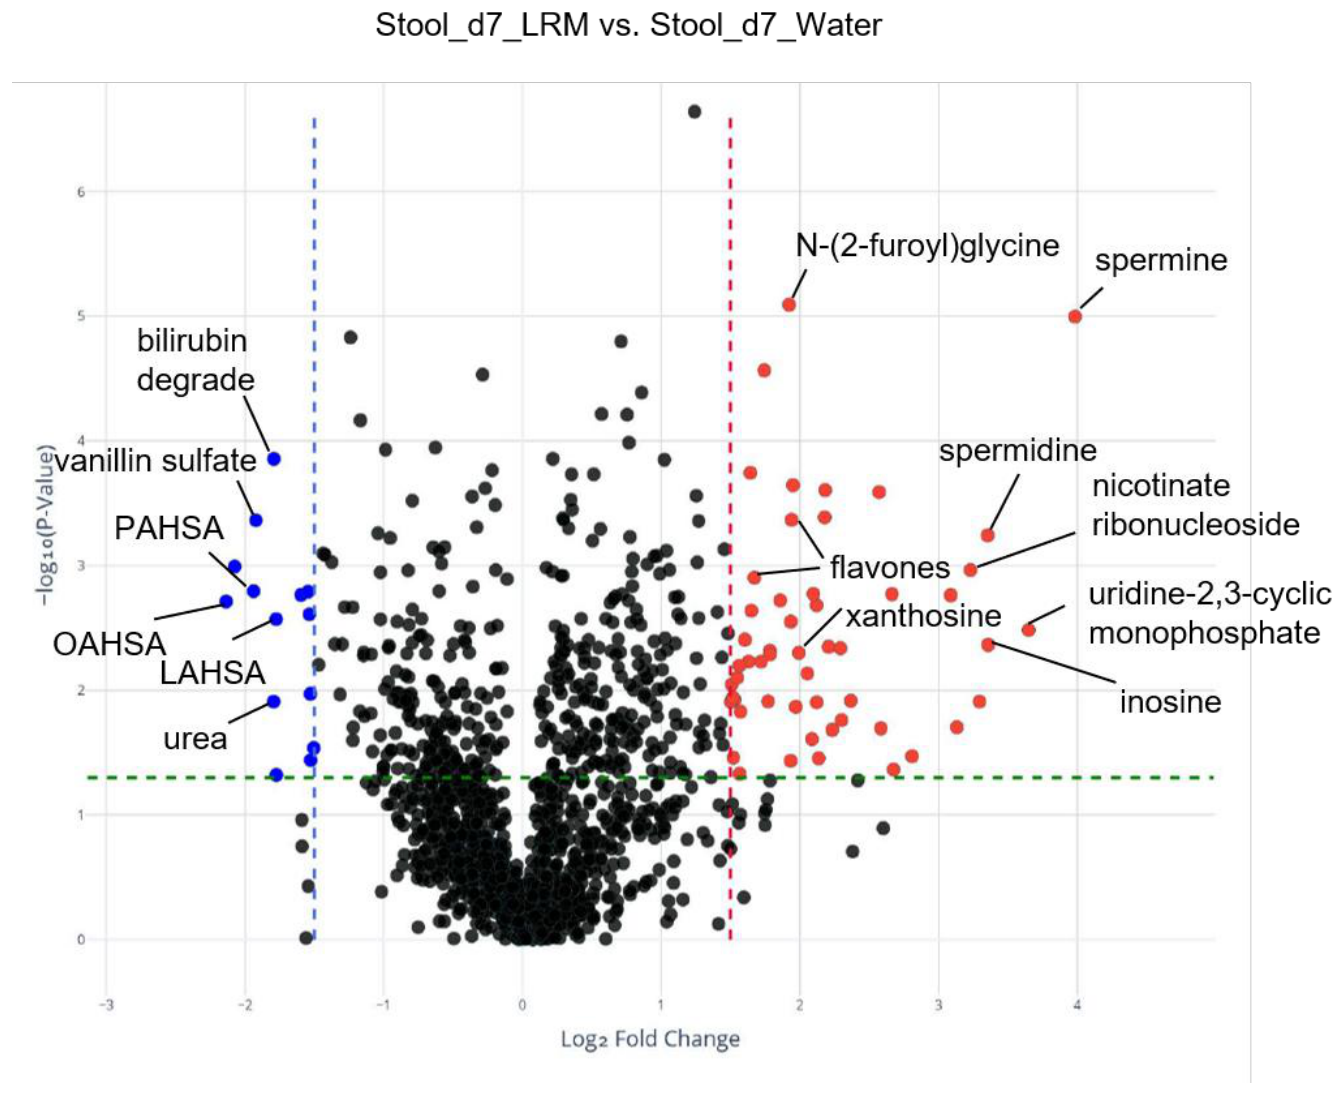
Figure 7.
Maternal probiotic administration increases 2 different polyamine levels in newborn mouse stools. Box plots illustrate increased abundance of spermine (left) and spermidine (right) in the stool of d7 Thy1.1 pups nursed with Thy1.2 dams that received the probiotic strain (D7Thy1.1-LRM, n=8 from 16 pups) compared to dams that received water (D7Thy1.1-CM, n=6 from 12 pups), p values are indicated.
Figure 7.
Maternal probiotic administration increases 2 different polyamine levels in newborn mouse stools. Box plots illustrate increased abundance of spermine (left) and spermidine (right) in the stool of d7 Thy1.1 pups nursed with Thy1.2 dams that received the probiotic strain (D7Thy1.1-LRM, n=8 from 16 pups) compared to dams that received water (D7Thy1.1-CM, n=6 from 12 pups), p values are indicated.
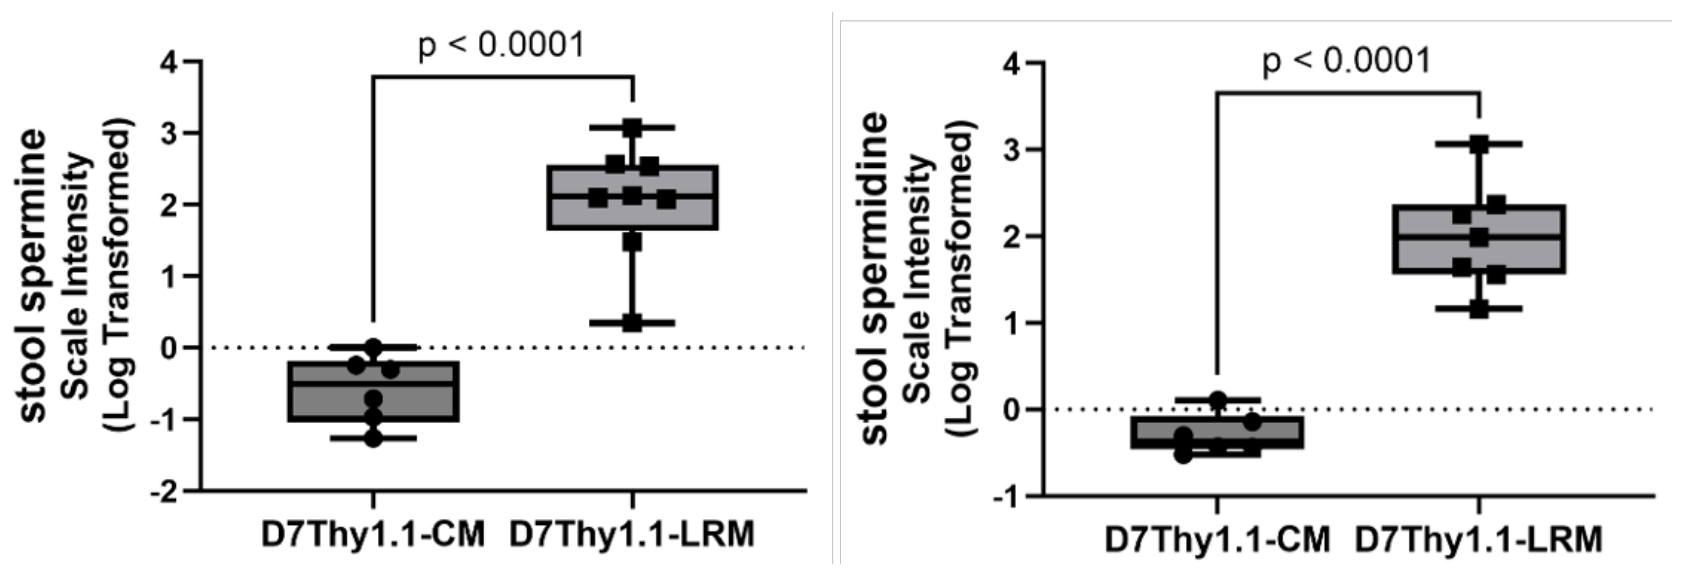
Figure 8.
Maternal probiotic administration alters nucleoside and nucleotide metabolism in newborn mouse stools. Left Panel: FC (D7Thy1.1-LRM vs. D7Thy1.1-CM) of significantly altered purine, pyrimidine, and nucleoside metabolites. Red bars indicate upregulated metabolites, while blue bars indicate downregulated metabolites. Exact FC values are indicated in each bar. Right Panel: Box plots confirm increased abundance of stool inosine in d7 of Thy1.1 pups cross-fostered to probiotic-fed dam (D7Thy1.1-LRM, n=8, from 16 pups) compared to water-fed dams (D7Thy1.1-CM, n=6, from 12 pups), significant p value is indicated.
Figure 8.
Maternal probiotic administration alters nucleoside and nucleotide metabolism in newborn mouse stools. Left Panel: FC (D7Thy1.1-LRM vs. D7Thy1.1-CM) of significantly altered purine, pyrimidine, and nucleoside metabolites. Red bars indicate upregulated metabolites, while blue bars indicate downregulated metabolites. Exact FC values are indicated in each bar. Right Panel: Box plots confirm increased abundance of stool inosine in d7 of Thy1.1 pups cross-fostered to probiotic-fed dam (D7Thy1.1-LRM, n=8, from 16 pups) compared to water-fed dams (D7Thy1.1-CM, n=6, from 12 pups), significant p value is indicated.
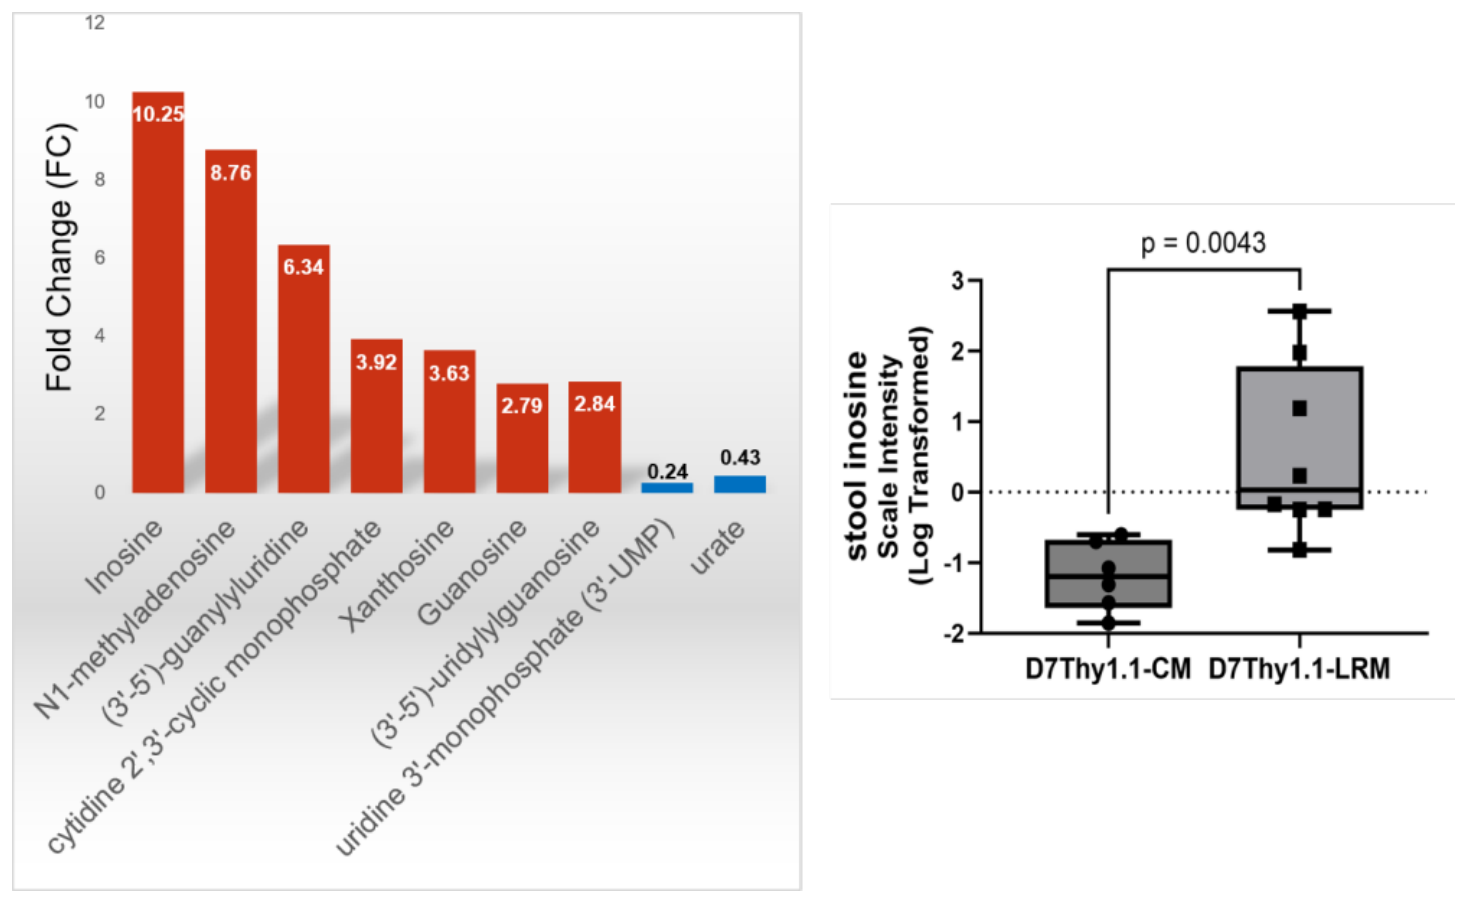
Figure 9.
Differential regulation of central carbohydrate intermediates and vitamin cofactors in newborn mouse stool following maternal probiotic administration. Left Panel: FC of key carbohydrate metabolites, showing a significant increase in pyruvate levels (red bar) and a decrease in glucose 6-phosphate levels (blue bar) by maternal probiotic administration compared to water-fed control . Right Panel: FC of altered vitamin and cofactor derivatives, including vitamin B3 (nicotinate ribonucleoside, nicotinamide N-oxide), vitamin B5 (phosphopantetheine, pantetheine, pantethine), vitamin E (alpha-tocotrienol), and vitamin A (carotene diol) intermediates by maternal probiotic administration. Red bars indicate upregulated metabolites, with exact FC values labeled in each bar.
Figure 9.
Differential regulation of central carbohydrate intermediates and vitamin cofactors in newborn mouse stool following maternal probiotic administration. Left Panel: FC of key carbohydrate metabolites, showing a significant increase in pyruvate levels (red bar) and a decrease in glucose 6-phosphate levels (blue bar) by maternal probiotic administration compared to water-fed control . Right Panel: FC of altered vitamin and cofactor derivatives, including vitamin B3 (nicotinate ribonucleoside, nicotinamide N-oxide), vitamin B5 (phosphopantetheine, pantetheine, pantethine), vitamin E (alpha-tocotrienol), and vitamin A (carotene diol) intermediates by maternal probiotic administration. Red bars indicate upregulated metabolites, with exact FC values labeled in each bar.
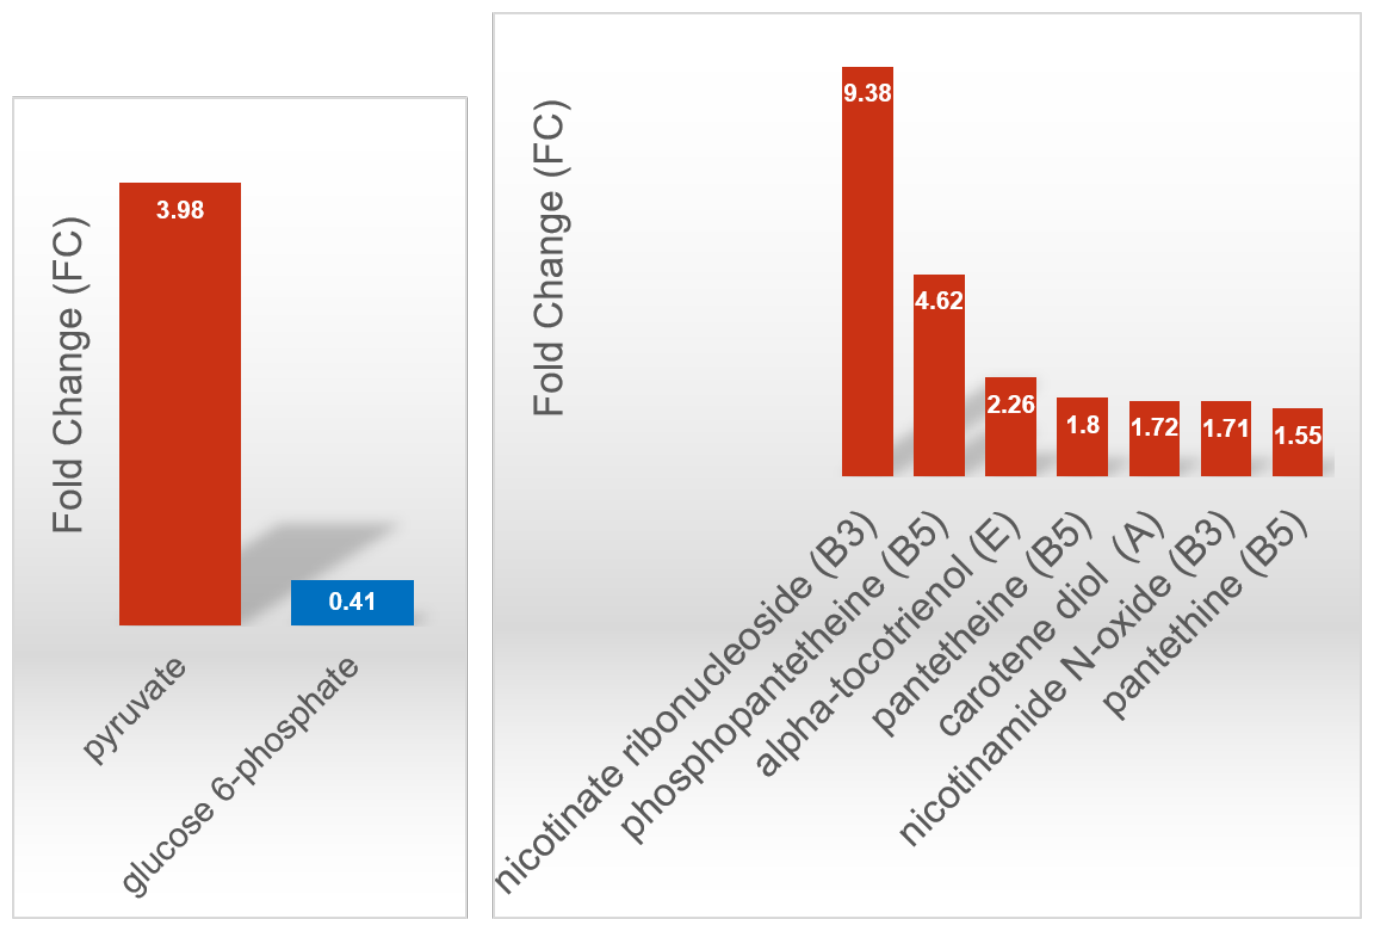
Figure 10.
Maternal probiotic administration decreases lipid FAHFA levels in newborn mouse stools. Box plots illustrate reduced abundance of FAHFAs, specifically LASHA (left), OAHSA (middle), and PAHSA (right), in the stool of d7 Thy1.1 pups nursed by probiotic-fed dams (D7Thy1.1-LRM, n=8, from 16 pups) compared to water-fed dams (D7Thy1.1-CM, n=6, from 12 pups), p values are indicated.
Figure 10.
Maternal probiotic administration decreases lipid FAHFA levels in newborn mouse stools. Box plots illustrate reduced abundance of FAHFAs, specifically LASHA (left), OAHSA (middle), and PAHSA (right), in the stool of d7 Thy1.1 pups nursed by probiotic-fed dams (D7Thy1.1-LRM, n=8, from 16 pups) compared to water-fed dams (D7Thy1.1-CM, n=6, from 12 pups), p values are indicated.
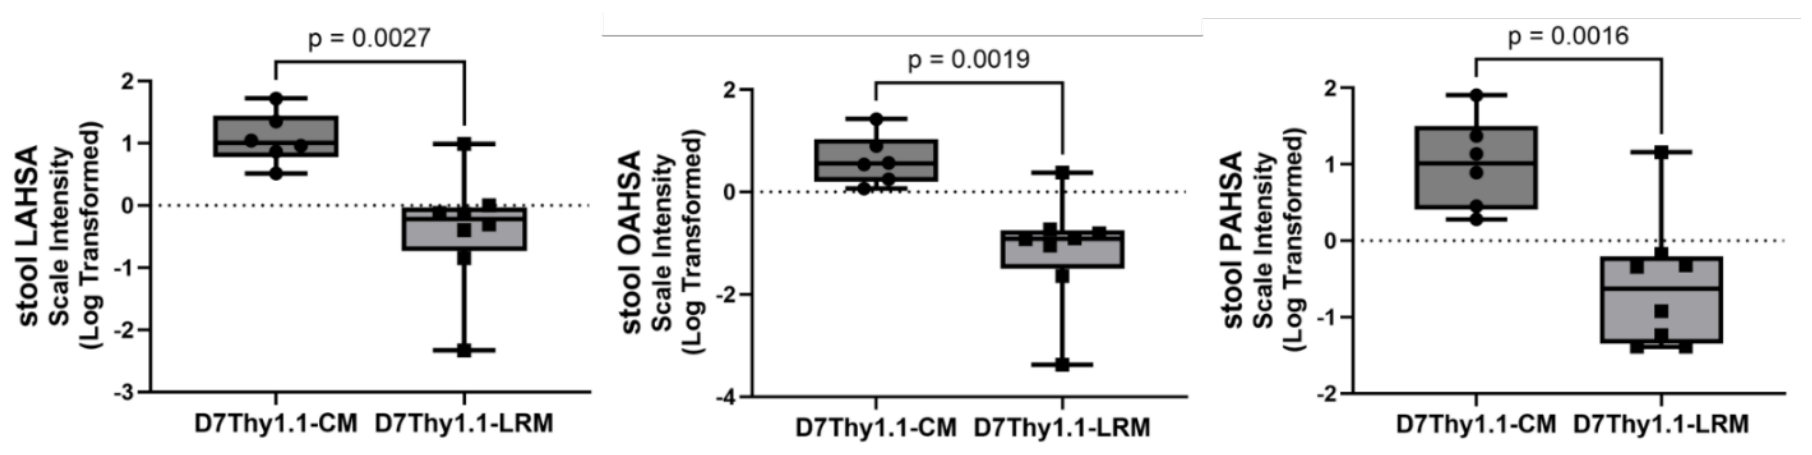
Figure 11.
A. Performance summary of 48 metabolites altered in both BM and newborn mouse stool (LRM vs. Water), respectively. Each row presents one biochemical and each column summarizes performances in one compartment. Node shapes indicate direction of changes, with upper triangles for LRM>Water; node sizes correspond to log2 FC of LRM/Water, and node colors correspond to p-values from Welch tests as well as direction of changes. All 48 metabolites were showing dual effects (p value < 0.1) in BM from dam with probiotic treatment and stool from pups fostered by probiotic-treated dam, but only those p values ≤ 0.05 had a bold black boundary around the triangle node. The contingency table in the lower right corner summarizes the distributions of direction of changes across two compartments. UP: upregulation; DN: downregulation. For BM samples, the comparison “LRM vs. Water” refers to BM_LRM vs. BM_Water. For stool samples, the comparison “LRM vs. Water” referes to D7Thy1.1-LRM vs. D7Thy1.1-CM. B. Re-wiring of correlation networks between breast milk from dam and stool from newborn mice. The subgroup of 11 purine/pyrimidine/dipeptides metabolites were demonstrated. Edges indicate significant Spearman’s Rho with two-tailed p-value < 0.05, which correspond to (r2 > 0.3136 for milk, n = 13, and r2 > 0.2916 for stool, n = 14). Edge colors correspond to direction of changes (warm colors indicate positive correlations) as well as volume of Spearman’s rho (deeper colors larger absolute value for rho). Node sizes correspond to number of significant correlations associated to the metabolite in the specific compartment, node colors correspond to the p value of LRM/Water from Welch’s tests for LRM/Water in the specific compartment. Nodes remain in similar positions across graphs for milk and stool, with the changing pattern of edges illustrating shifting correlation landscapes in different sample compartments upon probiotic treatments.
Figure 11.
A. Performance summary of 48 metabolites altered in both BM and newborn mouse stool (LRM vs. Water), respectively. Each row presents one biochemical and each column summarizes performances in one compartment. Node shapes indicate direction of changes, with upper triangles for LRM>Water; node sizes correspond to log2 FC of LRM/Water, and node colors correspond to p-values from Welch tests as well as direction of changes. All 48 metabolites were showing dual effects (p value < 0.1) in BM from dam with probiotic treatment and stool from pups fostered by probiotic-treated dam, but only those p values ≤ 0.05 had a bold black boundary around the triangle node. The contingency table in the lower right corner summarizes the distributions of direction of changes across two compartments. UP: upregulation; DN: downregulation. For BM samples, the comparison “LRM vs. Water” refers to BM_LRM vs. BM_Water. For stool samples, the comparison “LRM vs. Water” referes to D7Thy1.1-LRM vs. D7Thy1.1-CM. B. Re-wiring of correlation networks between breast milk from dam and stool from newborn mice. The subgroup of 11 purine/pyrimidine/dipeptides metabolites were demonstrated. Edges indicate significant Spearman’s Rho with two-tailed p-value < 0.05, which correspond to (r2 > 0.3136 for milk, n = 13, and r2 > 0.2916 for stool, n = 14). Edge colors correspond to direction of changes (warm colors indicate positive correlations) as well as volume of Spearman’s rho (deeper colors larger absolute value for rho). Node sizes correspond to number of significant correlations associated to the metabolite in the specific compartment, node colors correspond to the p value of LRM/Water from Welch’s tests for LRM/Water in the specific compartment. Nodes remain in similar positions across graphs for milk and stool, with the changing pattern of edges illustrating shifting correlation landscapes in different sample compartments upon probiotic treatments.
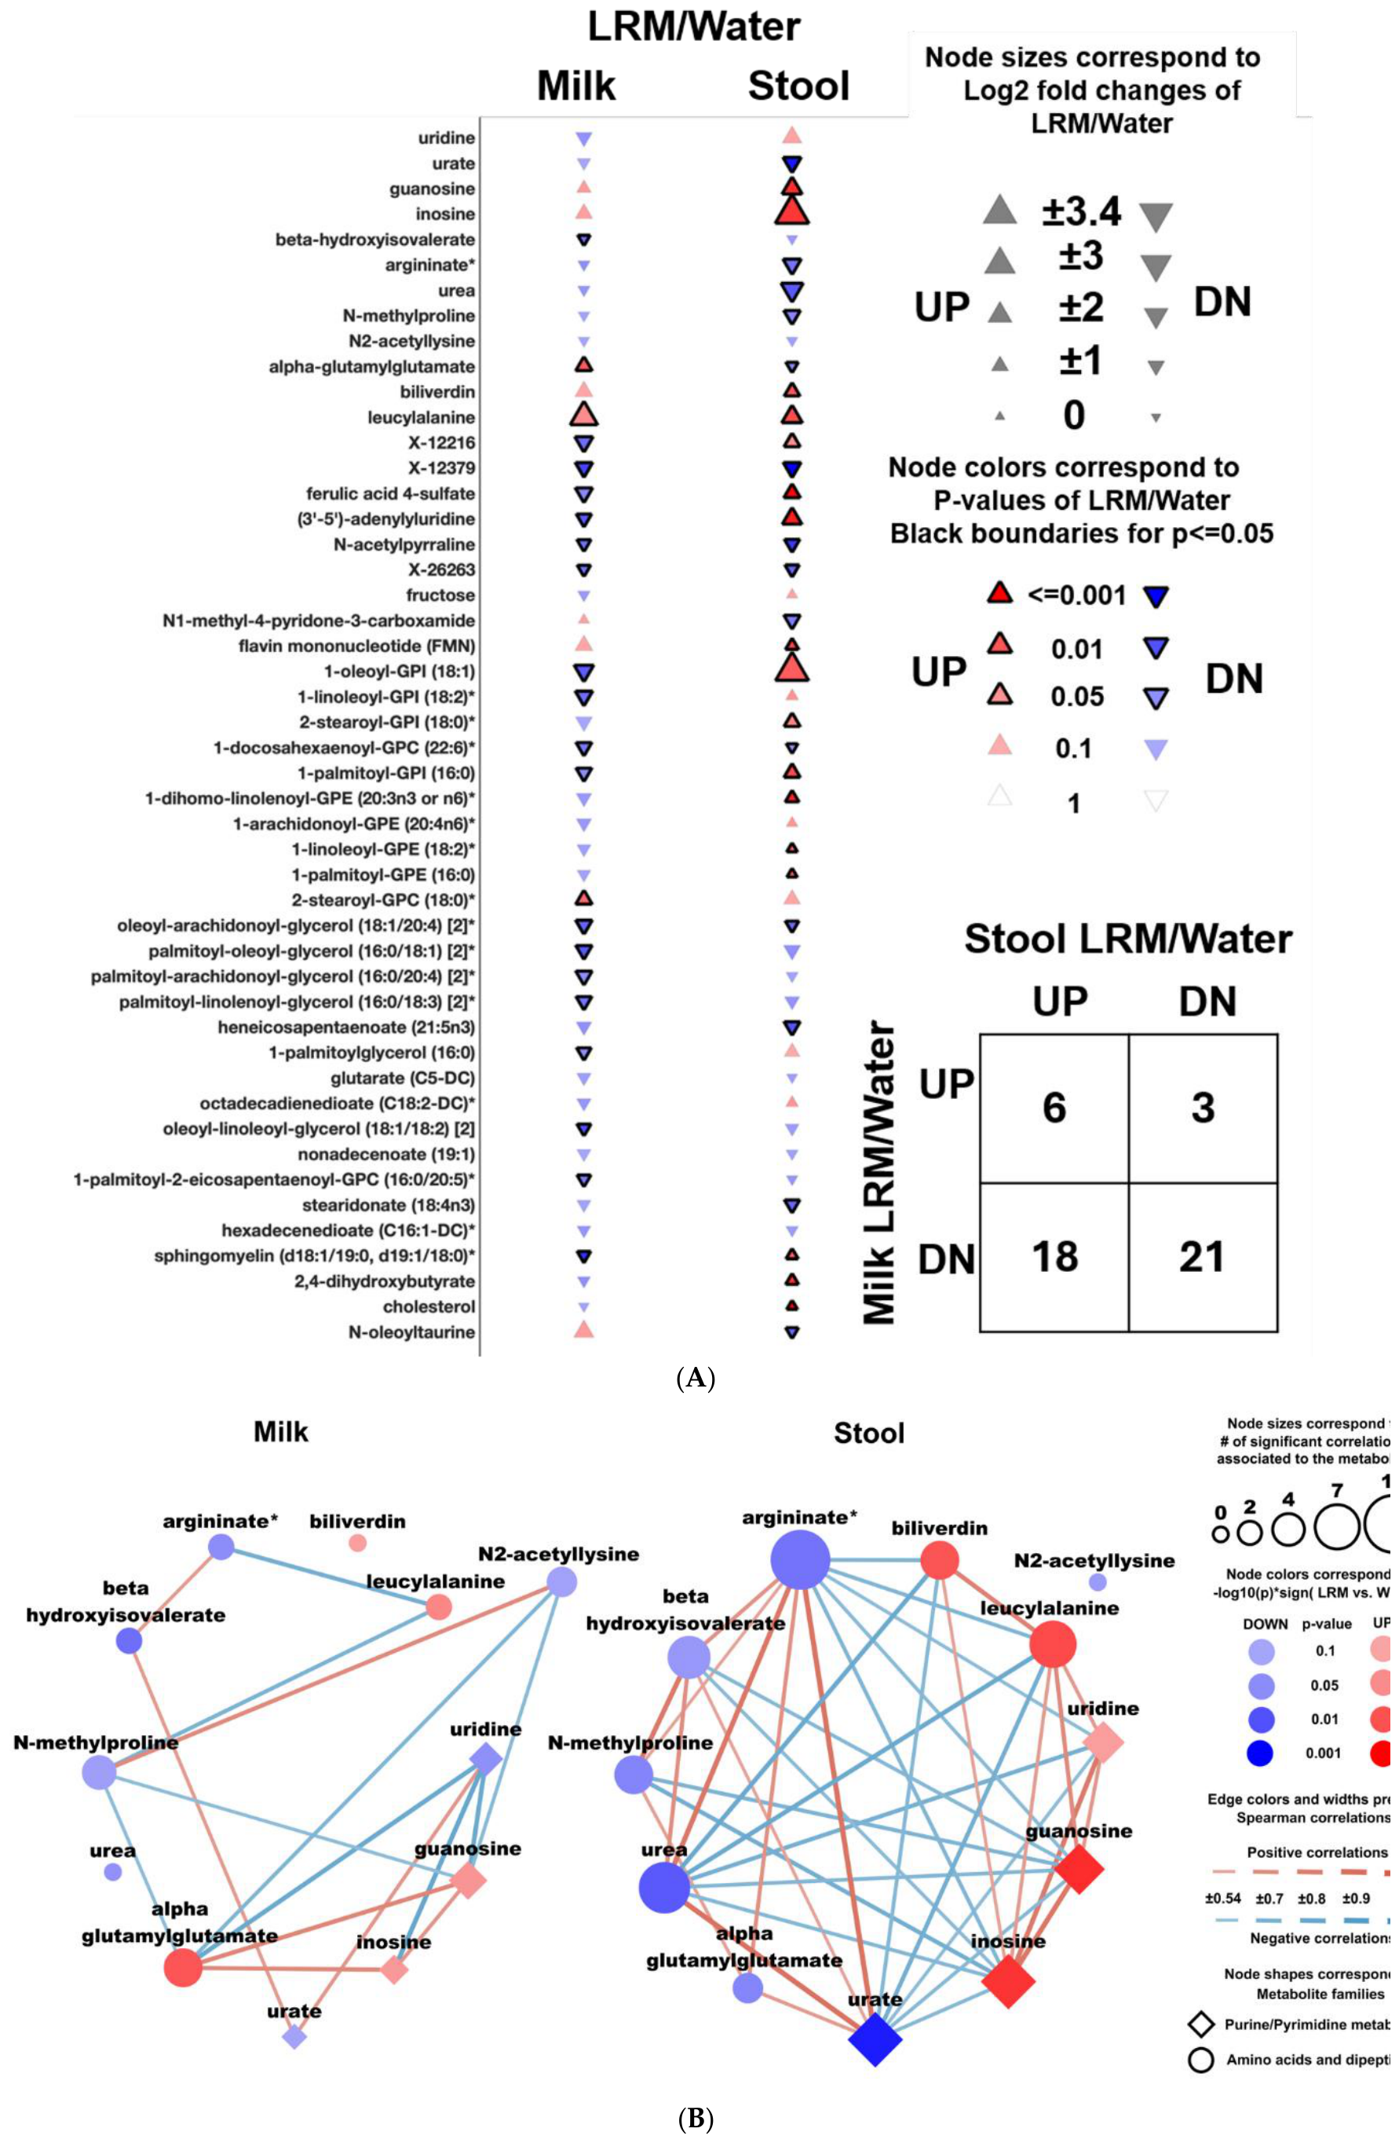

Table 1.
Statistical comparisons of up- or down-regulated metabolites in breast milk from mice fed probiotic (LRM) compared to mice-fed water (Water).
Table 1.
Statistical comparisons of up- or down-regulated metabolites in breast milk from mice fed probiotic (LRM) compared to mice-fed water (Water).
| Welch’s Two-Sample t-test | BM_LRM vs. BM_Water | |
| Total biochemicals (p ≤ 0.05) | 91 | |
| Biochemicals (up- or down-) | Up-regulated = 9 | Down-regulated = 82 |
| Total biochemicals (0.05 < p < 0.1) | 68 | |
| Biochemicals (up- or down-) | Up-regulated = 14 | Down-regulated = 54 |
Table 2.
Statistical comparisons of altered metabolites in feces from Thy1.1 pups nursed by probiotic-fed Thy1.2 dams vs. nursed by water-fed Thy1.2 dams.
Table 2.
Statistical comparisons of altered metabolites in feces from Thy1.1 pups nursed by probiotic-fed Thy1.2 dams vs. nursed by water-fed Thy1.2 dams.
| Welch’s Two-Sample t-test | D7Thy1.1-LRM vs. D7Thy1.1-CM | |
| Total biochemicals (p ≤ 0.05) | 471 | |
| Biochemicals (up- or down-) | Up-regulated = 272 | Down-regulated = 199 |
| Total biochemicals (0.05 < p < 0.1) | 165 | |
| Biochemicals (up- or down-) | Up-regulated = 70 | Down-regulated = 95 |
Disclaimer/Publisher’s Note: The statements, opinions and data contained in all publications are solely those of the individual author(s) and contributor(s) and not of MDPI and/or the editor(s). MDPI and/or the editor(s) disclaim responsibility for any injury to people or property resulting from any ideas, methods, instructions or products referred to in the content. |
© 2026 by the authors. Licensee MDPI, Basel, Switzerland. This article is an open access article distributed under the terms and conditions of the Creative Commons Attribution (CC BY) license (http://creativecommons.org/licenses/by/4.0/).
Copyright: This open access article is published under a Creative Commons CC BY 4.0 license, which permit the free download, distribution, and reuse, provided that the author and preprint are cited in any reuse.