

Submitted:
15 September 2026
Posted:
17 September 2026
You are already at the latest version
Abstract
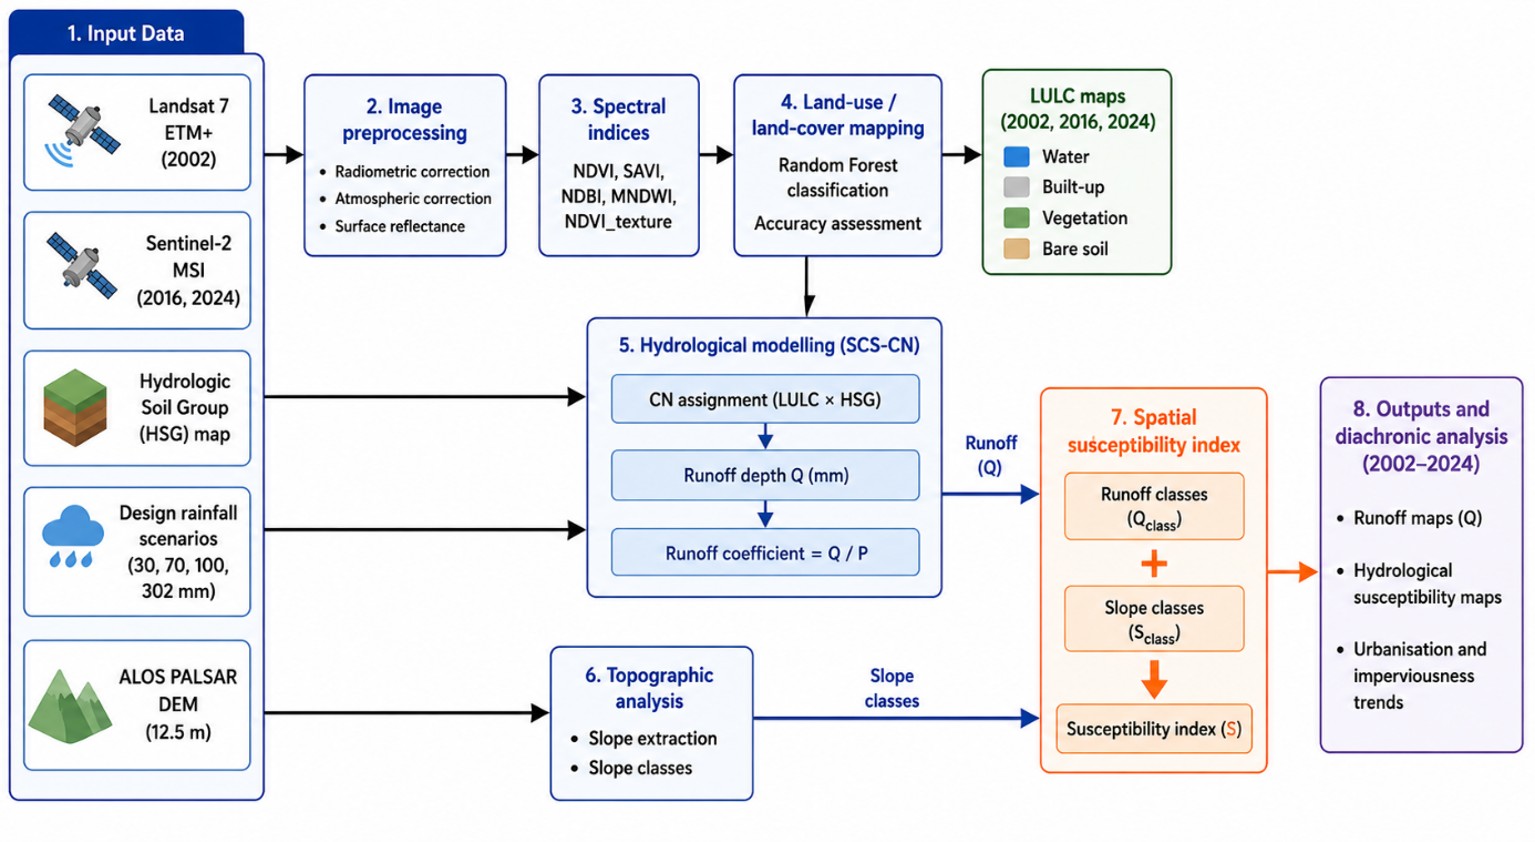
Tropical cities are experiencing rapid urbanization, often without adequate resources to monitor its effects on runoff processes or to support flood forecasting and early warning. This study proposes a low-cost and potentially transferable remote sensing framework to assess the evolution of urban runoff susceptibility in rapidly urbanizing tropical watersheds. The framework combines multi-temporal satellite imagery, urban-adapted spectral indices, supervised Random Forest land use/land cover (LULC) classification, and hydrological analysis based on the Soil Conservation Service Curve Number (SCS-CN) method. It was applied to the Gourou (28 km²) and Bonoumin (46 km²) watersheds in Abidjan, Côte d’Ivoire, for 2002, 2016, and 2024. Spatially distributed runoff was estimated using rainfall scenarios of 30, 70, 100, and 302 mm and subsequently translated into runoff susceptibility indicators. The results reveal substantial urban expansion, particularly in Bonoumin, accompanied by increasing CN values and declining infiltration potential. Under the 30 mm rainfall scenario, the runoff coefficient increased from 0.29 to 0.53 in Bonoumin between 2002 and 2024, reflecting a marked hydrological transformation, while Gourou maintained a comparatively high runoff response throughout the study period. Under the extreme 302 mm scenario, runoff coefficients reached 0.94 in both watersheds in 2024. High and Very High runoff susceptibility classes also expanded substantially under extreme rainfall conditions. Although direct validation against observed discharge was not possible because both watersheds are ungauged, the identified trends are consistent with land-cover changes, previous studies, and the established SCS-CN hydrologic soil-group framework. The proposed framework therefore provides spatially explicit indicators that can support urban planning, flood preparedness, risk management, and early warning in data-scarce tropical cities.
Keywords:
urbanization
; remote sensing
; land use/land cover change
; curve number
; runoff susceptibility
; early warning systems
; tropical cities
1. Introduction
Globally, floods are among the most frequent and destructive hydrometeorological disasters, particularly in urban environments where impervious surfaces can rapidly convert rainfall into runoff, causing major disruptions and severe damage to infrastructure (WMO, 2024). Urban flooding has become a major hydrometeorological hazard and a critical disaster risk management challenge in tropical cities of the Global South, where increasing rainfall extremes combined with rapid urbanization intensify surface runoff and flood susceptibility (Douglas et al., 2008; Di Baldassarre et al., 2010; IPCC, 2022).
In this context, strengthening Early Warning Systems (EWS), as promoted by the Sendai Framework for Disaster Risk Reduction (2015–2030) and initiatives such as Climate Risk and Early Warning Systems (CREWS), has become a major priority (WMO and UNDRR, 2023). The effectiveness of such systems depends on the ability to link observed or forecasted rainfall with expected hydrological responses, particularly in terms of runoff generation, flow accumulation, and the identification of flood-prone areas. However, in poorly monitored tropical urban environments, this relationship remains insufficiently documented due to the lack of continuous hydrological observations, the non-stationarity of rainfall–runoff relationships, and the complexity of urban hydrological processes.
Urban flooding results from the combined effects of rainfall intensity, land use and land cover dynamics, and topographic controls. Together, these factors govern runoff generation, flow routing, and water accumulation processes within urban catchments. As urbanization progresses, the expansion of impervious surfaces tends to increase runoff-contributing areas, while local topographic depressions and drainage constraints promote the concentration and storage of excess water during intense rainfall events (Miguez et al., 2017; Bruwier et al., 2020).
Understanding these processes strongly depends on land use and land cover (LULC) changes. The expansion of impervious surfaces associated with increasing built-up areas, road networks, and other artificial surfaces enhances runoff generation while reducing infiltration capacity. Several studies have highlighted these dynamics in tropical urban environments, particularly in Nigeria (Lagos; Adelekan, 2010) and Cameroon (Yaoundé; Jourdan et al., 2017). The rapid expansion of impervious surfaces in these cities has significantly altered hydrological processes and increased runoff production.
Monitoring urban transformations and their hydrological impacts increasingly relies on multi-temporal Earth observation data. Landsat and Sentinel image archives provide consistent datasets for analyzing the evolution of urban, vegetated, and artificial surfaces over several decades. In complex urban environments, machine-learning approaches such as the Random Forest (RF) algorithm (Breiman, 2001), combined with spectral and textural information derived from indices such as NDVI, NDBI, SAVI, and MNDWI, have demonstrated strong capabilities for improving land use and land cover classification accuracy (Belgiu and Drăguț, 2016; Maxwell et al., 2018; Xu, 2006).
At the same time, many rapidly growing tropical cities lack dedicated flood forecasting services, while others operate under limited technical and financial resources. The increasing availability of freely accessible Earth observation data creates new opportunities for operational hydrological monitoring and flood risk assessment. However, the rapid pace of technological development poses significant challenges for meteorological and hydrometric agencies, which often struggle to integrate and operationalize these emerging tools within existing operational frameworks.
To translate land-cover dynamics into hydrologically meaningful information, the Soil Conservation Service Curve Number (SCS-CN) method is widely used to estimate direct runoff from land use and soil characteristics (Soulis and Valiantzas, 2012; Ekwule and Agunwamba, 2024; Khattab et al., 2025). Its ease of implementation, its well-established robustness, extensively tested across a wide range of climatic conditions by the scientific community and its ability to jointly exploit information on land use and soil properties make it particularly suitable for African urban environments characterized by limited hydrological data. Nevertheless, despite the increasing availability of satellite-derived LULC products and the widespread application of the SCS-CN method, relatively few studies in West Africa have combined multi-temporal urban growth analysis with runoff estimation approaches to quantify the long-term hydrological consequences of urbanization.
Consequently, a significant knowledge gap remains regarding the development of low-cost, operational and transferable frameworks capable of regularly updating land-cover dynamics and translating these changes into spatially explicit indicators of runoff susceptibility in real time. In particular, the extent to which freely accessible satellite observations, machine-learning classification techniques, and parsimonious hydrological models can be integrated into an operational workflow for flood forecasting services and Early Warning Systems in poorly monitored tropical cities remains insufficiently explored.
This study addresses this gap by proposing an integrated GIS-based framework built upon freely accessible and regularly updated geospatial data to assess the evolution of runoff susceptibility in rapidly urbanizing tropical catchments. The methodology combines multi-temporal LULC mapping derived from Landsat and Sentinel imagery using the Random Forest classifier with runoff estimation based on the SCS-CN method. Hydrological responses are simulated under several rainfall scenarios representative of operational rainfall warning thresholds, while spatial runoff susceptibility is assessed by combining runoff potential and topographic controls. The entire workflow was designed to be easily reproducible and regularly updatable, thereby facilitating its operational integration into flood forecasting services and Early Warning Systems.
Beyond its scientific contribution, this approach aims to provide spatially explicit indicators capable of supporting urban flood preparedness, strengthening disaster risk reduction strategies, improving the anticipation of runoff-prone areas, and contributing to the development of Early Warning Systems in rapidly growing tropical cities.
The framework is applied to two urban watersheds in Abidjan, Côte d’Ivoire, over the period 2002–2024. As the largest metropolitan area in Côte d’Ivoire and one of the fastest-growing cities in West Africa, Abidjan experiences recurrent flood events resulting from the combined effects of intense rainfall, rapid urbanization, inadequate drainage infrastructure, and the progressive occupation of flood-prone areas (Konaté et al., 2016). It therefore provides a representative case study for investigating the hydrological consequences of urbanization and evaluating the applicability of the proposed framework in rapidly evolving tropical urban environments.
2. Materials and Methods
2.1. Study Area
This study focuses on the Autonomous District of Abidjan (DAA), the main economic hub of Côte d’Ivoire and one of West Africa’s major urban centers. Located in the Lagunes region, the DAA covers approximately 2,119 km2, including 566 km2 of the Ébrié Lagoon (INS, 2021), and comprises thirteen municipalities with a population exceeding 6.3 million. Abidjan accounts for a substantial share of the country’s economic activity, estimated at around 60% of national GDP, highlighting its strategic importance. Two watersheds were selected (Figure 1): the highly urbanized Gourou watershed (28 km2) and the rapidly urbanizing Bonoumin watershed (46 km2).
These catchments reflect the main urban dynamics of Abidjan, combining a rise in impervious surfaces and artificial drainage networks and a decline in natural buffer areas. The district is regularly affected by severe urban flooding: between 2010 and 2022, more than 150 deaths were recorded, particularly in the municipalities of Cocody, Abobo, Yopougon, and Attécoubé, where low-lying areas concentrate runoff and experience hydraulic overflows (SODEXAM, 2022).
The topography is organized into three major units: northern highlands (40-120 m), intermediate coastal plateaus (8-40 m), and low-lying lagoon plains, which are more prone to flooding. Locally, slopes can reach 63%, promoting rapid runoff concentration. The soils, predominantly ferrallitic and clay-sandy, originate from sedimentary formations or the Precambrian basement. The dense river network, fragmented into small basins ranging from 20 to 100 km2 that drain into the Ébrié Lagoon, is severely constrained by urbanization along thalwegs, which exacerbates flash flooding during periods of intense rainfall (Yao et al., 2024; Kouadio et al., 2024).
The climate is humid equatorial, with high rainfall variability and intense rainfall events that directly influence urban runoff. Average annual rainfall is around 1,900 mm, with more than 60% occurring between March and July, and recent analyses highlight the importance and spatial variability of intense and extreme rainfall events in the occurrence of urban flooding in Abidjan (Yao et al., 2024). Hourly rainfall rates exceeding 100 mm can be observed in certain municipalities, significantly increasing the risk of flooding (SODEXAM, 2022).
The initial sanitation and drainage master plan for Abidjan, developed in the 1970s–1980s, included seven implementation phases, of which only three were completed, corresponding to approximately 43% of the initially planned works (Satin et al., 1999). More recent assessments indicate that sanitation and drainage infrastructure remain insufficient, with only 58% of households connected to the collective sanitation network (Colon and Rieu, 2022). Rapid and often unplanned urbanization has further increased pressure on these systems, while ageing infrastructure, insufficient hydraulic capacity, obstructions, and inadequate maintenance continue to affect wastewater and stormwater drainage in several parts of Abidjan (Ouattara et al., 2023). These limitations reduce the effectiveness of stormwater management and contribute to increasing flood vulnerability, particularly in highly urbanized watersheds such as Gourou and Bonoumin, where the expansion of impervious surfaces promotes rapid surface runoff.
2.2. Data Used
The datasets used in this study include multi-temporal satellite imagery, rainfall data, and soil data employed for land use/land cover analysis and urban runoff estimation.
2.2.1. Satellite Imagery
Three satellite images were used to analyze land use/land cover evolution within the Abidjan district: one Landsat 7 ETM+ image acquired on December 31, 2002, and two Sentinel-2 MSI images acquired on January 6, 2016, and January 29, 2024, respectively. The images were selected during the dry season to minimize cloud cover and ensure seasonal consistency between acquisition dates. The Landsat 7 image has a spatial resolution of 30 m, whereas the Sentinel-2 images were processed at 10 m spatial resolution for the visible and near-infrared bands. The datasets correspond to surface reflectance products derived from the Landsat Collection 2 Level 2 (USGS) and Sentinel-2 MSI Level-2A (Copernicus) collections.
2.2.2. Rainfall Data
The rainfall data used in this study were provided by SODEXAM. Four rainfall scenarios representing precipitation amounts observed in tropical urban environments were considered: 30 mm, 70 mm, 100 mm, and 302 mm. These values respectively correspond to low, moderate, heavy, and extreme rainfall events recorded within the Abidjan district.
2.2.3. Soil Data
The Hydrologic Soil Groups (HSG) map was obtained from BNETD. This soil layer was used for the assignment of Curve Number (CN) values.
2.2.4. Topographic Data
An ALOS PALSAR Digital Elevation Model (DEM) with a spatial resolution of 12.5 m was used to represent topography and support the flood potential analysis. The DEM was combined with the simulated runoff depths and topographic conditions to produce flood potential maps. The ALOS PALSAR product was selected because of its finer spatial resolution compared with 30 m global DEMs, allowing a more detailed representation of natural topographic features and elevation gradients within the study area. Satellite data processing and analysis were carried out using the Google Earth Engine platform through JavaScript scripting (Gorelick et al., 2017). Visual validation and final cartographic layout were subsequently performed using Google Earth and QGIS, respectively.
2.3. Methodology
2.3.1. Image Processing and Spectral Indices
The years 2002, 2016, and 2024 were selected to analyze land use/land cover evolution in Abidjan through a consistent diachronic framework. Images were acquired during the dry season to minimize cloud contamination and ensure seasonal comparability between observation dates. Landsat 7 ETM+ and Sentinel-2 MSI datasets were processed as surface reflectance products. Each dataset was processed and analyzed at its native spatial resolution (30 m for Landsat 7 and 10 m for Sentinel-2), thereby preserving the original spatial information provided by each sensor and avoiding the introduction of artificial spatial detail through resampling procedures. The interpretation focused on long-term urbanization trends and watershed-scale hydrological indicators rather than pixel-level comparisons. For Sentinel-2 data, the SWIR bands (20 m) were resampled to 10 m prior to the computation of spectral indices.
Selection of Spectral Bands
Spectral bands from the Landsat 7 ETM+ and Sentinel-2 MSI sensors were selected to discriminate the main land use/land cover classes in urban environments, particularly built-up surfaces, vegetation, bare soils, and water bodies. The analyses included visible bands (Blue, Green, Red: B1–B3 for Landsat 7 and B2–B4 for Sentinel-2), near-infrared bands (NIR: B4 for Landsat 7 and B8 for Sentinel-2), and shortwave infrared bands (SWIR1 and SWIR2: B5 and B7 for Landsat 7; B11 and B12 for Sentinel-2).
The Sentinel-2 SWIR bands, originally acquired at 20 m spatial resolution, were resampled to 10 m to ensure spatial consistency with the other bands used in the spectral index calculations. Despite the complementarity of multispectral bands, spectral confusion may still occur in urban environments between mineral surfaces, bare soils, asphalt roads, and dark water bodies. To reduce these ambiguities and improve class separability, several spectral indices derived were integrated into the analysis.
Selection of Spectral Indices
To improve land use/land cover discrimination in urban environments, five spectral indices were computed from the selected multispectral bands. The NDVI and SAVI indices were used to characterize vegetation and reduce the influence of bare soils on spectral response (Rouse et al., 1974; Huete, 1988). The NDBI index was used to enhance the identification of impervious and built-up surfaces (Zha et al., 2003), whereas the MNDWI was employed to improve water surface detection in urban environments (Xu, 2006). An NDVI-derived texture index (NDVI_texture) was also integrated to better represent the spatial heterogeneity and fragmentation of urban landscapes. Texture information has been shown to improve the discrimination of complex urban environments characterized by mixed land-cover patterns (Herold et al., 2003).
The combination of these five indices improves spectral separation between the main urban land cover classes exhibiting similar spectral signatures, particularly between built-up surfaces, bare soils, asphalt roads, and dark water bodies. Several studies have demonstrated their relevance for analyzing urbanization and soil imperviousness from Landsat and Sentinel imagery in urban environments.
2.3.2. Land Use/Land Cover Classification
Supervised land use/land cover classification was performed using the Random Forest (RF) algorithm, which is widely used in remote sensing because of its robustness to noise and its ability to handle highly correlated variables (Breiman, 2001; Belgiu and Drăguț, 2016). RF relies on an ensemble of decision trees trained on bootstrap samples and combined through majority voting, thereby reducing overfitting and improving the model generalization capability (Gislason et al., 2006; Rodriguez-Galiano et al., 2012).
In this study, the model was parameterized using 200 trees, corresponding to the threshold at which classification error stabilized while maintaining a reasonable computational cost. Tree depth was left unrestricted to allow the model to adapt to spectral data variability. At each node, a random subset of variables of size √p (spectral bands and derived indices) was tested according to standard recommendations for multispectral imagery.
Training polygons were manually defined through a combined visual interpretation of satellite imagery, high-resolution Google Earth images, and spectral index maps (NDVI, SAVI, NDBI, MNDWI, and NDVI_texture). The spectral indices used in this study, together with their formulas, spectral bands, and respective purposes, are summarized in Appendix A. A total of 1012, 491, and 576 training polygons were used for the 2002, 2016, and 2024 classifications, respectively, corresponding to 3321, 4856, and 6540 training pixels. Details of the samples used for each class are provided in Appendix A.
Training samples were defined at the scale of the Abidjan district in order to represent the spectral diversity of the main land use/land cover classes (water, built-up areas, vegetation, and bare soil). The calibrated model was subsequently applied to the Gourou and Bonoumin watersheds to produce the multi-temporal land use/land cover maps.
The relative contributions of spectral bands and derived indices were evaluated using the variable importance metric provided by the Random Forest model (Breiman, 2001). This importance metric is based on the mean decrease in Gini impurity, which quantifies the contribution of each variable to the classification process during tree construction (Louppe et al., 2013). Variable importance values were extracted using the Google Earth Engine explain function and subsequently normalized to allow inter-variable comparison.
Accuracy Assessment
Classification performance was evaluated using confusion matrices comparing predicted classes with reference classes. Two complementary approaches were implemented: an internal validation based on the training dataset (resubstitution), used to assess the consistency of the classifier, and an independent validation based on stratified random sampling with a split between training (70%) and testing (30%) datasets.
Model performance was assessed using several standard classification metrics, including Overall Accuracy, the Kappa coefficient, User’s Accuracy, Producer’s Accuracy, and the F1-score, which provide information on omission and commission errors (Congalton, 1991; Foody, 2002).
2.3.3. Determination and Spatial Distribution of the Curve Number (CN)
The Curve Number (CN) from the SCS-CN method was used as a spatial indicator of urban runoff potential (USDA-SCS, 1972; NRCS, 2004). The CN is a dimensionless empirical parameter ranging from 0 to 100 that expresses the runoff generation potential of a surface according to land use/land cover and soil infiltration characteristics. Higher CN values indicate lower infiltration capacity and greater runoff potential. The method has been widely applied for runoff estimation and hydrological analysis in heterogeneous watersheds (Mishra and Singh, 2004; Soulis and Valiantzas, 2012).
Four main land use/land cover classes were considered: water, built-up areas, vegetation, and bare soil. Soil hydrological groups were classified according to the SCS nomenclature from A to D, corresponding to a progressive decrease in soil infiltration capacity. The combination of land use/land cover classes and hydrological soil groups allowed the assignment of a CN value to each pixel according to the standard SCS-CN tables (Table 1).
The CN maps produced for 2002, 2016, and 2024 were subsequently used to analyze the spatial evolution of runoff potential within the Gourou and Bonoumin urban watersheds.
Runoff Estimation Using the SCS-CN Model
Direct runoff (Q) was estimated using the Soil Conservation Service Curve Number (SCS-CN) method, a widely used rainfall-runoff model based on land use and soil hydrological characteristics (Mishra and Singh, 2004; Soulis and Valiantzas, 2012). The maximum potential retention, denoted as (mm), was calculated as follows:
where represents the Curve Number assigned to each pixel. Direct runoff was subsequently estimated as:
for , where represents rainfall depth. When , runoff was considered null . To compare the hydrological response between periods and watersheds, the runoff coefficient was calculated as the ratio between estimated runoff and rainfall:
Maps of Q and Cr were produced for different rainfall scenarios to analyze the spatial evolution of runoff potential within the studied watersheds. Similar applications of the SCS-CN approach combined with geospatial analysis have recently been reported for watershed runoff assessment (Nunes et al., 2021).
2.3.4. Rainfall Scenarios
To evaluate the hydrological response of the studied watersheds, several rainfall scenarios were defined based on the operational warning thresholds used by the National Meteorological Department of SODEXAM in Côte d’Ivoire. As shown in Table 2, these thresholds correspond to different precipitation levels likely to generate contrasting hydrological impacts in urban environments (Konaté et al., 2016). Rainfall values were considered as cumulative rainfall amounts (mm) used as hydrological scenarios.
2.3.5. Spatialized Flood Susceptibility Indicator
To identify areas potentially prone to runoff accumulation and flooding processes, runoff depths (Q) estimated using the SCS-CN model were combined with topographic conditions derived from the Digital Elevation Model (DEM), represented by slope.
As the variables Q (mm) and slope (%) are expressed in different units, they were standardized through reclassification into ordinal susceptibility classes (low to high) to allow their integration within a composite indicator. The Flood Susceptibility Indicator (FSI) was defined as:
This approach is consistent with flood susceptibility studies that combine indicators of hydrological response with topographic controls to identify areas potentially exposed to runoff concentration and accumulation processes (Costache et al., 2020).
Table 3 presents the different ordinal combinations used for constructing the Flood Susceptibility Indicator as well as the associated susceptibility levels.
Runoff depths were reclassified into four ordinal classes (1, 2, 3, and 4), representing increasing levels of runoff production potential. This classification was designed to preserve the spatial variability of runoff among rainfall scenarios and analysis periods.
In contrast, slope was grouped into three ordinal classes (1, 2, and 3), corresponding respectively to areas favorable to runoff accumulation, intermediate conditions, and sectors dominated by flow transfer processes. Lower slopes were assigned higher susceptibility scores because of their greater capacity to retain and concentrate surface runoff.
This methodological choice was intentionally retained to provide a simplified functional representation of the combined influence of runoff production and topographic controls on the spatial redistribution and accumulation of surface water. The resulting indicator does not aim to reproduce hydraulic flood dynamics directly but rather to identify areas where runoff generation and topographic conditions jointly favor flood susceptibility. Such an approach provides a spatially explicit and operational framework for comparing susceptibility patterns under different rainfall scenarios and stages of urban development.

Table 3.
Ordinal combinations used to define flood susceptibility levels.
| Runoff Level (Q) | Qclass | Slope Category | Sclass | FSI = Qclass + Sclass | Flood Susceptibility Level |
|---|---|---|---|---|---|
| Low | 1 | Steep slope | 1 | 2 | Low |
| Low | 1 | Intermediate | 2 | 3 | Low |
| Low | 1 | Gentle slope | 3 | 4 | Moderate |
| Moderate | 2 | Steep slope | 1 | 3 | Low |
| Moderate | 2 | Intermediate | 2 | 4 | Moderate |
| Moderate | 2 | Gentle slope | 3 | 5 | High |
| High | 3 | Steep slope | 1 | 4 | Moderate |
| High | 3 | Intermediate | 2 | 5 | High |
| High | 3 | Gentle slope | 3 | 6 | Very High |
| Very High | 4 | Steep slope | 1 | 5 | High |
| Very High | 4 | Intermediate | 2 | 6 | Very High |
| Very High | 4 | Gentle slope | 3 | 7 | Very High |
The resulting FSI values were subsequently grouped into flood susceptibility classes to identify sectors where high runoff depths coincide with topographic conditions favorable to runoff accumulation.
2.3.6. Methodological Overview
The methodological approach adopted in this study is based on an integrated processing workflow. It is summarized in the flowchart presented in Figure 2:
3. Results
3.1. Land Use/Land Cover Classification
3.1.1. Spatial Evolution of Land Use/Land Cover
The diachronic analysis of land use/land cover highlights the evolution of spatial dynamics within the Gourou and Bonoumin watersheds in 2002, 2016, and 2024 (Figure 3). The results reveal more pronounced transformations in the Bonoumin watershed, characterized by a progressive expansion of built-up surfaces at the expense of vegetated areas (Figure 3).
The maps nevertheless reveal contrasting trajectories between the two watersheds. The Gourou watershed already appeared highly urbanized in 2002, with 70.84% built-up surfaces compared with 24.19% vegetation cover, reflecting an already advanced level of imperviousness. Urbanization progressively intensified, reaching 80.62% built-up areas in 2024, while vegetation decreased to 17.14%. In contrast, the Bonoumin watershed evolved from a predominantly vegetated basin in 2002 (50.95% vegetation and 38.24% built-up areas) toward a predominantly urbanized environment in 2024, characterized by 78.96% built-up surfaces and only 10.49% vegetation cover. This evolution reflects a rapid conversion of vegetated areas into artificial surfaces, particularly visible in the peripheral sectors of the watershed.
Despite the differences in spatial resolution between Landsat 7 and Sentinel-2 imagery, the classifications reveal consistent spatial trends, confirming the progressive intensification of urbanization and surface imperviousness within the two studied watersheds.
3.1.2. Classification Performance
The Random Forest classifications achieved high performances for all studied dates, with Overall Accuracy values exceeding 96% and Kappa coefficients greater than 0.90 for the independent validations. The best performances were obtained for the 2024 Sentinel-2 image (OA > 99%; Kappa > 0.998), reflecting excellent class separability. F1-scores also indicate a progressive improvement between 2002 and 2024, increasing from 0.889 to 1 for built-up surfaces, while water and vegetation classes exhibited values close or equal to 1 for the Sentinel-2 classifications. The confusion matrices further confirm this improvement, with a marked reduction in the confusion observed in 2002 between built-up surfaces, vegetated areas, and certain heterogeneous urban surfaces. These ambiguities became significantly weaker in the Sentinel-2 classifications, reflecting improved urban landscape discrimination resulting from the finer spatial resolution and the integration of spectral indices derived.
3.1.3. Contribution of Spectral Bands and Spectral Indices
The variable importance analysis shows that derived spectral indices account for approximately 45–50% of the total contribution to the Random Forest model depending on the studied dates, confirming their major role in urban class discrimination. This contribution becomes particularly pronounced for the 2016 and 2024 Sentinel-2 classifications, where some indices, especially MNDWI and NDVI_texture, exhibit individual importance values comparable to or higher than several original spectral bands. Nevertheless, the near-infrared (NIR) and shortwave infrared (SWIR) bands remain among the most influential variables, reflecting their strong sensitivity to surface moisture, vegetation, and urban imperviousness.
3.1.4. Illustration of Urban Transformations
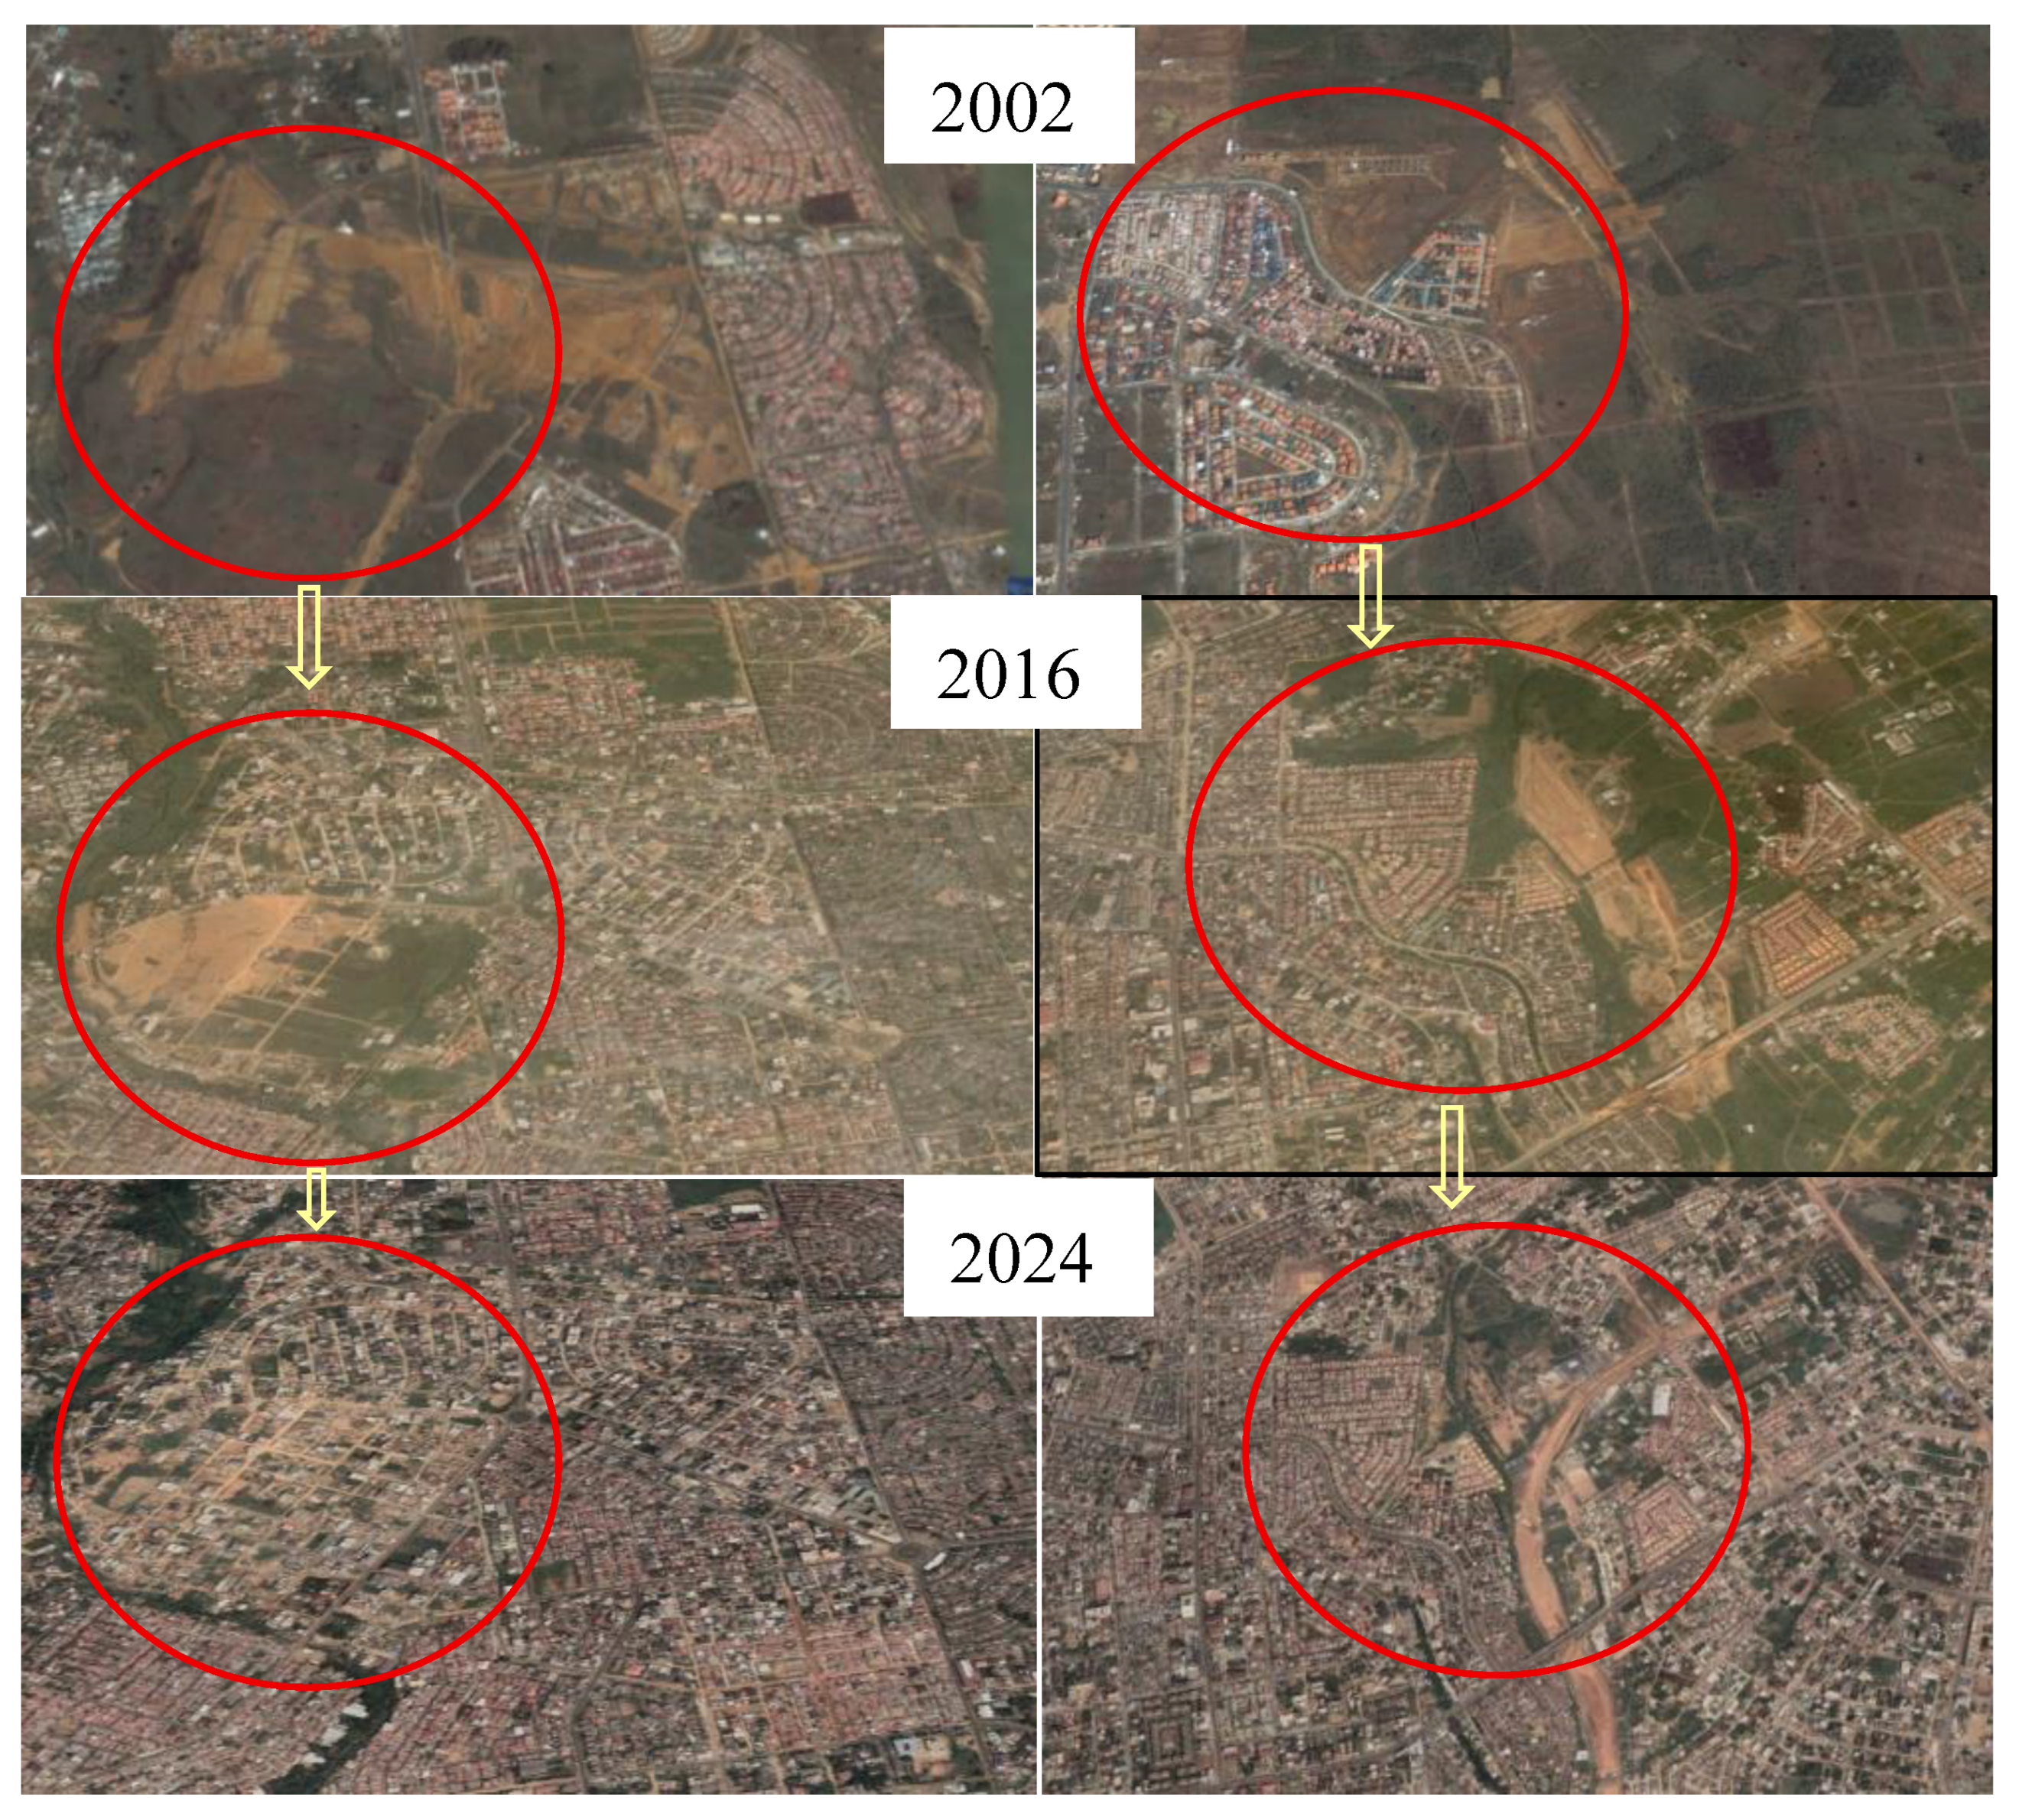
The comparison of high-resolution Google Earth imagery confirms the dynamics identified from the supervised classifications (Figure 4).
The selected areas illustrate a progressive densification of the urban fabric between 2002 and 2024, accompanied by a marked reduction in open spaces and vegetated surfaces. This evolution is particularly visible in the peripheral sectors of the Bonoumin watershed, where the visually observed urban expansion is consistent with the increase in built-up surfaces detected by the Random Forest classification.
Figure 4.
Multi-temporal illustration of land use/land cover evolution in the Bonoumin watershed between 2002 and 2024 using high-resolution imagery (Google Earth).
Figure 4.
Multi-temporal illustration of land use/land cover evolution in the Bonoumin watershed between 2002 and 2024 using high-resolution imagery (Google Earth).
3.2. Hydrological Response to Land Use/Land Cover Changes
The impact of land use/land cover transformations on the hydrological functioning of the Gourou and Bonoumin watersheds is analyzed through the evolution of the Curve Number (CN) and its implications for surface runoff generation potential.
3.2.1. Spatial Distribution of the CN
The CN maps reveal a progressive increase in high CN values between 2002 and 2024 within both watersheds (Figure 5), reflecting an intensification of surface imperviousness and runoff potential.
The Gourou watershed already exhibited a strong dominance of very high CN values in 2002, with 71.08% of the surface associated with a CN value of 98 and a mean CN of 93.11, consistent with its advanced level of urbanization. This dominance persisted in 2024, when surfaces associated with CN 98 reached 77.81% and the mean CN increased to 93.97.
In contrast, the Bonoumin watershed initially displayed a higher proportion of intermediate classes, dominated in 2002 by CN 79 (49.93%) and a mean CN of 87.55, reflecting a still partially vegetated environment. Between 2002 and 2024, areas characterized by very high CN values expanded considerably, with surfaces associated with CN 98 increasing from 38.45% in 2002 to 71.88% in 2024, accompanied by an increase in mean CN from 87.55 to 93.55.
3.2.2. Spatial Distribution of Runoff Depths
To illustrate the hydrological response of the studied watersheds, runoff depths were estimated using the SCS-CN model under different rainfall scenarios and for the three studied dates: 2002, 2016, and 2024 (Figure 6).
The spatial distribution of runoff depths reveals a marked evolution of the hydrological signal between 2002 and 2024, although with differentiated behaviors depending on rainfall intensity. For low rainfall amounts (30 mm), runoff remained spatially contrasted in 2002, with extensive areas characterized by low runoff production. This contrast progressively decreased in 2016 and 2024, when low-runoff areas were substantially reduced in favor of higher runoff values, consistent with a progressive increase in impervious surfaces and reduced infiltration potential.
As rainfall intensity increased (70 and 100 mm), runoff became more generalized and the spatial structure more homogeneous, particularly for the most recent dates. Differences between 2002 and 2024 remained visible, but they were mainly expressed through an intensification of runoff values rather than through major modifications of spatial patterns.
For the extreme rainfall scenario (302 mm), the maps became substantially more homogeneous as early as 2002, with high runoff levels across the entire watersheds. Temporal differences then became marginal, reflecting a near-saturated hydrological state in which the influence of land use/land cover progressively decreases in favor of a dominant rainfall control.
3.2.3. Evolution of the Runoff Coefficient (Cr)
Runoff coefficient () values were estimated for the Gourou and Bonoumin watersheds from the CN values under different rainfall scenarios representative of local hydrological conditions. The rainfall values correspond to cumulative rainfall amounts (mm) and were considered as hydrological scenarios used to evaluate runoff response. Table 4 presents the evolution of for the three study periods (2002, 2016, and 2024) and for four rainfall levels ranging from low to extreme conditions.
The results show an increase in the runoff coefficient () both with increasing rainfall amounts and over time in the two watersheds. The Gourou watershed already exhibited high values in 2002 (0.51 for 30 mm; 0.74 for 70 mm; 0.81 for 100 mm), which further increased in 2024 up to 0.94 for the extreme 302 mm rainfall scenario, reflecting a hydrological functioning close to saturation conditions.
In contrast, the Bonoumin watershed initially displayed lower values in 2002 (0.29 for 30 mm), but experienced a marked increase between 2002 and 2024, particularly for the 70 mm (0.57 → 0.75) and 100 mm (0.67 → 0.82) scenarios, reflecting a progressive intensification of surface imperviousness and runoff generation.
For the extreme 302 mm scenario, both watersheds converged toward very high values (0.91-0.94 in 2024), indicating an almost generalized conversion of rainfall into surface runoff. These results suggest an increasing sensitivity of urbanized watersheds to heavy rainfall events, in a context where the intensification of extreme events could further exacerbate runoff and flood risks in tropical urban environments.
3.2.4. Spatialized Flood Susceptibility Based on the Combination of Runoff and Slope
To identify the areas most favorable to runoff accumulation, the runoff depths estimated for each rainfall scenario were combined with slope derived from the Digital Elevation Model. This approach integrates both runoff production and the topographic conditions favoring water accumulation. Figure 7 presents the spatial distribution of flood susceptibility for the different rainfall scenarios and for the three analysis dates: 2002, 2016, and 2024.
The maps reveal a progressive intensification of flood susceptibility between 2002 and 2024 within the two studied watersheds. Areas classified as High and Very High susceptibility become progressively more extensive and spatially continuous, particularly within urbanized sectors and low-slope areas favorable to water accumulation.
The Bonoumin watershed exhibits the most pronounced evolution, with a substantial increase in surfaces classified as High and Very High between 2002 and 2024. In contrast, the Gourou watershed already appeared highly susceptible as early as 2002, reflecting long-standing urbanization and a high level of runoff connectivity.
Although runoff production increases considerably between the 100 mm and 302 mm rainfall scenarios, the spatial organization of flood susceptibility remains partly controlled by topography through the slope component included in the indicator. Consequently, the spatial differences observed between the Q100, and Q302 scenarios remain relatively moderate.
Nevertheless, the extreme Q302 scenario highlights a broader generalization of High and Very High susceptibility levels, reflecting a convergence toward high runoff-response conditions under extreme rainfall conditions, in which an increasing proportion of urban surfaces contributes to runoff generation.
To better visualize the quantitative evolution of flood susceptibility classes according to rainfall scenarios and study periods, synthesis graphs were produced for the Bonoumin and Gourou watersheds (Figure 8).
The graphs confirm the trends observed in the flood susceptibility maps and highlight a progressive intensification of critical classes between 2002 and 2024 within the two studied watersheds.
In the Bonoumin watershed, a continuous decrease in the Low and Moderate classes is observed in favor of the High and Very High classes, reflecting a progressive increase in areas favorable to runoff generation and accumulation. Under the extreme Q302 scenario, the Very High class notably increased from 20.8% in 2002 to 35.4% in 2024, while critical classes (High + Very High) covered nearly 78% of the watershed area in 2024.
The Gourou watershed exhibits a different dynamic, characterized by a persistent dominance of critical classes throughout the study period. High and Very High classes already represented nearly 80% of the watershed area in 2002, reflecting a high level of flood susceptibility associated with long-standing and dense urbanization. Nevertheless, an increase in the Very High class is also observed in 2024, indicating a strengthening of areas favorable to runoff accumulation.
The Q30, Q70, and Q100 scenarios exhibit relatively similar distributions of susceptibility classes. Although runoff production increases with rainfall intensity, the spatial organization of flood susceptibility remains partly controlled by the topographic component included in the indicator. This stability is also explained by the fact that the Curve Number (CN) varies primarily according to land-use/land-cover evolution between the analyzed dates, while slope remains unchanged.
In contrast, the extreme Q302 scenario highlights a more pronounced shift, characterized by a generalization of High and Very High susceptibility classes and a substantial reduction in low-susceptibility areas. This evolution reflects a convergence toward high runoff-response conditions under extreme rainfall conditions, where an increasing proportion of urban surfaces contributes to runoff generation.
4. Discussion
4.1. Urbanization Dynamics and Surface Transformation
The results reveal substantial urban expansion within the Gourou and Bonoumin watersheds between 2002 and 2024, characterized by a marked increase in built-up areas and a concomitant decline in vegetation cover. These transformations reflect the rapid demographic growth and spatial expansion experienced by Abidjan over the last two decades. The changes were particularly pronounced in the Bonoumin watershed, which evolved from a partially vegetated peri-urban landscape toward a predominantly urbanized environment, consistent with trends reported in several rapidly growing tropical African cities (Jourdan, 2019; Adelekan, 2010).
The spectral indices further confirmed these land-cover transformations. The progressive decrease in NDVI values reflects the reduction of vegetated surfaces, whereas the increase in NDBI highlights the expansion of impervious and built-up areas (Zha et al., 2003). Changes observed in NDVI_texture indicate a progressive reorganization of the urban landscape, characterized by heterogeneous transitional patterns during the urbanization process followed by a more continuous and consolidated urban fabric in recent years. In parallel, variations in MNDWI suggest modifications in the extent and immediate surroundings of water bodies, reflecting the increasing anthropogenic influence on the urban environment (Xu, 2006).
Beyond simple land-cover changes, these transformations have important hydrological implications. The conversion of vegetated and permeable surfaces into impervious urban areas reduces infiltration opportunities while increasing the proportion of rainfall directly converted into surface runoff. Consequently, urbanization not only modifies landscape structure but also alters the hydrological functioning of watersheds by increasing runoff production and accelerating hydrological responses during intense rainfall events. Similar relationships between urban growth, impervious surface expansion, and changes in watershed hydrological behavior have been reported in tropical urban catchments undergoing rapid land-use change (Jourdan, 2019).
The high classification accuracies obtained for all study periods further support the reliability of the observed trends. The integration of multispectral information with derived spectral indices improved the discrimination of spectrally similar classes, particularly between built-up areas, bare soils, and urban vegetation. The combined use of NDVI, SAVI, NDBI, MNDWI, and NDVI_texture therefore contributed to a more robust representation of urban landscape dynamics and provided a reliable basis for the subsequent hydrological analyses (Belgiu and Drăguț, 2016).
4.2. Hydrological Response and Implications for Forecasting
The increase in built-up surfaces is accompanied by a progressive rise in Curve Number (CN) values within both watersheds, reflecting a reduction in infiltration capacity and an intensification of surface runoff. This evolution is particularly pronounced in the Bonoumin watershed, which evolved from a still partially permeable functioning toward a system largely dominated by runoff processes. In contrast, the Gourou watershed already exhibited high CN values in 2002, reflecting a hydrological configuration favorable to runoff generation. These results are consistent with observations reported in other urban contexts where urbanization accelerates watershed hydrological response (Mishra and Singh, 2004; Soulis and Valiantzas, 2012).
The evolution of the runoff coefficient () further confirms this dynamic. For a given rainfall scenario, values increased between 2002 and 2024, with stronger responses observed in the most urbanized areas. The differences observed between rainfall scenarios also indicate that hydrological response remains non-linear. Under low to moderate rainfall conditions, contrasts between watersheds remain significant and mainly reflect differences in imperviousness levels. In contrast, under extreme rainfall conditions, values progressively converge toward high levels, reflecting a hydrological functioning increasingly dominated by surface runoff processes.
Figure 9 illustrates the non-linear nature of watershed hydrological response within the SCS-CN framework. For a given rainfall amount, runoff coefficients increase with increasing Curve Number values, reflecting the progressive reduction of infiltration capacity associated with urbanization. Differences between CN classes remain pronounced under low and moderate rainfall scenarios but progressively decrease under extreme rainfall conditions, where runoff coefficients converge toward high values.
From an operational perspective, the relationships between rainfall, Curve Number, and runoff coefficient provide a useful basis for improving early warning systems. By integrating rainfall scenarios with watershed runoff potential represented by CN values, it becomes possible to move beyond cumulative rainfall thresholds alone and better estimate the capacity of urban catchments to transform rainfall into runoff.
4.3. Methodological Relevance and Operational Implications
Previous studies conducted on the Gourou and Bonoumin watersheds have already highlighted the influence of urbanization on surface runoff through land use/land cover analysis and SCS-CN-based runoff assessment (Kouadio et al., 2024; Kanga et al., 2025). These studies highlighted the expansion of urbanized surfaces, the regression of vegetation cover, and the associated increase in runoff potential. However, the temporal evolution of watershed hydrological response under different rainfall scenarios remains poorly documented.
For the Gourou watershed, Kanga et al. (2025) reported a mean runoff coefficient of approximately 0.42 for a rainfall event of 73.05 mm, which is lower than the values obtained in the present study for a comparable rainfall scenario. This difference may partly reflect methodological differences in the characterization and spatial representation of hydrologic soil groups. In Kanga et al. (2025), soil texture was determined from 19 sampling points and subsequently interpolated using the Inverse Distance Weighting method to derive a continuous soil map across the watershed. Although soil texture is an important control on infiltration, it does not fully characterize soil hydrological behavior. Other hydraulic properties may also influence runoff potential, and considerable variability can occur within individual soil texture classes (Ross et al., 2018). Consequently, differences in soil characterization and spatial representation may influence Curve Number assignment and partly explain the differences in runoff estimates between the two studies.
Although the runoff estimates obtained in this study could not be validated against hydrological measurements, the consistency of the observed trends with previous studies supports their hydrological coherence. In addition, the CN-based approach adopted here is consistent with the USDA hydrologic soil-group framework documented by Ross et al. (2018), in which runoff potential is represented through the combined influence of soil hydrological characteristics and land cover. This methodological consistency does not constitute an independent validation of the absolute runoff values, but it strengthens confidence in the temporal trends identified, particularly the progressive increase in runoff response associated with urbanization.
In this context, the present study provides several complementary contributions. First, the combined use of urban-adapted spectral indices and the Random Forest algorithm improve the representation of intermediate urbanization states, which are often difficult to characterize using conventional classification approaches. Second, the integration of the SCS-CN model allows the quantification of runoff generation potential under contrasting rainfall scenarios for different stages of urbanization. Finally, the relationships established between rainfall, Curve Number, and runoff response extend these results toward operational applications by providing a simplified framework directly linking urbanization trajectories to spatial indicators that can potentially support flood forecasting and urban flood risk management in poorly instrumented tropical environments.
4.4. Limitations and Uncertainties
Several limitations should be considered when interpreting the results. The successive use of Landsat 7 and Sentinel-2 imagery introduces differences in spatial resolution that may affect detailed inter-date comparisons, while the heterogeneity of urban surfaces may generate spectral confusion between certain classes despite the good performance of the Random Forest model (Weng, 2012). Spectral indices also remain sensitive to acquisition conditions and local surface properties (Small, 2001).
From a hydrological perspective, uncertainties mainly arise from the assumptions of the SCS-CN model and the absence of detailed local hydrological measurements (Hawkins et al., 2009). The results should therefore be interpreted as spatialized estimates of runoff potential and flood susceptibility rather than as exhaustive simulations of observed discharge. In addition, the flood susceptibility approach developed in this study is primarily based on the combination of runoff potential and slope, without explicitly accounting for drainage capacity, urban microtopography, or hydraulic infrastructures, although these factors are recognized as important drivers of urban flood dynamics (Bruwier et al., 2020).
These limitations open several research perspectives, including the integration of high-resolution topographic variables, the use of Sentinel-1 radar data for flooded area validation, and the development of hybrid approaches combining remote sensing, hydrological modeling, and artificial intelligence (Zhu et al., 2017; Reichstein et al., 2019). Future integration of urban exposure indicators, such as residential areas or critical infrastructures, could also support the transition from hydrological potential mapping toward a more comprehensive urban flood risk assessment approach in tropical urban environments.
5. Conclusions
This study developed and applied a low-cost remote sensing framework designed to be transferable for analyzing the effects of urbanization on runoff generation and runoff susceptibility in rapidly urbanizing tropical watersheds. The approach combines freely available multi-temporal satellite imagery, urban-adapted spectral indices, supervised Random Forest classification, and the SCS-CN method. It was applied to the Gourou and Bonoumin watersheds in Abidjan, Côte d’Ivoire, over the 2002–2024 period.
The results show a consistent relationship between the expansion of built-up areas, increasing Curve Number values, and the intensification of runoff potential. This transformation was particularly pronounced in Bonoumin, where urbanization accelerated substantially over the study period, whereas Gourou was already highly urbanized at the beginning of the period. The rainfall-scenario analysis further shows that the hydrological effects of urbanization become increasingly pronounced as rainfall increases. While the Q30, Q70, and Q100 scenarios display relatively similar spatial patterns, the extreme Q302 scenario results in a widespread expansion of areas with high runoff susceptibility across both watersheds. This contrast highlights the combined effect of surface imperviousness and heavy rainfall on urban hydrological response.
From a methodological perspective, the combination of urban-adapted spectral indices and Random Forest classification enables the characterization of land use/land cover changes required to analyze the hydrological evolution of the watersheds. Their integration with hydrologic soil groups within the SCS-CN framework provides a relatively simple methodological chain for translating urbanization trajectories into spatially explicit changes in runoff potential. The primary reliance on freely available satellite and geospatial data limits field-data requirements and makes this approach particularly relevant for rapidly urbanizing and poorly gauged tropical cities.
Absolute runoff values should, however, be interpreted with caution. The absence of observed discharge time series in the Gourou and Bonoumin watersheds did not allow direct validation of the estimates produced using the SCS-CN method. The results should therefore be considered primarily as indicators of the spatial and temporal evolution of runoff potential rather than as a reproduction of observed discharge. Nevertheless, the consistency of the identified trends with land use/land cover changes and with the hydrological mechanisms represented by the SCS-CN framework strengthens the overall interpretation of increasing runoff potential associated with urbanization. Future rainfall–runoff observations would allow local calibration and validation of model parameters and improve the quantification of hydrological response at the event scale.
Beyond Abidjan, this methodological framework has the potential to be applied to other rapidly urbanizing tropical cities facing limited availability of hydrological data. The spatial indicators produced can help identify areas where land use/land cover changes and hydrological characteristics favor high runoff generation, thereby providing useful information for urban planning and flood preparedness.
Future developments should integrate higher-resolution topographic data, radar and hydrometeorological observations, improved characterization of flow transfer and accumulation processes, and subsequently evolve toward physically based approaches, while incorporating information on population and infrastructure exposure. These developments would allow the current runoff analysis framework to evolve toward a more comprehensive assessment of urban flood susceptibility and, ultimately, flood risk, while retaining the advantages associated with accessible data and the reproducibility of the approach.
Credit Authorship Contribution Statement
Bérenger Adou KOUACOU: Conceptualization, Methodology, Formal analysis, Investigation, Data curation, Visualization, Writing – original draft. Valérie BORRELL ESTUPINA: Conceptualization, Methodology, Formal analysis, Supervision, Validation, Writing – review & editing. Jean-Emmanuel PATUREL: Conceptualization, Formal analysis, Supervision, Validation, Writing – review & editing. Fernand Kouamé KOFFI: Validation, Writing – review & editing. Andrew OGILVIE: Supervision, Validation, Writing – review & editing. Christina OPIESCHNIG: Validation, Writing – review & editing. Bernard Djè KOUAKOU: Resources. Daouda KONATÉ: Resources.
Acknowledgments
This work benefited from the support of the IRN ACTNAO program (Updating Hydrological Standards in West Africa) funded by IRD and associated with UNESCO IHP FRIEND-Water, an initiative aimed at strengthening hydrological and climate knowledge in West Africa. We express our gratitude to the Société d’Exploitation et de Développement Aéroportuaire, Aéronautique et Météorologique (SODEXAM) for providing rainfall data and for the technical and institutional support that contributed to this study.
Declaration of Competing Interest
The authors declare that they have no known competing financial interests or personal relationships that could have appeared to influence the work reported in this paper.
Data Availability Statement
The satellite imagery used in this study is publicly available through the Google Earth Engine platform. Rainfall data were provided by SODEXAM (Airport, Aeronautical and Meteorological Operations and Development Company), the national agency responsible for meteorological, climatological, and aeronautical services in Côte d’Ivoire. These data are available from the corresponding author upon reasonable request, subject to the data-sharing policies of SODEXAM.
Appendix A. Characterization of Spectral Indices
| Index | Formula | Spectral Bands Used | Main Purpose | Relevance in Urban Environments | Reference |
| NDVI | (NIR − Red) / (NIR + Red) | NIR, Red | Detection of vegetation vigor | Distinguishes vegetated surfaces from built-up areas and bare soil | Rouse et al., 1974 |
| SAVI | ((NIR − Red) / (NIR + Red + L)) × (1 + L), L = 0.5 | NIR, Red | Vegetation detection with soil correction | Reduces soil background influence in sparse or degraded vegetation | Huete, 1988 |
| NDBI | (SWIR − NIR) / (SWIR + NIR) | SWIR, NIR | Built-up area detection | Highlights impervious urban surfaces such as buildings and roads | Zha et al., 2003 |
| MNDWI | (Green − SWIR) / (Green + SWIR) | Green, SWIR | Water detection | Improves separation between water and built-up areas in urban environments | Xu, 2006 |
| NDVI_texture | Texture metric derived from NDVI (e.g., variance or entropy) | NDVI | Vegetation spatial heterogeneity | Captures vegetation fragmentation in urban landscapes (parks, gardens, tree patches) | Herold et al., 2003 |
Appendix B. Diachronic Evolution of Spectral Indices (2002, 2016, and 2024)
| Indice | Basin | 2002 Min | 2002 Mean | 2002 Max | 2016 Min | 2016 Mean | 2016 Max | 2024 Min | 2024 Mean | 2024 Max |
| NDVI | Gourou | 0.06 | 0.29 | 0.58 | -0.01 | 0.13 | 0.42 | 0.01 | 0.12 | 0.38 |
| Bonoumin | 0.09 | 0.39 | 0.67 | 0.16 | 0.02 | 0.48 | 0.00 | 0.12 | 0.39 | |
| NDBI | Gourou | -0.34 | 0.05 | 0.40 | -0.25 | 0.06 | 0.27 | -0.18 | 0.02 | 0.20 |
| Bonoumin | -0.35 | 0.01 | 0.31 | -0.19 | 0.08 | 0.56 | -0.11 | 0.05 | 0.25 | |
| MNDWI | Gourou | -0.63 | -0.37 | 0.19 | -0.39 | -0.19 | 0.12 | -0.38 | -0.20 | -0.02 |
| Bonoumin | -0.58 | -0.44 | 0.16 | -0.17 | -0.25 | 0.05 | -0.41 | -0.21 | -0.02 | |
| SAVI | Gourou | 0.03 | 0.15 | 0.37 | -0.02 | 0.19 | 0.64 | 0.02 | 0.19 | 0.57 |
| Bonoumin | 0.04 | 0.22 | 0.43 | 0.04 | 0.25 | 0.72 | 0.01 | 0.18 | 0.59 | |
| NDVI_texture | Gourou | 0.00 | 0.03 | 0.14 | 0.37 | 7.17 | 63.80 | 0.33 | 5.16 | 32.40 |
| Bonoumin | 0.00 | 0.03 | 0.12 | 0.21 | 9.43 | 60.16 | 0.30 | 6.34 | 41.13 |
Appendix C. Distribution (%) and Mean Curve Number (CN) Values by Watershed
| CN | Gourou 2002 | Gourou 2016 | Gourou 2024 | Bonoumin 2002 | Bonoumin 2016 | Bonoumin 2024 |
| 69 | 0.04 | 0.12 | 0.03 | 0.83 | 0.64 | 0.80 |
| 79 | 23.97 | 29.42 | 20.58 | 49.93 | 36.43 | 19.18 |
| 84 | 0.02 | 0.10 | 0.00 | 0.05 | 0.08 | 0.08 |
| 86 | 0.00 | 0.01 | 0.00 | 0.02 | 0.03 | 0.01 |
| 91 | 4.62 | 0.49 | 1.58 | 10.37 | 4.42 | 8.04 |
| 94 | 0.00 | 0.00 | 0.00 | 0.00 | 0.00 | 0.00 |
| 98 | 71.08 | 69.86 | 77.81 | 38.45 | 58.40 | 71.88 |
| 100 | 0.27 | 0.00 | 0.00 | 0.35 | 0.00 | 0.00 |
| CN mean | 93.11 | 92.33 | 93.97 | 87.55 | 90.57 | 93.55 |
References
- Adelekan, I.O., 2010. Vulnerability of poor urban coastal communities to flooding in Lagos, Nigeria. Environment and Urbanization, 22(2), 433–450. [CrossRef]
- Belgiu, M., Drăguț, L., 2016. Random Forest in remote sensing: A review of applications and future directions. ISPRS Journal of Photogrammetry and Remote Sensing, 114, 24–31. [CrossRef]
- Breiman, L., 2001. Random Forests. Machine Learning, 45(1), 5–32. [CrossRef]
- Bruwier, M., Maravat, C., Mustafa, A., Teller, J., Pirotton, M., Erpicum, S., Archambeau, P., Dewals, B., 2020. Influence of urban forms on surface flow in urban pluvial flooding. Journal of Hydrology, 582, 124493. [CrossRef]
- Colon, M., Rieu, T., 2022. Surmonter les barrières institutionnelles et organisationnelles à l’assainissement : quoi de neuf ? Rapport technique No. 68, Agence Française de Développement (AFD), Paris, France.
- Congalton, R.G., 1991. A review assessing the accuracy of classifications of remotely sensed data. Remote Sensing of Environment, 37(1), 35–46. [CrossRef]
- Costache, R., Pham, Q.B., Sharifi, E., Linh, N.T.T., Abba, S.I., Vojtek, M., Vojteková, J., Nhi, P.T.T., Khoi, D.N., 2020. Flash-flood susceptibility assessment using multi-criteria decision making and machine learning supported by remote sensing and GIS techniques. Remote Sensing, 12(1), 106. [CrossRef]
- Di Baldassarre, G., Montanari, A., Lins, H., Koutsoyiannis, D., Brandimarte, L., Blöschl, G., 2010. Flood fatalities in Africa: From diagnosis to mitigation. Geophysical Research Letters, 37(22), L22402. [CrossRef]
- Douglas, I., Alam, K., Maghenda, M., McDonnell, Y., McLean, L., Campbell, J., 2008. Unjust waters: Climate change, flooding and the urban poor in Africa. Environment and Urbanization, 20(1), 187–205. [CrossRef]
- Ekwule, O.R., Agunwamba, J.C., 2024. Application of the NRCS-Curve Number method in humid tropical basins of Southeastern Nigeria: A statistical analysis. Environmental Systems Research, 13, 52. [CrossRef]
- Foody, G.M., 2002. Status of land cover classification accuracy assessment. Remote Sensing of Environment, 80(1), 185–201. [CrossRef]
- Gislason, P.O., Benediktsson, J.A., Sveinsson, J.R., 2006. Random forests for land cover classification. Pattern Recognition Letters, 27(4), 294–300. [CrossRef]
- Gorelick, N., Hancher, M., Dixon, M., Ilyushchenko, S., Thau, D., Moore, R., 2017. Google Earth Engine: Planetary-scale geospatial analysis for everyone. Remote Sensing of Environment, 202, 18–27. [CrossRef]
- Hawkins, R.H., Ward, T.J., Woodward, D.E., Van Mullem, J.A., 2009. Curve Number Hydrology: State of the Practice. American Society of Civil Engineers, Reston, VA.
- Herold, M., Gardner, M.E., Roberts, D.A., 2003. Spectral resolution requirements for mapping urban areas. IEEE Transactions on Geoscience and Remote Sensing, 41(9), 1907–1919. [CrossRef]
- Huete, A.R., 1988. A soil-adjusted vegetation index (SAVI). Remote Sensing of Environment, 25(3), 295–309. [CrossRef]
- Institut National de la Statistique (INS), 2021. Recensement Général de la Population et de l’Habitat (RGPH 2021). Institut National de la Statistique, Abidjan, Côte d’Ivoire.
- IPCC, 2022. Climate Change 2022: Impacts, Adaptation and Vulnerability. Contribution of Working Group II to the Sixth Assessment Report of the Intergovernmental Panel on Climate Change. Cambridge University Press, Cambridge, UK and New York, USA.
- Jourdan, C., 2019. Mixed instrumentation–hydrological modelling approach at multiple scales in a poorly gauged tropical basin subject to land-use changes: The case of the Méfou basin (Yaoundé, Cameroon). PhD thesis, University of Montpellier, France, 347 p.
- Jourdan, C., Borrell Estupina, V., Moussa, R., Sebag, D., Rouché, N., Bricquet, J.-P., Boyer, J.-F., Ndam Ngoupayou, J.R., Ngounou Ngatcha, B., Van Exter, S., Servat, E., 2017. Impact of land use change on the hydrological processes of a peri-urban tropical catchment: The Méfou and Mfoundi Basins, Yaoundé, Cameroon. IAHS Scientific Assembly 2017, Port Elizabeth, South Africa.
- Kanga, K.E., Kouassi, K.H., Tanoh, K.J.-C., Konan, Y.E.D., Konan-Waidhet, A.B., 2025. Modeling urban surface runoff in tropical watersheds using the SCS-CN method on Google Earth Engine: Case of the Gourou Basin. Asian Journal of Geographical Research, 8(4), 30–43. [CrossRef]
- Khattab, M.I., Fadl, M.E., Megahed, H.A., Saleem, A.M., El-Saadawy, O., Drosos, M., Scopa, A., Selim, M.K., 2025. Evaluation of the Soil Conservation Service Curve Number (SCS-CN) method for flash flood runoff estimation in arid regions: A case study of Central Eastern Desert, Egypt. Hydrology, 12(3), 54. [CrossRef]
- Konaté, L., Kouadio, B.H., Djè, B.K., Ake, G.E., N’Guessan Bi, V.H., Gnagne, L., Kouame, E.M.K., Biemi, J., 2016. Characterization of intense daily rainfall and flood recurrence: Contribution of three-day moving rainfall totals to the determination of a flood threshold in the Abidjan District, southeastern Côte d’Ivoire. International Journal of Innovation and Applied Studies, 17(3), 990–1003.
- Kouadio, K.A.P., Koffi, Y.B., Kamagate, A., Ahoussi, K.E., Kouassi, A.M., 2024. Evolution of land use in highly urbanized watersheds and its impacts on surface runoff: Case of Bonoumin and Gourou (Abidjan, Côte d’Ivoire, West Africa). International Journal of Innovation and Applied Studies, 41(3), 729–744.
- Louppe, G., Wehenkel, L., Sutera, A., Geurts, P., 2013. Understanding variable importances in forests of randomized trees. Advances in Neural Information Processing Systems, 26, 431–439.
- Maxwell, A.E., Warner, T.A., Fang, F., 2018. Implementation of machine-learning classification in remote sensing: An applied review. International Journal of Remote Sensing, 39(9), 2784–2817. [CrossRef]
- Miguez, M.G., Battemarco, B.P., De Sousa, M.M., Rezende, O.M., Veról, A.P., Gusmaroli, G., 2017. Urban flood simulation using MODCEL—An alternative quasi-2D conceptual model. Water, 9(6), 445. [CrossRef]
- Mishra, S.K., Singh, V.P., 2004. Long-term hydrological simulation based on the Soil Conservation Service curve number. Hydrological Processes, 18, 1291–1313. [CrossRef]
- Nunes, E.D., Romão, P.D.A., Sales, M.M., Da Luz, M.P., 2021. Geoprocessing applied in the estimate of infiltration and surface runoff in HPP’s contribution watershed. Journal of Geographic Information System, 13(6), 643–659.
- Reichstein, M., Camps-Valls, G., Stevens, B., Jung, M., Denzler, J., Carvalhais, N., Prabhat, 2019. Deep learning and process understanding for data-driven Earth system science. Nature, 566, 195–204. [CrossRef]
- Ouattara, Z.A., Kabo-Bah, A.T., Dongo, K., Akpoti, K., Siabi, E.K., Kablan, M.K.A., Kangah, K.M., 2023. Operational and structural diagnosis of sewerage and drainage networks in Côte d’Ivoire, West Africa. Frontiers in Sustainable Cities, 5, 1032459. [CrossRef]
- Rodriguez-Galiano, V.F., Ghimire, B., Rogan, J., Chica-Olmo, M., Rigol-Sanchez, J.P., 2012. An assessment of the effectiveness of a random forest classifier for land-cover classification. ISPRS Journal of Photogrammetry and Remote Sensing, 67, 93–104. [CrossRef]
- Ross, C.W., Prihodko, L., Anchang, J., Kumar, S., Ji, W., Hanan, N.P., 2018. HYSOGs250m, global gridded hydrologic soil groups for curve-number-based runoff modeling. Scientific Data, 5, 180091. [CrossRef]
- Rouse, J.W., Haas, R.H., Schell, J.A., Deering, D.W., 1974. Monitoring vegetation systems in the Great Plains with ERTS. In: Third Earth Resources Technology Satellite-1 Symposium, NASA SP-351, Vol. 1, Washington, DC, pp. 309–317.
- Satin, M., Bourrier, R., Selmi, B., 1999. Guide technique de l’assainissement : évacuation des eaux usées et pluviales, conception et composants des réseaux, épuration des eaux et protection de l’environnement, exploitation et gestion des systèmes d’assainissement. 2nd ed., Le Moniteur, Paris, France, 680 p.
- Small, C., 2001. Estimation of urban vegetation abundance by spectral mixture analysis. International Journal of Remote Sensing, 22(7), 1305–1334. [CrossRef]
- Société d’Exploitation et de Développement Aéroportuaire, Aéronautique et Météorologique (SODEXAM), 2022. Meteorological rainfall data for Abidjan. Direction de la Météorologie Nationale, Abidjan, Côte d’Ivoire.
- Soulis, K.X., Valiantzas, J.D., 2012. SCS-CN parameter determination using rainfall-runoff data in heterogeneous watersheds – the two-CN system approach. Hydrology and Earth System Sciences, 16, 1001–1015. [CrossRef]
- USDA-NRCS, 2004. National Engineering Handbook, Part 630 Hydrology, Chapter 10: Estimation of Direct Runoff from Storm Rainfall. Natural Resources Conservation Service, U.S. Department of Agriculture, Washington, DC.
- USDA-SCS, 1972. SCS National Engineering Handbook, Section 4: Hydrology. Soil Conservation Service, U.S. Department of Agriculture, Washington, DC.
- Weng, Q., 2012. Remote sensing of impervious surfaces in the urban areas: Requirements, methods, and trends. Remote Sensing of Environment, 117, 34–49. [CrossRef]
- World Meteorological Organization (WMO), 2024. State of the Global Climate 2023. Geneva, Switzerland.
- World Meteorological Organization (WMO), United Nations Office for Disaster Risk Reduction (UNDRR), 2023. Global Status of Multi-Hazard Early Warning Systems 2023. Geneva, Switzerland.
- Xu, H., 2006. Modification of normalised difference water index (NDWI) to enhance open water features in remotely sensed imagery. International Journal of Remote Sensing, 27(14), 3025–3033. [CrossRef]
- Yao, C., Kacou, M., Koffi, E.S., Dao, A., Dutremble, C., Guilliod, M., Kamagaté, B., Perrin, J.-L., Salles, C., Neppel, L., Paturel, J.-E., Zahiri, E.P., Séguis, L., 2024. Rainfall risk over the city of Abidjan (Côte d’Ivoire): first contribution of the joint analysis of daily rainfall from a historical record and a recent network of rain gauges. Proceedings of the International Association of Hydrological Sciences, 385, 259–265. [CrossRef]
- Zha, Y., Gao, J., Ni, S., 2003. Use of normalized difference built-up index in automatically mapping urban areas from TM imagery. International Journal of Remote Sensing, 24(3), 583–594. [CrossRef]
- Zhu, X.X., Tuia, D., Mou, L., Xia, G.S., Zhang, L., Xu, F., Fraundorfer, F., 2017. Deep learning in remote sensing: A comprehensive review and list of resources. IEEE Geoscience and Remote Sensing Magazine, 5(4), 8–36. [CrossRef]
Figure 1.
Location map of the Gourou and Bonoumin watersheds in the heart of Abidjan.
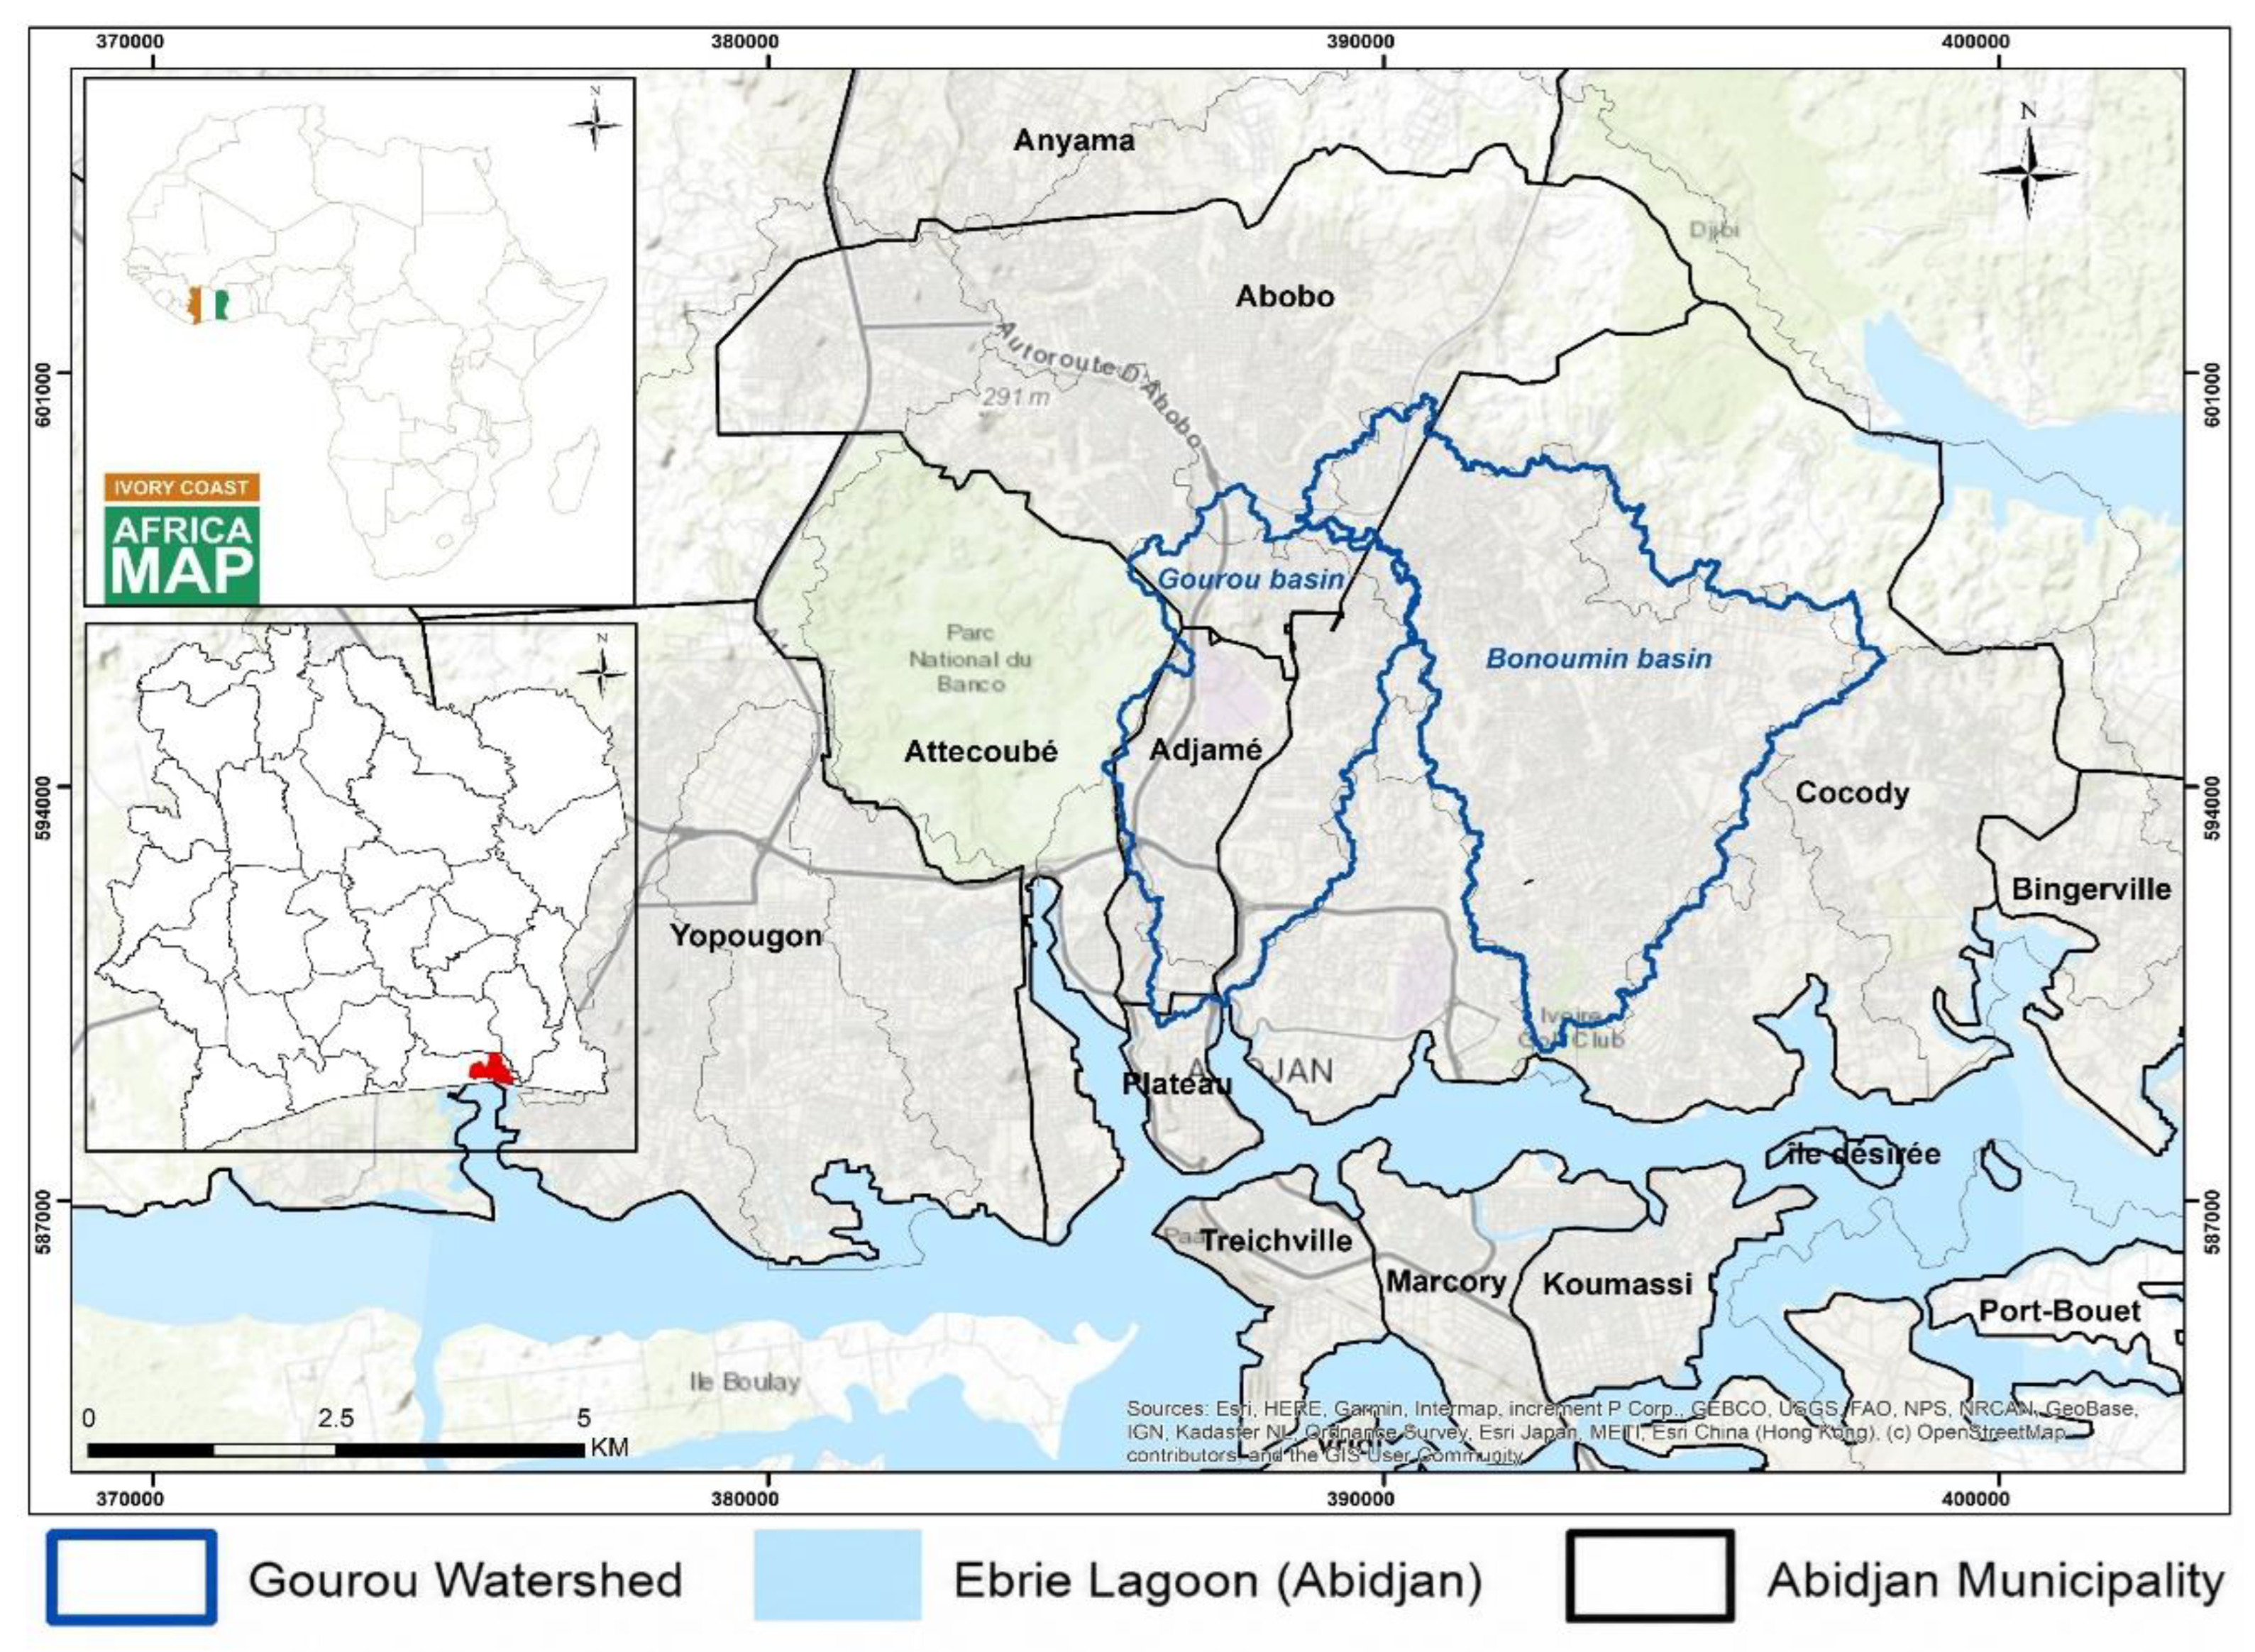
Figure 2.
Schematic flowchart of methodology.
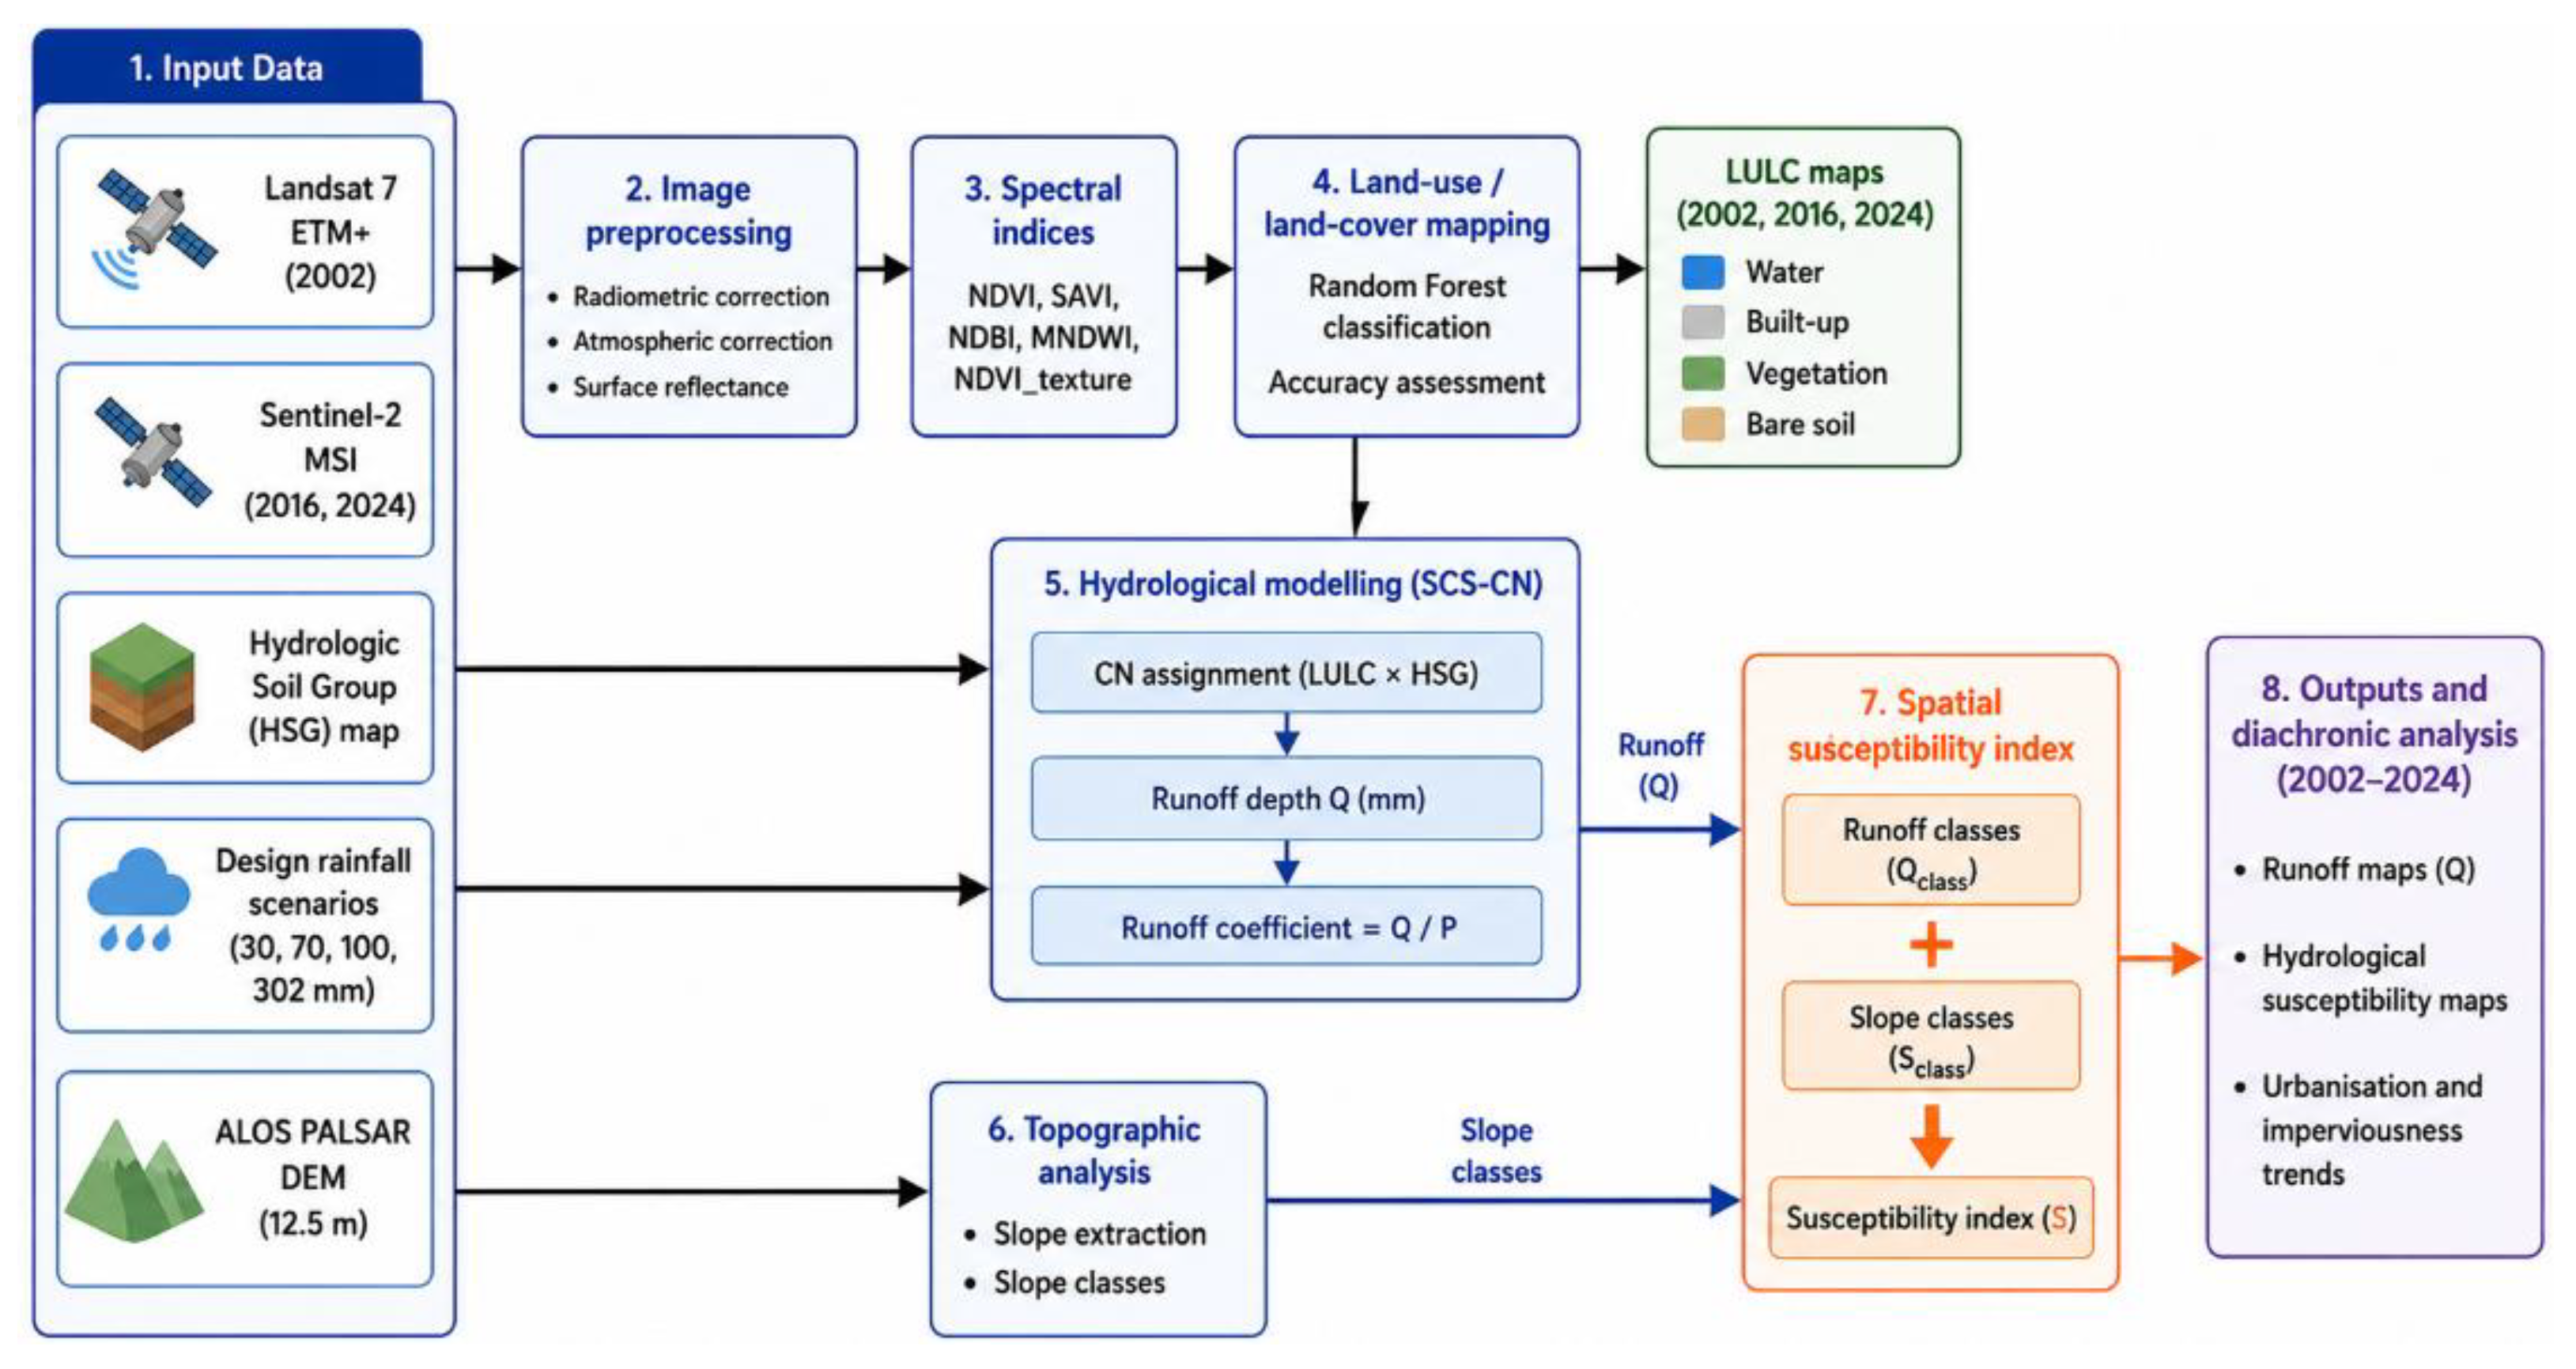
Figure 3.
Land use/land cover maps showing urbanization dynamics between2002 and 2024.
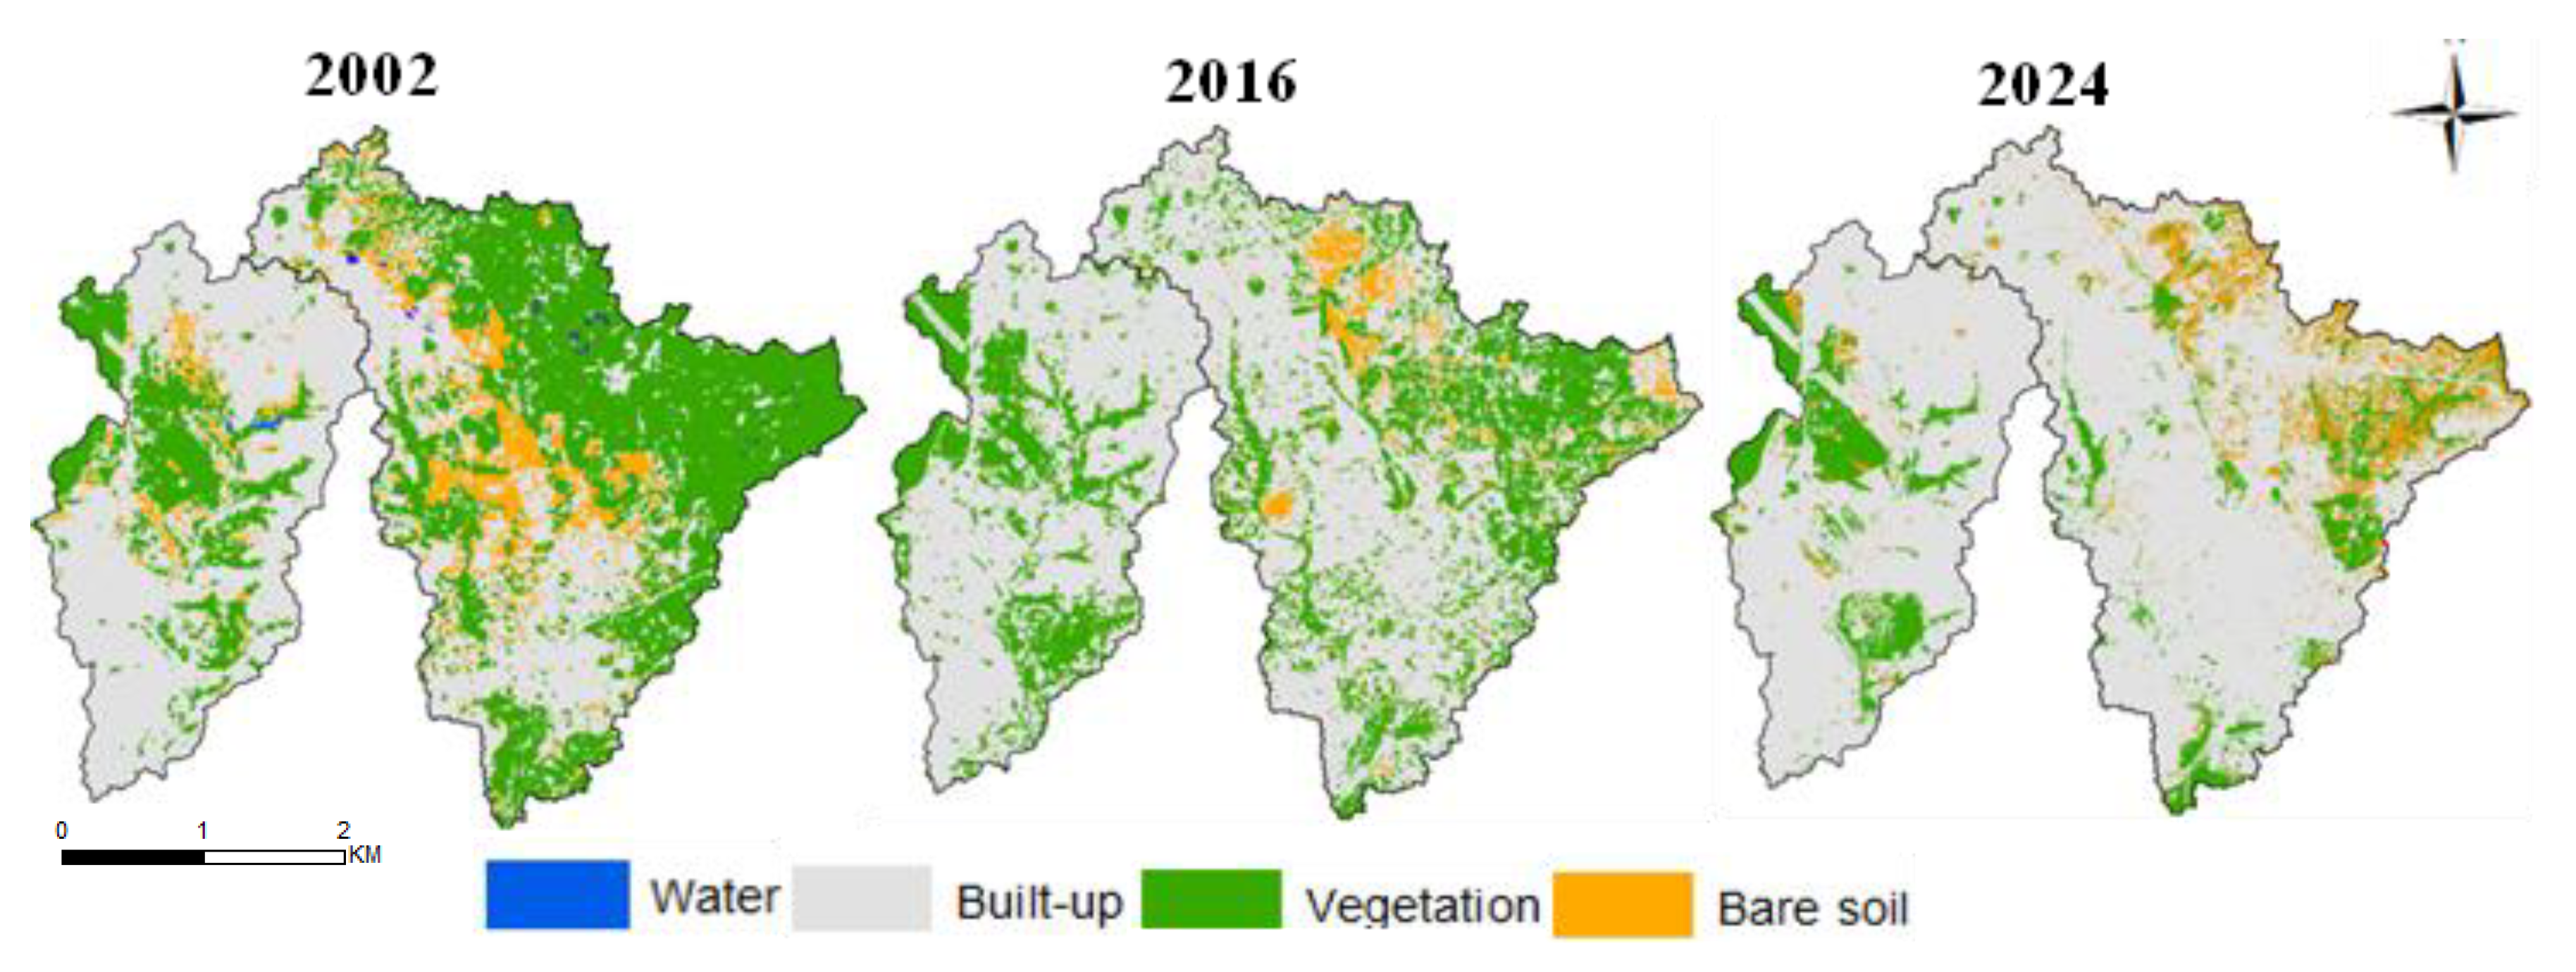
Figure 5.
Spatial distribution and temporal evolution of CN in the Gourou and Bonoumin basins (2002, 2016, 2024).
Figure 5.
Spatial distribution and temporal evolution of CN in the Gourou and Bonoumin basins (2002, 2016, 2024).
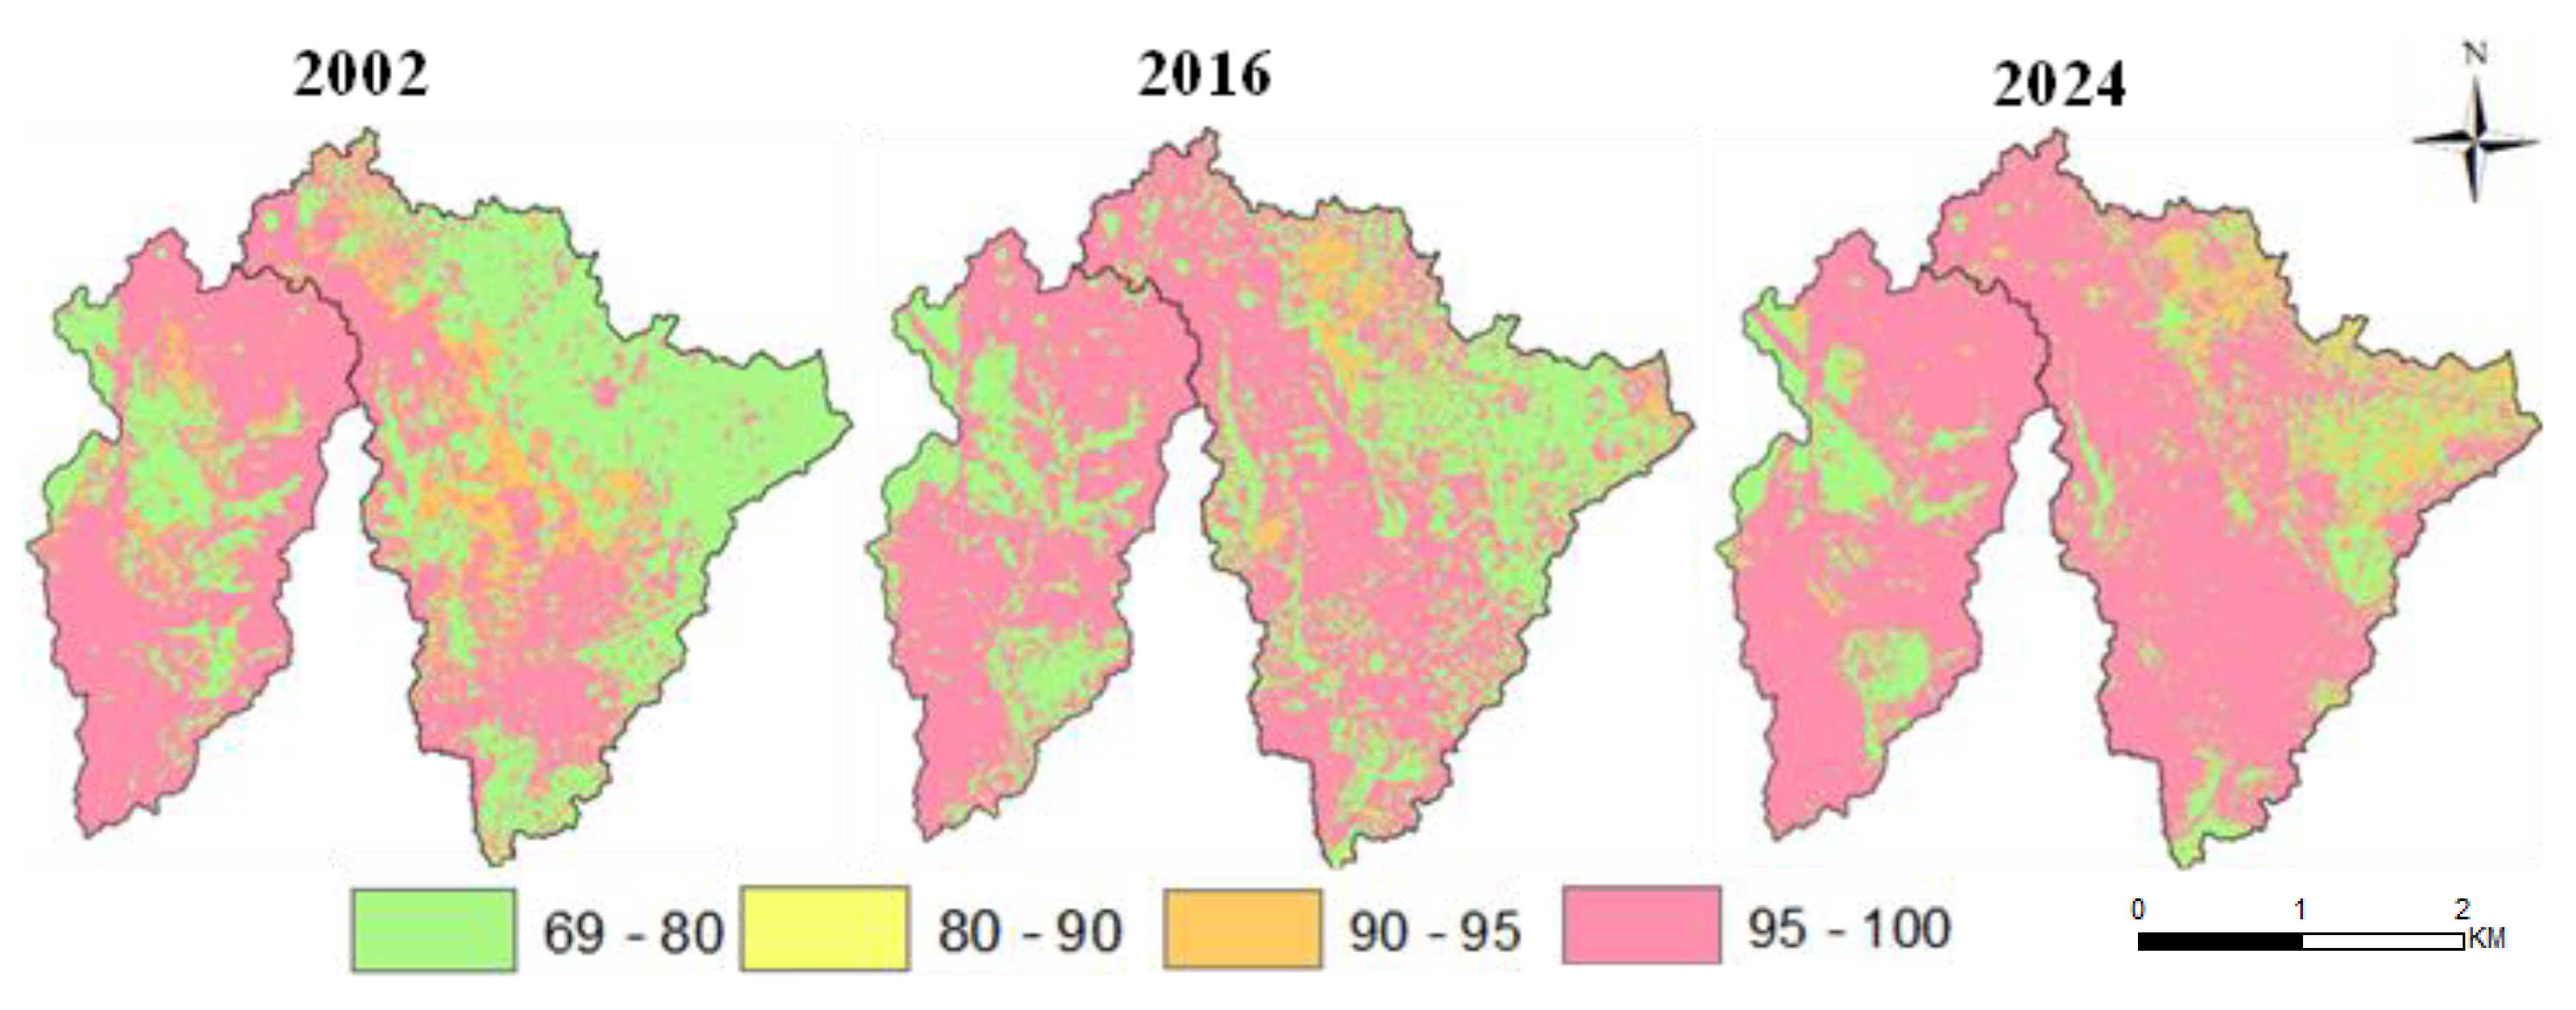
Figure 6.
Spatial distribution of runoff depths (Q, mm) under rainfall scenarios of 30, 70, 100, and 302 mm for 2002, 2016, and 2024.
Figure 6.
Spatial distribution of runoff depths (Q, mm) under rainfall scenarios of 30, 70, 100, and 302 mm for 2002, 2016, and 2024.
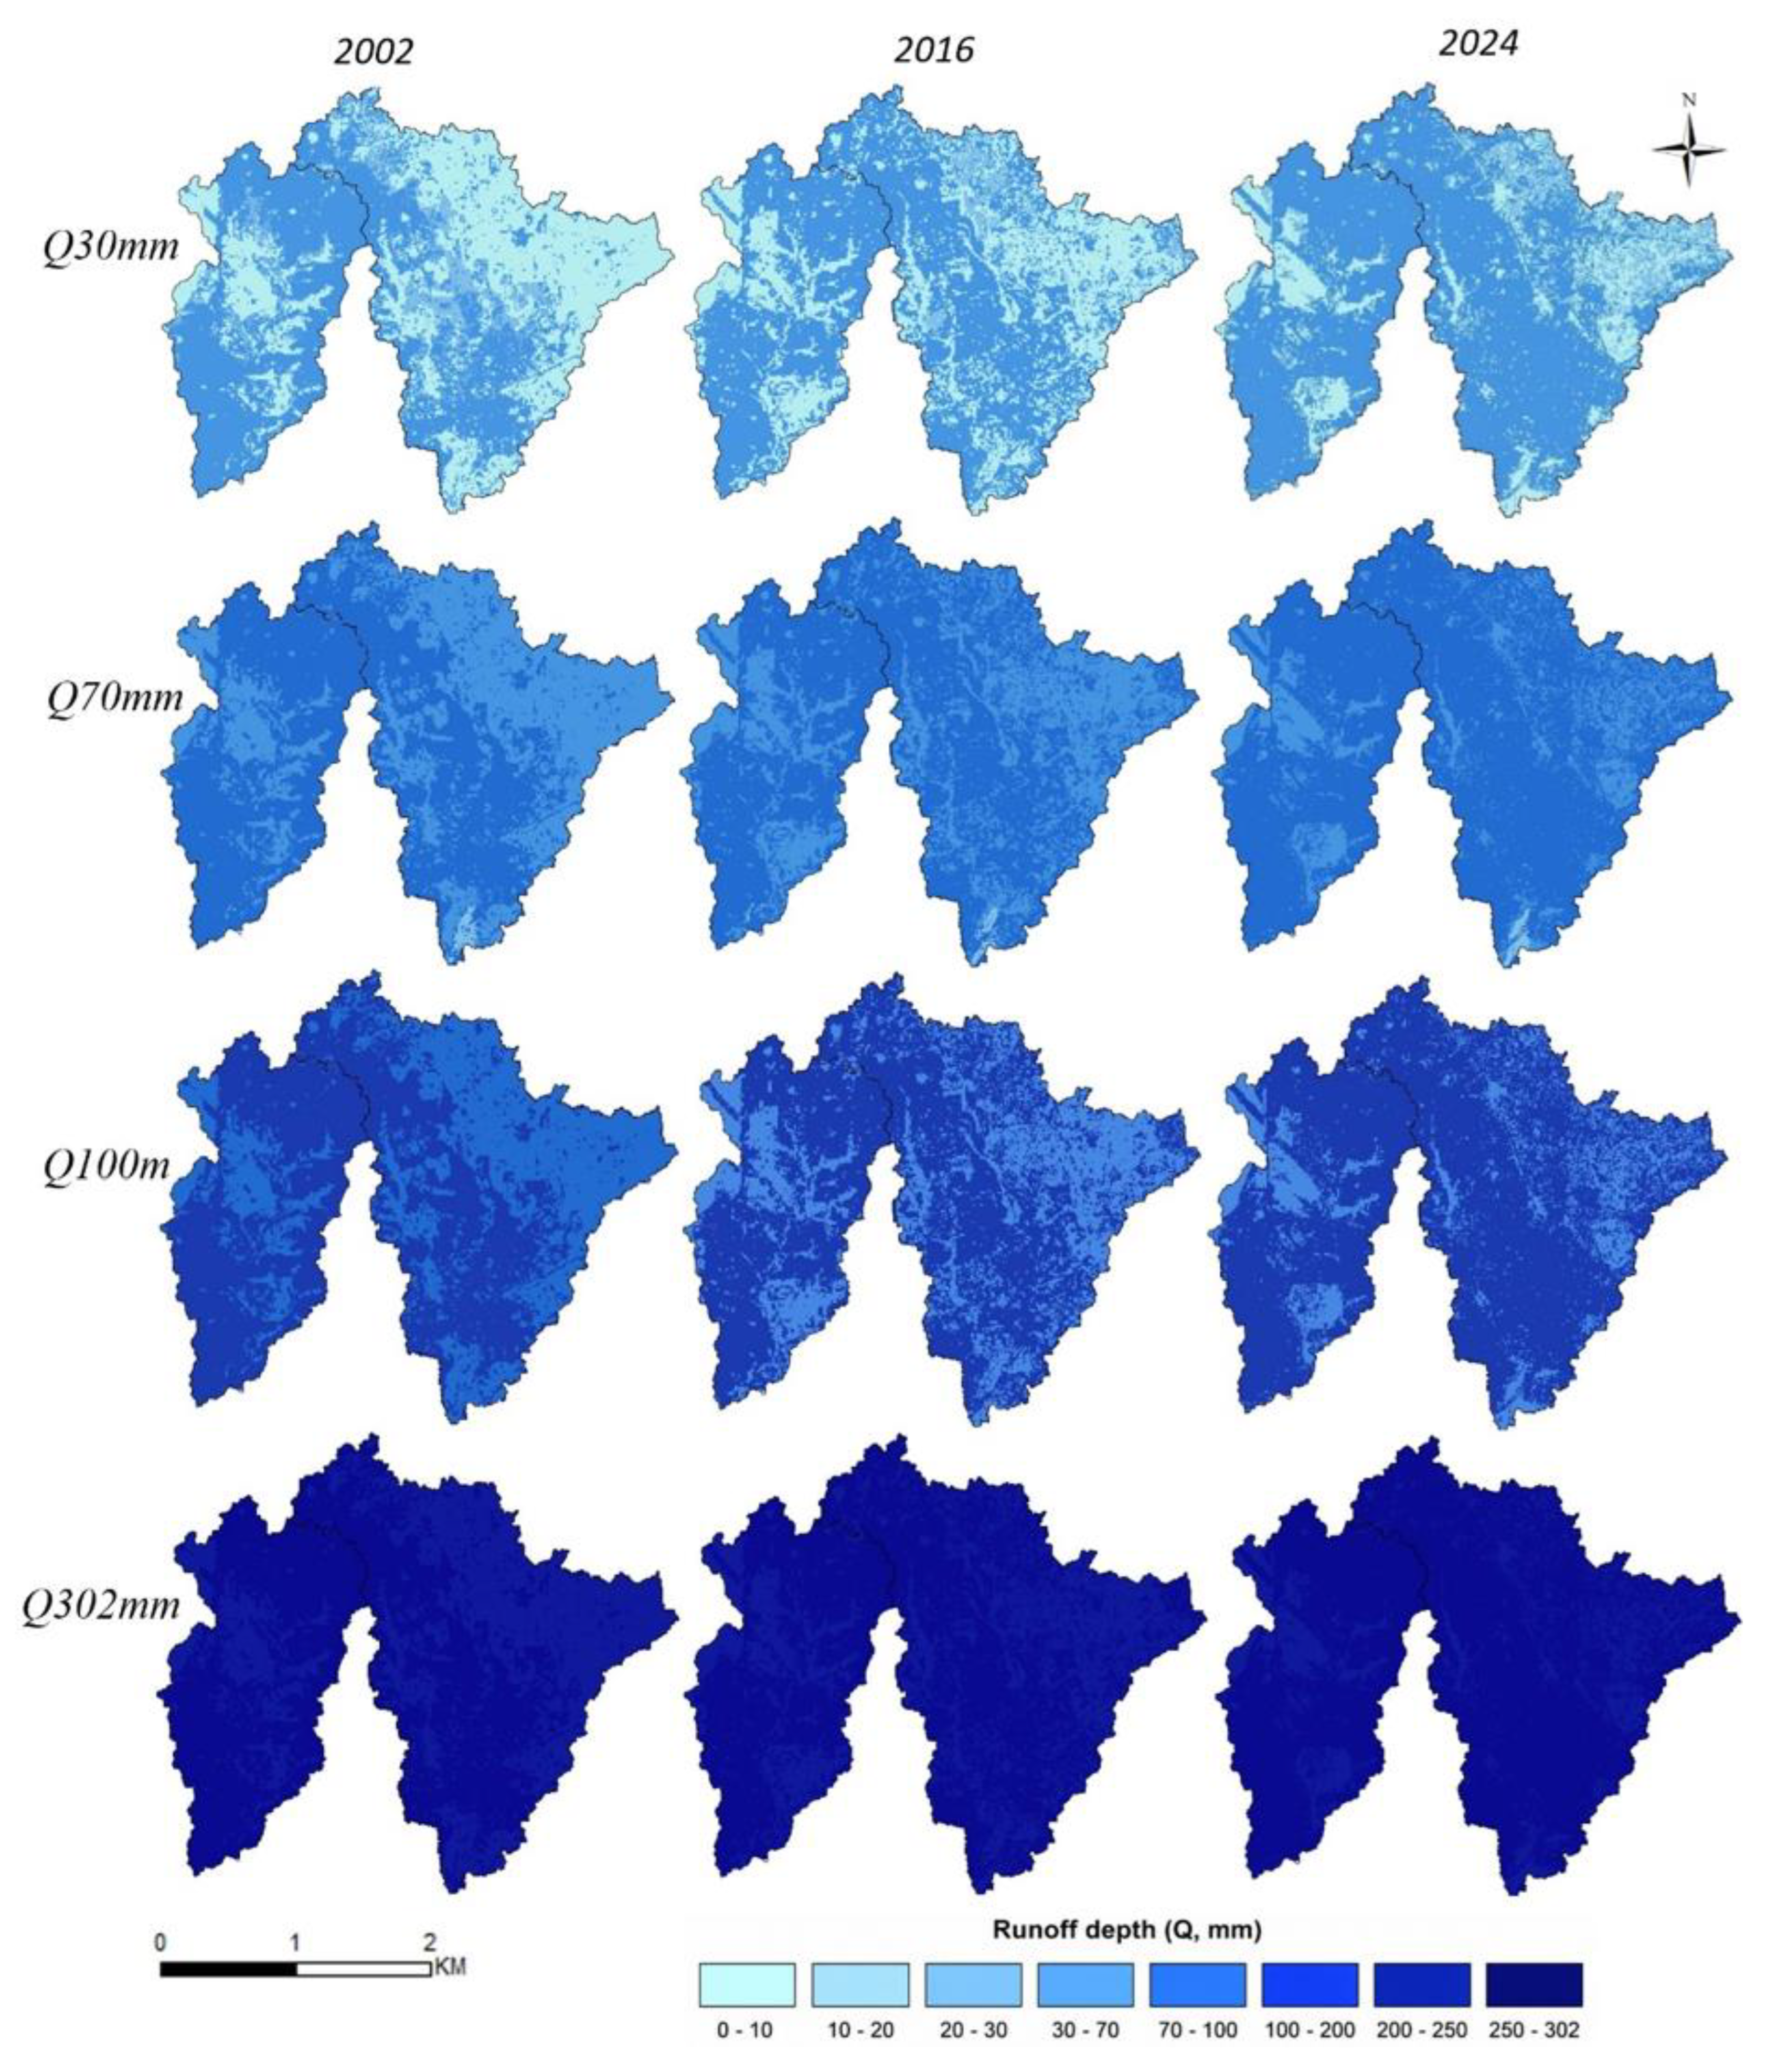
Figure 7.
Spatial evolution of flood susceptibility (FSI) under high and extreme rainfall scenarios (100 and 302 mm).
Figure 7.
Spatial evolution of flood susceptibility (FSI) under high and extreme rainfall scenarios (100 and 302 mm).
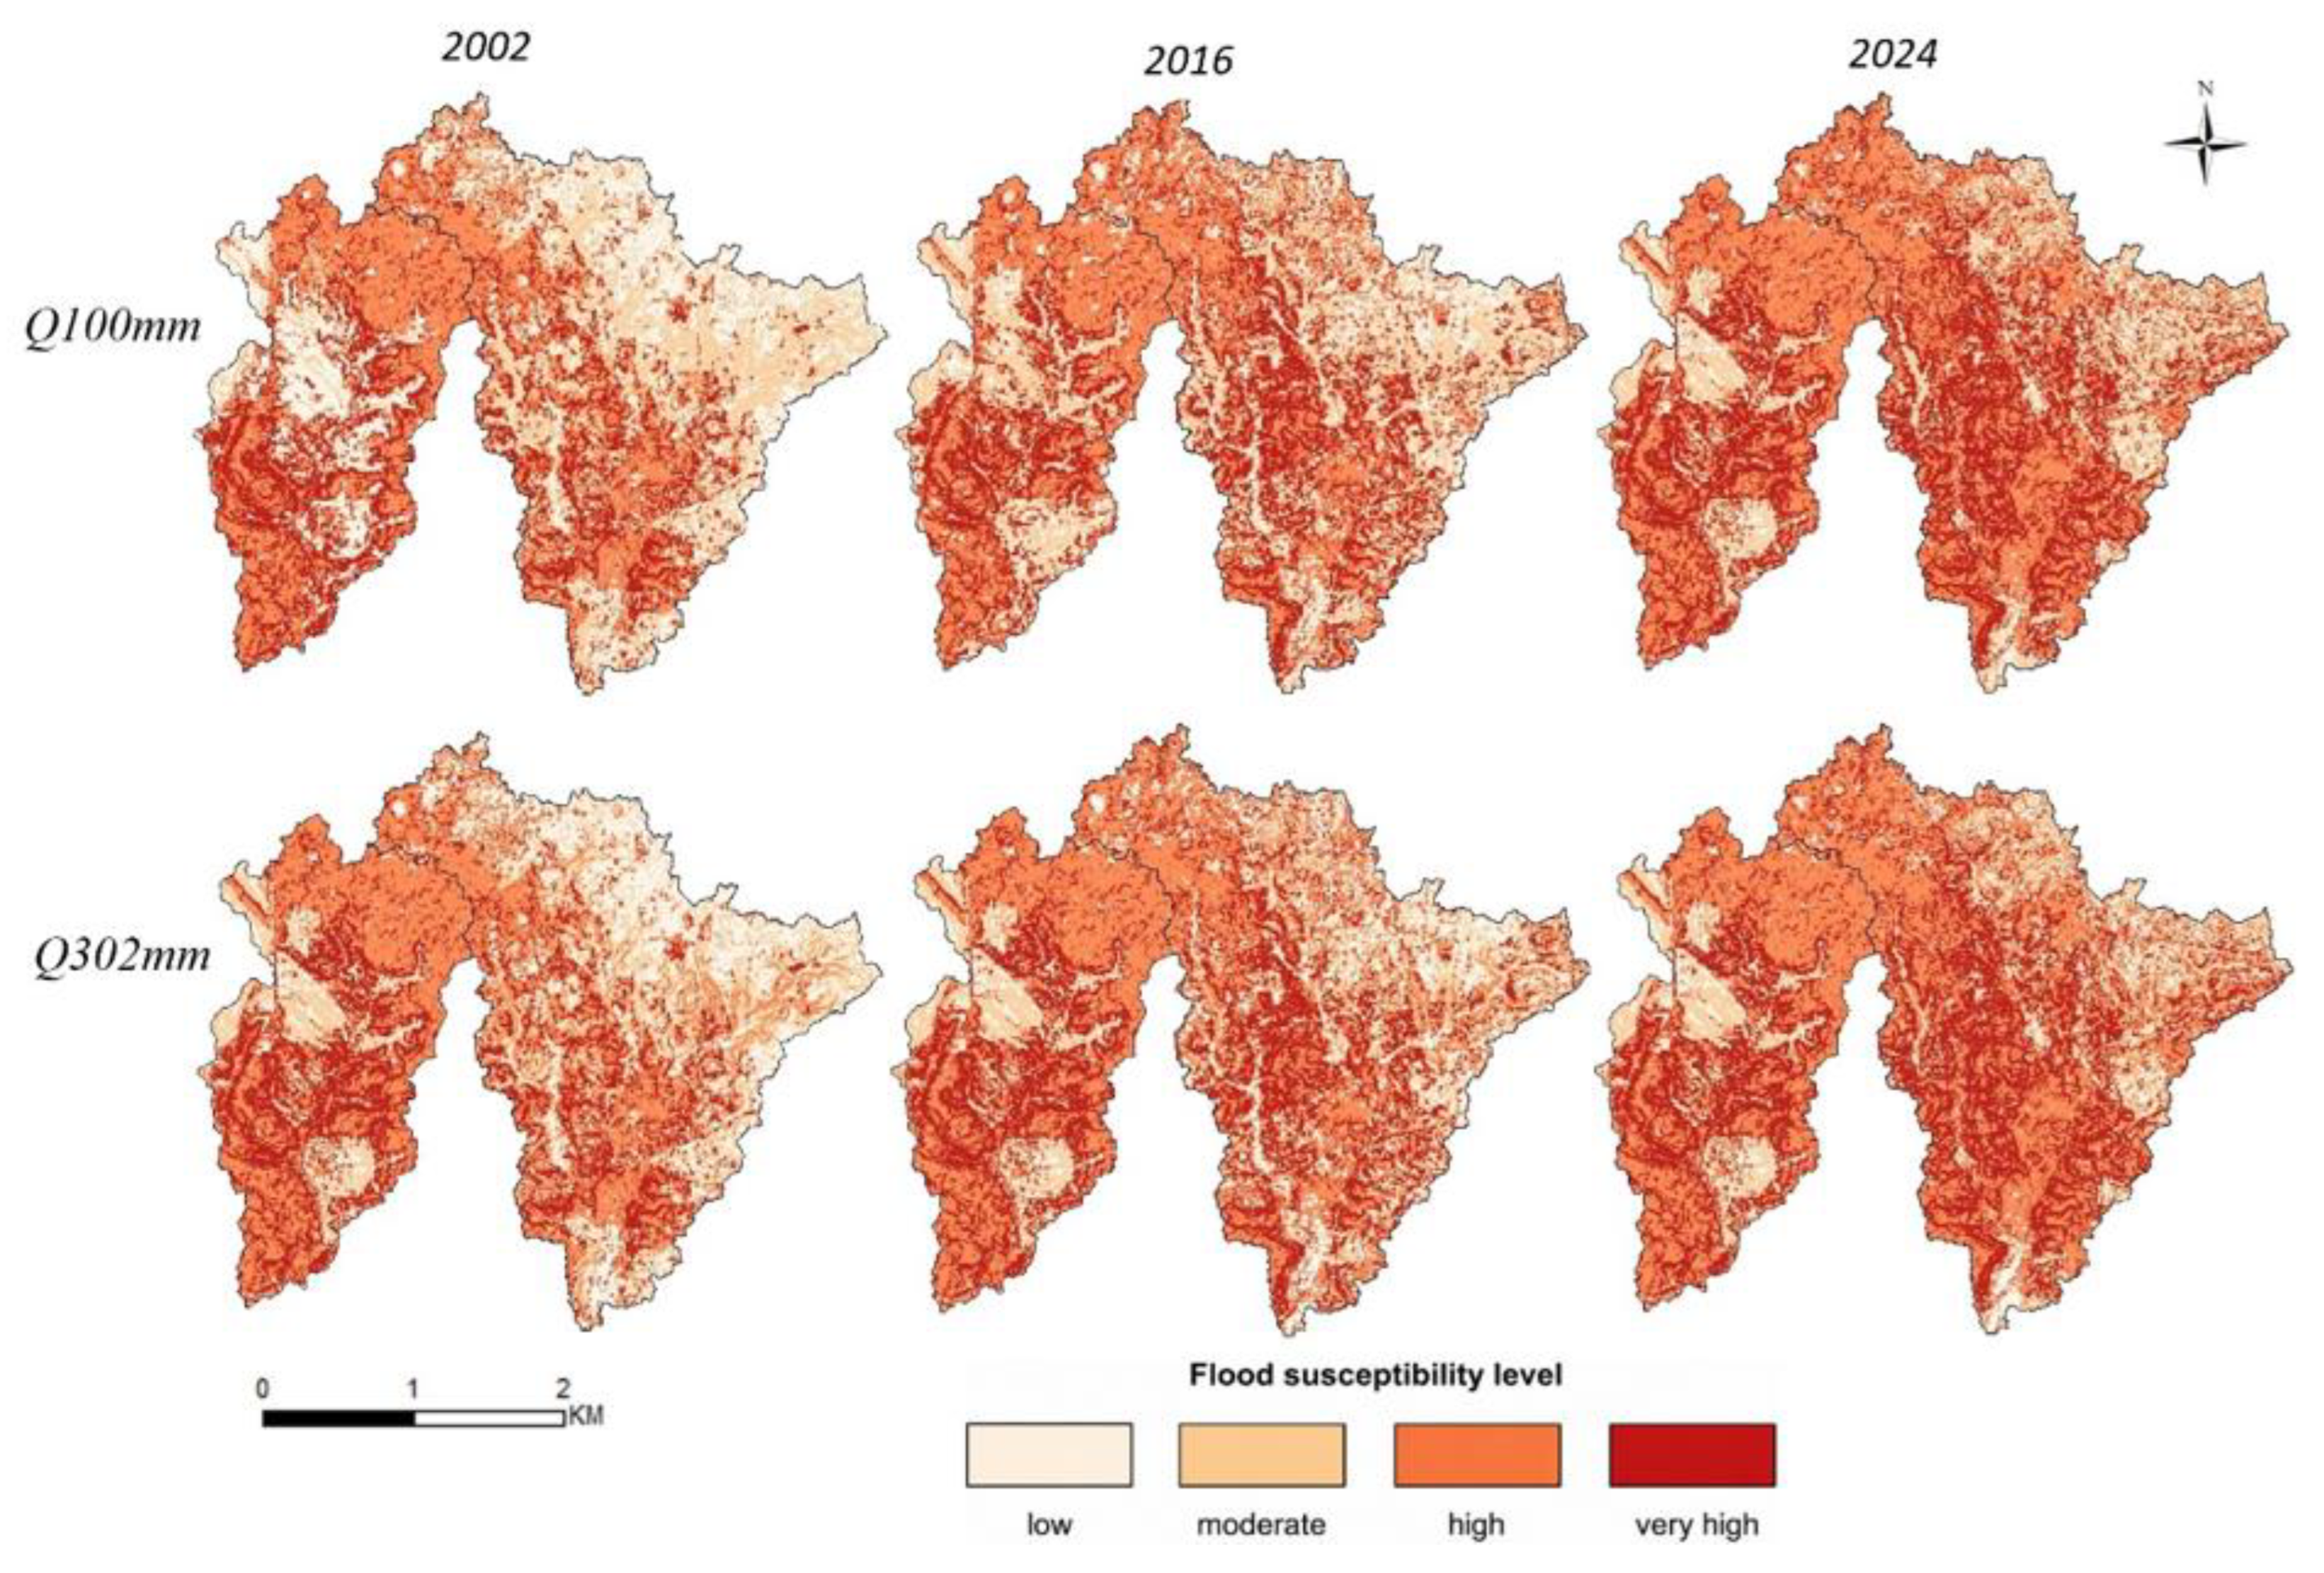
Figure 8.
Evolution of flood susceptibility (FSI) classes in the Gourou and Bonoumin watersheds under different rainfall scenarios (Q30, Q70, Q100, and Q302) between 2002 and 2024.
Figure 8.
Evolution of flood susceptibility (FSI) classes in the Gourou and Bonoumin watersheds under different rainfall scenarios (Q30, Q70, Q100, and Q302) between 2002 and 2024.
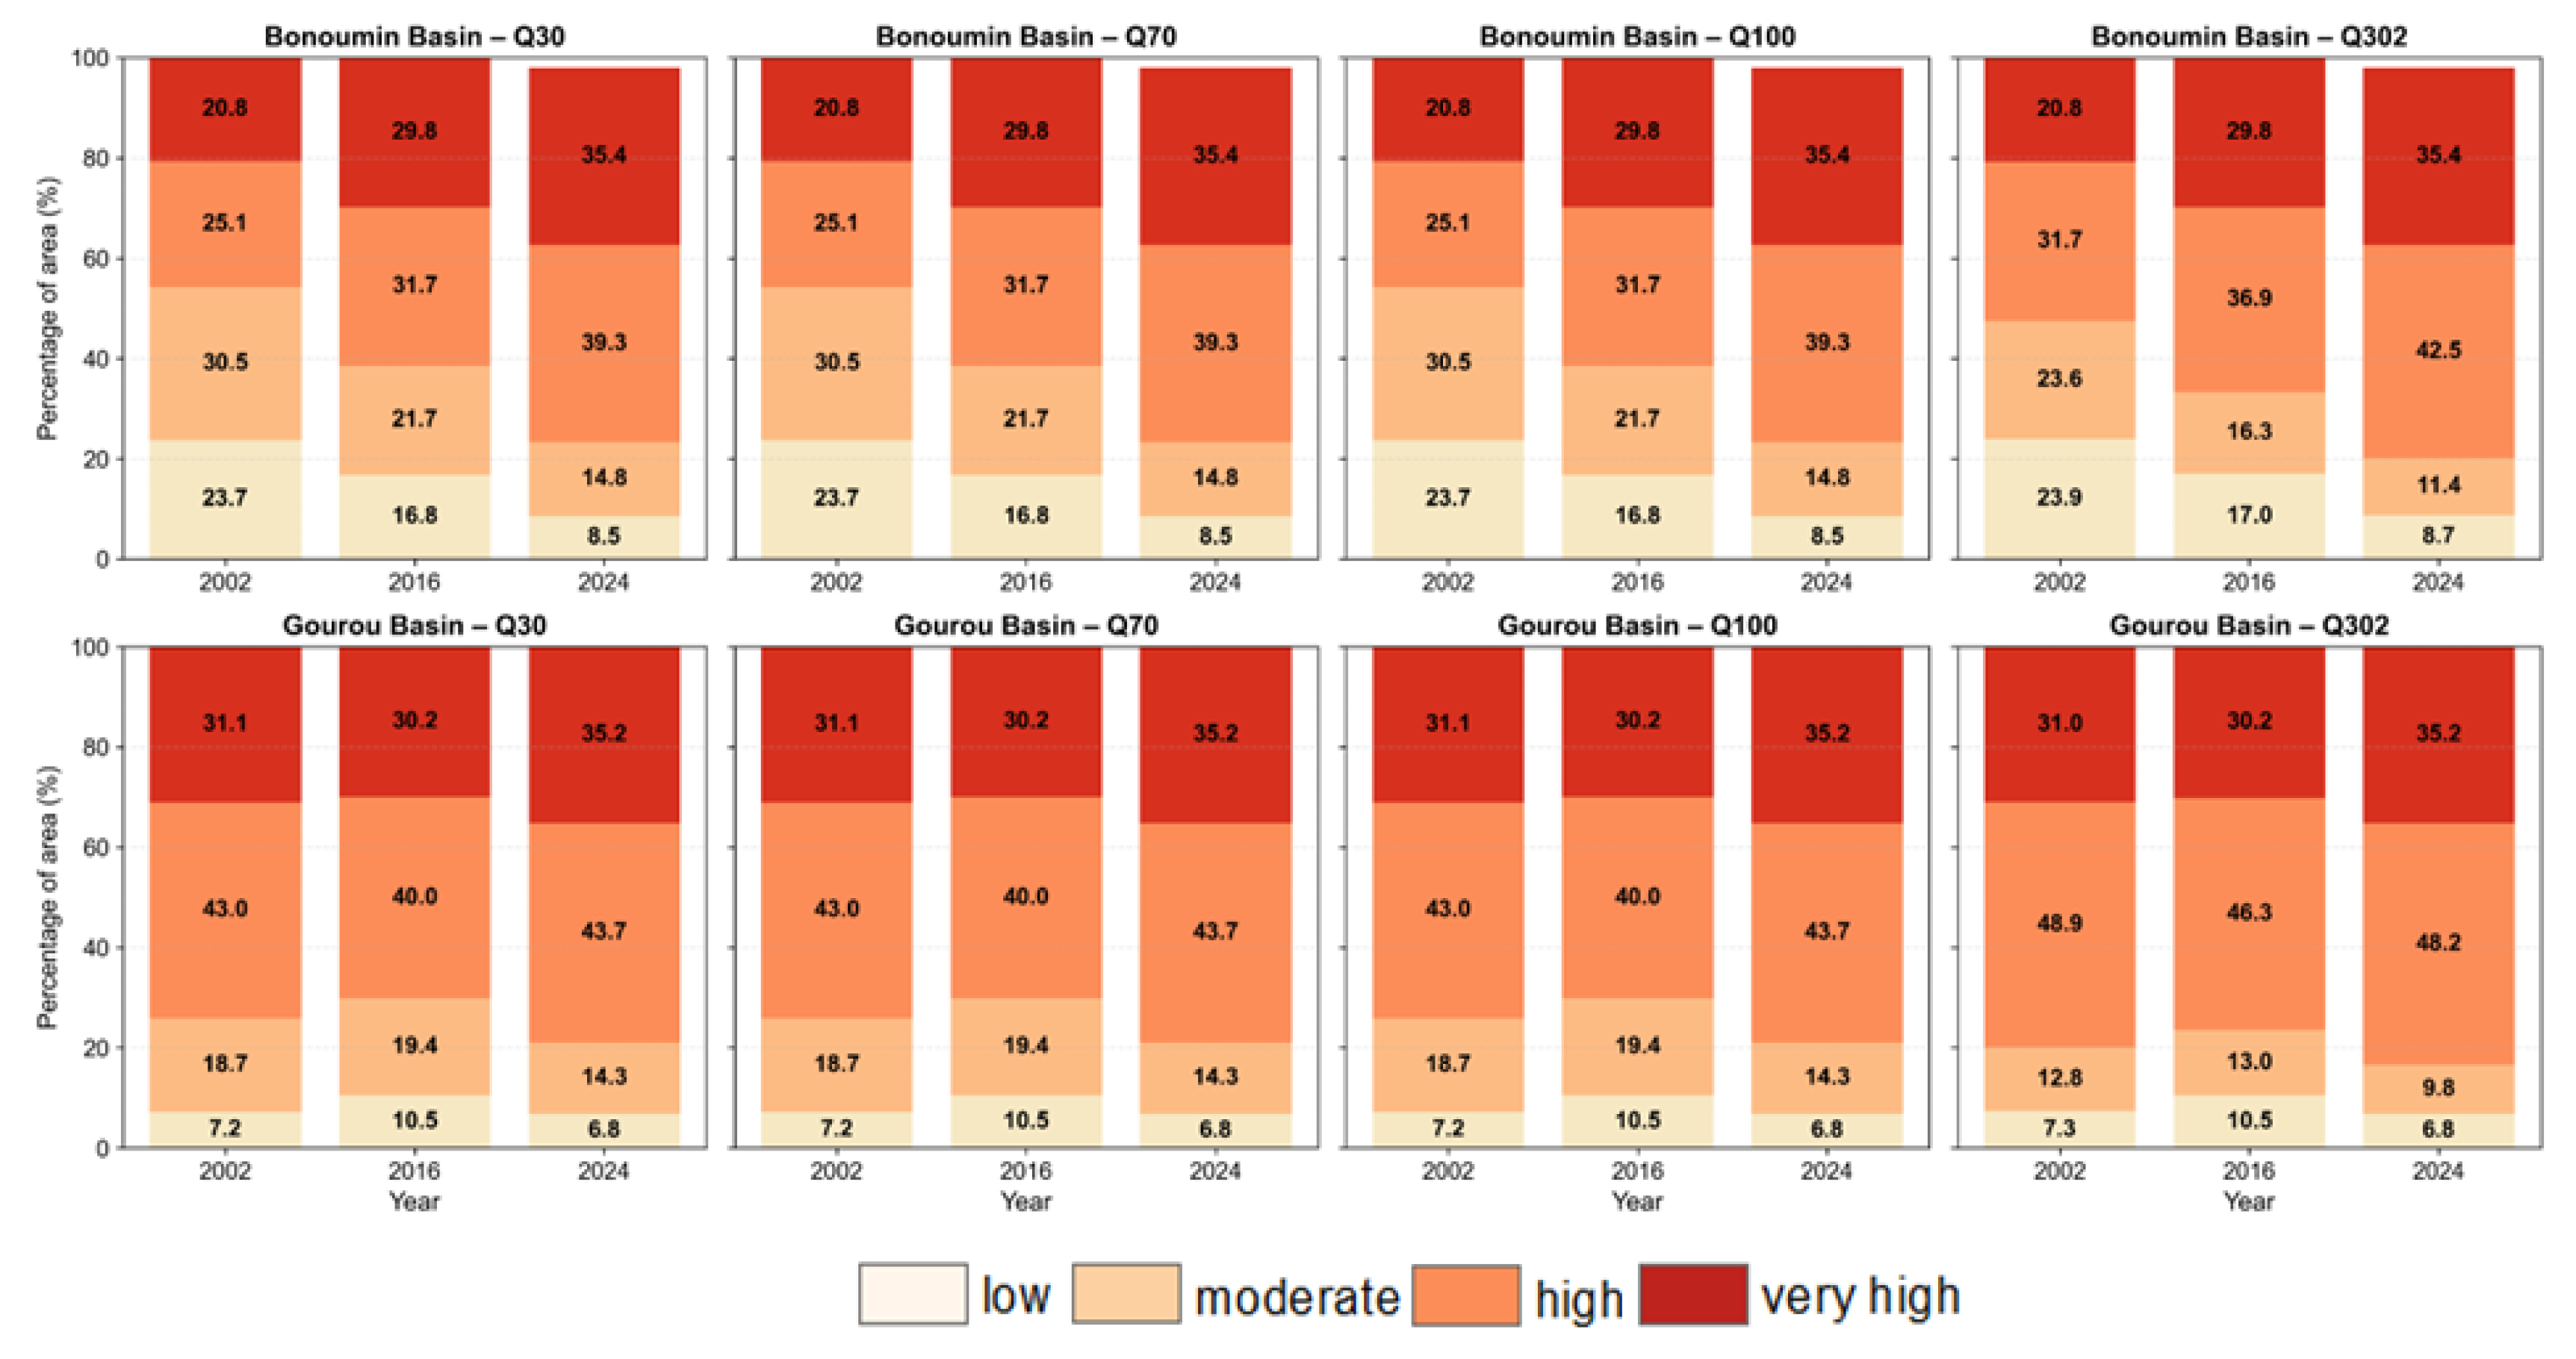
Figure 9.
Variability of the runoff coefficient as a function of rainfall for different CN values under standard initial abstraction (Ia = 0.2S) and no initial abstraction (Ia = 0) conditions.
Figure 9.
Variability of the runoff coefficient as a function of rainfall for different CN values under standard initial abstraction (Ia = 0.2S) and no initial abstraction (Ia = 0) conditions.
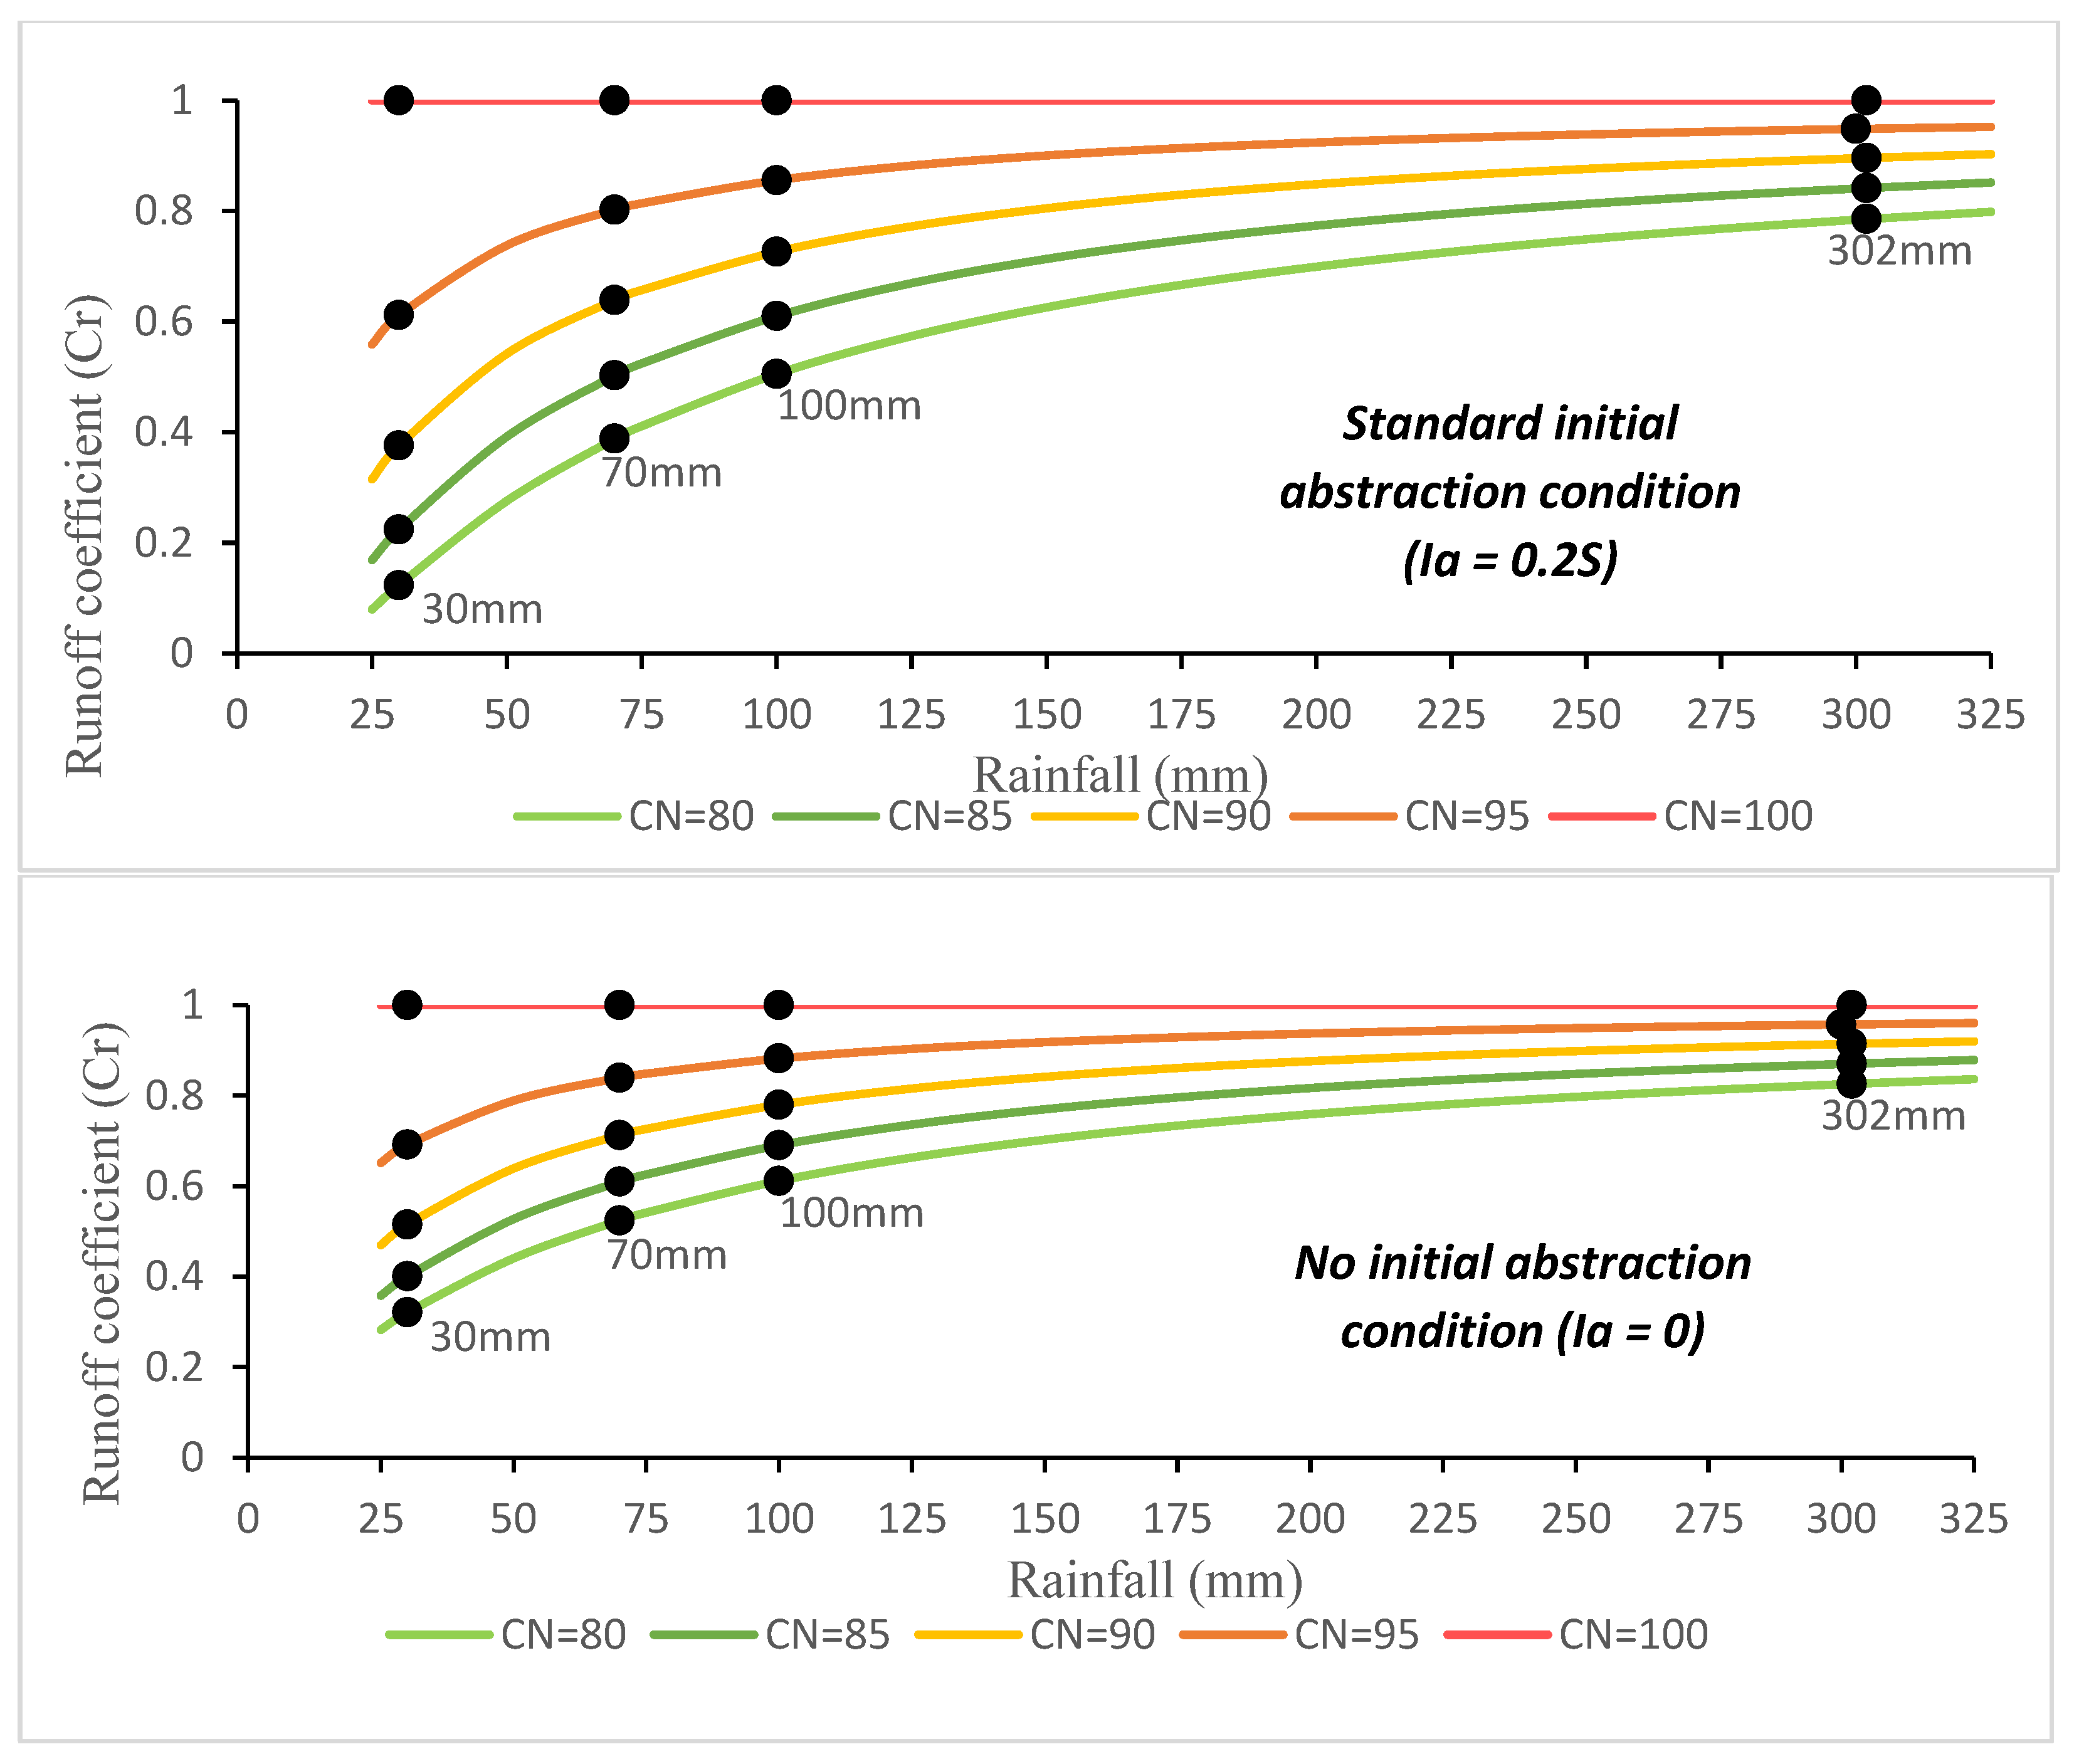
Table 1.
CN values according to land use/land cover class and hydrologic soil group (HSG).
| Land Use/Land Cover Class | HSG A (High Infiltration) | HSG B (Moderate Infiltration) | HSG C (Low Infiltration) | HSG D (Very Low Infiltration) |
Hydrological Interpretation |
|---|---|---|---|---|---|
| Built-up areas | 85 | 90 | 95 | 98 | Highly impervious surfaces (roads, buildings) generating high runoff |
| Bare soil | 77 | 85 | 90 | 95 | Compacted or degraded soils with limited infiltration |
| Vegetation | 30 | 58 | 72 | 80 | Variable infiltration depending on vegetation density |
| Water | 100 | 100 | 100 | 100 | Impervious surface generating direct runoff |
Table 2.
Rainfall scenarios used for runoff estimation based on operational warning thresholds.
| Alert level | Rainfall Range (mm) | Selected Rainfall (mm) | Color / Interpretation |
|---|---|---|---|
| 🟩 Low | P < 50 | 30 | Moderate rainfall, low risk |
| 🟨 Moderate | 50 ≤ P < 100 | 70 | Localized flood risk |
| 🟥 High | P ≥ 100 | 100 | Widespread flooding |
| ⚠️Exceptional | P = 302 | 302 | Extreme event in Abidjan (18/06 2018) |
Table 4.
Evolution of the runoff coefficient (Cr) according to rainfall scenarios for the Gourou and Bonoumin watersheds in 2002, 2016, and 2024.
Table 4.
Evolution of the runoff coefficient (Cr) according to rainfall scenarios for the Gourou and Bonoumin watersheds in 2002, 2016, and 2024.
| Hydrological Scenario | Rainfall (mm) | Gourou 2002 | Gourou 2016 | Gourou 2024 | Bonoumin 2002 | Bonoumin 2016 | Bonoumin 2024 |
|---|---|---|---|---|---|---|---|
| Low risk | 30 | 0.51 | 0.47 | 0.55 | 0.29 | 0.40 | 0.53 |
| Localized flooding | 70 | 0.74 | 0.71 | 0.77 | 0.57 | 0.66 | 0.75 |
| Generalized flooding | 100 | 0.81 | 0.78 | 0.83 | 0.67 | 0.74 | 0.82 |
| Reference extreme rainfall | 302 | 0.93 | 0.92 | 0.94 | 0.88 | 0.91 | 0.94 |
Disclaimer/Publisher’s Note: The statements, opinions and data contained in all publications are solely those of the individual author(s) and contributor(s) and not of MDPI and/or the editor(s). MDPI and/or the editor(s) disclaim responsibility for any injury to people or property resulting from any ideas, methods, instructions or products referred to in the content. |
© 2026 by the authors. Licensee MDPI, Basel, Switzerland. This article is an open access article distributed under the terms and conditions of the Creative Commons Attribution (CC BY) license (http://creativecommons.org/licenses/by/4.0/).
Copyright: This open access article is published under a Creative Commons CC BY 4.0 license, which permit the free download, distribution, and reuse, provided that the author and preprint are cited in any reuse.