

Submitted:
16 September 2026
Posted:
16 September 2026
You are already at the latest version
Abstract
The present study aimed to evaluate the climatic suitability of Actinidia arguta (mini kiwifruit) across Europe. We first calibrated a species distribution model (SDM) on occurrence records from the native East Asian range and then transferred it to the European domain. Alongside standard bioclimatic variables, we incorporated a custom spring frost indicator into the modeling workflow. The five algorithms (GLM, RF, MAXNET, GAM, GBM) showed moderate-to-good predictive performance, with mean validation TSS values ranging from 0.618 to 0.656 and mean AUC values from 0.884 to 0.912. Temperature seasonality (BIO4) was the most influential predictor, with precipitation of the warmest quarter (BIO18) and spring minimum temperature (spring_min) showing similarly high secondary importance. Spatial projections indicated broad areas of climatic suitability across Central and Southeastern Europe; however, a considerable share of these suitable areas also coincided with zones where temperatures during critical phenological stages of A. arguta regularly fall to potentially damaging levels. Taken together, these results indicate that climatic suitability alone tends to overestimate actual cultivation potential, and that the risk of late-spring frost must be treated as an explicit component of any species distribution modeling framework for perennial crops.
Keywords:
species distribution modeling
; ensemble modeling
; spring temperature
; crop suitability
; niche modeling
; BIOMOD2
1. Introduction
Ongoing climate change is progressively altering the geographic range of climatically suitable conditions for perennial fruit crops throughout Europe. While these shifts open new possibilities for agricultural expansion into previously unsuitable areas, they also bring emerging climate-related risks that complicate planning and crop management [1,2,3]. Adding to this complexity, regional studies have recorded notable changes in precipitation patterns and growing spatial variability across Southeastern Europe, underscoring the multifaceted nature of climate-driven impacts on agricultural systems [4,5].
Against this backdrop, species distribution models (SDMs) have become a widely adopted tool for mapping areas with favorable climatic conditions for cultivation [6,7]. A recurring limitation of these models, however, is their reliance on long-term climatic averages, which can cause them to miss short-term constraints of considerable practical importance, most notably late spring frost events and phenological mismatches between crop development and ambient temperatures [8,9,10]. In recent years, Actinidia arguta has attracted growing interest as an alternative fruit crop, owing to a combination of traits that distinguish it from most commercial kiwifruit varieties: notably its exceptional cold tolerance, edible skin, substantial nutritional value, and an expanding market profile [11,12,13]. Originally native to East Asia, the species has been progressively introduced into Europe and other temperate parts of the world, where it is increasingly regarded as a viable candidate for diversifying perennial cropping systems.
Unlike Actinidia deliciosa, A. arguta can tolerate winter temperatures as low as -25°C during dormancy, reflecting considerably greater cold hardiness [11,13]. That said, winter hardiness alone does not guarantee successful cultivation; the species also requires a specific combination of climatic conditions, including adequate chilling accumulation, moderate temperature seasonality, and favorable spring thermal regimes.
Among these requirements, early-spring temperatures are particularly critical. Budburst and flowering in A. arguta tend to occur relatively early in the season, at a time when sub-zero temperatures remain possible across much of Central and Northern Europe. Because plant tissues are highly vulnerable at these early developmental stages, even brief frost events can substantially reduce both yield quantity and fruit quality, creating a potential disconnect between broad-scale climatic suitability and the actual reliability of cultivation in a given location.
Earlier SDM-based studies of species in the genus Actinidia have similarly sought to delineate suitable cultivation areas and inform crop development strategies [2,14,15,16], with temperature-related variables and precipitation patterns emerging with notable consistency across these studies as the primary determinants of species distribution.
In Europe, however, most research on A. arguta has focused on agronomic performance, phenological behavior, and cultivar selection, with relatively little integration of spatial modeling methods or systematic evaluation of frost-related constraints. This gap is increasingly relevant in light of recent revisions to European winter hardiness zone maps, which document substantial shifts in minimum temperature regimes and underscore the need for updated, spatially explicit suitability assessments [17].
Practical experience from countries where A. arguta is already cultivated commercially, including Poland and Georgia, has further demonstrated how frost-related constraints can affect production stability from one season to the next [4,18,19]. This evidence reinforces the view that a spatial assessment combining climatic suitability with explicit frost risk evaluation is not merely useful but necessary.
Beyond purely climatic considerations, the commercial viability of A. arguta is also shaped by its postharvest behavior. Compared with A. deliciosa, A. arguta has a notably shorter storage life, generally limited to 4–6 weeks under refrigeration [20,21]. Recent progress in molecular research and breeding has nevertheless begun to shed light on the underlying mechanisms of postharvest physiology, identifying several candidate targets for improving storage performance [14].
The availability of molecular markers and modern breeding tools thus opens practical avenues for selecting cultivars with greater stress tolerance and superior postharvest quality. In this context, robust spatial suitability assessments are not merely of academic interest; they are increasingly integral to agricultural planning and economic feasibility analysis for this crop.
With this in mind, the present study pursues three interconnected objectives: (i) to map the climatic suitability of A. arguta across Europe, (ii) to identify the key environmental variables driving its potential distribution, and (iii) to assess how early spring frost risk interacts with and constrains those potentially suitable areas. By integrating climatic suitability and frost exposure within a single analytical framework, the study aims to provide a more realistic picture of cultivation potential under current conditions.
2. Materials and Methods
Occurrence Data
Occurrence records of A. arguta were downloaded from the Global Biodiversity Information Facility (GBIF) database (https://www.gbif.org/occurrence/download/0005343-260126135527185). We removed records lacking geographic coordinates and duplicate entries with identical coordinate pairs to ensure dataset integrity. The cleaned records were then organized as georeferenced point data using the WGS84 coordinate reference system (EPSG:4326).
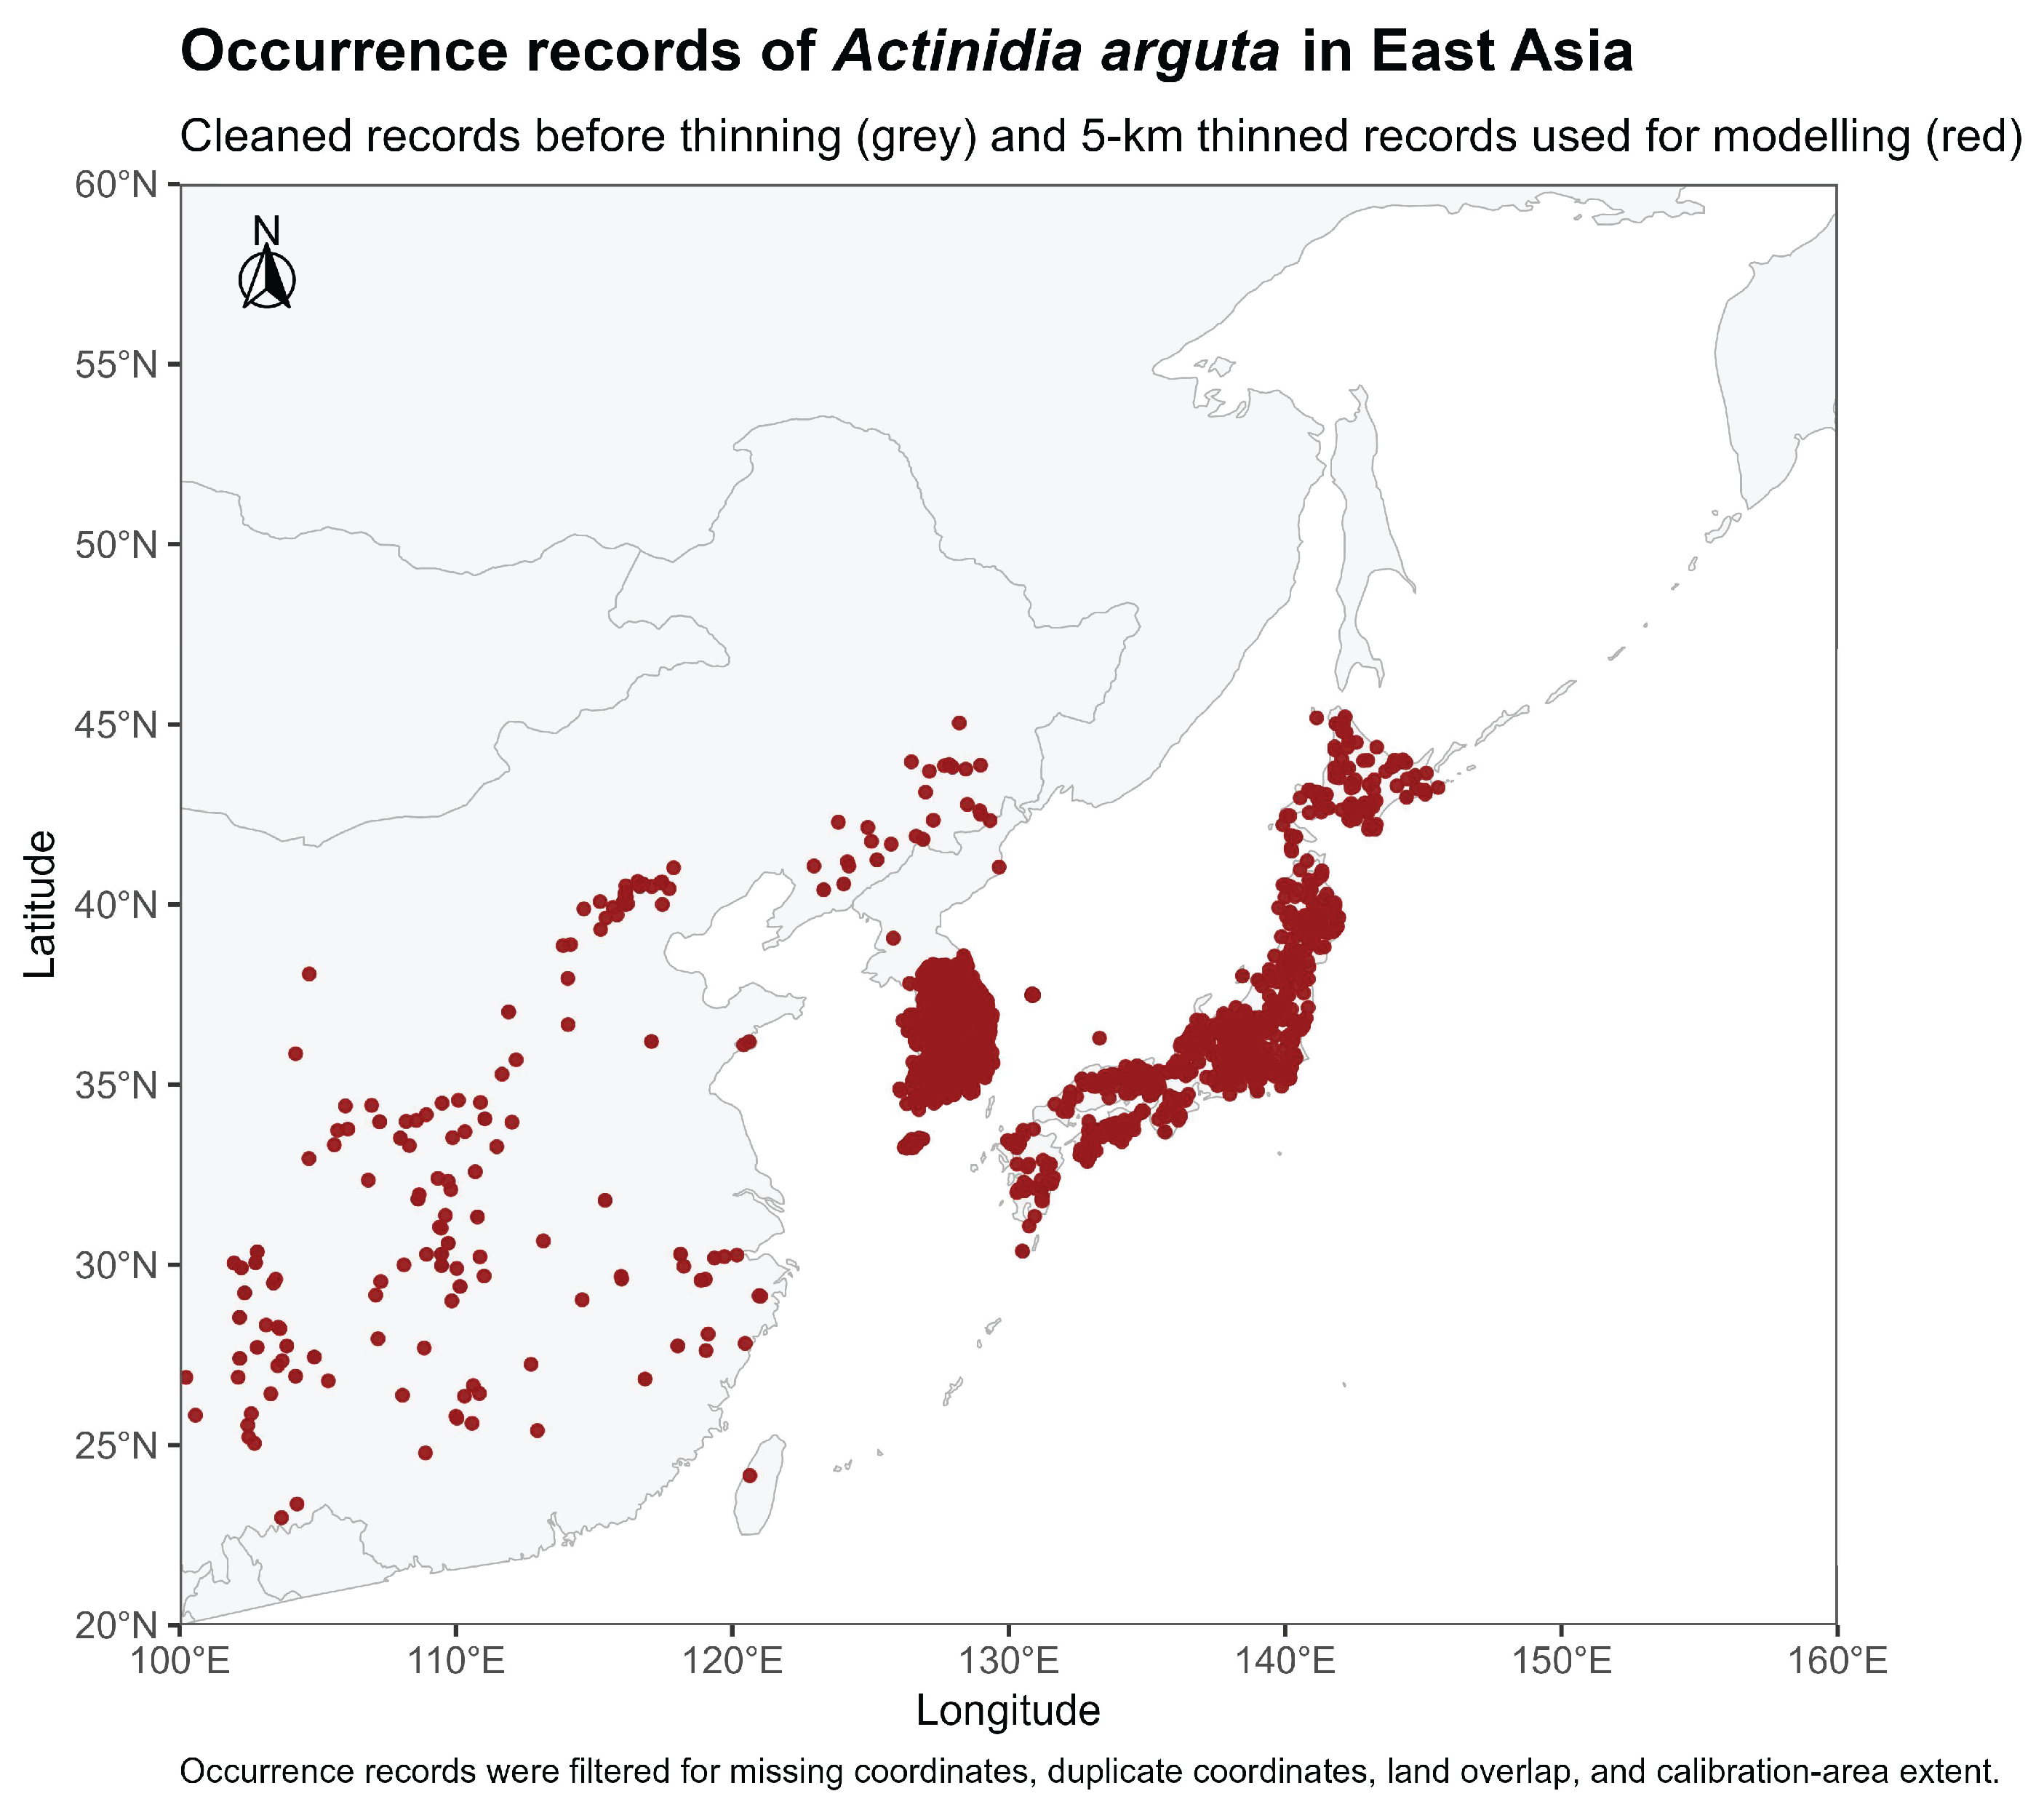
Figure 1.
Geographic distribution of A. arguta occurrence records in East Asia after data cleaning and preprocessing. Grey points represent cleaned records before spatial thinning, whereas red points represent the 5-km-thinned occurrence records retained for model calibration.
Figure 1.
Geographic distribution of A. arguta occurrence records in East Asia after data cleaning and preprocessing. Grey points represent cleaned records before spatial thinning, whereas red points represent the 5-km-thinned occurrence records retained for model calibration.
Spatial Filtering of Occurrence Data
Before applying spatial filters, we generated a smoothed sampling-density surface from the cleaned occurrence records to characterize sampling effort across the region (Figure S1). We then carried out spatial thinning to address autocorrelation and uneven sampling intensity, retaining only records separated by at least 5 km. This step effectively reduced clustering in heavily sampled areas while improving the spatial independence of the remaining data.
The choice of a 5 km thinning threshold represented a pragmatic balance between reducing spatial clustering and retaining enough records for reliable model calibration. This preprocessing step is widely recognized as good practice in SDM workflows, as spatially uneven sampling can systematically bias model predictions toward oversampled regions.
To prevent geographic inconsistencies from records placed over water bodies, we kept only occurrence points on land. Model calibration was furthermore restricted to the native range in East Asia, encompassing China, Japan, and the Korean Peninsula (100–160°E, 20–60°N), a region considered climatically representative of the conditions under which A. arguta evolved.
To prevent pseudo-replication at the resolution of the environmental layers, we applied raster-cell filtering during BIOMOD2 data formatting so that multiple occurrence records within the same predictor cell were reduced to a single record. Records with missing values for one or more environmental predictors were also excluded prior to model fitting.
Together, these preprocessing steps established a spatially and environmentally consistent dataset, thereby strengthening the robustness of the subsequent modeling procedure.
Variable selection for the final model combined a statistical criterion, namely variance inflation factor (VIF) analysis, with an assessment of ecological relevance. Predictors with VIF values exceeding 10 were considered highly collinear and removed iteratively, so that the retained set displayed acceptable multicollinearity without sacrificing biological interpretability.
Environmental Predictors
Environmental predictors were sourced from the WorldClim v2 dataset [22,23] at a spatial resolution of 2.5 arc-minutes.
We considered three broad categories of climatic information as candidate predictors: the standard bioclimatic variables (BIO1–BIO19), monthly minimum temperature (tmin), and monthly mean temperature (tavg). We spatially clipped all predictor layers to both the East Asian calibration region and the European projection domain before analysis.
To more precisely capture thermal conditions during the most frost-sensitive phenological window, we derived a custom spring frost indicator (spring_min). We defined this variable as the lower of the mean monthly minimum temperatures for March and April. These months broadly correspond to the period of budburst and early vegetative development in A. arguta.
The resulting indicator served as a proxy for potential frost exposure when plant tissues are highly vulnerable to low-temperature damage.
A winter temperature proxy (chilling_proxy), calculated as the mean temperature across selected winter months, was also considered as a candidate predictor. We ultimately excluded it from the final model after collinearity analysis revealed a strong correlation with spring_min (Figure 2), making its inclusion redundant.
Figure 2.
Correlation heatmap of all candidate predictors, including bioclimatic and derived variables. Correlations with |r| ≥ 0.75 are annotated; values exceeding |r| = 0.8 indicate strong multicollinearity prior to variable selection.
Figure 2.
Correlation heatmap of all candidate predictors, including bioclimatic and derived variables. Correlations with |r| ≥ 0.75 are annotated; values exceeding |r| = 0.8 indicate strong multicollinearity prior to variable selection.
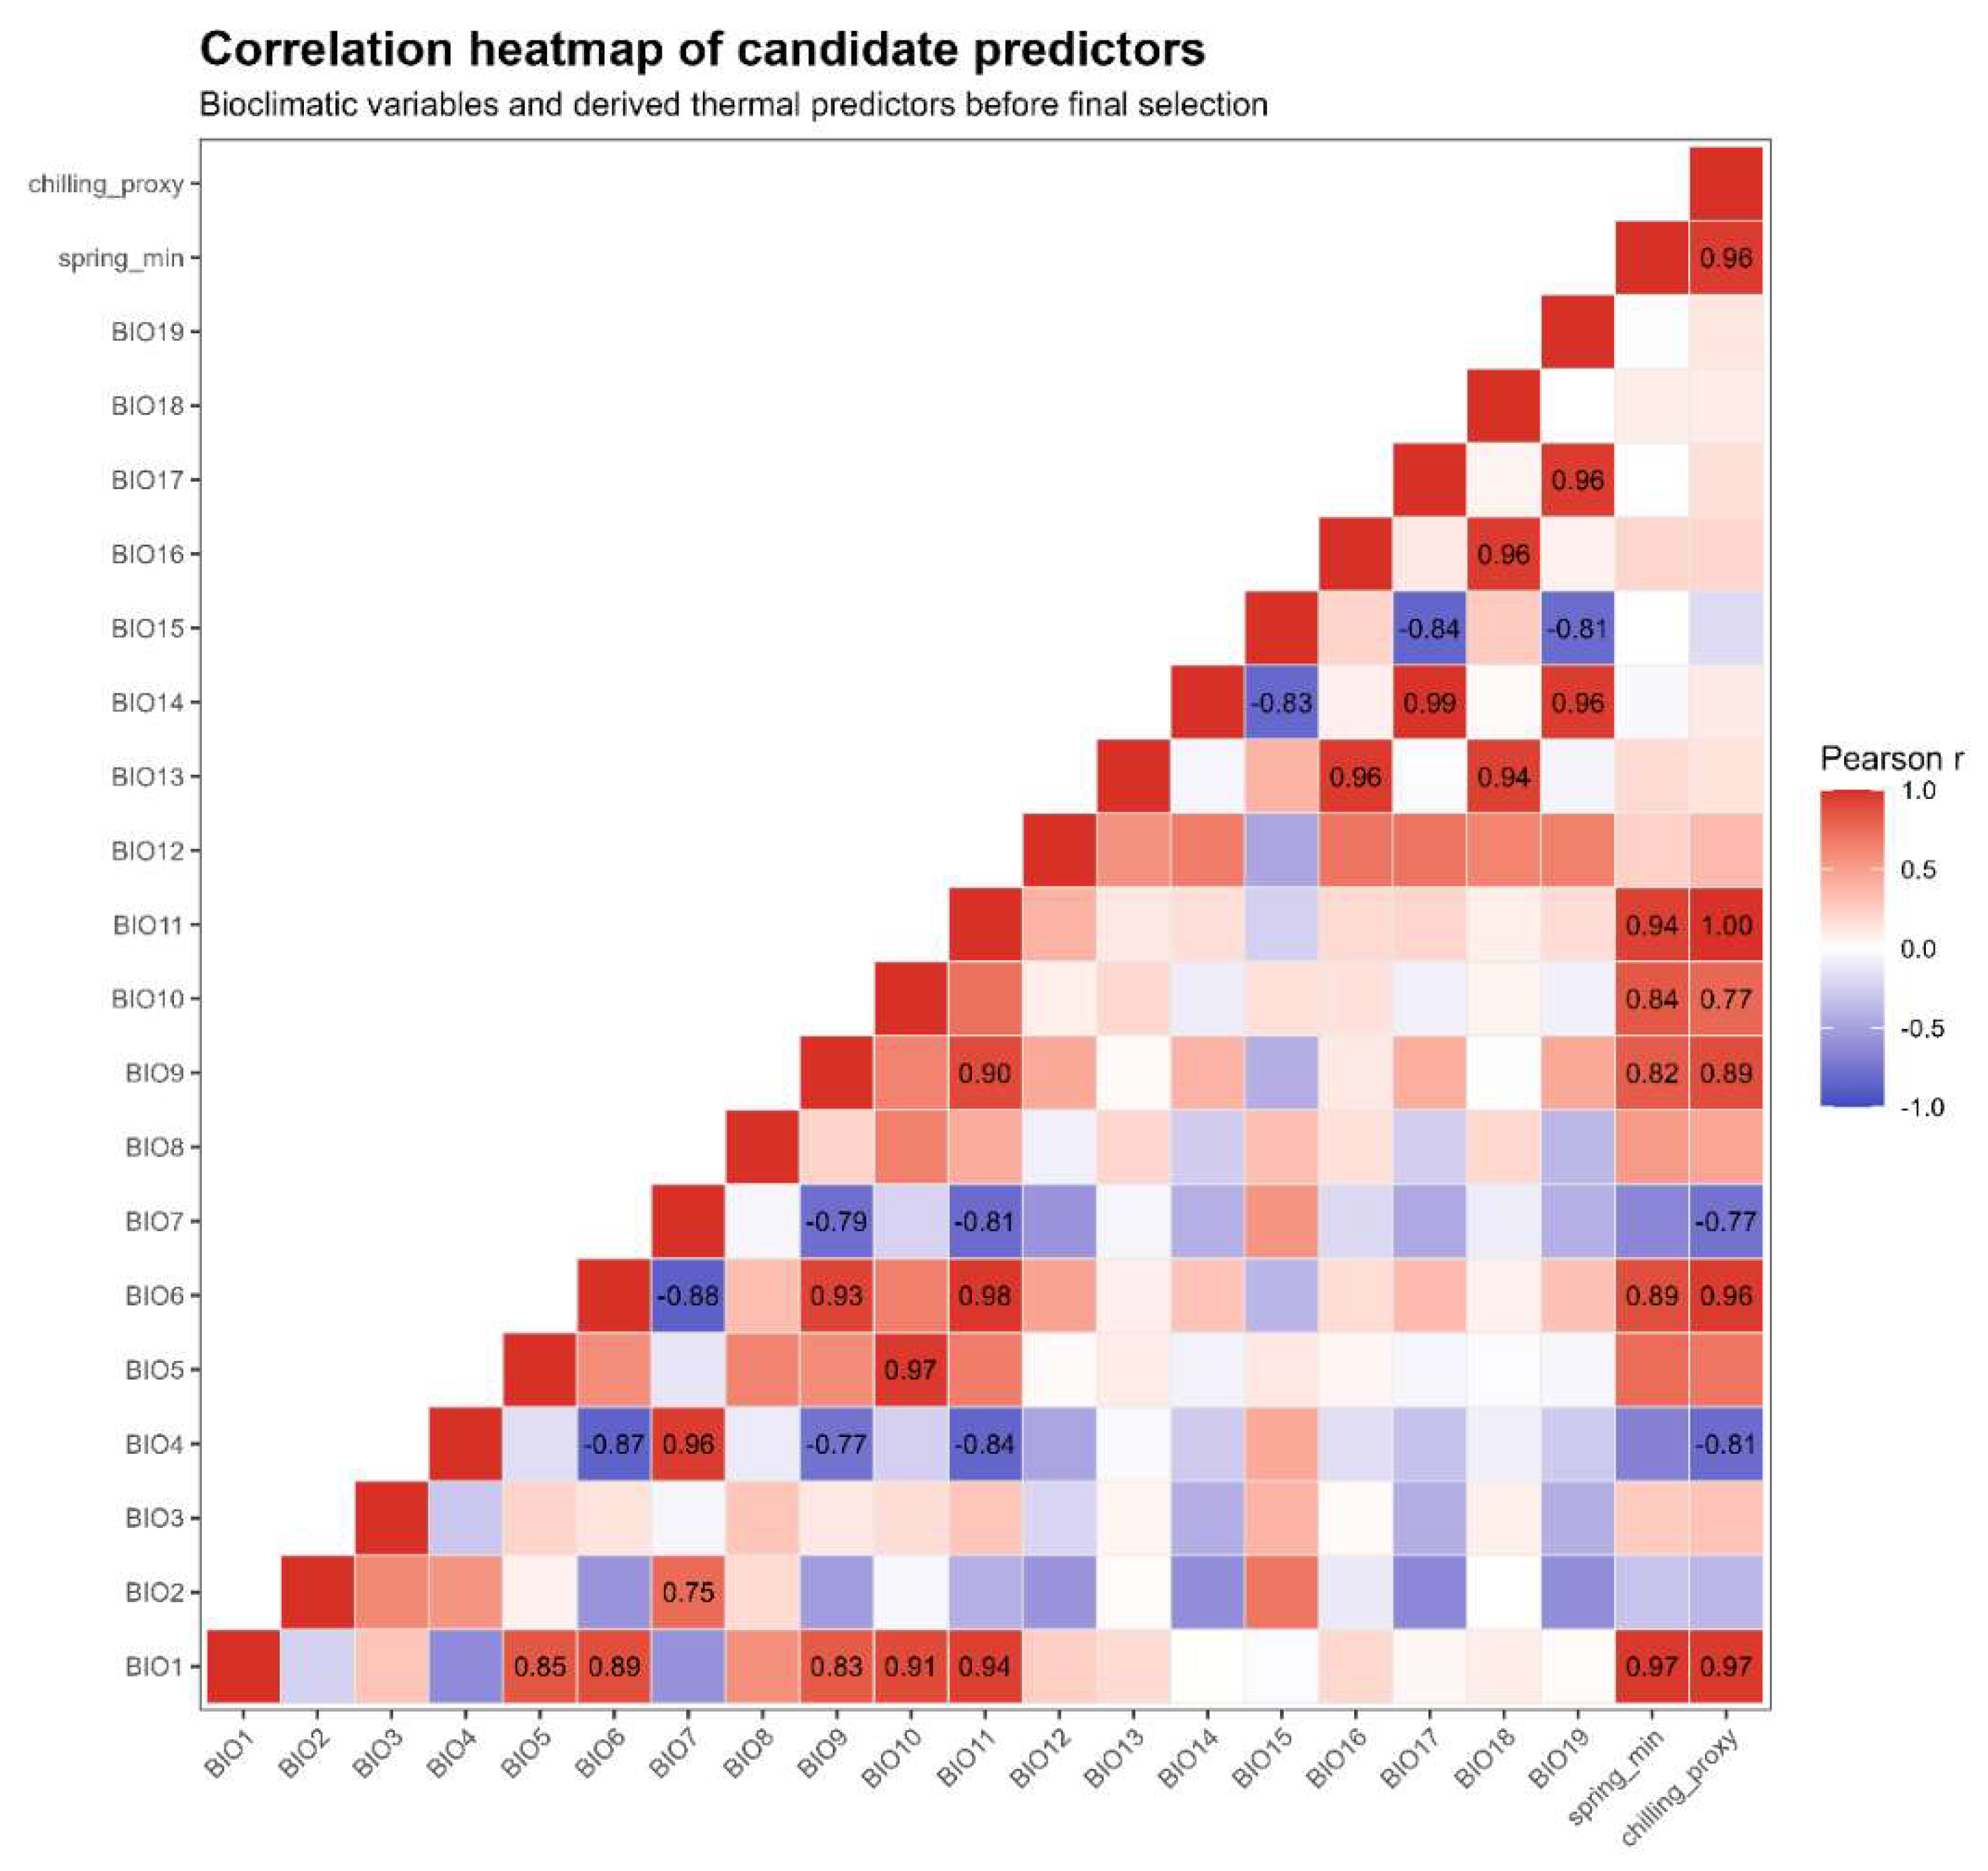

Table 1.
Environmental predictors considered as candidates for the final model, indicating which were retained.
Table 1.
Environmental predictors considered as candidates for the final model, indicating which were retained.
| Retained in final model | Description | Variable |
|---|---|---|
| No | Annual mean temperature | BIO1 |
| No | Mean diurnal range | BIO2 |
| No | Isothermality | BIO3 |
| Yes | Temperature seasonality | BIO4 |
| Yes | Maximum temperature of warmest month | BIO5 |
| No | Minimum temperature of coldest month | BIO6 |
| No | Temperature annual range | BIO7 |
| No | Mean temperature of wettest quarter | BIO8 |
| No | Mean temperature of driest quarter | BIO9 |
| No | Mean temperature of warmest quarter | BIO10 |
| No | Mean temperature of coldest quarter | BIO11 |
| No | Annual precipitation | BIO12 |
| No | Precipitation of wettest month | BIO13 |
| No | Precipitation of driest month | BIO14 |
| Yes | Precipitation seasonality | BIO15 |
| No | Precipitation of wettest quarter | BIO16 |
| No | Precipitation of driest quarter | BIO17 |
| Yes | Precipitation of warmest quarter | BIO18 |
| No | Precipitation of coldest quarter | BIO19 |
| Yes | Minimum temperature of early spring (March–April) | spring_min |
Variable Selection (VIF)
We assessed multicollinearity among candidate predictors using VIF analysis on the complete set of bioclimatic and derived variables [16]. VIF values were computed from environmental data extracted at presence locations, and any predictor exceeding a VIF of 10 was iteratively removed from the candidate pool.
After statistical filtering, we assembled a final predictor subset by also considering ecological relevance and each variable’s mechanistic connection to the species' known physiological and climatic constraints. The retained set comprised BIO4 (temperature seasonality), BIO5 (maximum temperature of the warmest month), BIO15 (precipitation seasonality), BIO18 (precipitation of the warmest quarter), and the custom spring frost indicator (spring_min).
Pairwise correlations among these five retained predictors were low to moderate throughout, confirming that multicollinearity had been adequately reduced and that the predictor set was suitable for producing stable, interpretable model outputs.
Background Data and Model Calibration
For model calibration, we generated 10,000 background points at random across the terrestrial portion of the East Asian calibration region, using a land mask derived from the environmental predictor layers. Background sampling assumed a spatially uniform sampling effort across the accessible area, consistent with the standard pseudo-absence approach used in presence-background modeling frameworks.
We pooled presence and background locations into a single dataset and extracted environmental predictor values for each site. We excluded entries with one or more missing predictor values before model fitting to ensure full consistency between the occurrence dataset and the environmental layers used for calibration.
Species Distribution Modeling
We carried out all species distribution modeling in BIOMOD2 using an ensemble modeling framework that integrates multiple algorithms. Specifically, we employed five methods: Generalized Linear Models (GLM), Generalized Additive Models (GAM), Gradient Boosting Models (GBM), Random Forest (RF), and Maximum Entropy (MAXNET).
We calibrated models using an environmental cross-validation (ENV) strategy with five partitions constructed separately for each of the five retained environmental predictors, resulting in 25 environmental cross-validation runs per algorithm. Presence records were balanced across partitions. We assessed predictive performance using the True Skill Statistic (TSS) and the Area Under the Receiver Operating Characteristic Curve (AUC), and quantified variable importance through permutation-based procedures. The ENV cross-validation framework was deliberately retained for the transfer from East Asia to Europe, as it is known to improve model transferability across contrasting environmental gradients.
Ensemble Modeling and Projection
Ensemble predictions were constructed by combining individual model outputs using both an unweighted mean (EMmean) and a TSS-weighted mean (EMwmean). We excluded models with a TSS below 0.6 from the ensemble to prevent poorly performing runs from degrading the combined output. The calibrated ensemble was then projected across Europe (-10 to 40°E, 30 to 70°N) using predictor layers harmonized with those used during calibration, and we produced continuous suitability maps for A. arguta. Clamping masks were generated alongside the projections to flag areas where environmental conditions fall outside the range encountered during model training, thereby identifying regions of potential extrapolation and treating them with appropriate caution.
Uncertainty Assessment
Spatial uncertainty was quantified as the standard deviation (SD) of individual model projections for each grid cell. Outputs from all algorithms and cross-validation runs were first rescaled to a common 0–1 probability scale before computing the SD, so that higher values directly reflect greater disagreement among models. The resulting uncertainty surface was clipped to the European domain and examined alongside the ensemble suitability maps, with particular attention to areas of low predicted suitability, where relative uncertainty values tend to be inflated even when absolute disagreement is modest.
Early Spring Frost Risk Assessment
We derived a supplementary early spring frost risk layer from the mean minimum temperature in March (MarchTmin), chosen to represent the period of budburst and early vegetative development in A. arguta.
To examine how sensitive the spatial extent of risk zones is to the choice of temperature threshold, frost risk was classified under two alternative schemes:
● intermediate threshold: high risk ≤ -1.5°C; moderate -1.5 to 0°C; low warning 0 to 1°C
● less conservative threshold: high risk ≤ -1°C; moderate -1 to 0°C; low warning 0 to 1°C
The derived spring_min variable was included in SDM calibration as a climatic predictor, whereas the separate MarchTmin frost-risk layer was not used for model fitting and was instead applied as a post-hoc overlay on the ensemble suitability maps. This approach allowed direct identification of areas where otherwise favorable climatic conditions coincide with meaningful exposure to potentially damaging temperatures during critical phenological stages.
Country-level summaries of suitability patterns are provided in Table S1 and Figure S3–S5 (Supplementary Material).
Initial correlation analysis revealed strong multicollinearity among several predictors, with pairwise correlations frequently exceeding |r| = 0.8 (Figure 2), indicating the need for subsequent variable selection.
After selecting the final variables, multicollinearity was substantially reduced, with most pairwise correlations falling below |r| = 0.8 (Figure 3). Moderate correlations persisted among temperature-related predictors, whereas precipitation variables showed low correlations. This suggests they provide complementary environmental information and contribute to the model's overall stability.
3. Results
Predictive performance was moderate to high across algorithms (Table 2). The GLM achieved the highest mean TSS (0.656), while GLM and RF showed the highest mean AUC values (both 0.912). MAXNET performed at a closely comparable level (mean TSS = 0.639; mean AUC = 0.910), whereas GBM and GAM returned somewhat lower validation scores. GAM also showed the greatest variability in AUC across environmental cross-validation runs (SD AUC = 0.087). Mean AUC values ranged from 0.884 to 0.912 across algorithms. We selected the GLM for individual model interpretation because it combined the highest mean TSS with strong discriminatory performance and provided readily interpretable response curves. For spatial projections, we used ensemble predictions to integrate information across algorithms.
The mean GLM ROC curve was positioned well above the random-expectation diagonal (Figure 4), indicating strong discriminatory performance under environmental cross-validation. The percentile envelope showed variation among individual validation runs, while the mean validation AUC remained high (0.912).
Median TSS values differed modestly across algorithms, with GLM, RF, and MAXNET occupying the upper tier. At the same time, GAM and GBM showed somewhat lower central tendency and wider interquartile ranges (Figure 5). The fact that all algorithms converged within a relatively narrow performance range speaks to the overall consistency of the ensemble modeling approach. It lends additional confidence to the spatial projections derived from it.
Figure 5.
Model performance (TSS) across algorithms under environmental cross-validation (ENV). Boxplots show the distribution of TSS values across runs, while red points indicate mean TSS values.
Figure 5.
Model performance (TSS) across algorithms under environmental cross-validation (ENV). Boxplots show the distribution of TSS values across runs, while red points indicate mean TSS values.
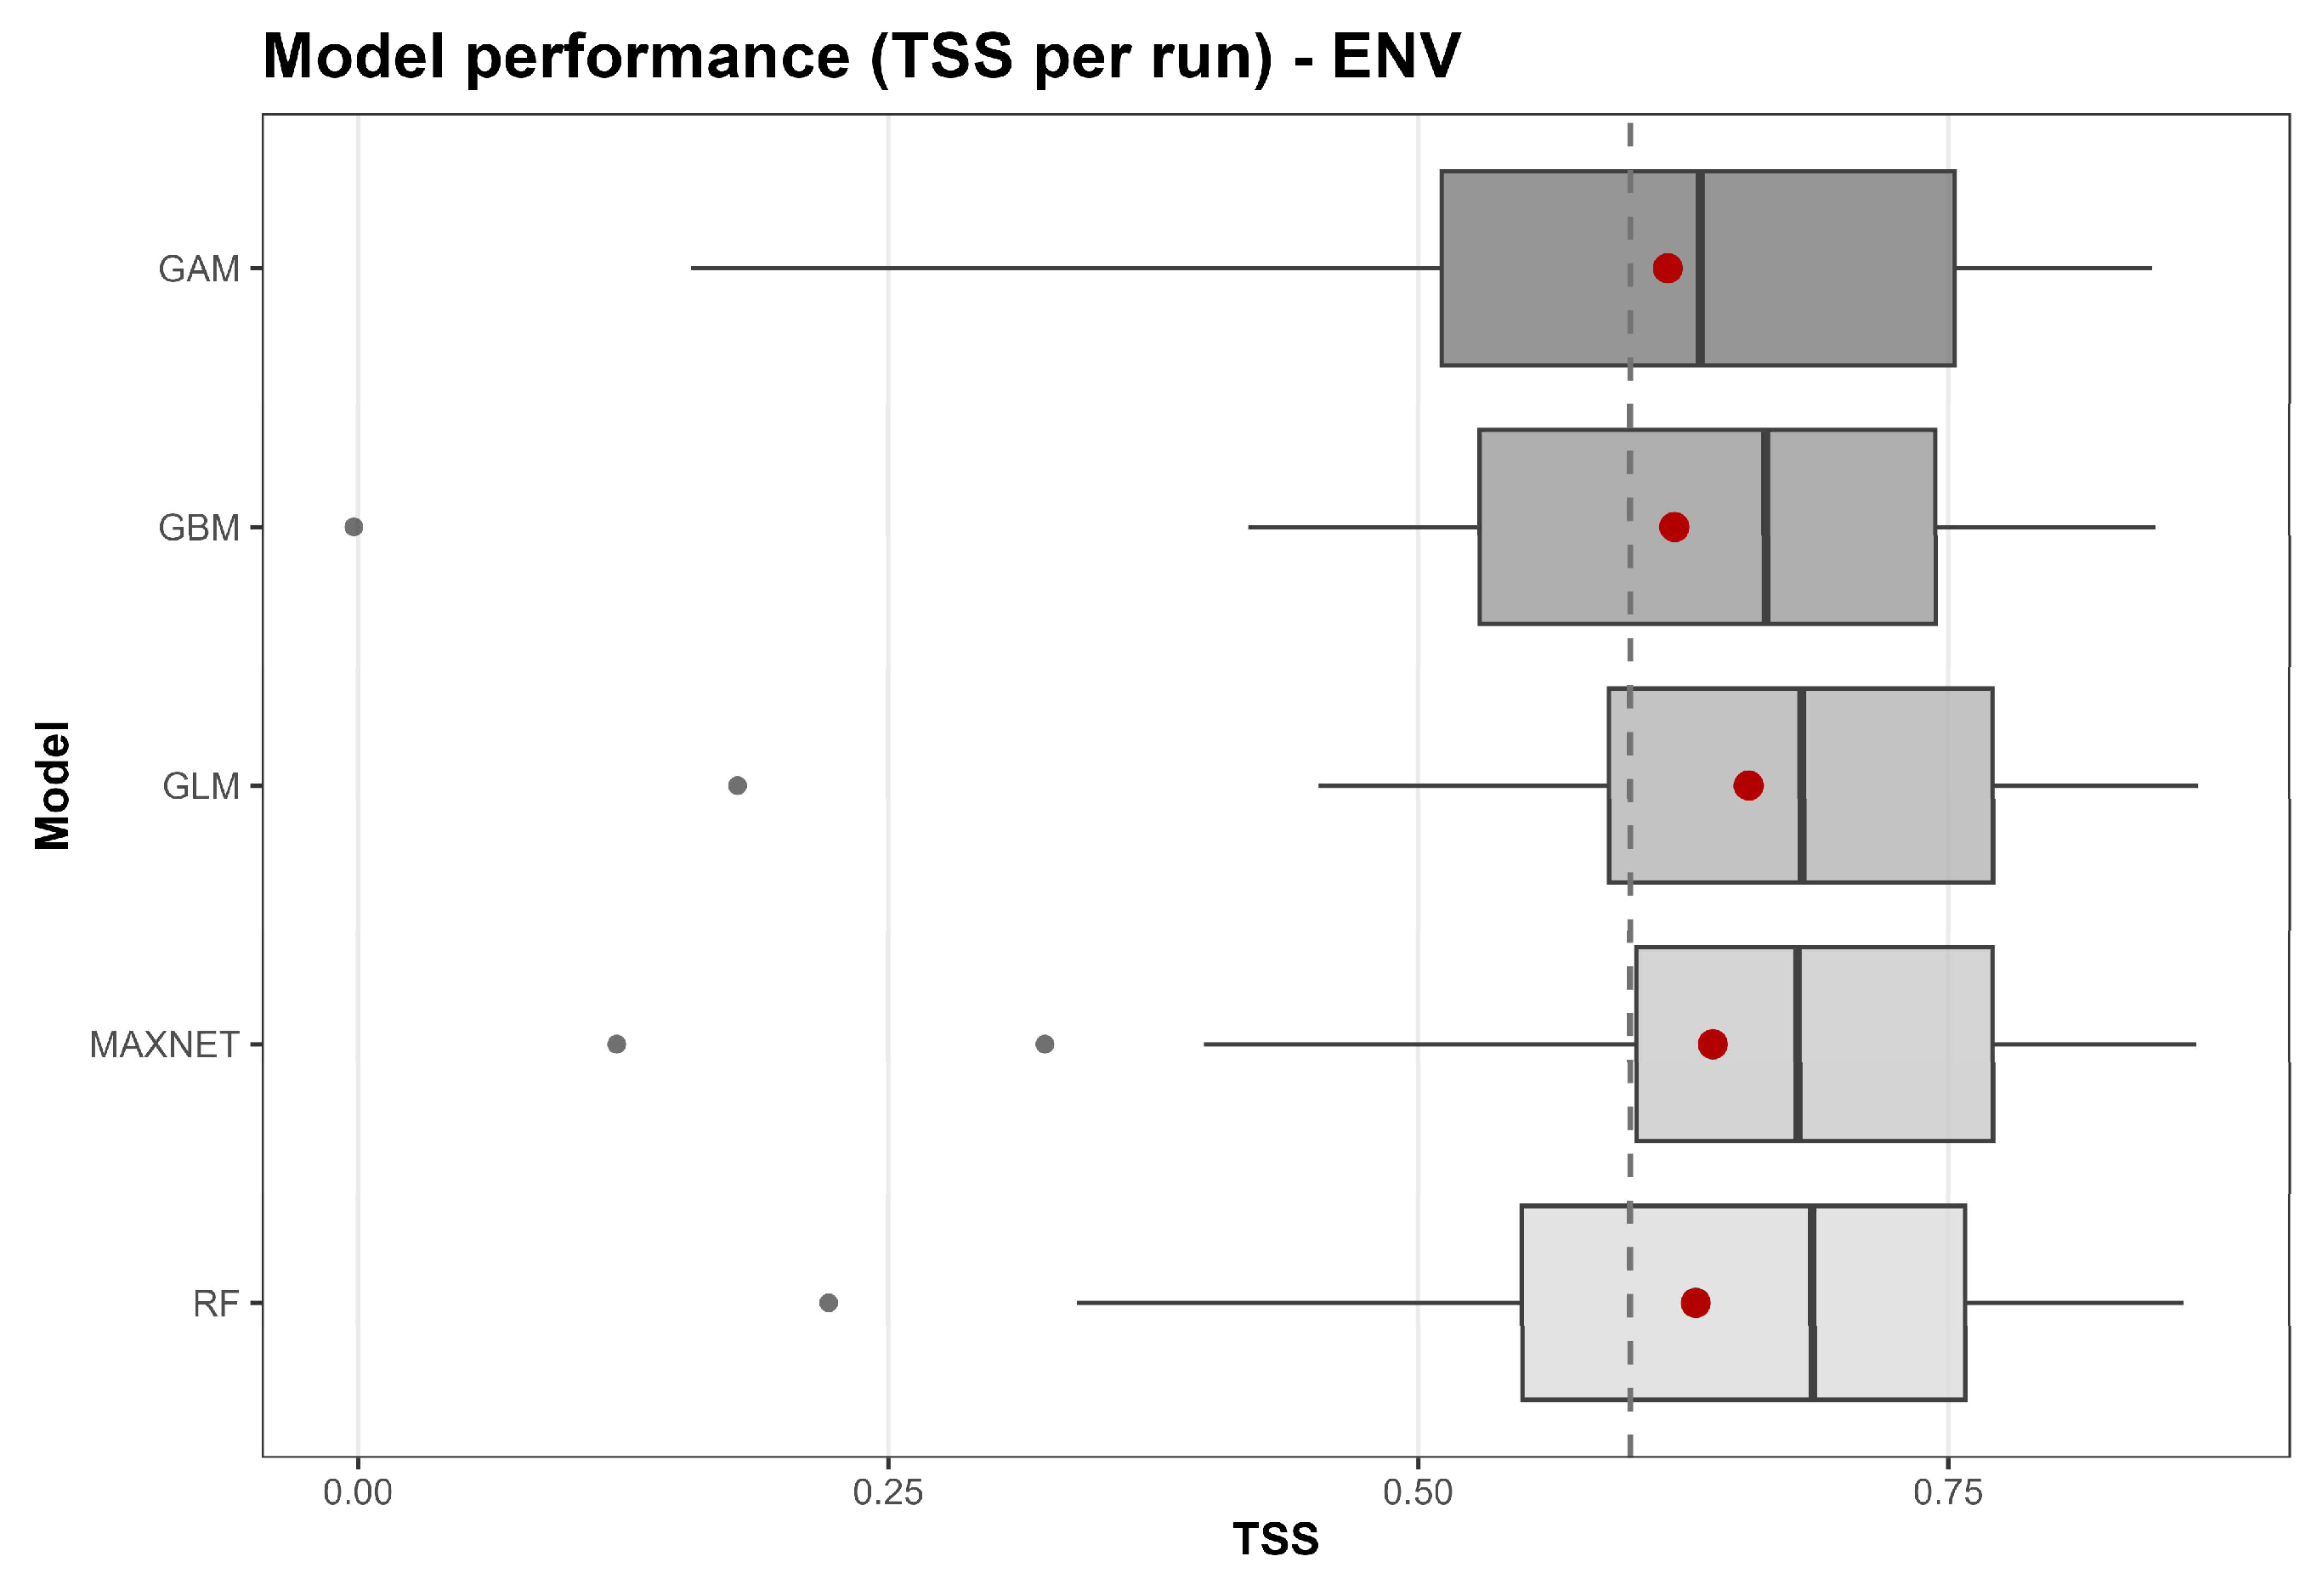
Figure 6.
Relative importance of environmental predictors across models and runs. Temperature seasonality (BIO4) was the most important predictor, while precipitation of the warmest quarter (BIO18) and spring minimum temperature (spring_min) showed nearly identical secondary importance.
Figure 6.
Relative importance of environmental predictors across models and runs. Temperature seasonality (BIO4) was the most important predictor, while precipitation of the warmest quarter (BIO18) and spring minimum temperature (spring_min) showed nearly identical secondary importance.
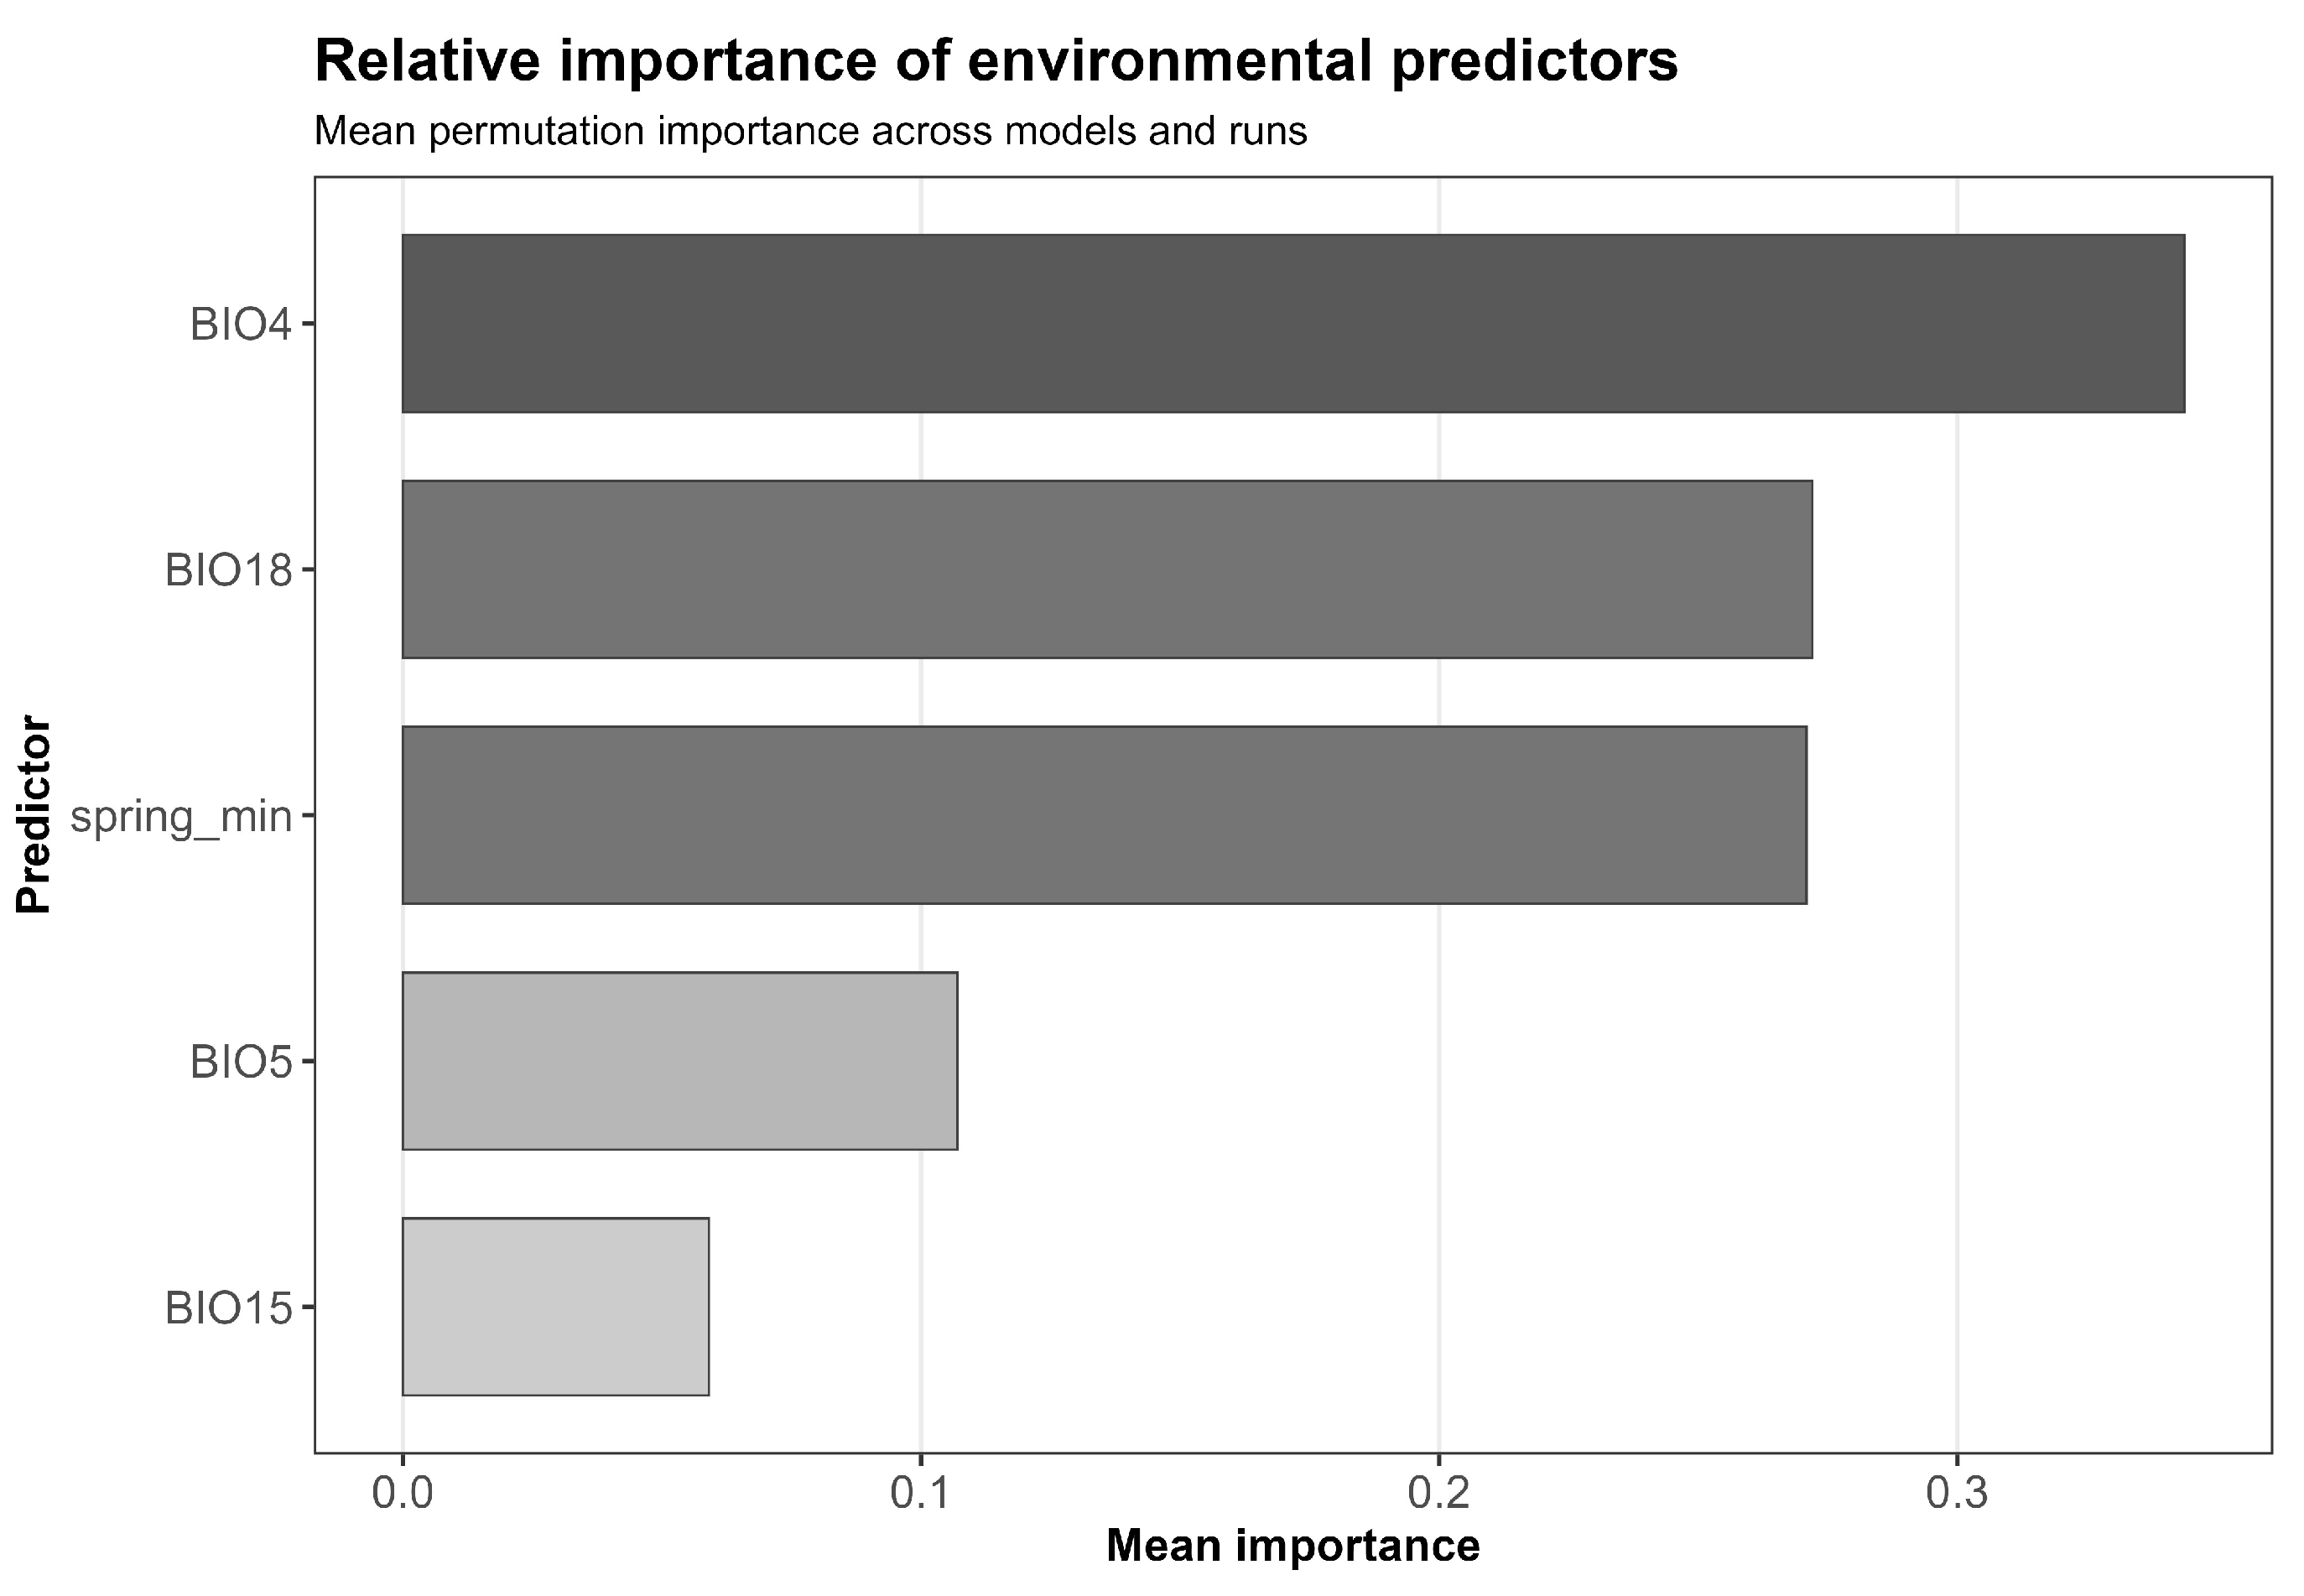
Among the retained predictors, temperature seasonality (BIO4) showed the highest mean permutation importance. BIO18 and spring_min followed at nearly identical levels, whereas BIO5 and BIO15 showed lower importance.
The ensemble suitability maps identify Central and Southeastern Europe as the most climatically favorable zone, with particularly high suitability values in mountainous landscapes such as the Alps and the Carpathians (Figure 7). Moderate suitability extends across wide swaths of Central and Eastern Europe. At the same time, values drop off sharply in the southern Mediterranean, where summer heat and aridity likely become limiting, and in northern high-latitude regions where winter temperatures remain too severe.
A comparison of the weighted ensemble (EMwmean) with the unweighted counterpart (EMmean; Supplementary Figure S2) showed highly consistent spatial patterns between the two versions, suggesting that the weighting procedure had little effect on the broad geographic distribution of suitability. This agreement across ensemble variants further supports the robustness of the results.
Prediction uncertainty was not uniformly distributed across the study domain (Figure 8). Elevated SD values were concentrated in topographically complex areas (primarily the Alps, the Carpathians, and parts of the Balkan Peninsula) as well as in northern Scandinavia [24]. The combination of rugged terrain and strong elevational gradients in these regions likely creates locally heterogeneous conditions that the models handle differently, leading to greater disagreement among individual algorithm projections.
A noteworthy spatial pattern emerges when the suitability and uncertainty maps are considered together: several of the most highly suitable areas, especially at higher elevations, simultaneously show above-average prediction uncertainty. This overlap means the apparently high suitability scores in these locations come with reduced confidence, so predictions should be interpreted with appropriate caution.
Western Europe and parts of Southern Europe, by contrast, show consistently low uncertainty, reflecting more homogeneous environmental conditions in those areas and the resulting agreement among model projections. Suitability estimates for these regions can therefore be considered more reliable than those in the mountainous and northern zones.
Climatic suitability corresponds to the ensemble mean (EMwmean). Prediction uncertainty is expressed as the standard deviation among individual model projections. We classified both variables into three quantile-based categories and combined them into a 3 × 3 bivariate classification. Suitability is represented along the horizontal axis and uncertainty along the vertical axis, allowing the identification of areas with high suitability and low uncertainty, as well as regions where predictions are less reliable.
Figure 9.
Bivariate representation of climatic suitability and prediction uncertainty for A. arguta across Europe.
Figure 9.
Bivariate representation of climatic suitability and prediction uncertainty for A. arguta across Europe.
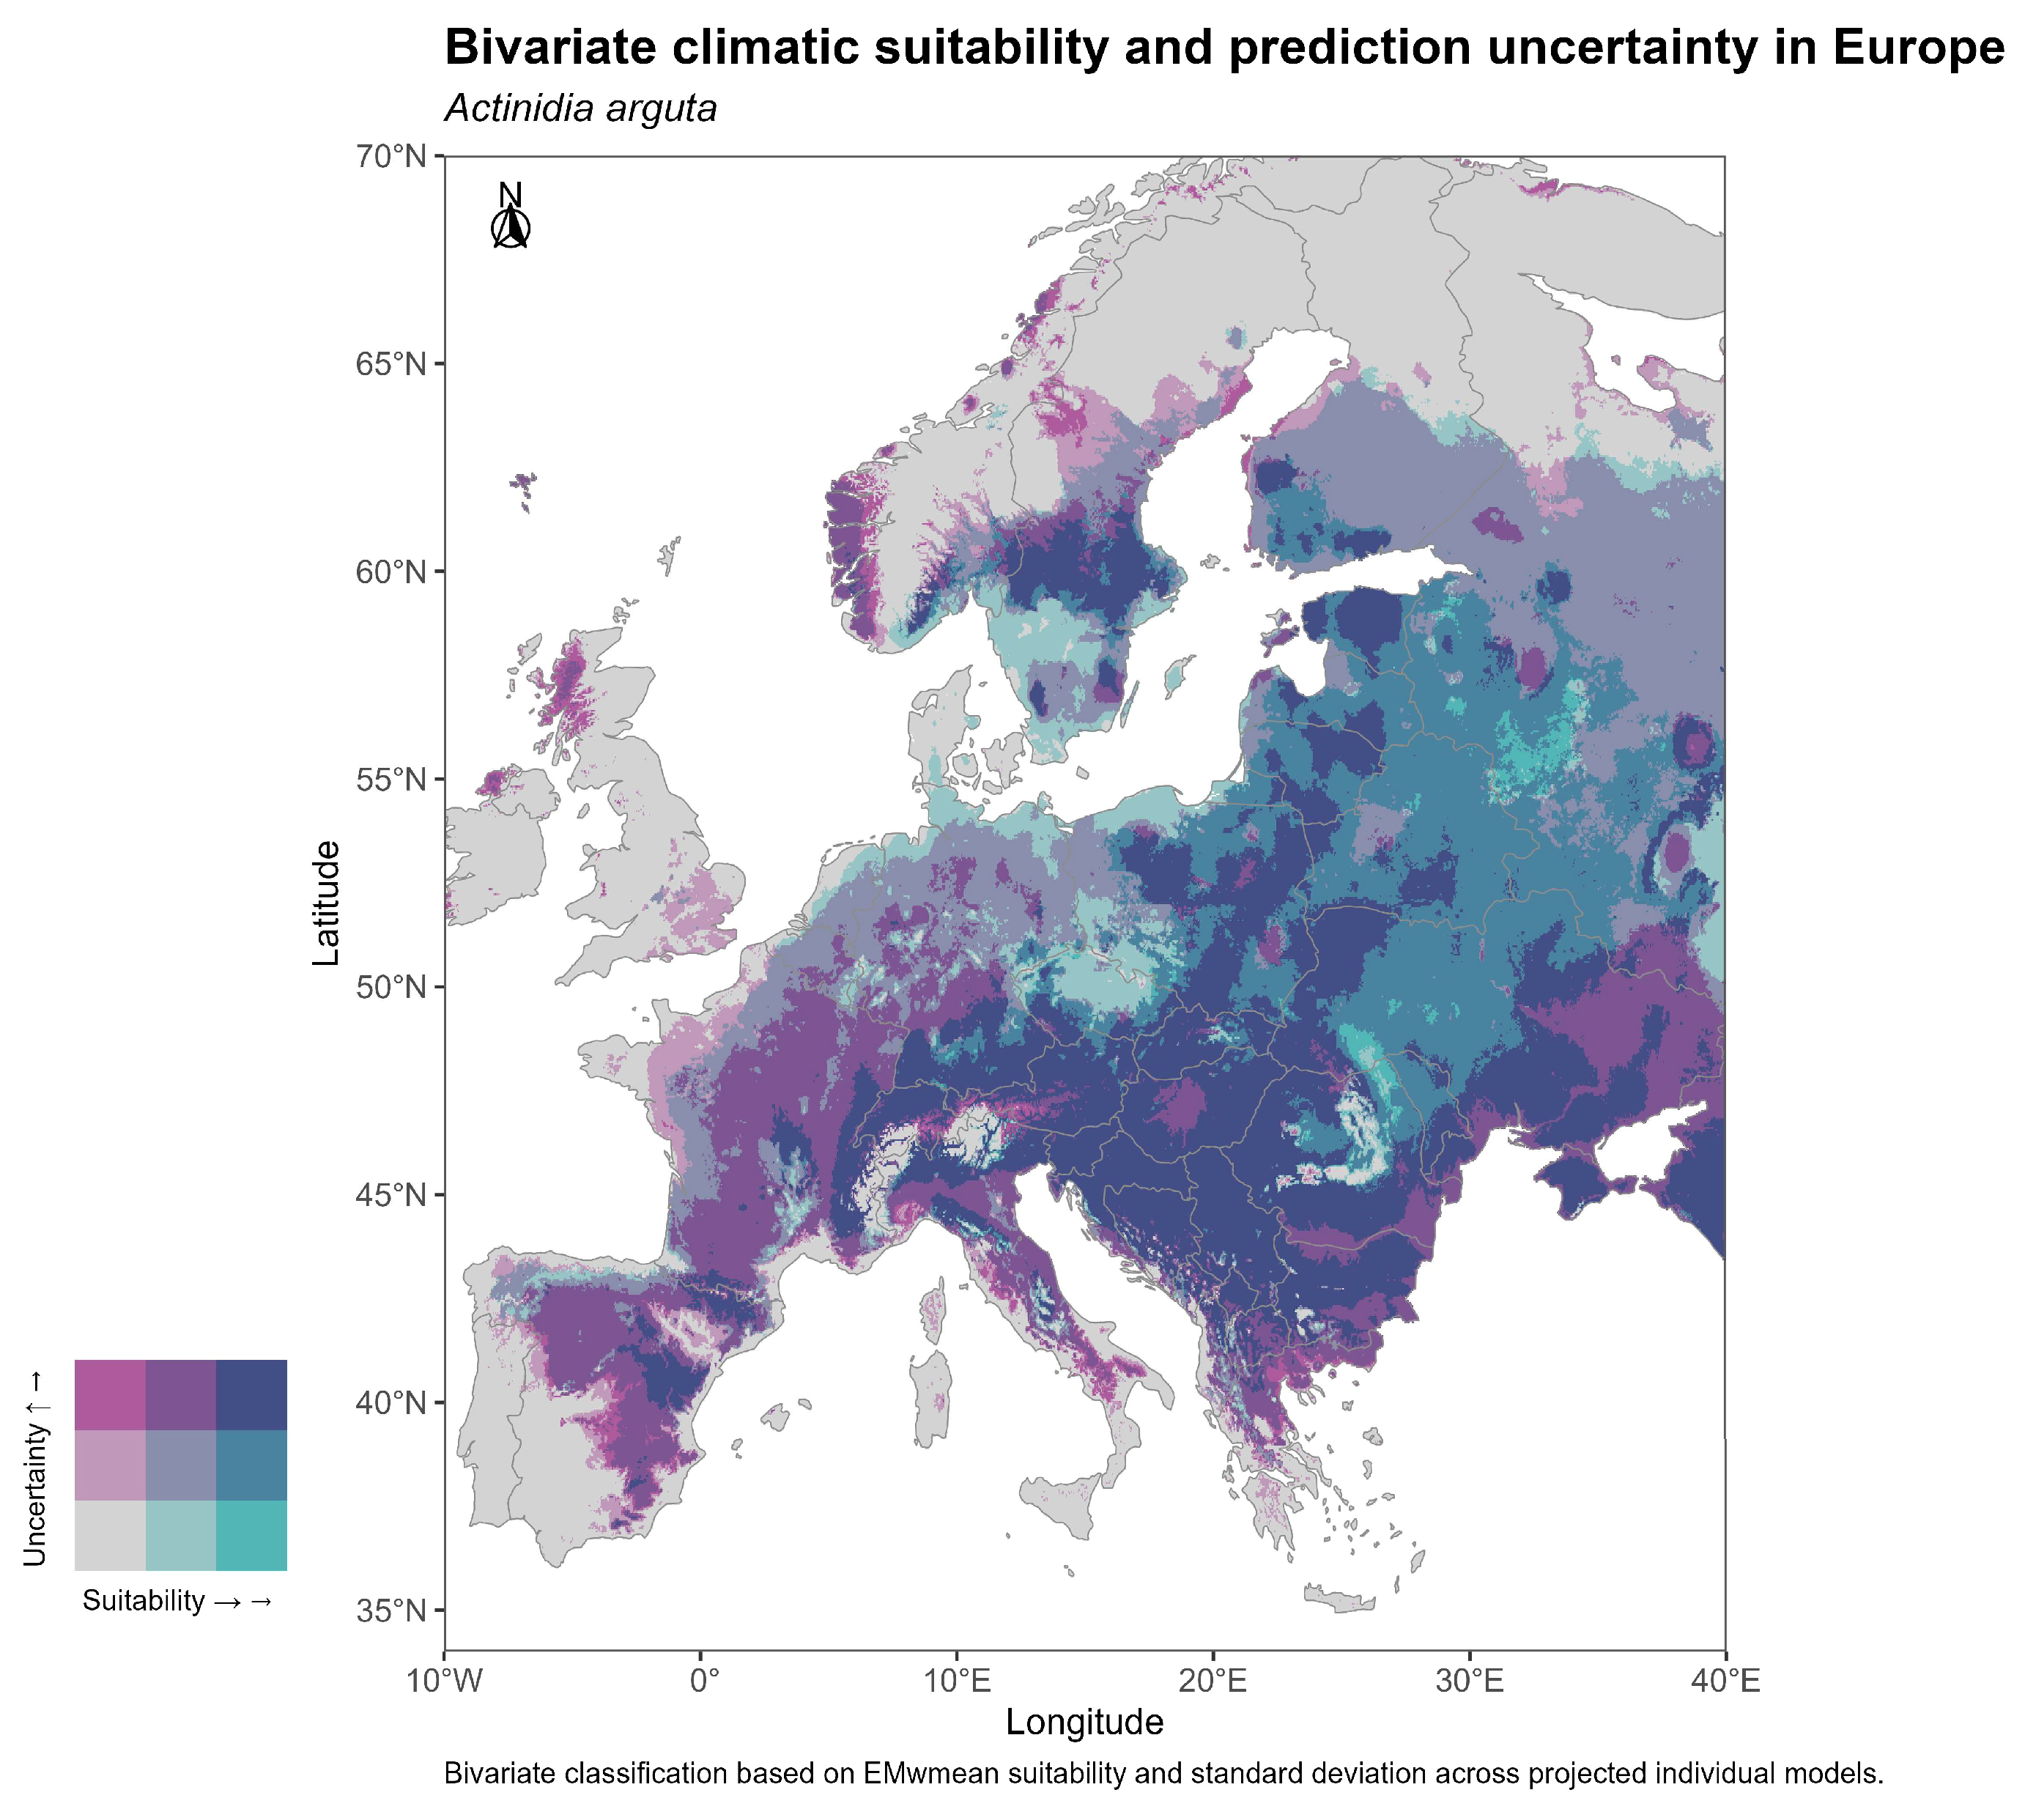
Figure 10.
Early spring frost risk across Europe based on mean March minimum temperature under a less conservative threshold scheme (high risk ≤ -1°C; moderate risk -1 to 0°C; low warning 0 to 1°C).
Figure 10.
Early spring frost risk across Europe based on mean March minimum temperature under a less conservative threshold scheme (high risk ≤ -1°C; moderate risk -1 to 0°C; low warning 0 to 1°C).
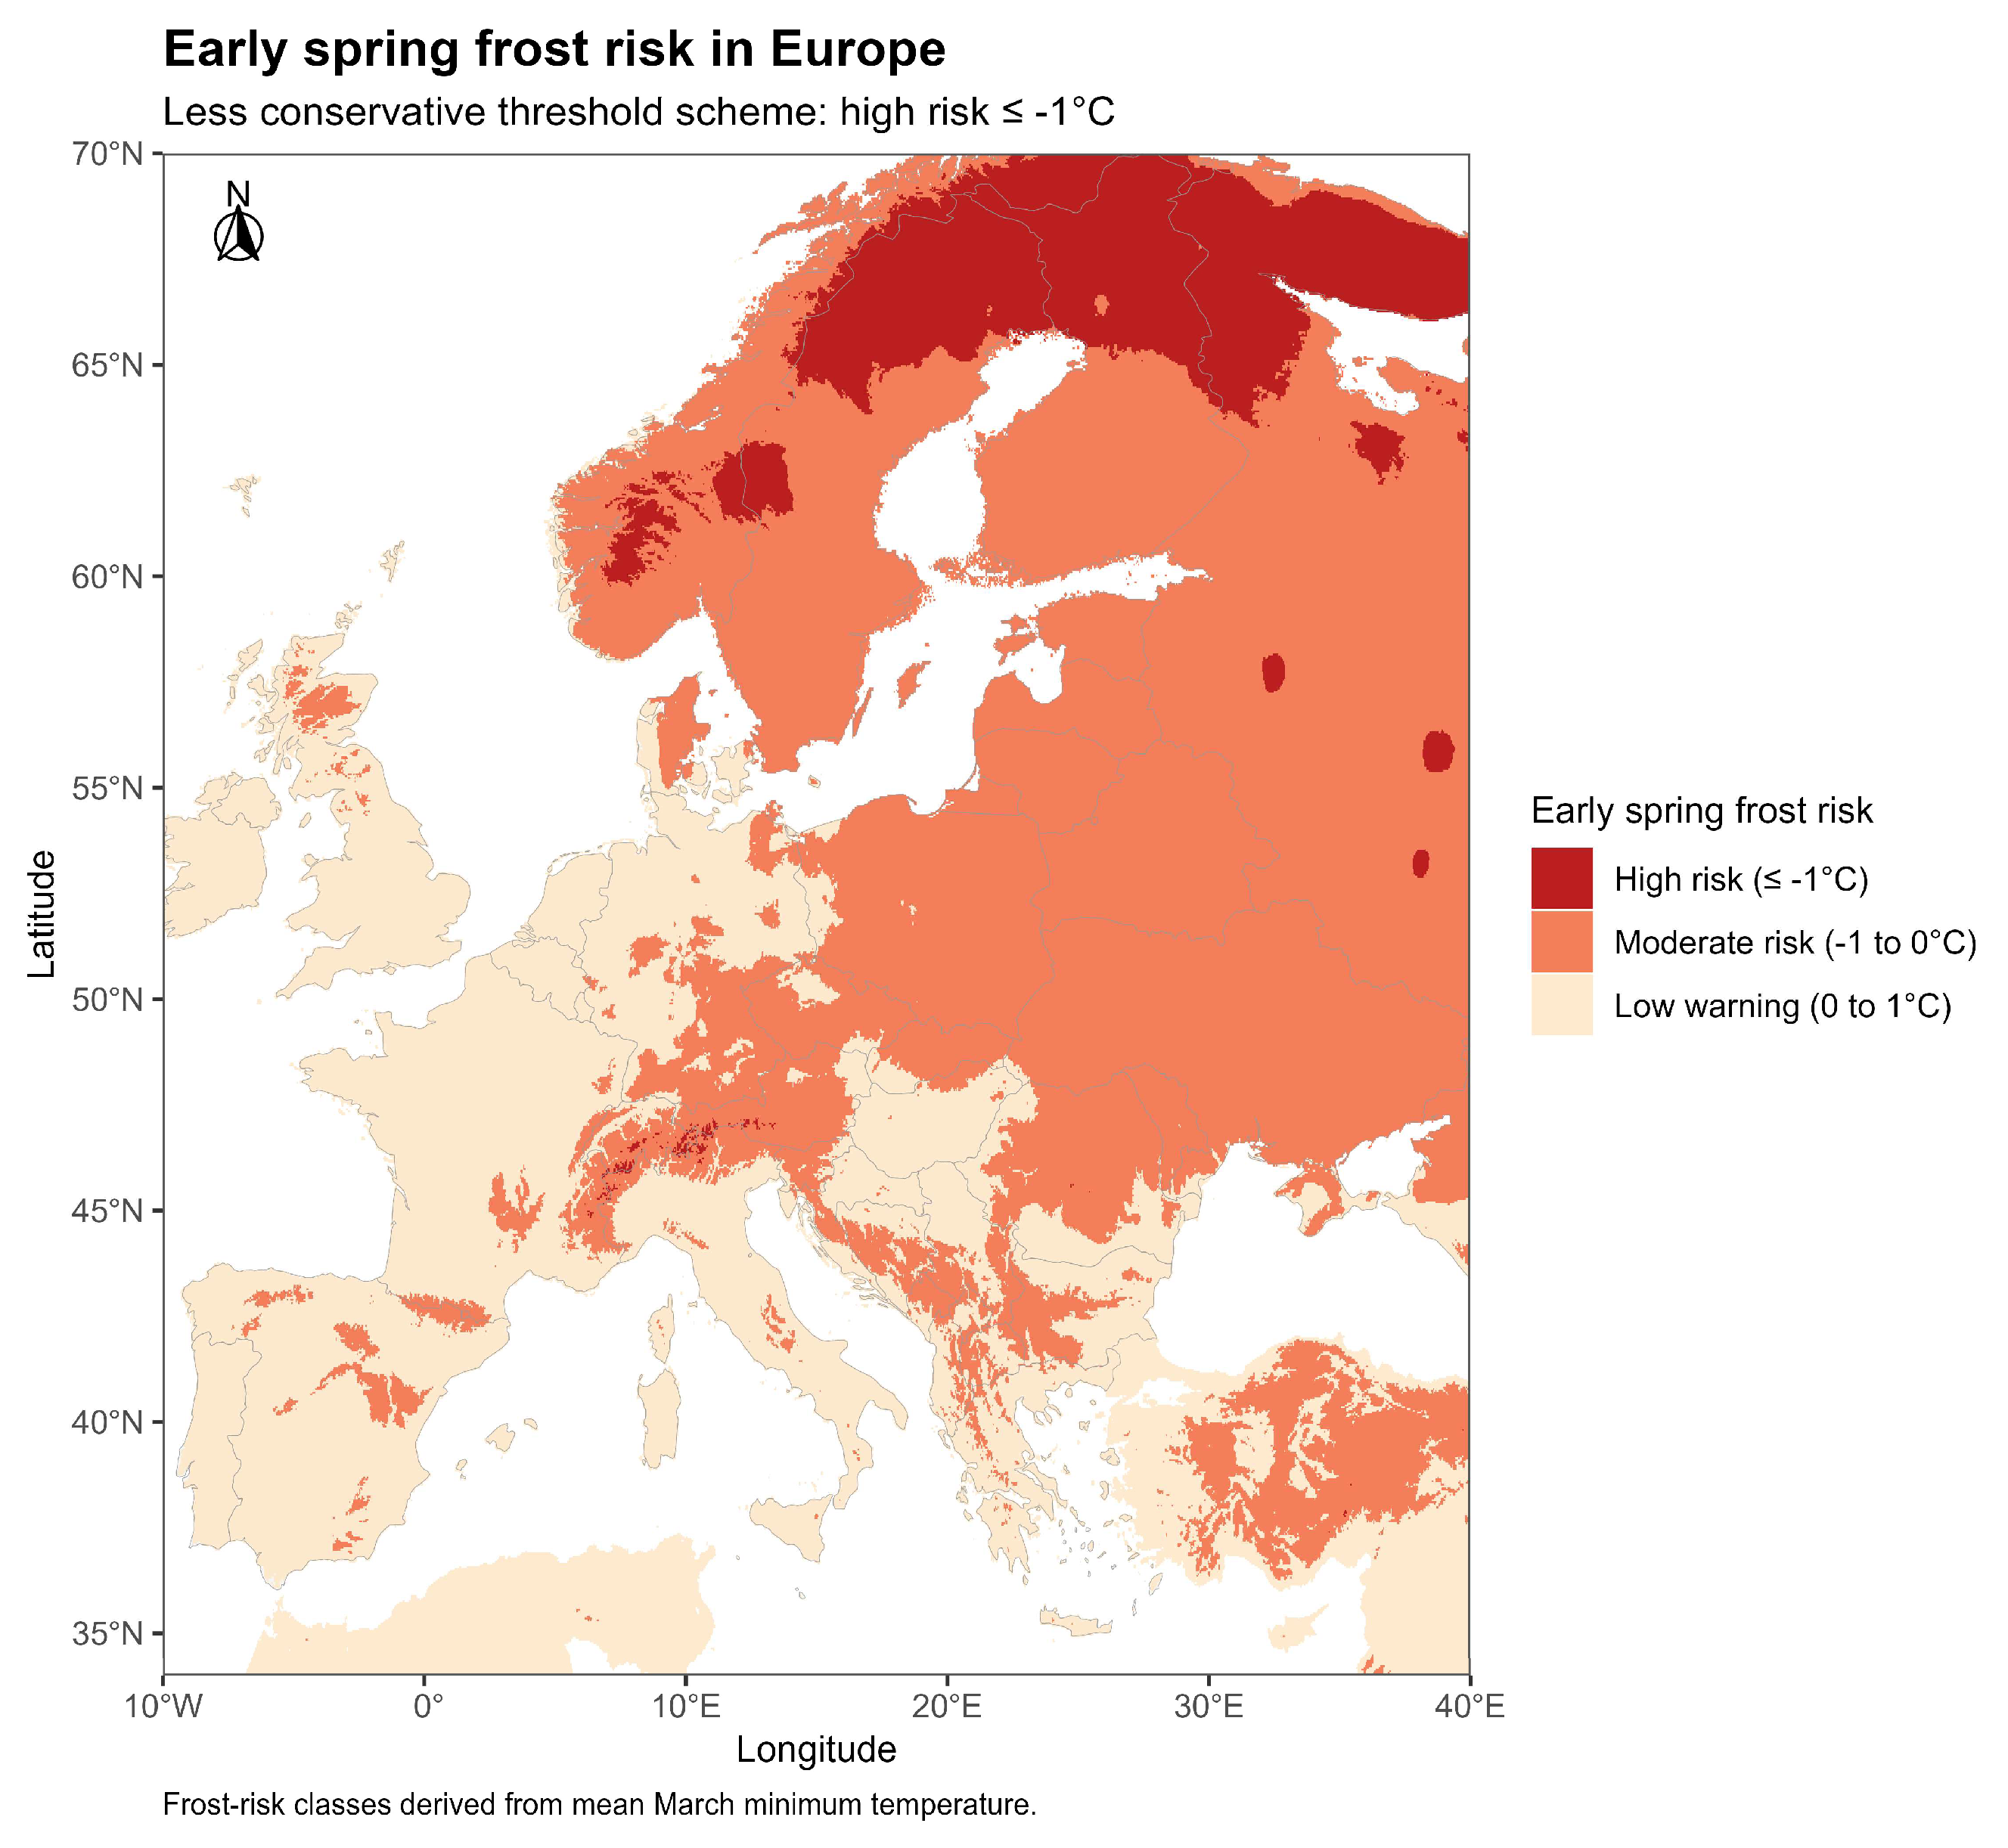
Across Europe, the spring minimum temperature closely tracks March minimum temperature, while April temperatures are consistently warmer throughout the continent. This pattern indicates that the spatial distribution of early-spring frost risk is governed almost entirely by March conditions, with April contributing little additional explanatory power.
Under the less conservative threshold scheme, early-spring frost risk becomes a widespread concern across much of the continent. High-risk areas (≤ -1°C) are most extensive in Northern Europe and Scandinavia, as well as in high-elevation zones throughout the Alps, Carpathians, and adjacent mountain ranges. Moderate frost risk (-1 to 0°C) characterizes large parts of Central and Eastern Europe and extends into Southeastern Europe, while low-warning conditions (0 to 1°C) are largely restricted to Western and Southern Europe, where maritime or Mediterranean influences moderate spring temperatures.
Figure 11.
Climatic suitability of A. arguta across Europe based on ensemble species distribution modeling, overlaid with early spring frost risk based on mean March minimum temperature under the intermediate threshold scheme (high risk ≤ -1.5°C; moderate risk -1.5 to 0°C). Moderate frost risk is shown as semi-transparent fill, while high-risk areas are delineated by contour lines representing the -1.5°C isotherm.
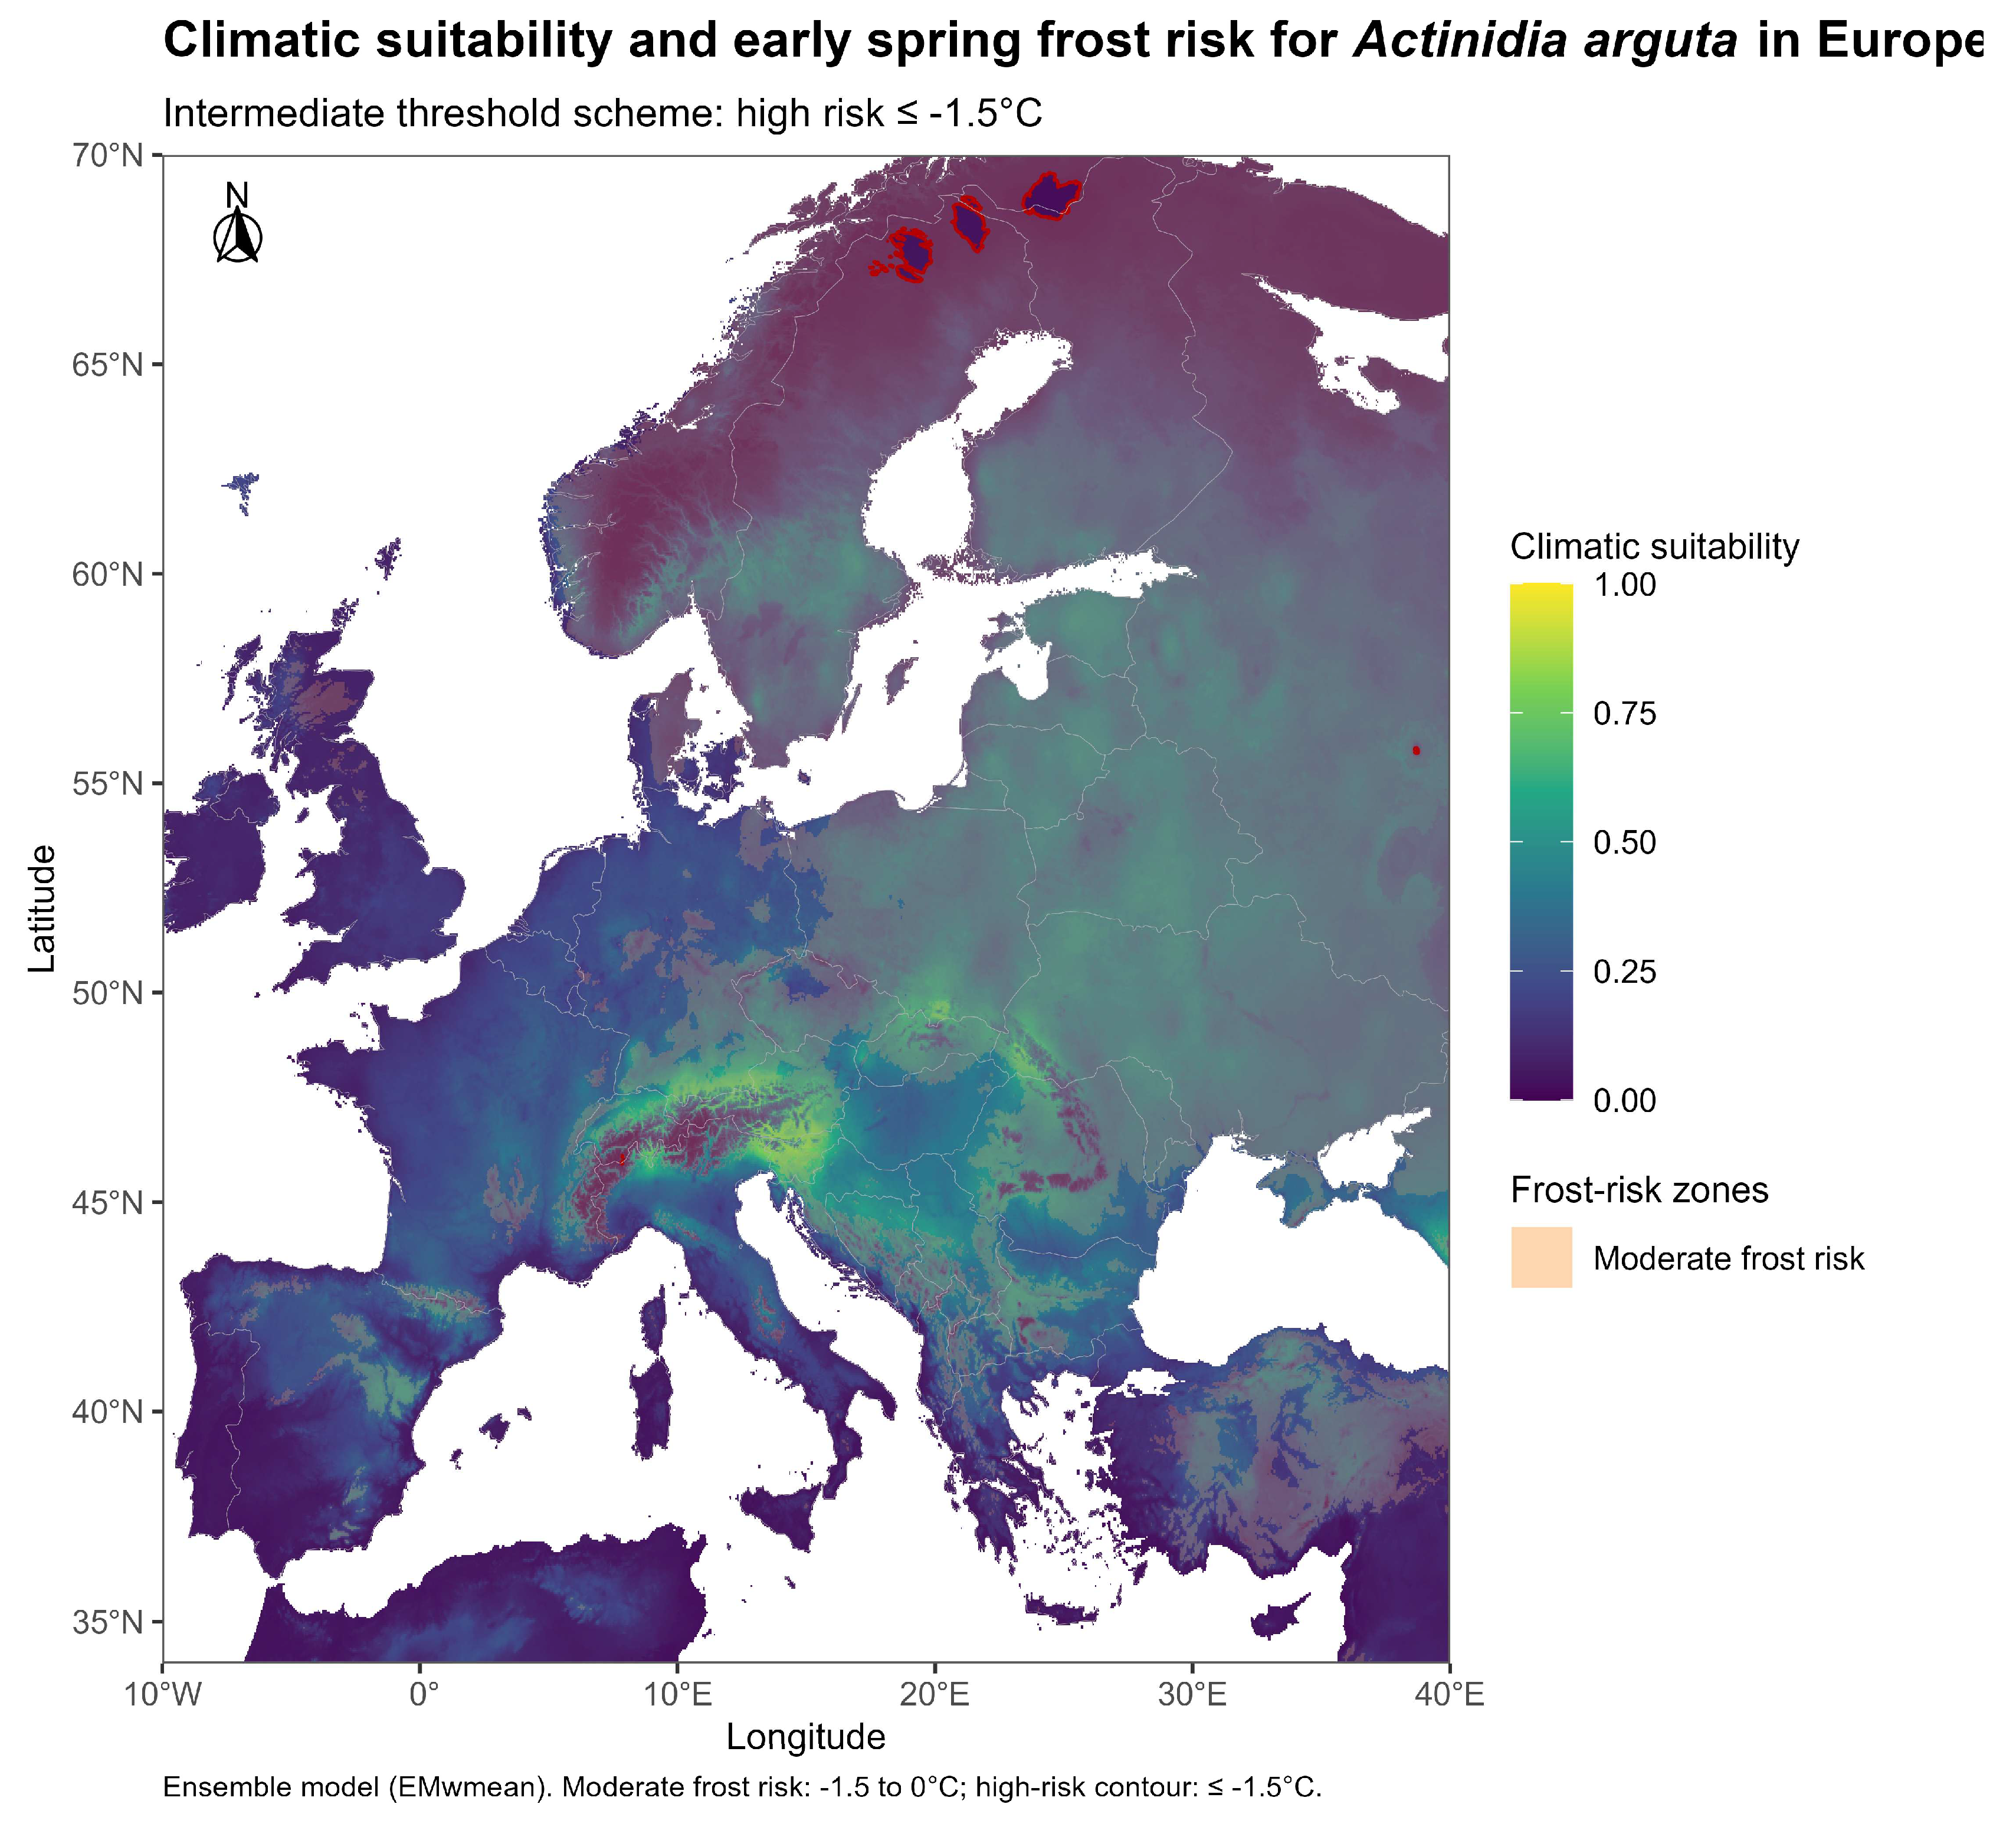
Using March minimum temperatures in the overlay maps is well justified, given the strong concordance between March temperatures and overall spring minimum temperatures in the data, which supports the assumption that conditions in that month primarily determine frost risk during the budburst period.
The ensemble suitability surface indicates that Central and Southeastern Europe are the most climatically favorable regions for A. arguta. When the intermediate frost risk threshold is applied, a partial spatial overlap between suitable areas and frost-exposed zones becomes apparent, particularly across Central Europe.
Under this threshold scheme, high-risk areas remain relatively limited in spatial extent, being largely restricted to northern and high-elevation locations. At the same time, moderate frost risk covers considerably broader areas of Central and Eastern Europe. The overall pattern suggests that, despite widespread climatic suitability, frost exposure during early spring may meaningfully constrain practical cultivation prospects for A. arguta in many of these locations during the most frost-sensitive phenological stages.
Moving from the intermediate threshold (≤ -1.5°C) to the less conservative threshold (≤ -1°C) results in a markedly larger spatial footprint of high-risk areas (Figure 12). This expansion does not signal any change in actual climatic conditions; rather, it results from including less extreme frost events in the high-risk class and reclassifying areas with moderately negative spring temperatures as high risk under the wider criterion.
This sensitivity analysis illustrates a general point that is easy to overlook in applied work: frost-risk estimates depend heavily on how thresholds are defined, not just on the underlying climate data. For this reason, any frost-risk product used to inform agricultural suitability assessments should include a clear statement of the threshold assumptions and, where possible, be tested under multiple threshold scenarios, as done here.
The response curves revealed distinct nonlinear associations between predicted suitability and the retained environmental predictors (Figure 13). Spring minimum temperature (spring_min) showed a hump-shaped response, with predicted suitability peaking at moderately negative temperatures and declining toward both colder and warmer values within the calibration range. Temperature seasonality (BIO4) was associated with high predicted suitability at lower values, followed by a pronounced decline as seasonality increased. Maximum temperature of the warmest month (BIO5) showed increasing suitability toward warmer conditions, with a slight decline at the upper end of the observed range.
Maximum temperature of the warmest month (BIO5) showed a broadly positive association with suitability, suggesting a general preference for warm summers, at least within the range of conditions in the training data.
For precipitation, BIO18 displayed a unimodal response, with suitability increasing toward intermediate-to-high warm-season precipitation and declining at the wettest end of the range. BIO15 generally showed decreasing suitability with increasing precipitation seasonality, followed by a modest upturn at the highest values. These response curves represent conditional model associations with the remaining predictors held at their median values and should not be interpreted as direct physiological thresholds.
Although individual cross-validation runs differed slightly in the exact shape and magnitude of the response curves, the broad response patterns were consistent across GLM runs, supporting the stability of the interpreted ecological relationships.
4. Discussion
Climatic Drivers of Distribution
The modeling results clearly point to temperature-related variables as the dominant determinants of A. arguta’s potential distribution across Europe. Temperature seasonality (BIO4) in particular stood out as the most influential predictor, a finding that goes beyond simple mean temperature effects: it implies that the species is sensitive not only to the average thermal environment but also to the amplitude of annual temperature fluctuations, a sensitivity pattern that has been widely documented in temperate plant species more broadly [9].
The contribution of maximum temperature of the warmest month (BIO5) points to the influence of summer heat on physiological processes and fruit development, while warm-season precipitation (BIO18) likely reflects water availability requirements during active growth [22]. These findings are consistent with earlier SDM-based work on Actinidia, in which temperature variables repeatedly emerged as the primary distribution drivers [15], and reinforce the view that A. arguta occupies a thermally defined niche within the genus.
Role of Spring Frost as a Limiting Factor
Perhaps the most practically significant finding of this study concerns the mismatch between broad climatic suitability and spring frost exposure. While large parts of Central and Southeastern Europe emerge as climatically suitable for A. arguta, a considerable portion of these same areas are also subject to moderate or high frost risk during early spring, precisely the period when the species is breaking dormancy and entering its most temperature-sensitive developmental stage. The implication is that climatically suitable zones do not automatically constitute reliable cultivation environments. This distinction is easily lost when standard SDM outputs are used without complementary risk information.
The spatial extent of this constraint is sensitive to the temperature threshold used to define frost risk. Under the more conservative intermediate criterion (≤ -1.5°C), high-risk zones remain limited in area, concentrated mainly in northern and high-elevation locations. Shifting to the less conservative threshold (≤ -1°C) substantially expands the high-risk footprint, particularly across Northern and parts of Central Europe, a shift that reflects a change in classification criteria rather than any difference in the underlying temperature data, but which has real implications for how these results might inform agricultural decisions.
These results add to a growing body of evidence indicating that early phenological activity, particularly budburst, constitutes a key vulnerability window for perennial crops, as the timing of this event frequently coincides with periods when damaging frosts remain possible [10,25]. In A. arguta, this vulnerability is exacerbated by the species’ tendency to break dormancy early. The practical takeaway is clear: suitability assessments that stop at climatic averages will systematically overestimate cultivation potential if they do not account for the probability of damaging frost events during critical phenological stages.
Role of Prediction Uncertainty
The uncertainty analysis adds an important interpretive layer to the suitability maps. The concentration of high-uncertainty values in mountainous areas and northern regions most likely reflects a combination of factors: steep environmental gradients associated with complex topography, the inherent difficulty of capturing fine-scale variation with coarse-resolution predictors, and the relatively limited representation of such conditions in the East Asian calibration dataset.
Where high suitability and elevated uncertainty coincide, as is the case in parts of the Alps and Carpathians, model outputs should be read as tentative rather than definitive. The high suitability scores in such areas may reflect genuine climatic favorability, but the uncertainty around those scores is too large to treat predictions with the same confidence as in areas where models strongly agree.
Conversely, areas that combine high predicted suitability with low uncertainty represent the most reliable candidates for further evaluation of cultivation potential. From a practical standpoint, distinguishing these reliability classes matters when model outputs inform agricultural planning decisions, as acting on overconfident predictions can lead to costly resource misallocations.
The ensemble framework adopted here mitigates individual model biases by drawing on the complementary strengths of multiple algorithms, thereby improving the overall reliability of predictions. Crucially, residual variability among models, rather than a nuisance, serves as a quantitative signal of where predictions are more or less trustworthy. Uncertainty, in this view, is not a flaw to be minimized but an integral component of responsible model interpretation.
Implications for Cultivation and Agricultural Planning
From an applied perspective, the results make clear that successful cultivation of A. arguta in Europe will depend heavily on careful site selection, particularly identifying locations that benefit from frost-protected microclimates during the critical budburst period.
Sites that combine moderate to high ensemble suitability with low frost exposure represent the most attractive targets for cultivation expansion. That said, regional-scale suitability maps cannot substitute for local-level assessments: terrain, slope aspect, proximity to water bodies, and local wind patterns can create microclimatic conditions that either exacerbate or buffer frost exposure well beyond what coarse-resolution predictors can capture [24].
The model's prominent influence of temperature variability and frost risk also has direct implications for cultivar selection strategies. Varieties characterized by delayed budbreak or enhanced frost tolerance are likely to perform more consistently in regions where spring frost exposure is a recurring concern, and their development or identification should be a priority for breeding programs targeting European expansion.
More broadly, the framework developed in this study, which integrates climatic suitability, frost risk, and spatial uncertainty, offers a more realistic and operationally useful basis for evaluating cultivation potential than any single-layer suitability map could provide. Each component adds distinct, complementary information: suitability maps indicate where climate is broadly favorable, frost risk maps highlight where that favorability may be seasonally disrupted, and uncertainty maps communicate how much confidence to place in each prediction.
Postharvest Limitations and Commercial Relevance
Despite its ecological adaptability, which makes A. arguta an attractive candidate for European cultivation, the species currently occupies a niche position in commercial markets [21]. A key limiting factor is its short postharvest storage life of approximately 4–6 weeks under refrigeration, which compares unfavorably to the several-month storage potential of A. deliciosa [20] and restricts the geographic reach of commercial distribution.
Recent progress in molecular biology and crop breeding, however, suggests this bottleneck may not be permanent. Several studies have characterized genes involved in fruit softening and postharvest physiology and identified molecular markers that could be used in targeted selection programs to improve storage performance [14,26].
The potential significance of these developments is underscored by the fact that commercial cultivation of A. arguta is already underway outside its native range, including in Poland and Georgia [11]. These cases demonstrate both the species' adaptability to temperate environments and the importance of understanding site-specific climatic constraints before committing to large-scale production.
In this context, spatially explicit suitability assessments become particularly valuable tools. By identifying regions where climatic conditions are not only broadly favorable but also sufficiently stable to support reliable production, they can direct investment in cultivar trials, postharvest infrastructure, and agronomic development toward areas with genuinely promising commercial prospects.
Methodological Considerations
Several methodological choices made in this study merit discussion. The adoption of environmental cross-validation (ENV strategy) was motivated by the need to maximize transferability from the East Asian calibration domain to Europe, where environmental conditions differ substantially. By partitioning data along environmental rather than geographic gradients, this approach reduces the risk of overfitting to the training data's spatial structure. Similarly, combining statistical criteria (VIF-based collinearity screening) with ecological judgment in variable selection helped keep the model parsimonious while ensuring the retained predictors were mechanistically linked to the species' known constraints.
The ensemble framework, by simultaneously drawing on multiple algorithms, further improved prediction reliability and reduced the influence of algorithm-specific biases. Spatial uncertainty, as quantified by the standard deviation across model projections, was highest in mountainous regions (particularly the Alps, Carpathians, and parts of the Balkan Peninsula) and in northern Scandinavia. These are precisely the areas one would expect to be most challenging for ensemble models, given the strong and complex environmental gradients associated with high relief and high latitudes.
Limitations and Future Directions
Several limitations of the present work should be acknowledged. The post-hoc MarchTmin frost-risk layer, while ecologically motivated, is a simplified proxy: it represents mean March minimum temperature but does not reflect the frequency or intensity of discrete frost events, nor does it account for fine-scale microclimatic variability driven by terrain, land cover, or proximity to water bodies. Factors such as soil properties, drainage characteristics, and local management practices were likewise outside the scope of this study, even though they can meaningfully influence crop performance within climatically suitable areas.
Future work could address these gaps by incorporating soil and topographic data into the modeling framework and applying the approach to projected future climate scenarios, allowing assessment of how suitability and frost risk distributions might shift over the coming decades under different emission pathways. Integrating actual frost-event frequency data, where available, would further refine the frost risk component beyond what monthly mean minimum temperatures alone can convey.
Despite these limitations, the combined consideration of climatic suitability, frost risk, and spatial uncertainty developed here provides a more complete, application-oriented framework for evaluating cultivation potential than has typically been used in previous SDM studies targeting Actinidia. This framework is readily extendable to other perennial crops facing similar phenological constraints, and its integration into agricultural planning tools could support more evidence-based decision-making as climate conditions continue to change.
5. Conclusions
This study applied an ensemble species distribution modeling approach to assess the climatic suitability of Actinidia arguta across Europe, complementing the suitability analysis with an explicit evaluation of early-spring frost risk. The results consistently highlighted temperature-related variables as the dominant determinants of the species’ potential distribution, with temperature seasonality (BIO4), precipitation of the warmest quarter (BIO18), and early-spring minimum temperature (spring_min) emerging as the three most influential predictors.
The ensemble suitability maps indicated Central and Southeastern Europe, particularly areas with mild climates and mountainous terrain, as the most promising regions for hardy kiwi cultivation. At the same time, the frost risk analysis revealed that a substantial proportion of these climatically suitable areas also face moderate or high frost risk during budburst and early vegetative growth. This spatial coincidence underscores a central conclusion of the study: without accounting for frost exposure, climatic suitability alone is likely to overestimate A. arguta's reliable cultivation potential.
Prediction reliability, as expressed by the spatial distribution of ensemble uncertainty, was not uniform across the continent. Higher uncertainty was largely concentrated in mountainous areas and northern latitudes, where complex environmental gradients contribute to disagreement among individual model projections. Areas that combine moderate to high suitability with comparatively low uncertainty offer the most reliable basis for future cultivation expansion and agricultural planning decisions.
Future research should extend this framework by incorporating additional environmental parameters, including soil properties, topographic variables, and projected climate scenarios, to further refine the suitability maps and frost risk assessments and to examine how the geographic distribution of cultivation potential may evolve under anticipated climate trajectories.
Supplementary Materials
The following supporting information can be downloaded at the website of this paper posted on Preprints.org, Figure S1. Spatial sampling density of A. arguta occurrence records in East Asia derived from cleaned GBIF data prior to spatial thinning; Figure S2. Climatic suitability for A. arguta in Europe based on the unweighted ensemble (EMmean); Figure S3. Country-level climatic suitability thresholds for A. arguta across Europe based on maximum predicted suitability: (A) countries with maximum suitability ≥ 0.5 and (B) countries with maximum suitability ≥ 0.7; Table S1. Country-level metrics of climatic suitability for A. arguta across Europe, including the spatial extent of areas exceeding suitability thresholds (> 0.5 and > 0.8); Figure S4. Maximum ensemble-predicted climatic suitability (EMwmean) for A. arguta across European countries; Figure S5. Mean ensemble-predicted climatic suitability (EMwmean) for A. arguta across European countries.
Author Contributions
Conceptualization, I.C.; methodology, I.C. and A.M.; software, A.M.; validation, A.M. and I.C.; formal analysis, A.M.; investigation, A.M.; resources, I.C.; data curation, A.M.; writing—original draft preparation, A.M.; writing—review and editing, I.C.; visualization, A.M.; supervision, I.C.; project administration, I.C.; funding acquisition, not applicable. All authors have read and agreed to the published version of the manuscript.
Funding
This research received no external funding.
Data Availability Statement
The original contributions presented in this study are included in the article and into Supplementary Materials. The R code is freely available via the GitHub repository (Link: https://github.com/git5843/actinidia-arguta-sdm). Further inquiries can be directed to the corresponding author.
Conflicts of Interest
Athanasios Margaritidis is the owner of QAgronet. The other author declares no conflict of interest.
References
- Osorio-Marín, J.; Fernandez, E.; Vieli, L.; Ribera, A.; Luedeling, E.; Cobo, N. Climate Change Impacts on Temperate Fruit and Nut Production: A Systematic Review. Front. Plant Sci. 2024, 15. [Google Scholar] [CrossRef] [PubMed]
- Ma, Y.; Lu, X.; Li, K.; Wang, C.; Guna, A.; Zhang, J. Prediction of Potential Geographical Distribution Patterns of Actinidia Arguta under Different Climate Scenarios. Sustainability 2021, 13, 3526. [Google Scholar] [CrossRef]
- Faraz, M.; Mereu, V.; Spano, D.; Trabucco, A.; Marras, S.; El Chami, D. A Systematic Review of Analytical and Modelling Tools to Assess Climate Change Impacts and Adaptation on Coffee Agrosystems. Sustainability 2023, 15, 14582. [Google Scholar] [CrossRef]
- Charalampopoulos, I.; Droulia, F.; Mavridi, A.; Roussos, P.A. Mapping the Climatic Suitability for Olive Groves in Greece. Agronomy 2025, 15, 2604. [Google Scholar] [CrossRef]
- Margaritidis, A.K. Site and Regional Trend Analysis of Precipitation in Central Macedonia, Greece. Comput. Water Energy Environ. Eng. 2021, 10, 49–70. [Google Scholar] [CrossRef]
- Elith, J.; Phillips, S.J.; Hastie, T.; Dudík, M.; Chee, Y.E.; Yates, C.J. A Statistical Explanation of MaxEnt for Ecologists. Divers. Distrib. 2011, 17, 43–57. [Google Scholar] [CrossRef]
- Phillips, S.J.; Anderson, R.P.; Dudík, M.; Schapire, R.E.; Blair, M.E. Opening the Black Box: An Open-Source Release of Maxent. Ecography 2017, 40, 887–893. [Google Scholar] [CrossRef]
- Chuine, I. Why Does Phenology Drive Species Distribution? Philos. Trans. R Soc. Lond. B Biol. Sci. 2010, 365, 3149–3160. [Google Scholar] [CrossRef] [PubMed]
- Körner, C.; Basler, D. Phenology Under Global Warming. Science 2010, 327, 1461–1462. [Google Scholar] [CrossRef] [PubMed]
- Gu, L.; Hanson, P.J.; Post, W.M.; Kaiser, D.P.; Yang, B.; Nemani, R.; Pallardy, S.G.; Meyers, T. The 2007 Eastern US Spring Freeze: Increased Cold Damage in a Warming World? BioScience 2008, 58, 253–262. [Google Scholar] [CrossRef]
- Latocha, P. The Nutritional and Health Benefits of Kiwiberry (Actinidia Arguta) - a Review. Plant Foods Hum. Nutr. 2017, 72, 325–334. [Google Scholar] [CrossRef] [PubMed]
- Pinto, D.; Delerue-Matos, C.; Rodrigues, F. Bioactivity, Phytochemical Profile and pro-Healthy Properties of Actinidia Arguta: A Review. Food Res. Int. 2020, 136, 109449. [Google Scholar] [CrossRef] [PubMed]
- Huang, H. Kiwifruit: The Genus ACTINIDIA; Academic Press, 2016; ISBN 978-0-12-803067-7. [Google Scholar]
- Wang, Z.; Luo, M.; Ye, L.; Peng, J.; Luo, X.; Gao, L.; Huang, Q.; Chen, Q.; Zhang, L. Prediction of the Potentially Suitable Areas of Actinidia Latifolia in China Based on Climate Change Using the Optimized MaxEnt Model. Sustainability 2024, 16, 5975. [Google Scholar] [CrossRef]
- Niu, Z.; Han, D.; Niu, Z.; Roussos, P.A.A.; Cheng, T.; Xie, J.; Cao, G.; Liu, D.; Jin, N.; Zhang, D. Assessment of Potential Habitat Suitability for Kiwifruit (Actinidia Spp) in Shaanxi Province under Climate Change Scenarios. Front. Plant Sci. 2025, 16. [Google Scholar] [CrossRef] [PubMed]
- Dormann, C.F.; Elith, J.; Bacher, S.; Buchmann, C.; Carl, G.; Carré, G.; Marquéz, J.R.G.; Gruber, B.; Lafourcade, B.; Leitão, P.J.; et al. Collinearity: A Review of Methods to Deal with It and a Simulation Study Evaluating Their Performance. Ecography 2013, 36, 27–46. [Google Scholar] [CrossRef]
- Wulff, E.; Bouillon, J. Erstellung einer neuen Winterhärtezonenkarte für Europa unter Berücksichtigung mesoklimatischer Effekte. [PubMed]
- Bieniek, A.; Dragańska, E.; Pranckietis, V. Assesment of Climatic Conditions for Actinidia Arguta Cultivation in North-Eastern Poland. Zemdirbyste-Agriculture 2016, 103, 311–318. [Google Scholar] [CrossRef]
- Bobokashvili, Z.; Maglakelidze, E.; Kvaliasvili, V. Biological and Agricultural Characterization of Introduced Variety „Weiki” (Actinidia Arguta Planch) in Georgia; CEP USM, 2024; ISBN 978-9975-62-766-5. [Google Scholar]
- Ferguson, A. Kiwifruit: A Botanical Review. In Horticultural Reviews; 2011; Vol. 16, pp. 1–64. ISBN 978-1-118-06079-7. [Google Scholar]
- Debersaques, F.; Mekers, O.; Decorte, J.; Van Labeke, M.C.; Schoedl-Hummel, K.; Latocha, P. CHALLENGES FACED BY COMMERCIAL KIWIBERRY (ACTINIDIA ARGUTE PLANCH.) PRODUCTION. Acta Hortic. 2015, 435–442. [Google Scholar] [CrossRef]
- Fick, S.E.; Hijmans, R.J. WorldClim 2: New 1-Km Spatial Resolution Climate Surfaces for Global Land Areas. Int. J. Climatol. 2017, 37, 4302–4315. [Google Scholar] [CrossRef]
- Hijmans, R.J.; Cameron, S.E.; Parra, J.L.; Jones, P.G.; Jarvis, A. Very High Resolution Interpolated Climate Surfaces for Global Land Areas. Int. J. Climatol. 2005, 25, 1965–1978. [Google Scholar] [CrossRef]
- Körner, C. The Use of ‘Altitude’ in Ecological Research. Trends Ecol. Evol. 2007, 22, 569–574. [Google Scholar] [CrossRef] [PubMed]
- Vitasse, Y.; Bottero, A.; Cailleret, M.; Bigler, C.; Fonti, P.; Gessler, A.; Lévesque, M.; Rohner, B.; Weber, P.; Rigling, A.; et al. Contrasting Resistance and Resilience to Extreme Drought and Late Spring Frost in Five Major European Tree Species. Glob. Change Biol. 2019, 25, 3781–3792. [Google Scholar] [CrossRef] [PubMed]
- Li, X.; Xu, C.; Korban, S.S.; Chen, K. Regulatory Mechanisms of Textural Changes in Ripening Fruits. Crit. Rev. Plant Sci. 2010, 29, 222–243. [Google Scholar] [CrossRef]
Figure 3.
Correlation matrix of the final predictor set after VIF filtering and ecological selection. Reduced multicollinearity supports model stability and interpretability.
Figure 3.
Correlation matrix of the final predictor set after VIF filtering and ecological selection. Reduced multicollinearity supports model stability and interpretability.
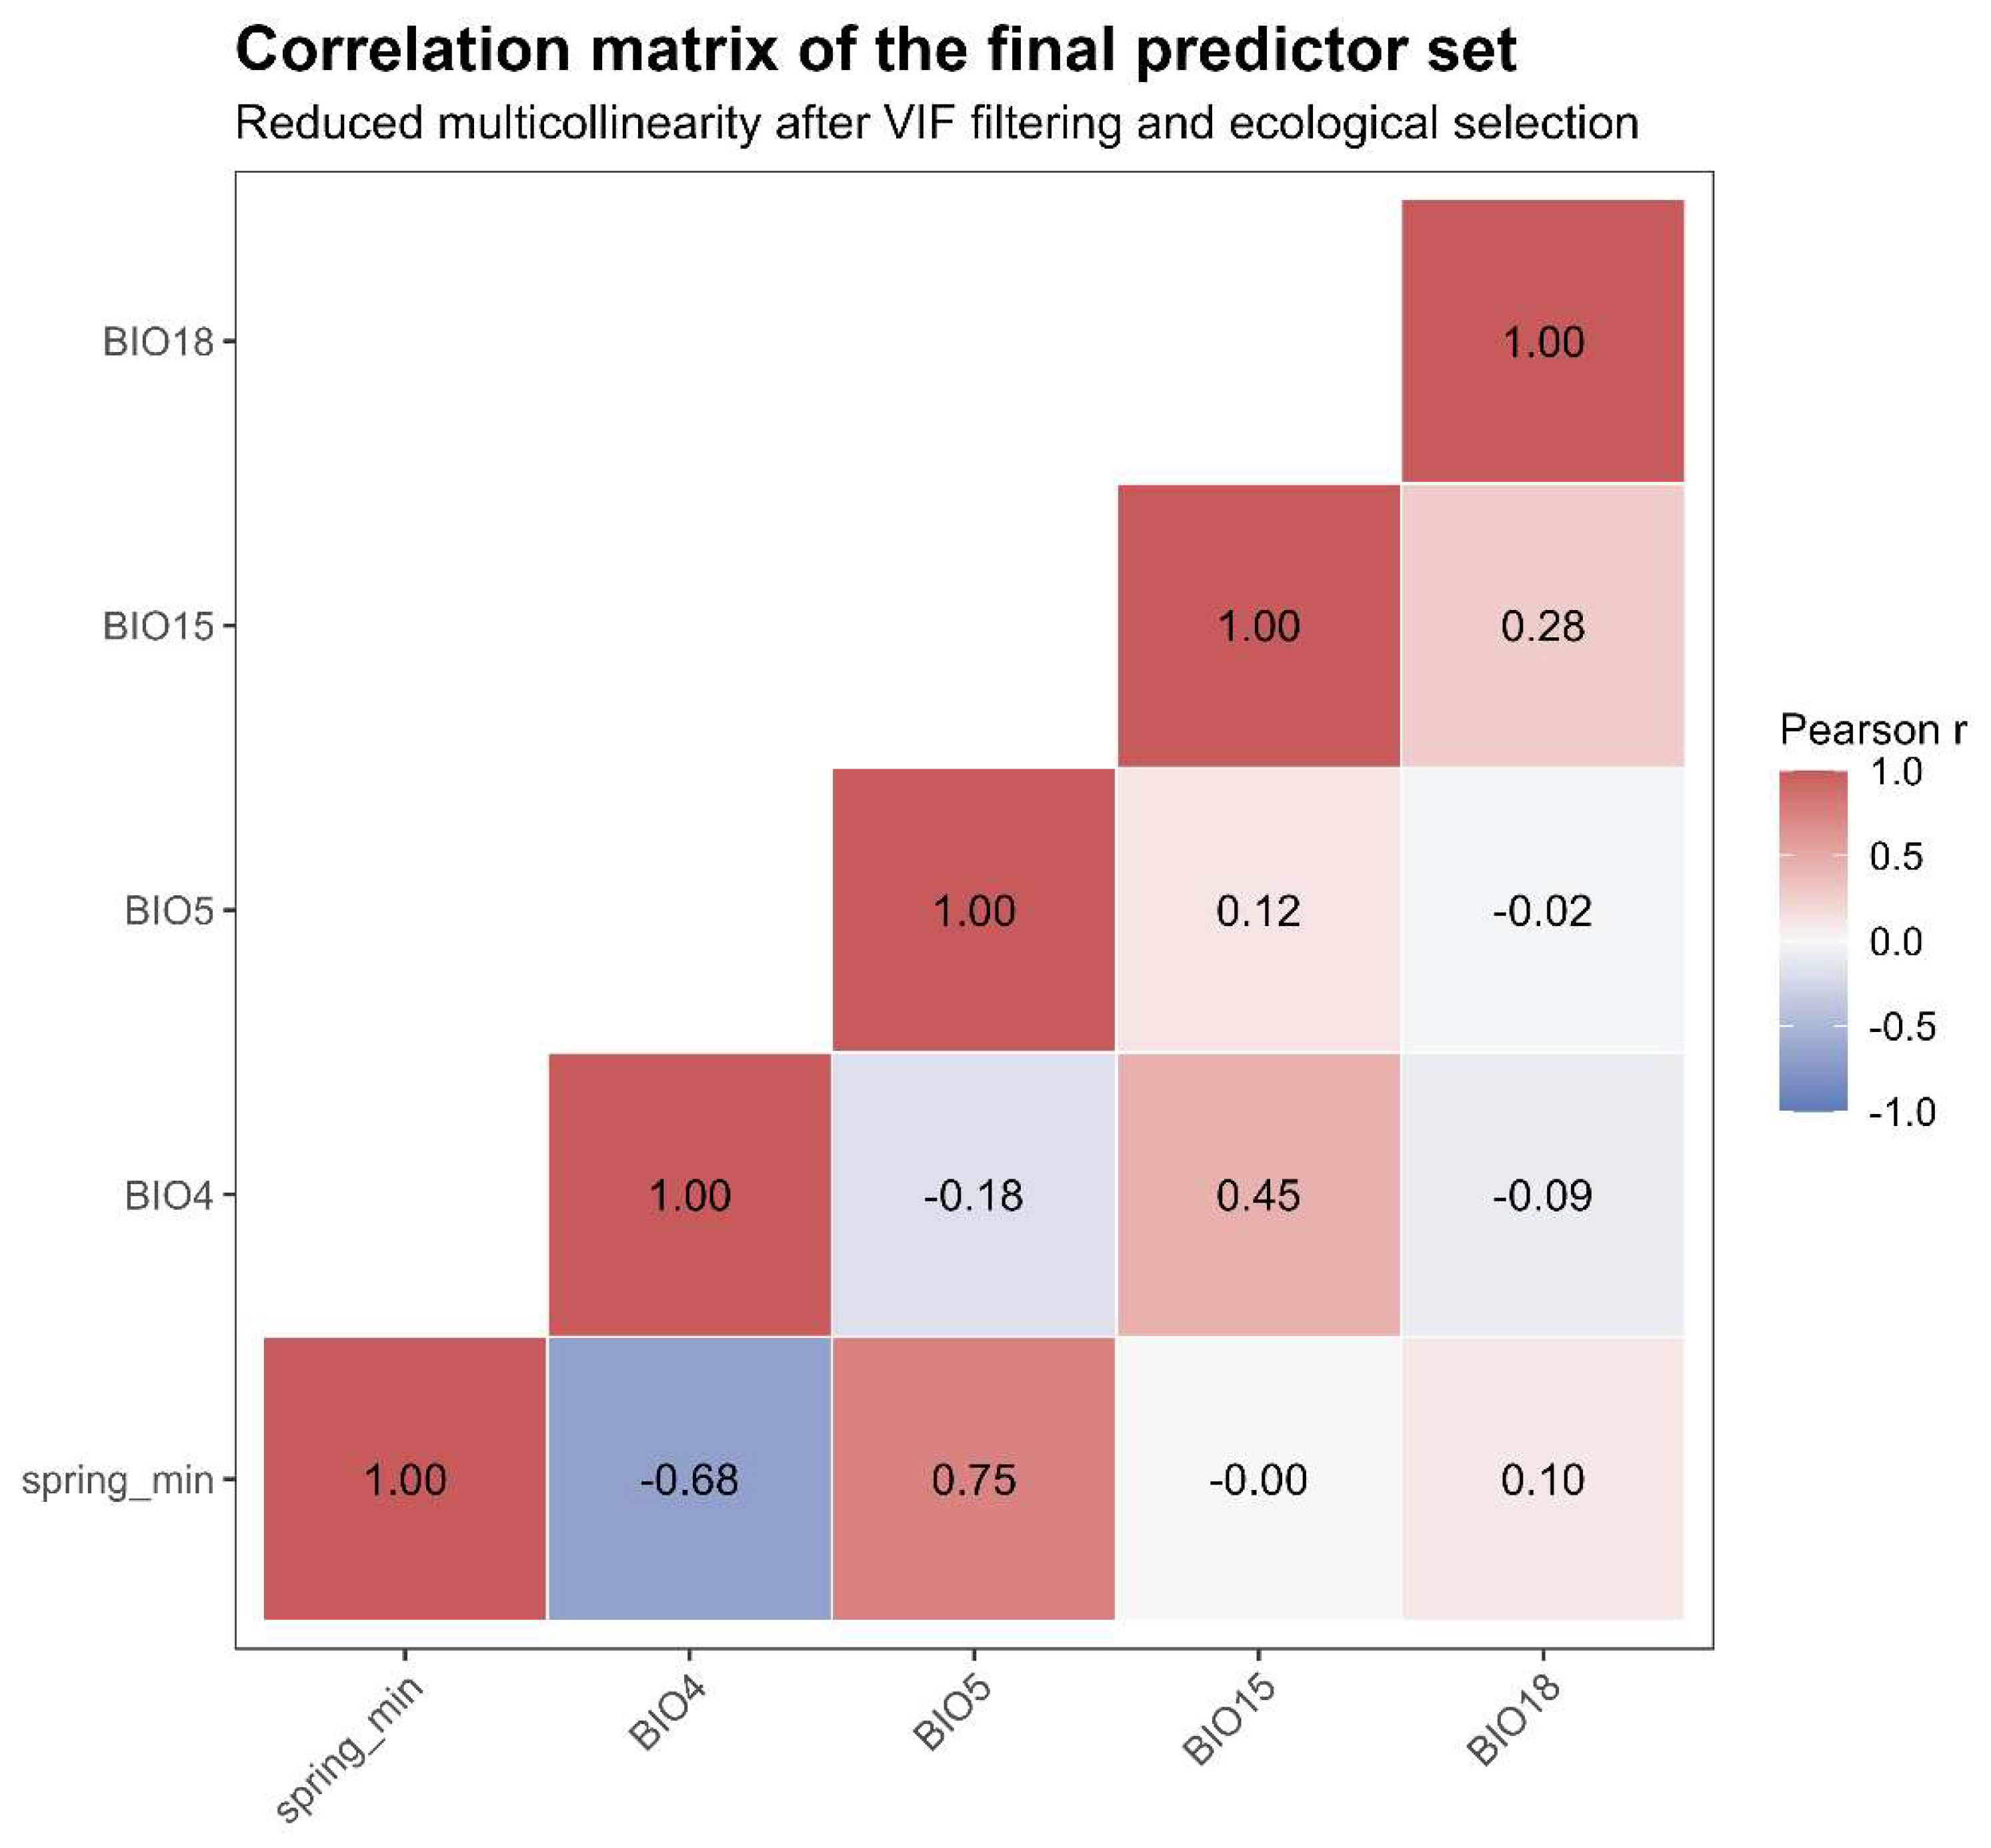
Figure 4.
Receiver operating characteristic (ROC) curve for the GLM under environmental cross-validation. The red curve represents the mean ROC across 25 validation runs, while the blue band represents the pointwise 2.5th–97.5th percentile envelope across runs. Mean validation AUC was 0.912 ± 0.049 (mean ± SD).
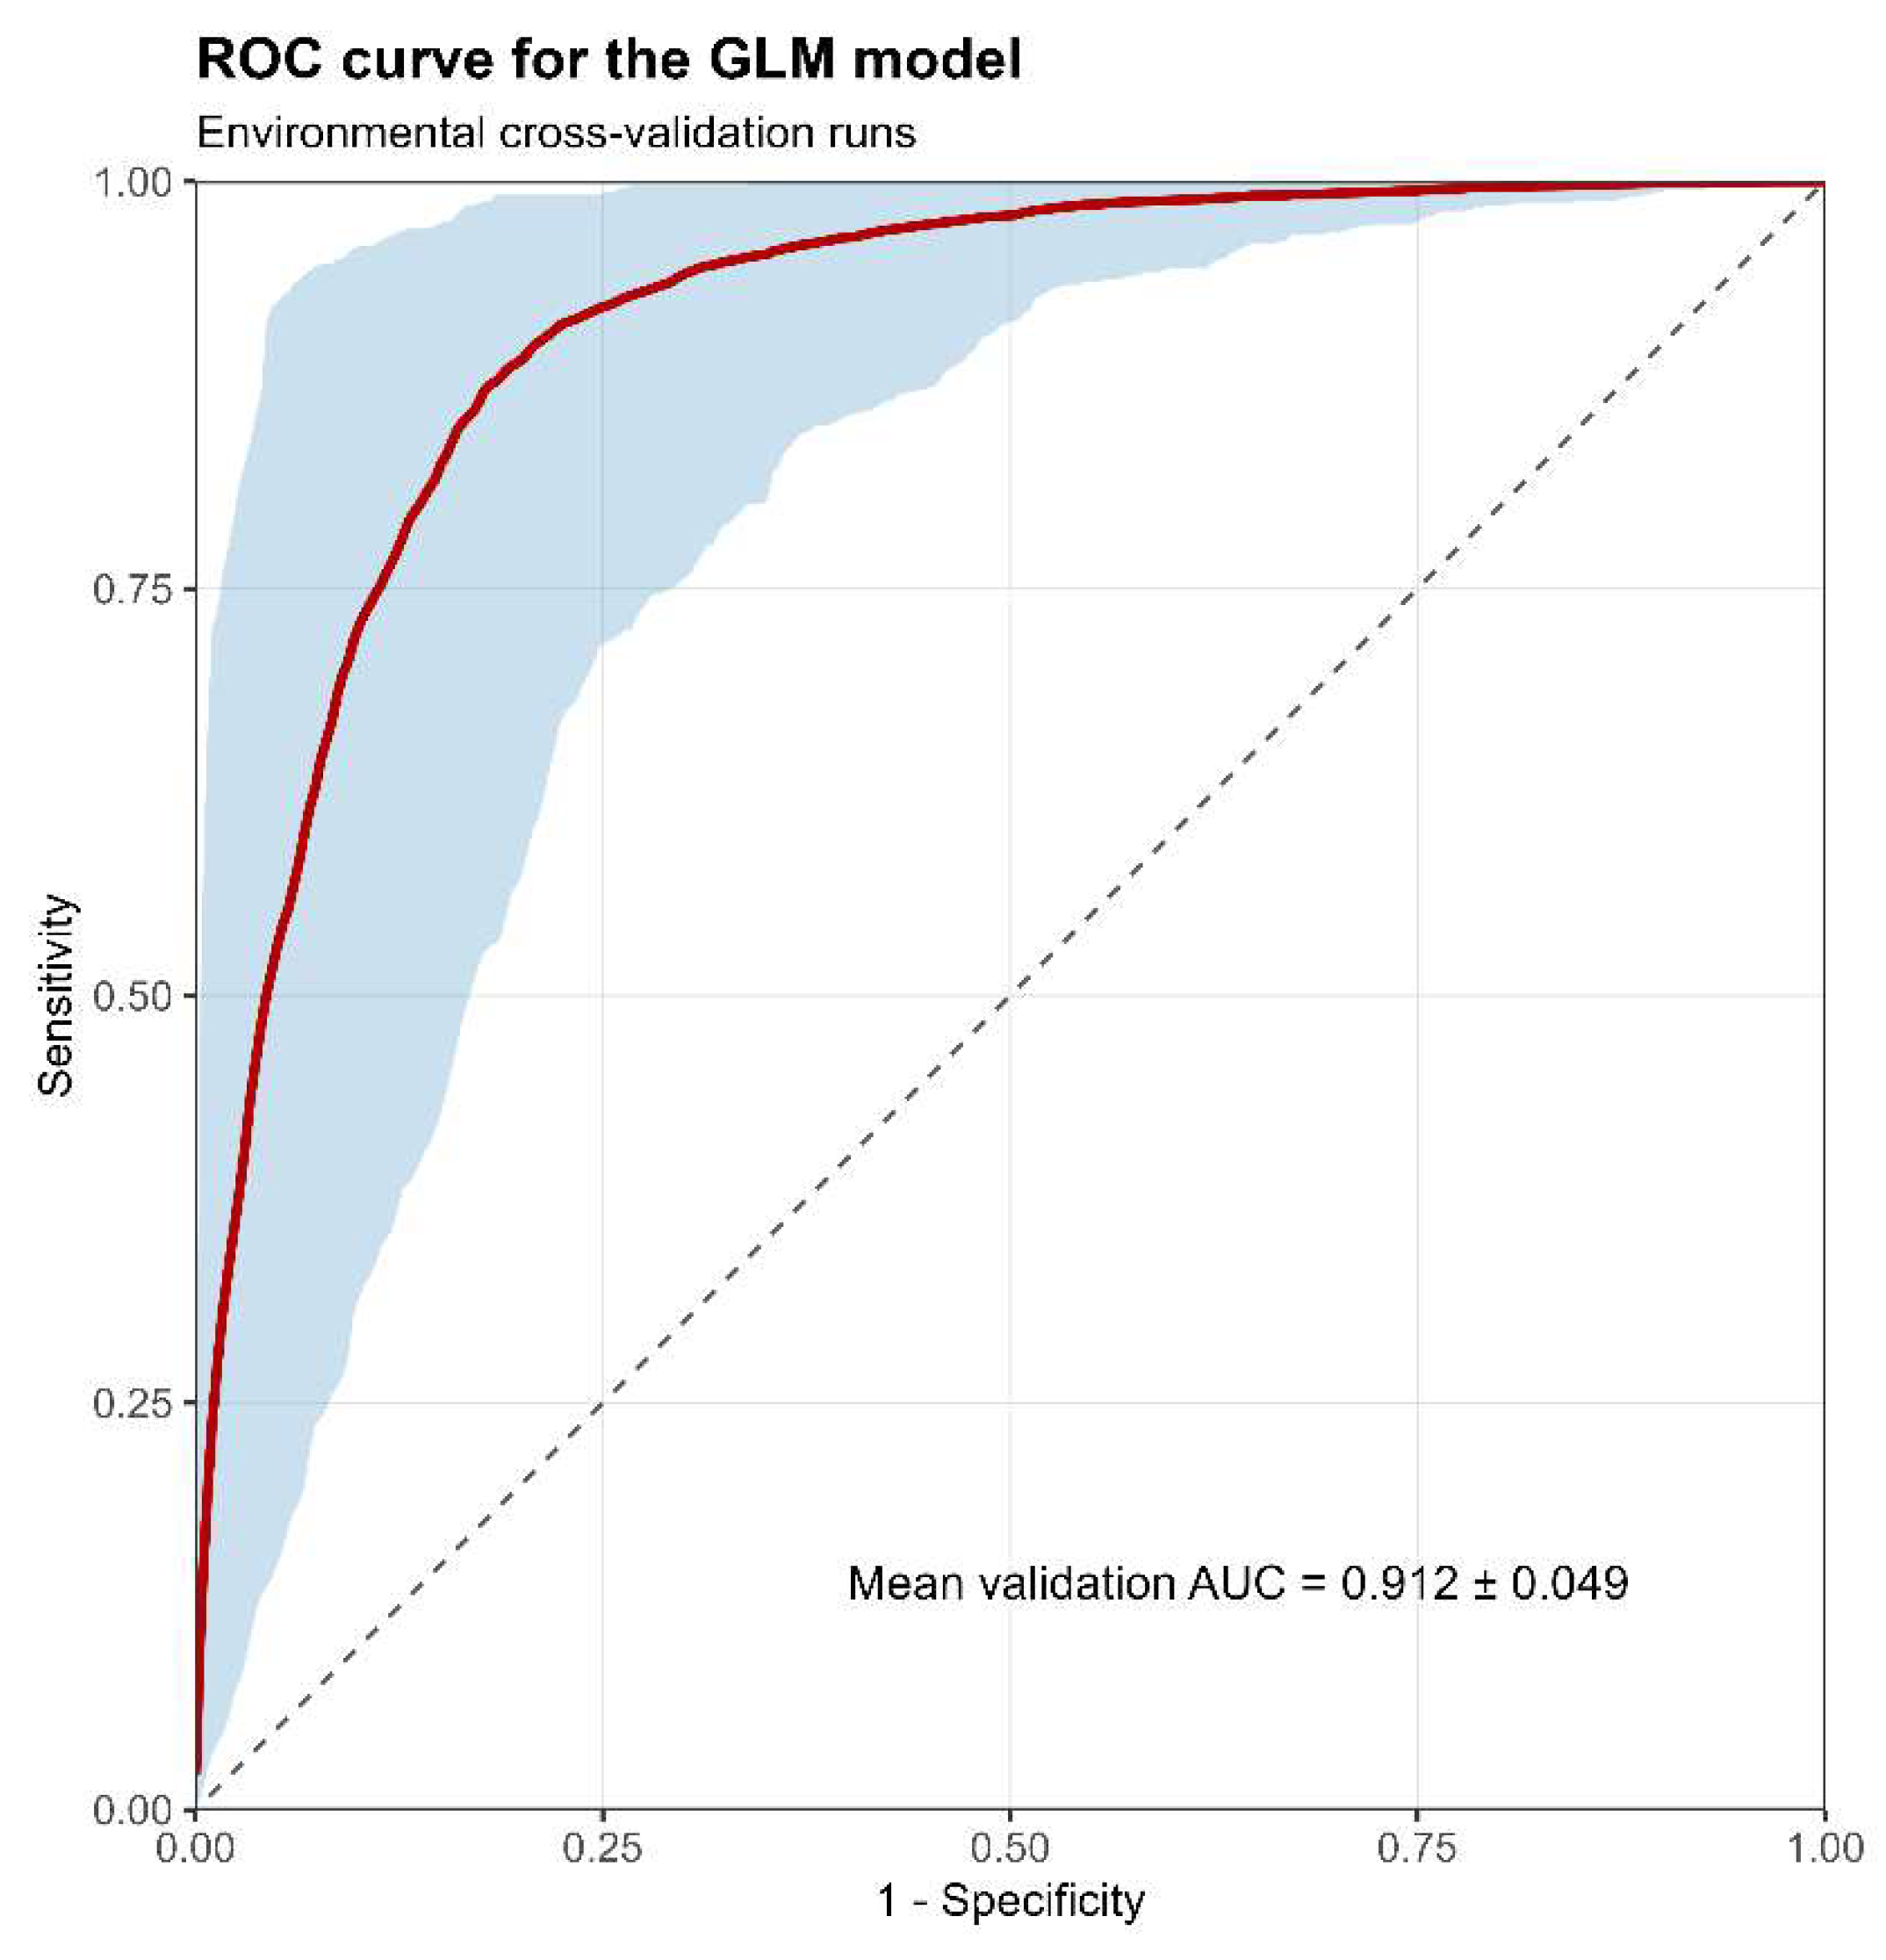
Figure 7.
Climatic suitability of A. arguta across Europe based on ensemble species distribution modeling. Higher suitability values are concentrated in Central and Southeastern Europe, particularly in mountainous regions, while lower suitability is observed in Mediterranean and northern regions.
Figure 7.
Climatic suitability of A. arguta across Europe based on ensemble species distribution modeling. Higher suitability values are concentrated in Central and Southeastern Europe, particularly in mountainous regions, while lower suitability is observed in Mediterranean and northern regions.
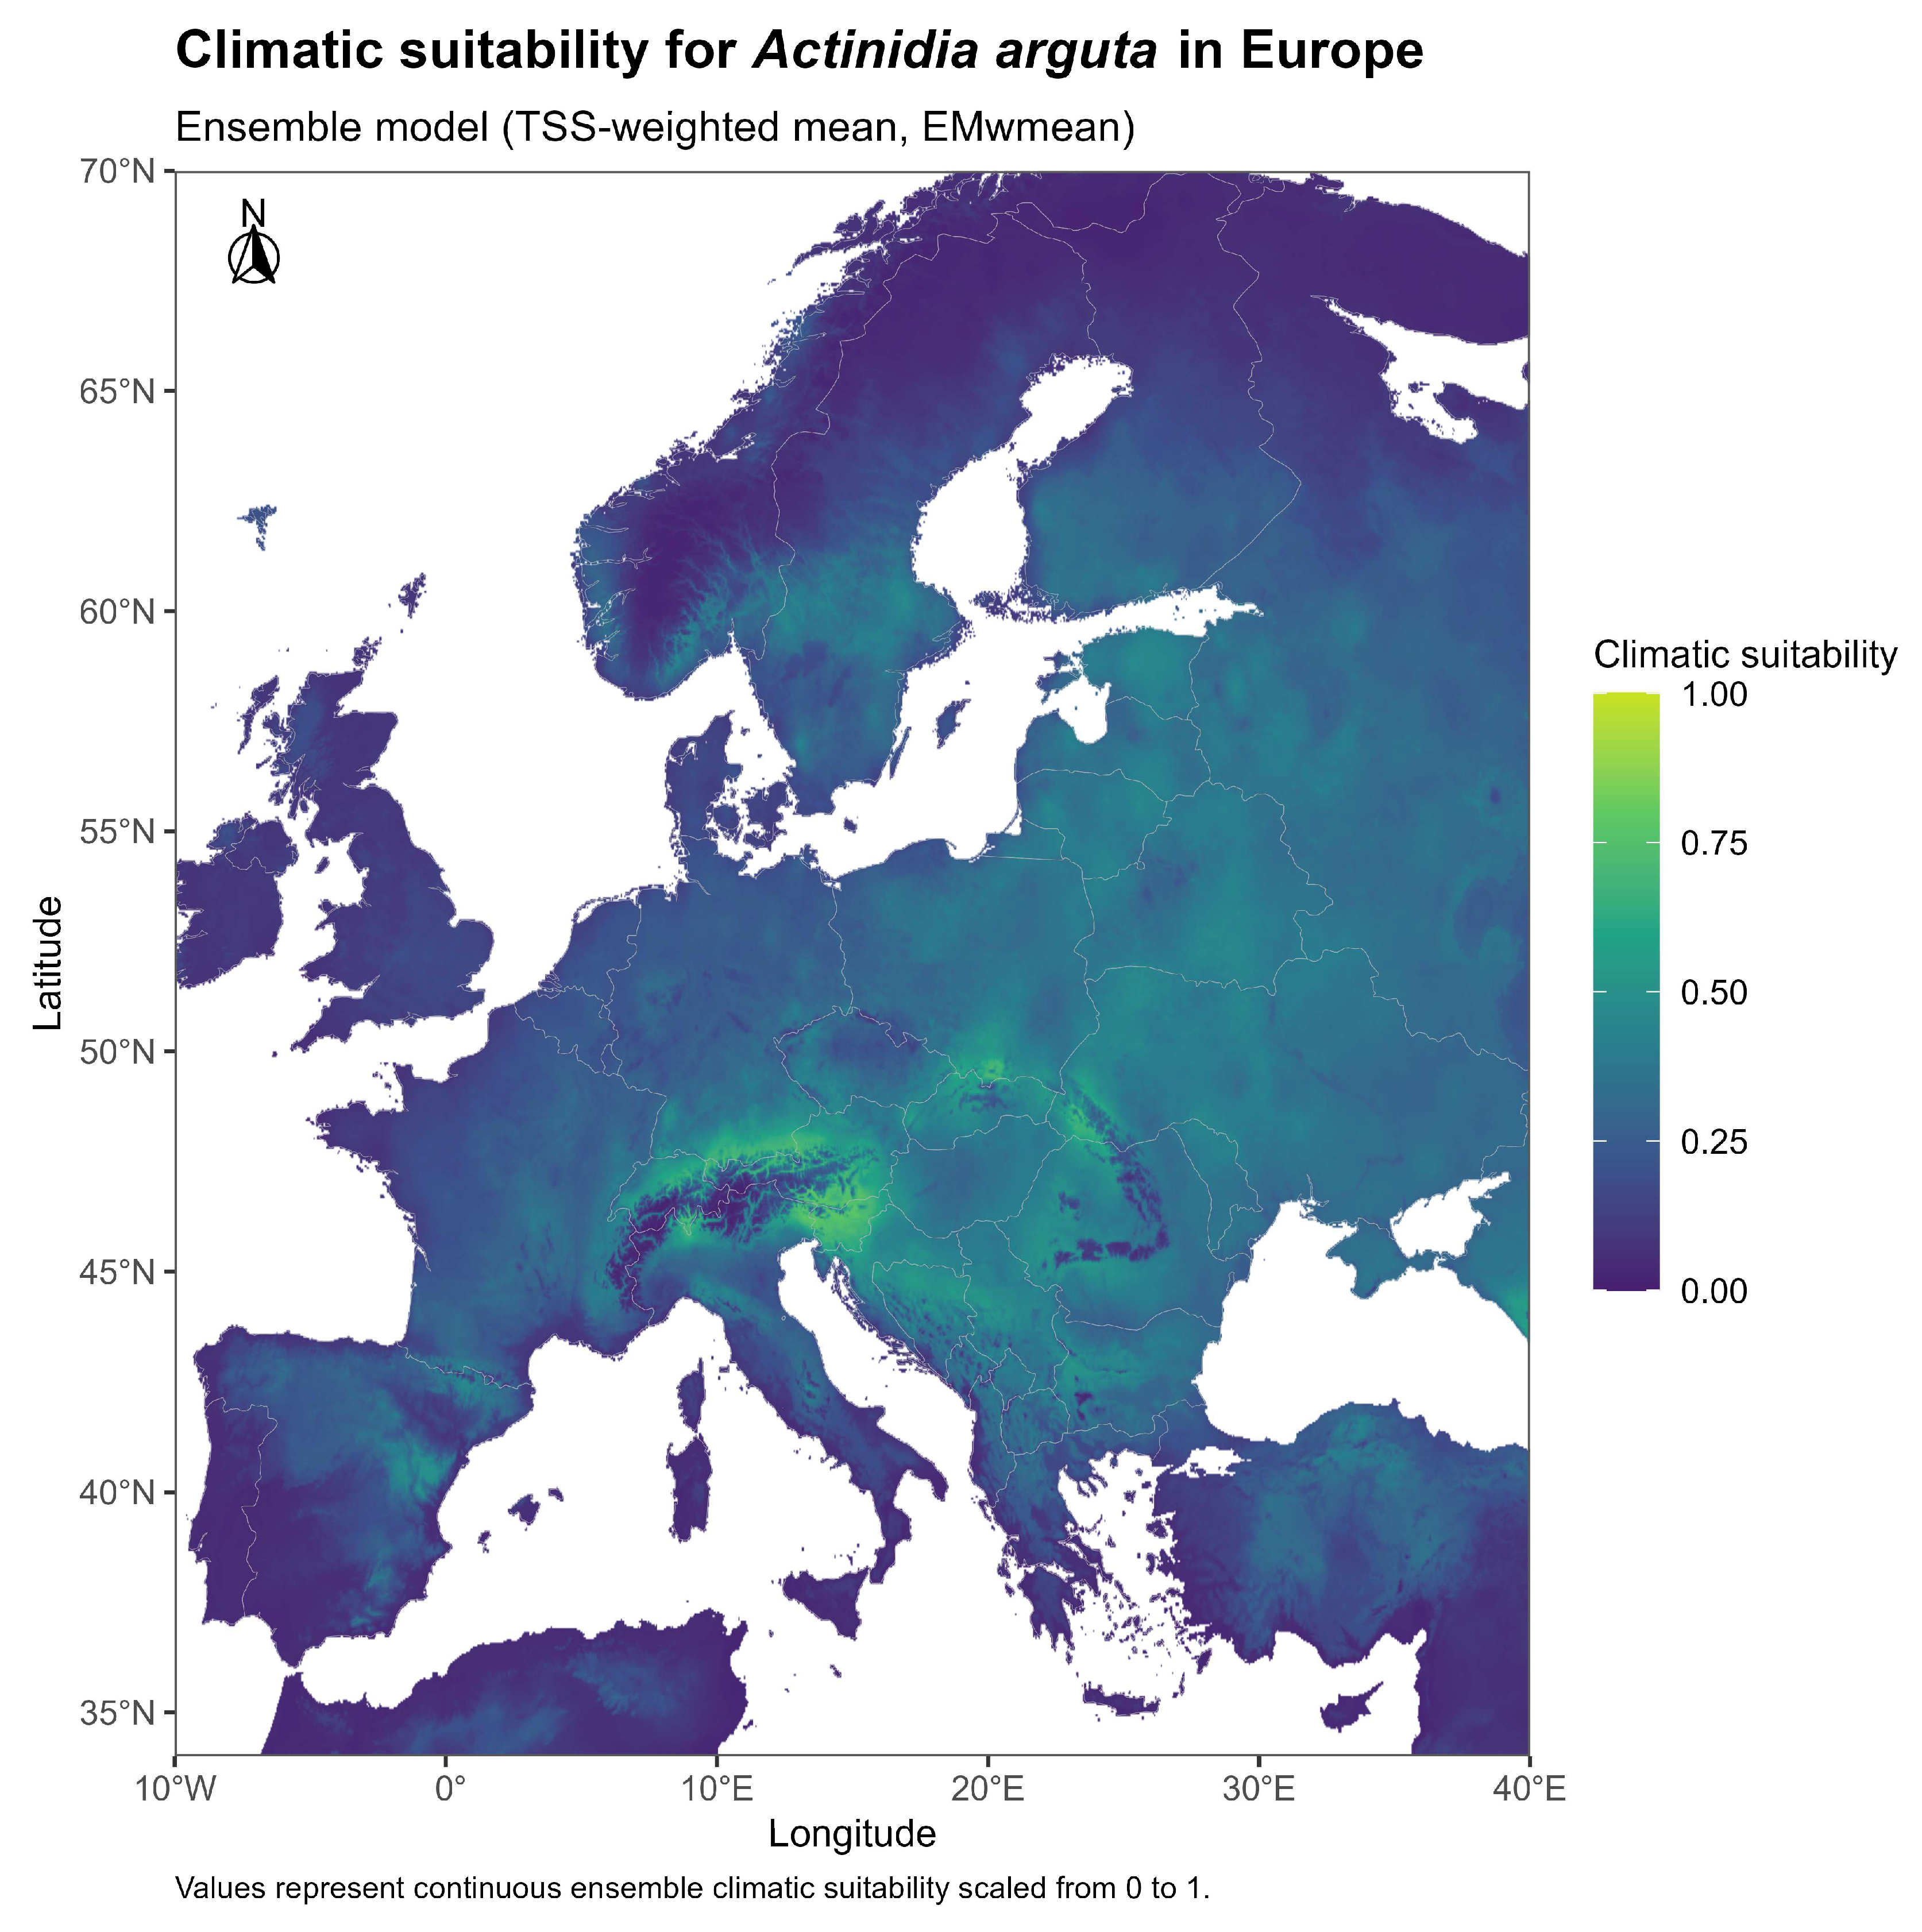
Figure 8.
Spatial uncertainty (standard deviation) across individual model projections for A. arguta in Europe. Higher values indicate greater disagreement among model predictions and therefore lower confidence in the projected suitability estimates.
Figure 8.
Spatial uncertainty (standard deviation) across individual model projections for A. arguta in Europe. Higher values indicate greater disagreement among model predictions and therefore lower confidence in the projected suitability estimates.
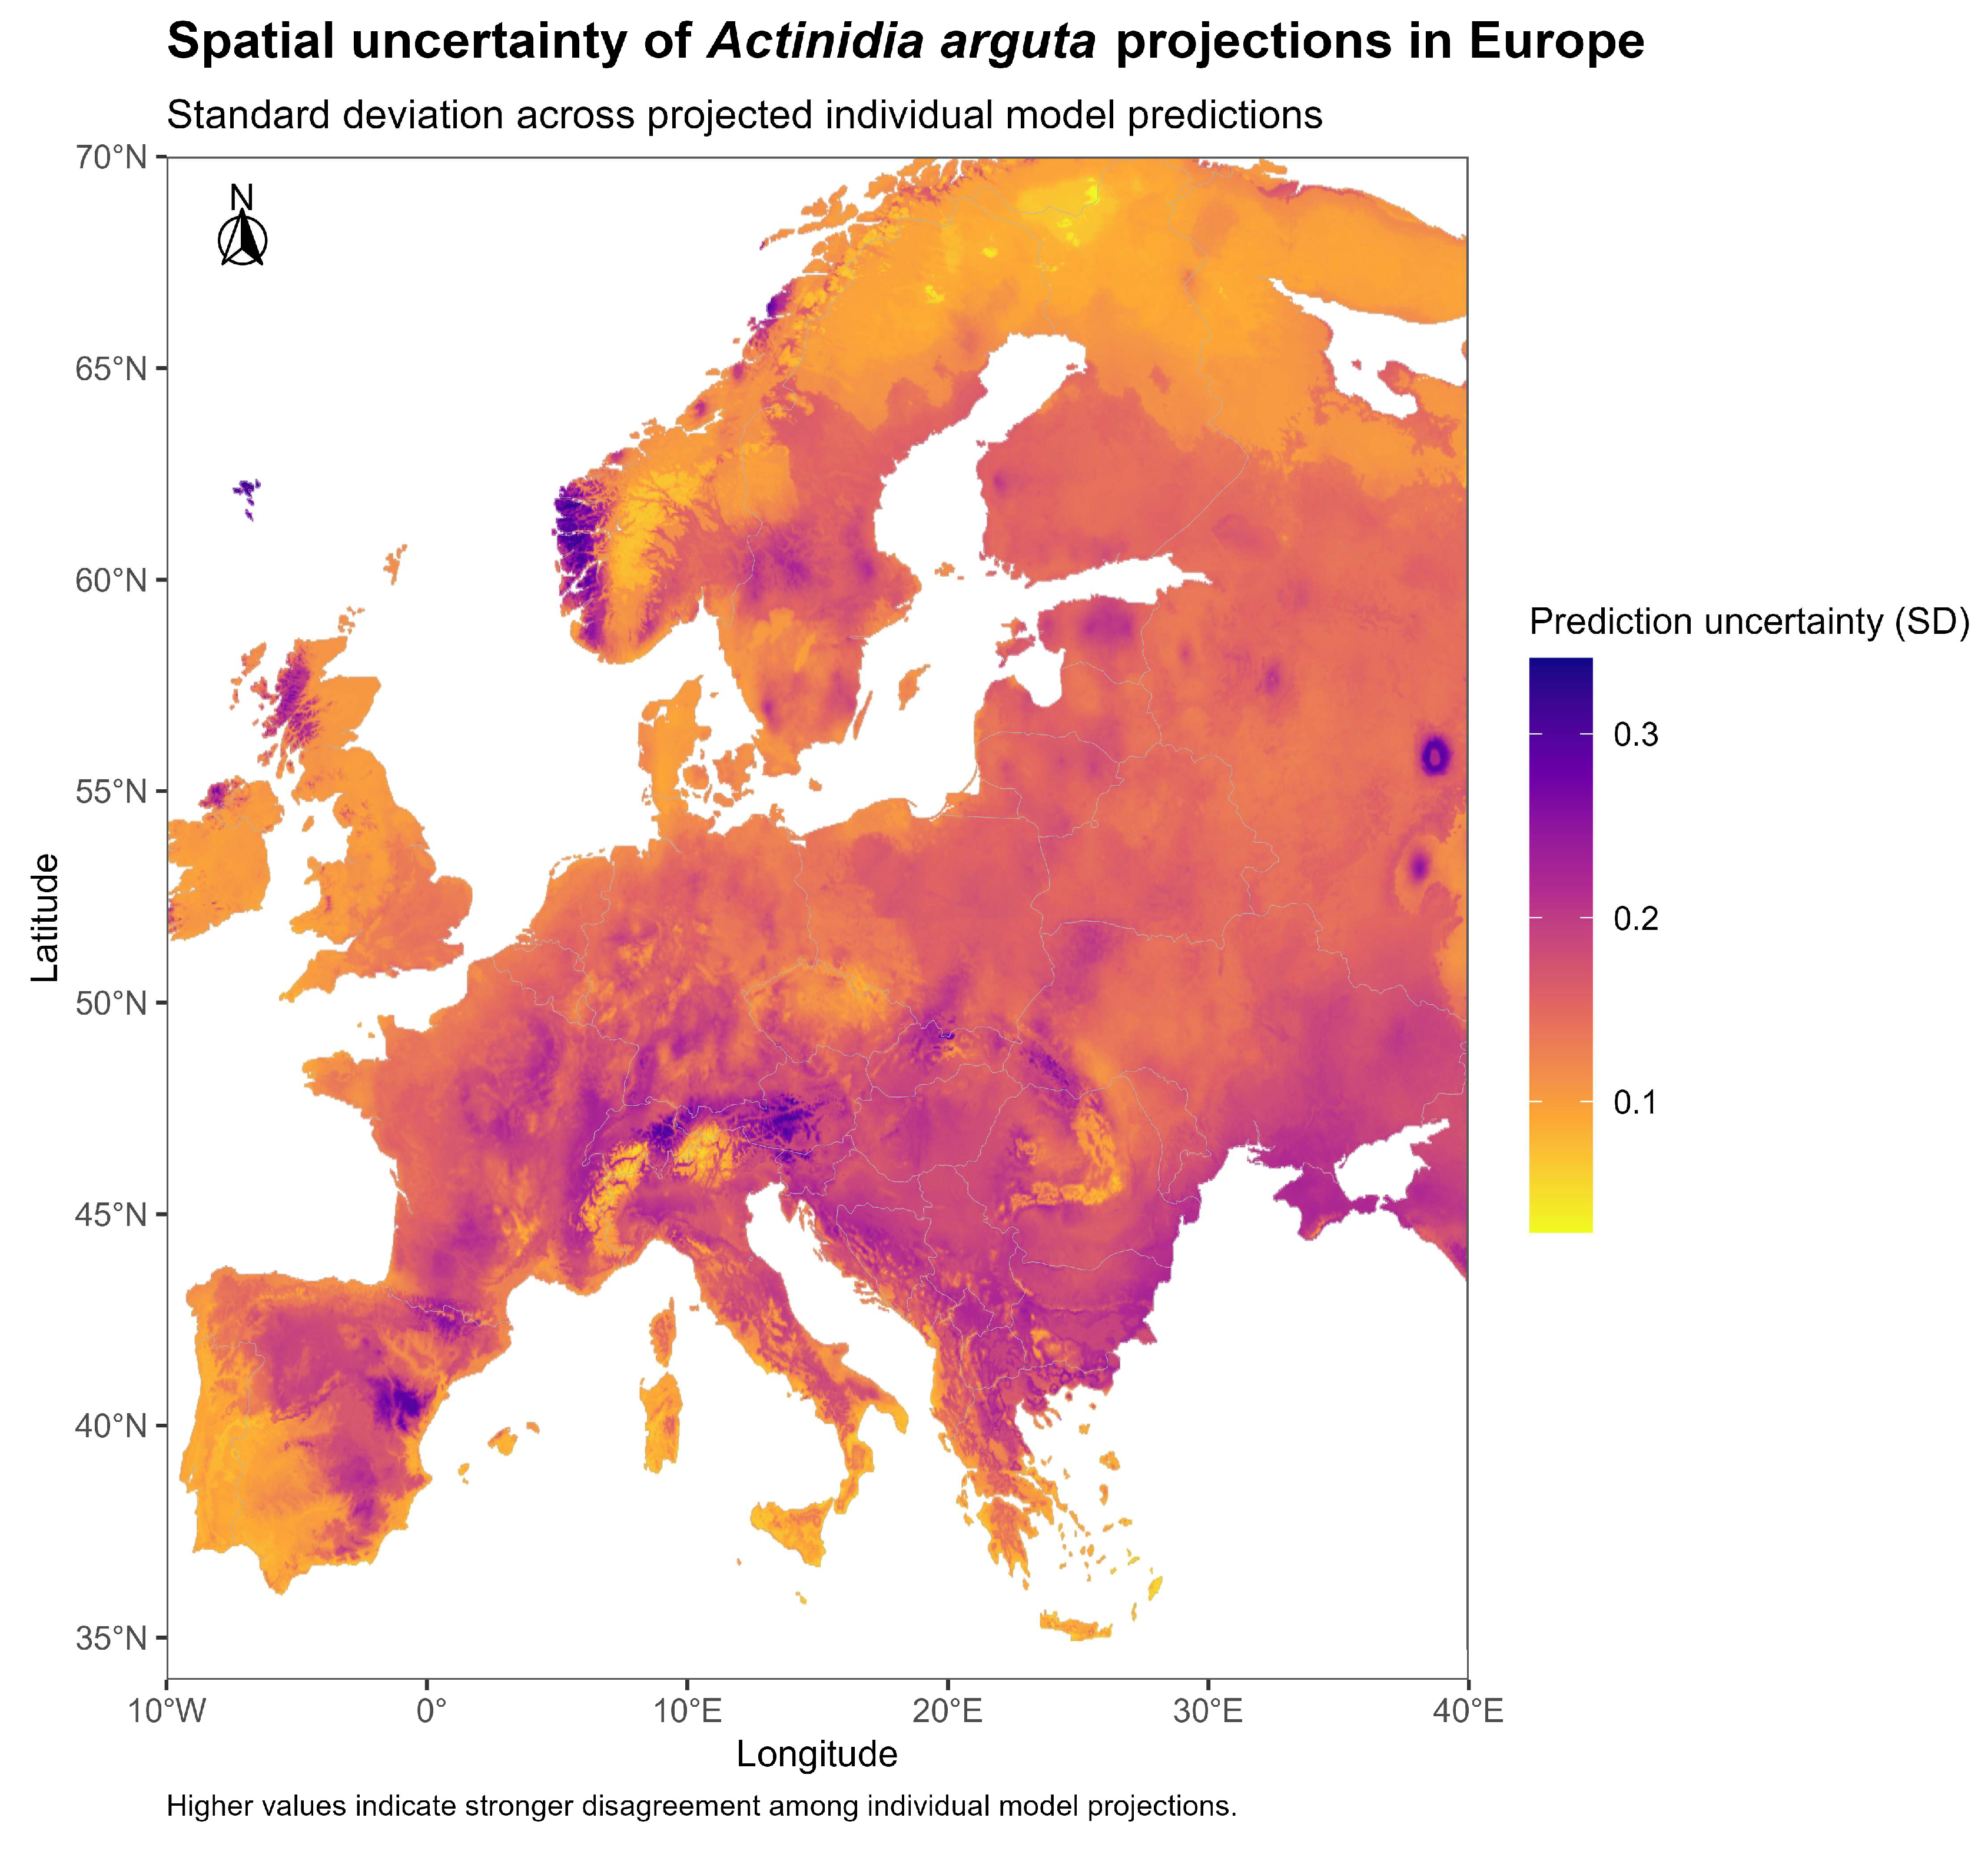
Figure 12.
Climatic suitability of A. arguta across Europe based on ensemble species distribution modeling, overlaid with early spring frost risk based on mean March minimum temperature under a less conservative threshold scheme (high risk ≤ -1°C; moderate risk -1 to 0°C). Moderate frost risk is shown as semi-transparent fill, while high-risk areas are delineated by contour lines representing the -1°C isotherm.
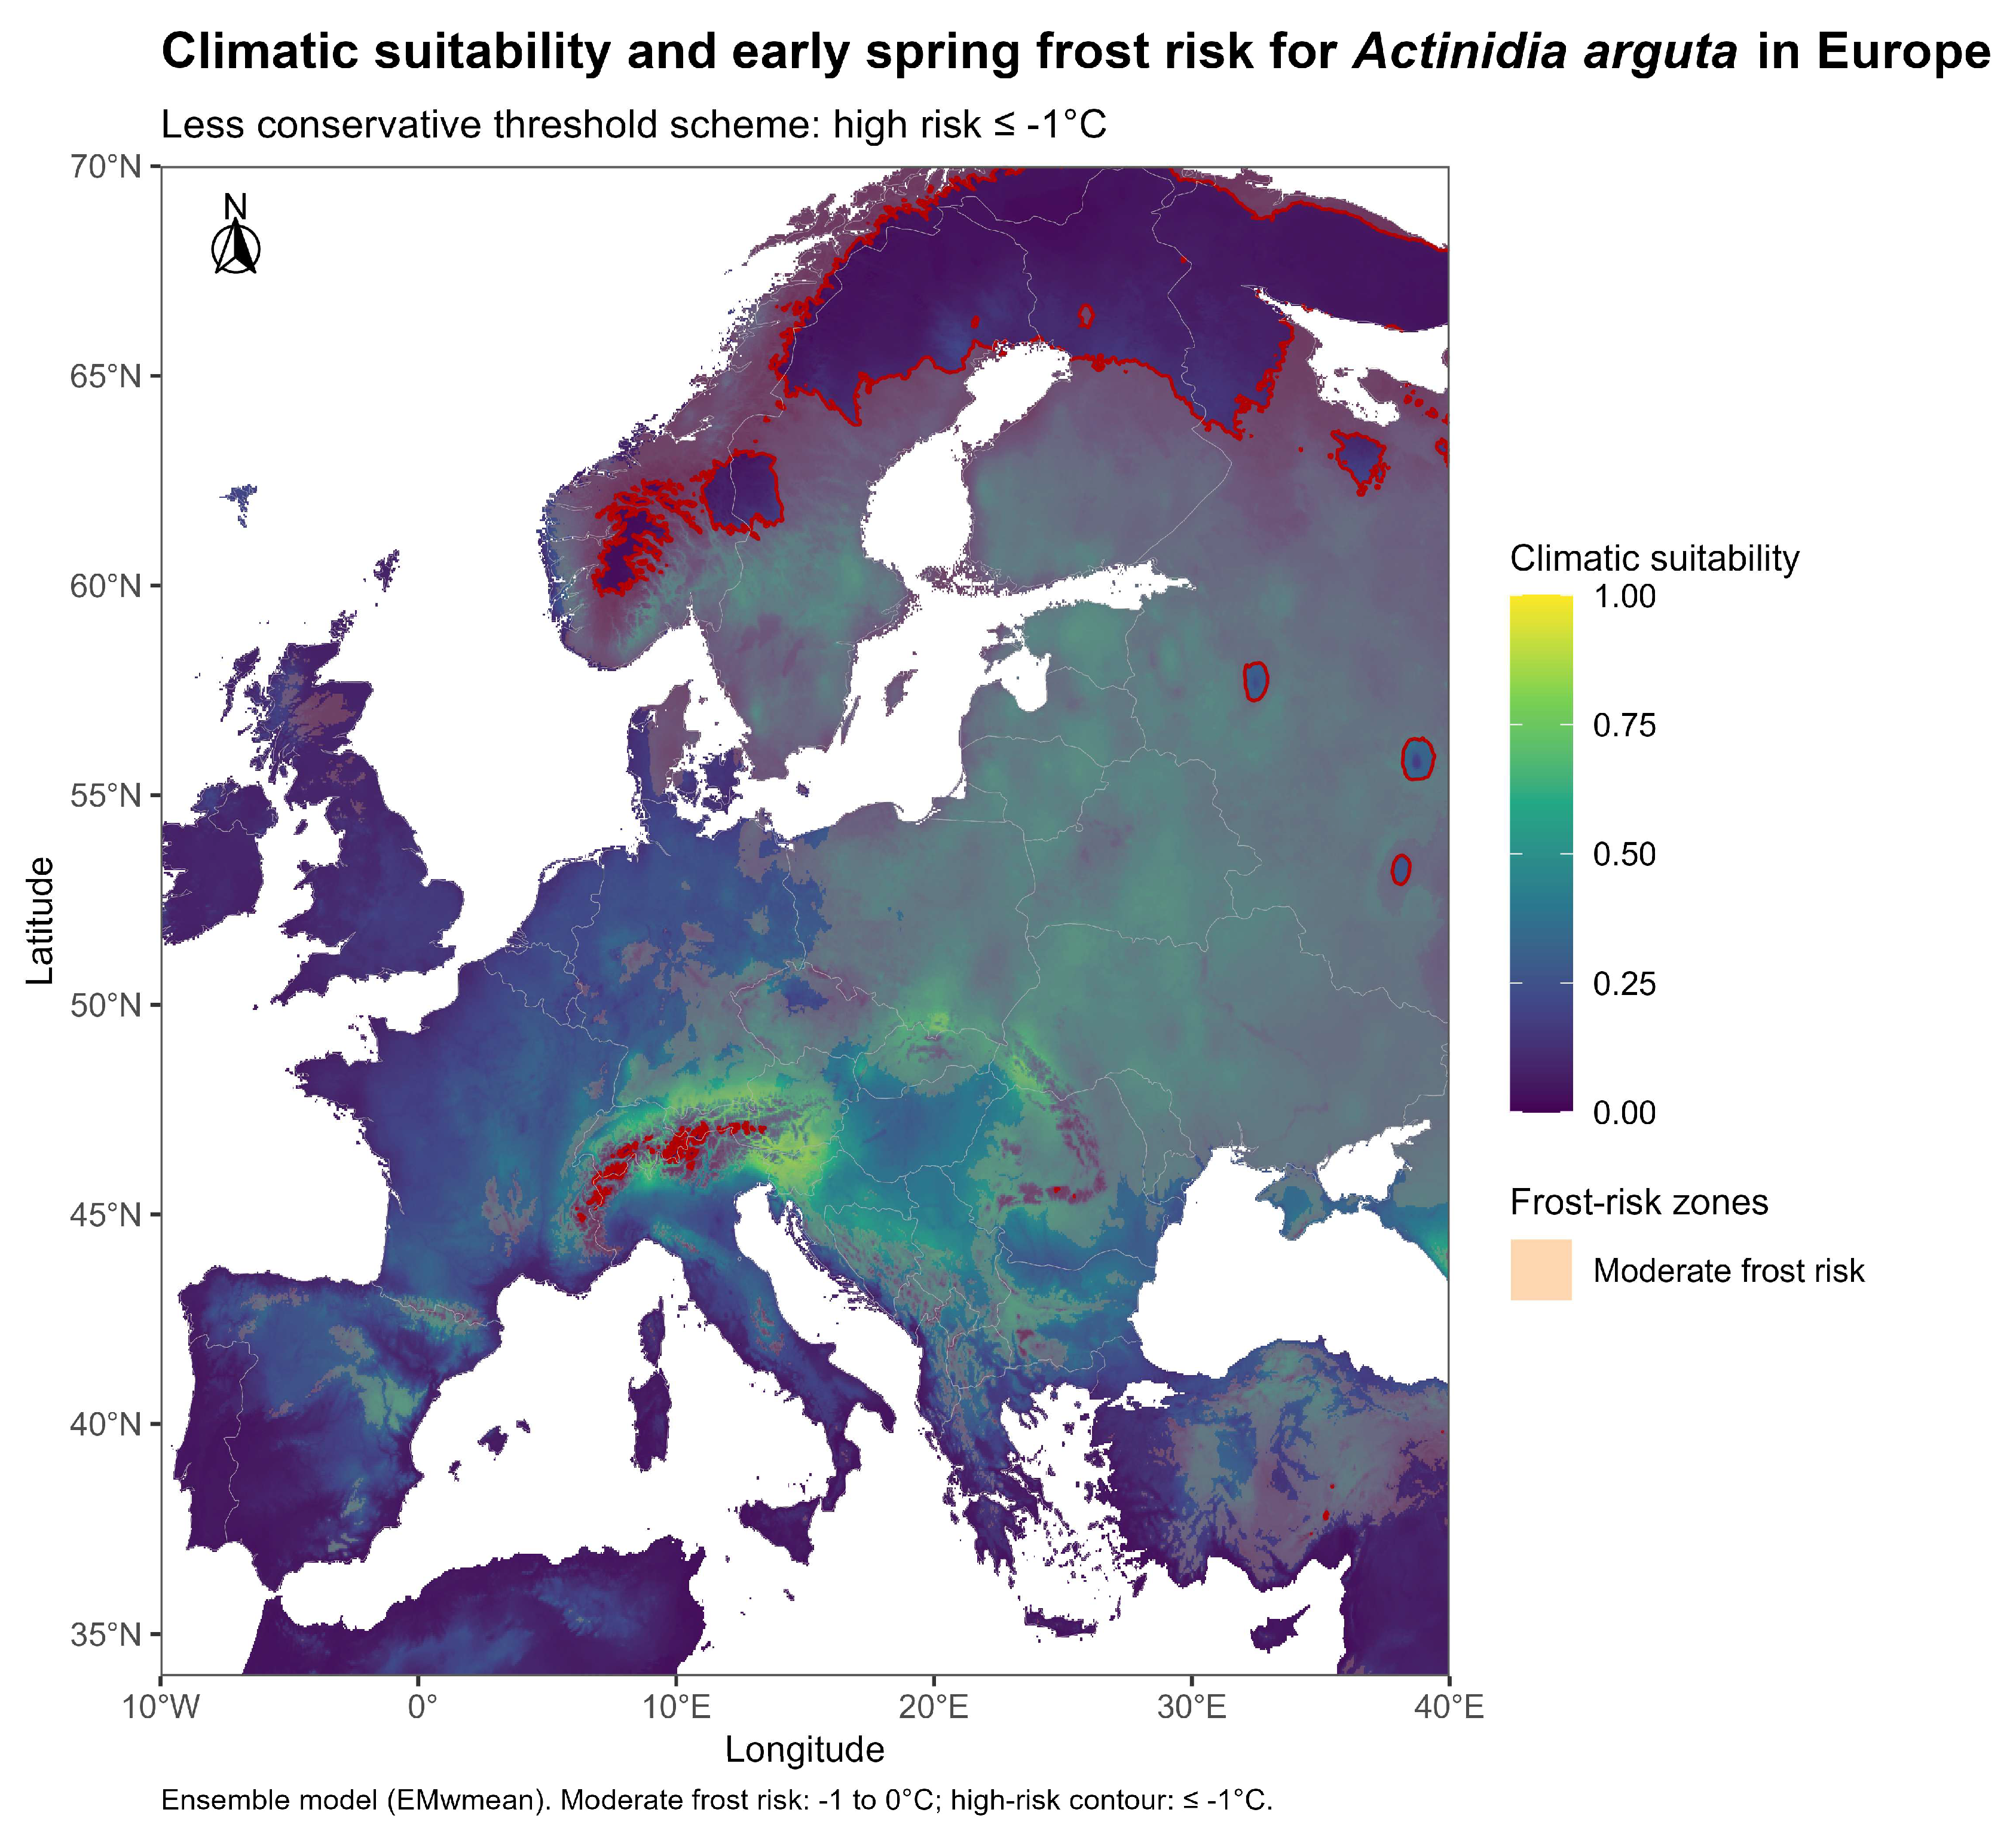
Figure 13.
Response curves for the final set of environmental predictors based on GLM environmental cross-validation runs. Solid lines represent the mean predicted response and shaded areas indicate the 95% confidence interval across runs.
Figure 13.
Response curves for the final set of environmental predictors based on GLM environmental cross-validation runs. Solid lines represent the mean predicted response and shaded areas indicate the 95% confidence interval across runs.
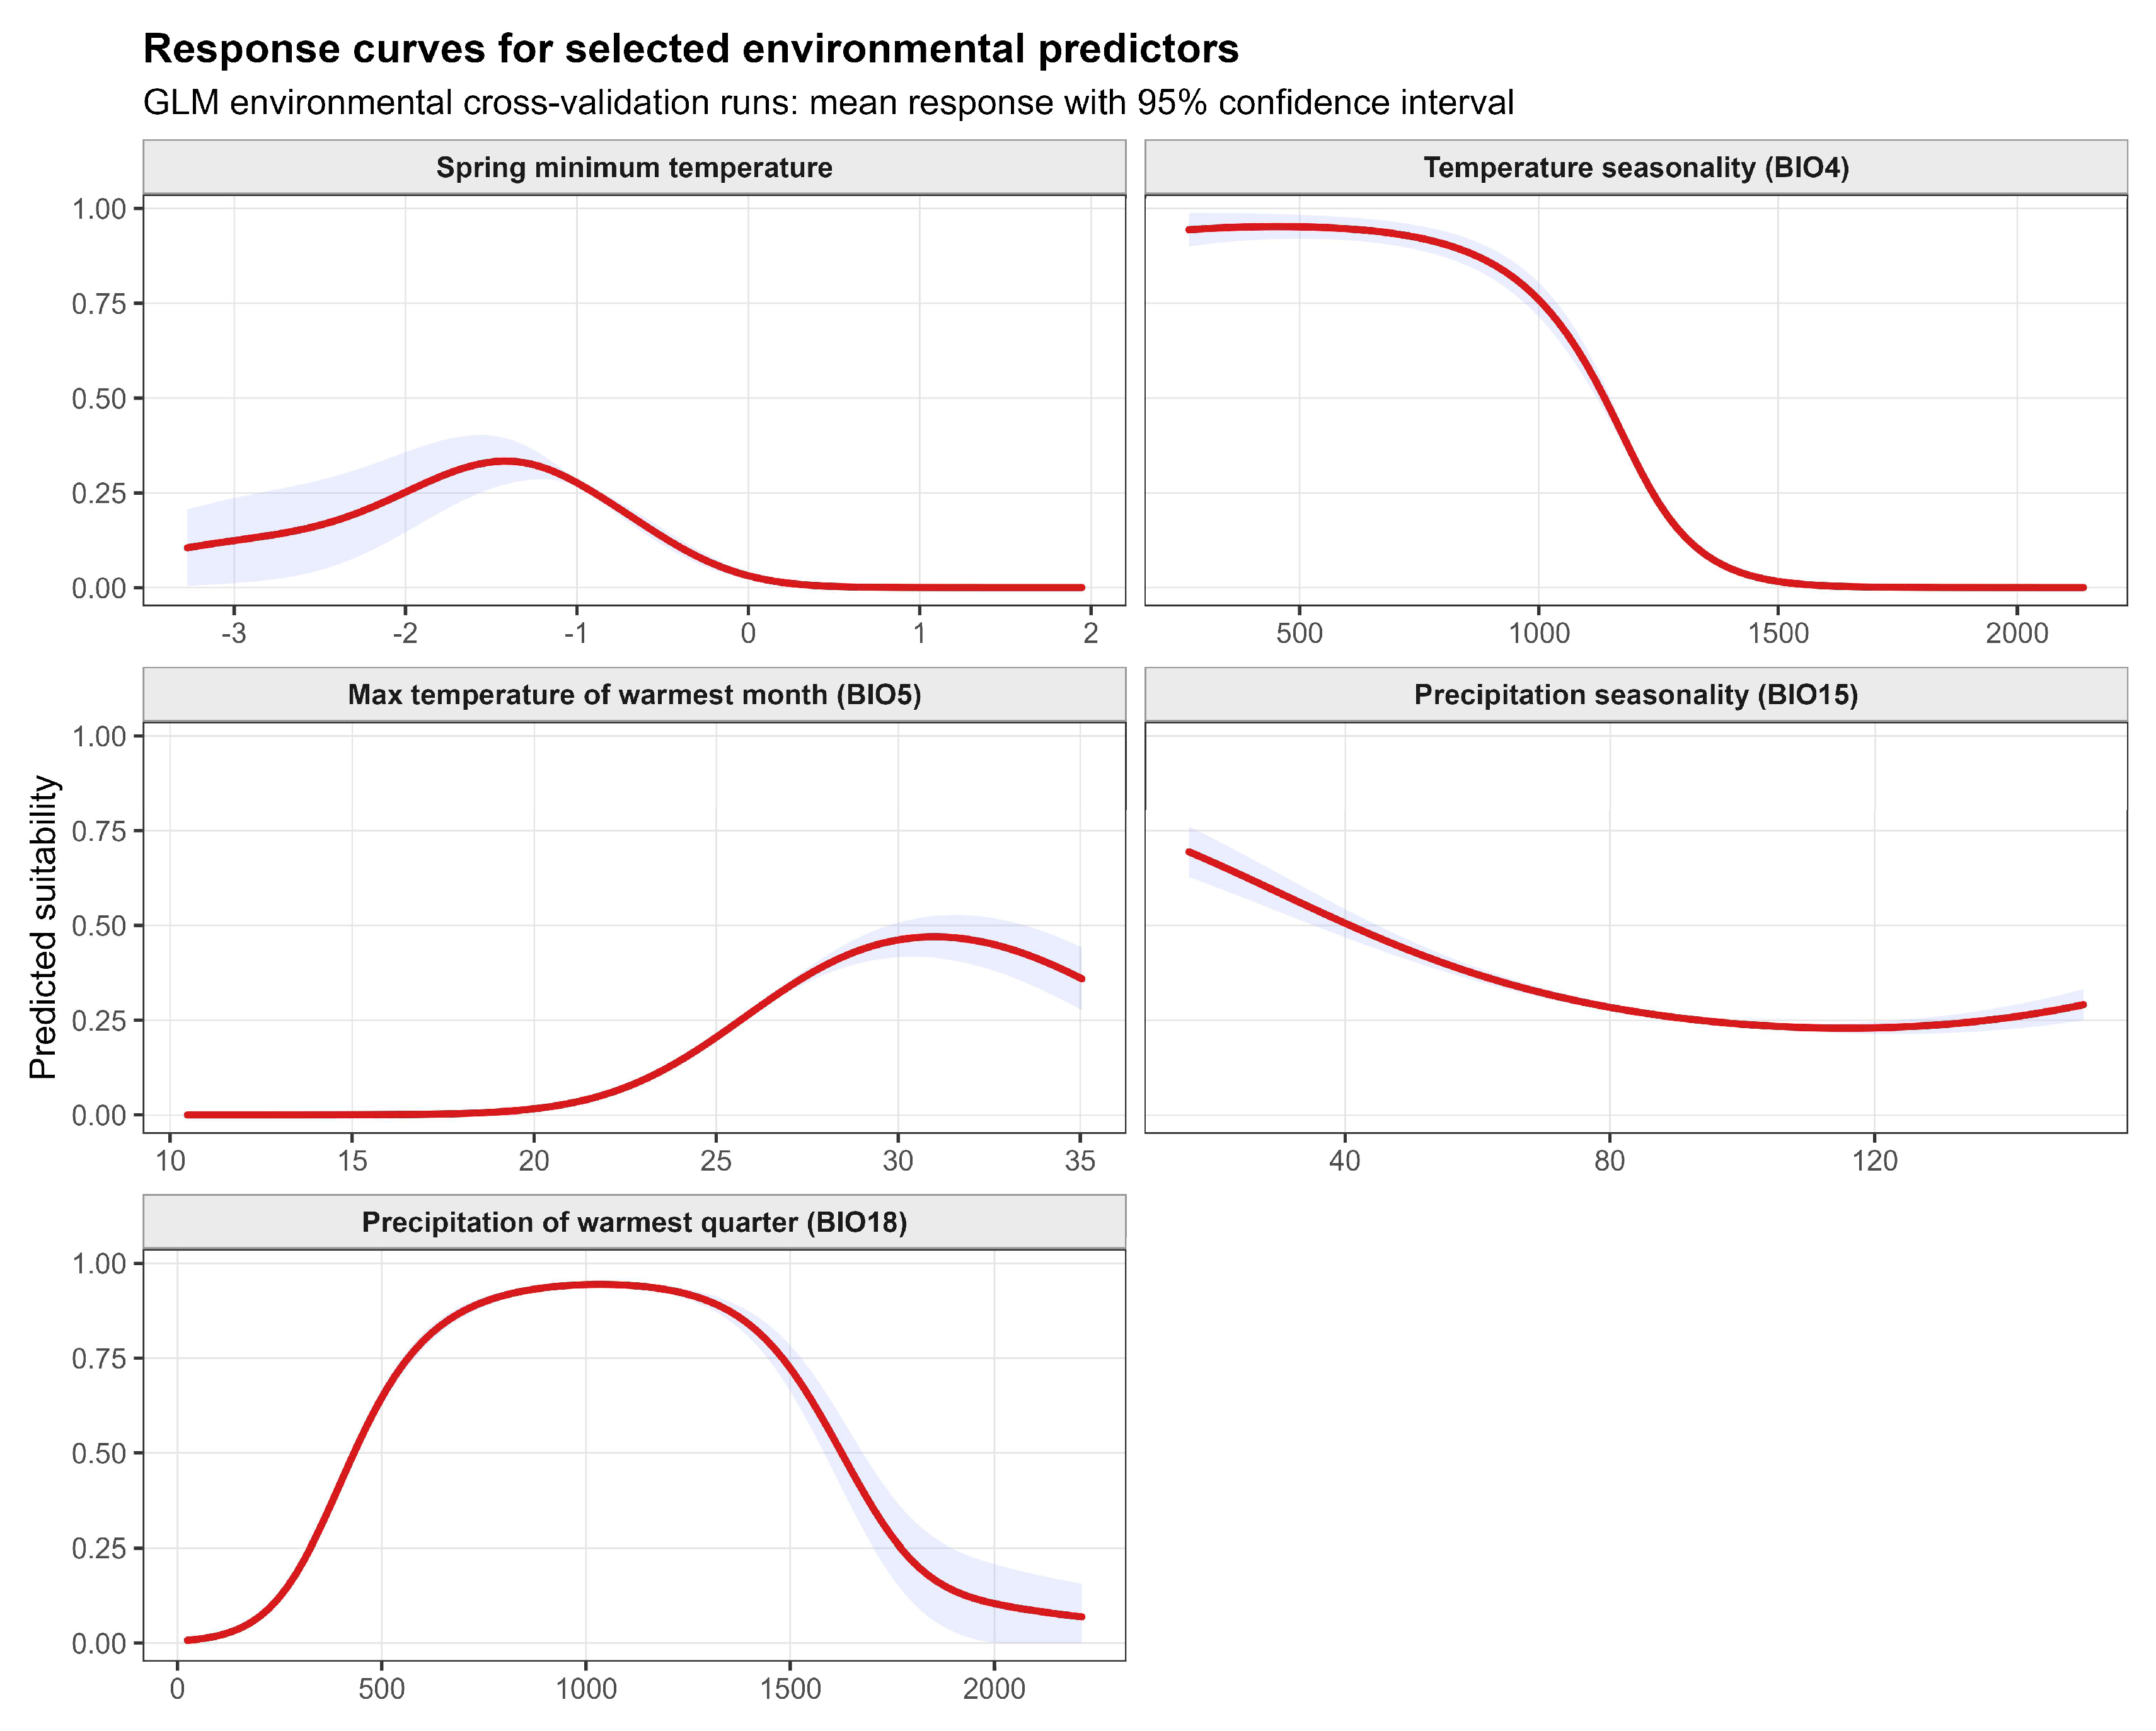
Table 2.
Cross-validated performance of species distribution models for A. arguta using TSS and AUC (ROC).
Table 2.
Cross-validated performance of species distribution models for A. arguta using TSS and AUC (ROC).
| SD AUC | Mean AUC | SD TSS | Mean TSS | Model |
|---|---|---|---|---|
| 0.049 | 0.912 | 0.155 | 0.656 | GLM |
| 0.059 | 0.912 | 0.173 | 0.631 | RF |
| 0.058 | 0.91 | 0.177 | 0.639 | MAXNET |
| 0.087 | 0.884 | 0.173 | 0.618 | GAM |
| 0.055 | 0.899 | 0.182 | 0.621 | GBM |
AUC: Area Under the Receiver Operating Characteristic Curve; TSS: True Skill Statistic.
Disclaimer/Publisher’s Note: The statements, opinions and data contained in all publications are solely those of the individual author(s) and contributor(s) and not of MDPI and/or the editor(s). MDPI and/or the editor(s) disclaim responsibility for any injury to people or property resulting from any ideas, methods, instructions or products referred to in the content. |
© 2026 by the authors. Licensee MDPI, Basel, Switzerland. This article is an open access article distributed under the terms and conditions of the Creative Commons Attribution (CC BY) license.
Copyright: This open access article is published under a Creative Commons CC BY 4.0 license, which permit the free download, distribution, and reuse, provided that the author and preprint are cited in any reuse.