

Submitted:
15 September 2026
Posted:
16 September 2026
You are already at the latest version
Abstract
In this work, Bayesian estimation is performed for the parameters of a mathematical model, formulated as a system of ordinary differential equations, that describes cannibalism dynamics in a larval populations of Atractosteus tropicus were reared in a pond. The model divides the population into three subclasses: vulnerable, cannibalistic, and non-vulnerable individuals. Parameter estimation is conducted under two scenarios: a fed population and an unfed population. Correlation matrices are calculated for both cases. For the fed population, the most influential parameters are food quality and the time devoted to managing cannibalistic individuals. In contrast, for the unfed population, the strongest correlation occurs between the mortality rate and the transition rate of cannibalistic individuals to the non-vulnerable class. Therefore, providing larvae with high-quality food substantially reduces cannibalism and the handling time required and, consequently, increases the survival of the species.
Keywords:
cannibalism
; Atractosteus tropicus
; parameter estimation
; Montecarlo method
; Bayesian estimation
1. Introduction
Cannibalism in fish is an intraspecific interaction that affects survival, size structure, and population. Trophic dynamics, and their importance varies among species and ecological contexts [1]. In cultured fish populations, where space is limited, intracohort cannibalism is often intensified by rapidly growing individuals and by the morphological constraints associated with prey ingestion [2]. For example, in sea bass hatcheries, increased size heterogeneity and feeding frequency have been associated with a higher incidence of cannibalistic events and, consequently, with substantial reductions in survival [3]. In larviculture, cannibalism is now recognized as being more prevalent than previously assumed and may be regarded as an alternative trophic strategy under resource-limited conditions that contributes to species persistence [4]. Under natural conditions, several studies suggest that cannibalism may be rare in certain groups, such as livebearing fishes, but may increase when competition for resources intensifies, particularly at high population densities [5].
Cannibalism may also arise from reproductive conflicts in species exhibiting parental care, in which the consumption of offspring may result from parental competition rather than from an energy deficit [6]. Recent studies have emphasized that population-level and environmental factors may influence the occurrence of cannibalism in a nonlinear way [7], and that increasing the structural complexity of the habitat may promote cannibalism, the coexistence of individuals of different ages, and population growth [8]. In habitats invaded by superpredators, cannibalism may serve as a mechanism that mitigates resource scarcity and contributes to the self-sustainability of invasive populations in human-modified ecosystems [9].
Cannibalism has been investigated mathematically through several models developed to describe population dynamics that are not captured by classical predator–prey models. An approach is to incorporate age structure by dividing the predator population into juvenile and adult classes and introducing cannibalism into the original predator–prey model [10]. Some models have also been proposed in which cannibalism occurs simultaneously in both prey and predator populations within a ratio-dependent Holling–Tanner framework. These models show that, although cannibalism restricted to only one species may induce instability, its simultaneous occurrence in both species may promote their coexistence [11]. Another approach involves Leslie–Gower-type models that incorporate a prey cannibalism term. Such models show that cannibalism does not alter the local stability of the coexistence equilibrium and that conditions for global stability can be established [12].
More complex ecological scenarios have also been simulated, including cannibalism in trophic webs composed of phytoplankton, zooplankton, and fish under proportional harvesting. In this setting, local and global stability are analyzed, and the existence of a Hopf bifurcation with respect to a cannibalism-related parameter is demonstrated [13]. When cannibalism is restricted to specific life stages, such as the juvenile stage, conditions can be obtained under which cannibalism stabilizes the population, as well as conditions under which stabilization cannot be achieved [14]. These findings reinforce the idea that the effect of cannibalism critically depends on how population structure, energy gain, and interaction mechanisms are modeled.
In this work, we perform a Bayesian parameter estimation for a mathematical model based on a system of ordinary differential equations describing the dynamics of a larval population of Atractosteus tropicus reared in a pond. The model divides the population into three subclasses: vulnerable individuals (x), cannibalistic individuals (y), and non-vulnerable individuals (z) [15]. The vulnerable population consists of smaller larvae. The cannibalistic population comprises individuals that are larger than the vulnerable larvae or possess morphological characteristics that enable them to consume conspecifics. The non-vulnerable population consists of larvae that have attained sufficient morphological development to avoid being consumed and that do not possess the characteristics required to consume individuals of their own species. The model is based on the following assumptions:
- 1.
- Initially, the entire larval population belongs to the vulnerable class.
- 2.
- The interaction between the vulnerable and cannibalistic populations is modeled as a predator–prey relationship using a Beddington–DeAngelis functional response.
- 3.
- The quality and acceptance of the supplied food influence the occurrence of cannibalism.
- 4.
- A rate for monitoring and isolation of larvae exhibiting cannibalistic behavior is considered.
- 5.
- A proportion of the larval population becomes cannibalistic at rate for a certain period of the time.
- 6.
- All population classes are subject to a mortality rate .
The model is specifically given by
where
- m is the parameter associated with handling time and represents the proportion of each day devoted to monitoring and isolating cannibalistic individuals, with .
- a quantifies interference among cannibalistic individuals.
- n represents the initial vulnerable population.
- quantifies the quality and acceptance of the supplied food, with .
- represents the mortality rate of Atractosteus tropicus larvae.
- is the rate at which vulnerable individuals acquire cannibalistic characteristics.
- and are the rates at which individuals in the vulnerable and cannibalistic populations, respectively, transition to the non-vulnerable class.
- is the cannibalism rate within the cannibalistic population.
- The function describes the attack rate of cannibalistic individuals, regarded as predators, on the vulnerable population, regarded as prey. This expression incorporates the effects of predator satiation and interference.
- The factor , which appears in the growth term of population z, determines the maximum growth threshold of the non-vulnerable population.
Furthermore, we assume that all parameters of system (1) are positive, and we are interested in the behavior of its solutions during the first seven days following the onset of cannibalism.
2. Parameter Estimation
To carry out the numerical estimation of the mathematical model parameters, the Montecarlo method is used. To achieve this, the mathematical model is solved numerically over multiple iterations, allowing for the subsequent Bayesian estimation of the parameters.
In this work the mathematical system is solved by using the integrator implemented in the LSODA (Livemore Solvers for Ordinary Differential Equation with Automatic Method Switching) library [16]. The library LSODA was written in FORTRAN in the Lawrence Livermore National Laboratory. This algorithm efficiently handles both non-stiff and stiff problems by automatically switching between the Adams-Moulton method and backward differentiation formulas (BDF). This ensures numerical stability when evaluating regions where the population dynamics change rapidly.
2.1. Likelihood Function
Let us suppose the following data set and the solutions given by the mathematical model: , where is the component of the solution computed for the system
Where is the set of parameters in the mathematical model. In practice there exist differences between the observed data and the computed solution, which reads
where is an error. These errors come from the simplifications the in model, data measurements, and biological effects, among them.
Let us suppose
that means, the probability of observing given the model following probability density
The likelihood is the joint probability of observing every all data points given a parameter set . It is supposed that errors are independent and they follow the same probability distributions, then
Therefore, the log likelihood read as
2.2. Bayes Theorem
The Bayes Theorem read as
where
- is the posterior probability function.
- is the likelihood function.
- is the prior probability function.
- is the data probability.
Applying the Bayes Theorem and taking into account (6), we can get
By supposing the independence for the parameter in the mathematical model the joint probability function for , reads
being
- 1.
- N is the total of parameters for the model.
- 2.
- is the j-th parameter for the model.
- 3.
- in the density probability function for .
- 4.
- is the set of parameters for the density probability function .
Therefore
2.3. Metropolis - Hastings Method
This method look for to generate a sequence of samples such that it converges to the stationary distribution . This stationary distribution will be the posterior distribution.
Let such that
where k is the total number of parameters to be determined. For each iteration t, a new state is generated from the state by using a proposal distribution
Where is a square matrix of size k, such that
2.4. Acceptance Probability
The evaluation of the posterior distribution for every proposed candidate requires the value of the likelihood function (6). To compute it, the LSODA integrator is called to solve the ordinary differential equations system. Then, the computed solution is employed to evaluate (6), that solution is also to evaluate the log-prior function (8).
The acceptance probability is defined by using the Hasting ratio as
Since the normal distribution is symmetric, .Then, we get
We can define the log ratio as
In order to guarantee the balance detailed condition, let u be a random number such as
- If , then . Therefore the acceptance probability is equal to one and is accepted.
-
If , then . Hence, does not improve upon .
- If then is accepted.
- If then is not accepted.
This condition allows the scheme to escape local maximums, and it explores the whole distribution.
Then
3. Numerical Results
In this section we develop the parameter estimation for two sets of data, these sets of data were collected from [25]. In that work, they have studied the interaction of larvae in two cases: when the larvae were fed and when they were not. Those two cases were studied to measure if cannibalism appears as a result of survival processes or whether it is just an instinctive behavior
3.1. Case 1: Larvae Is Fed
In this first case, we simulated the scenario where the larvae are fed. The obtained experimental data are shown in Table 1.
To carry out the simulation, we developed Python code that implements the Metropolis-Hastings method for estimating the parameters of the mathematical model.
The acceptance for this experiment was 25.3%, this means that the method has explored all the possibles values for the parameters. The numerical approximated parameters are shown in Table 2. The information in the named column initial corresponds to the obtained values from the reference experiments, the prior information.
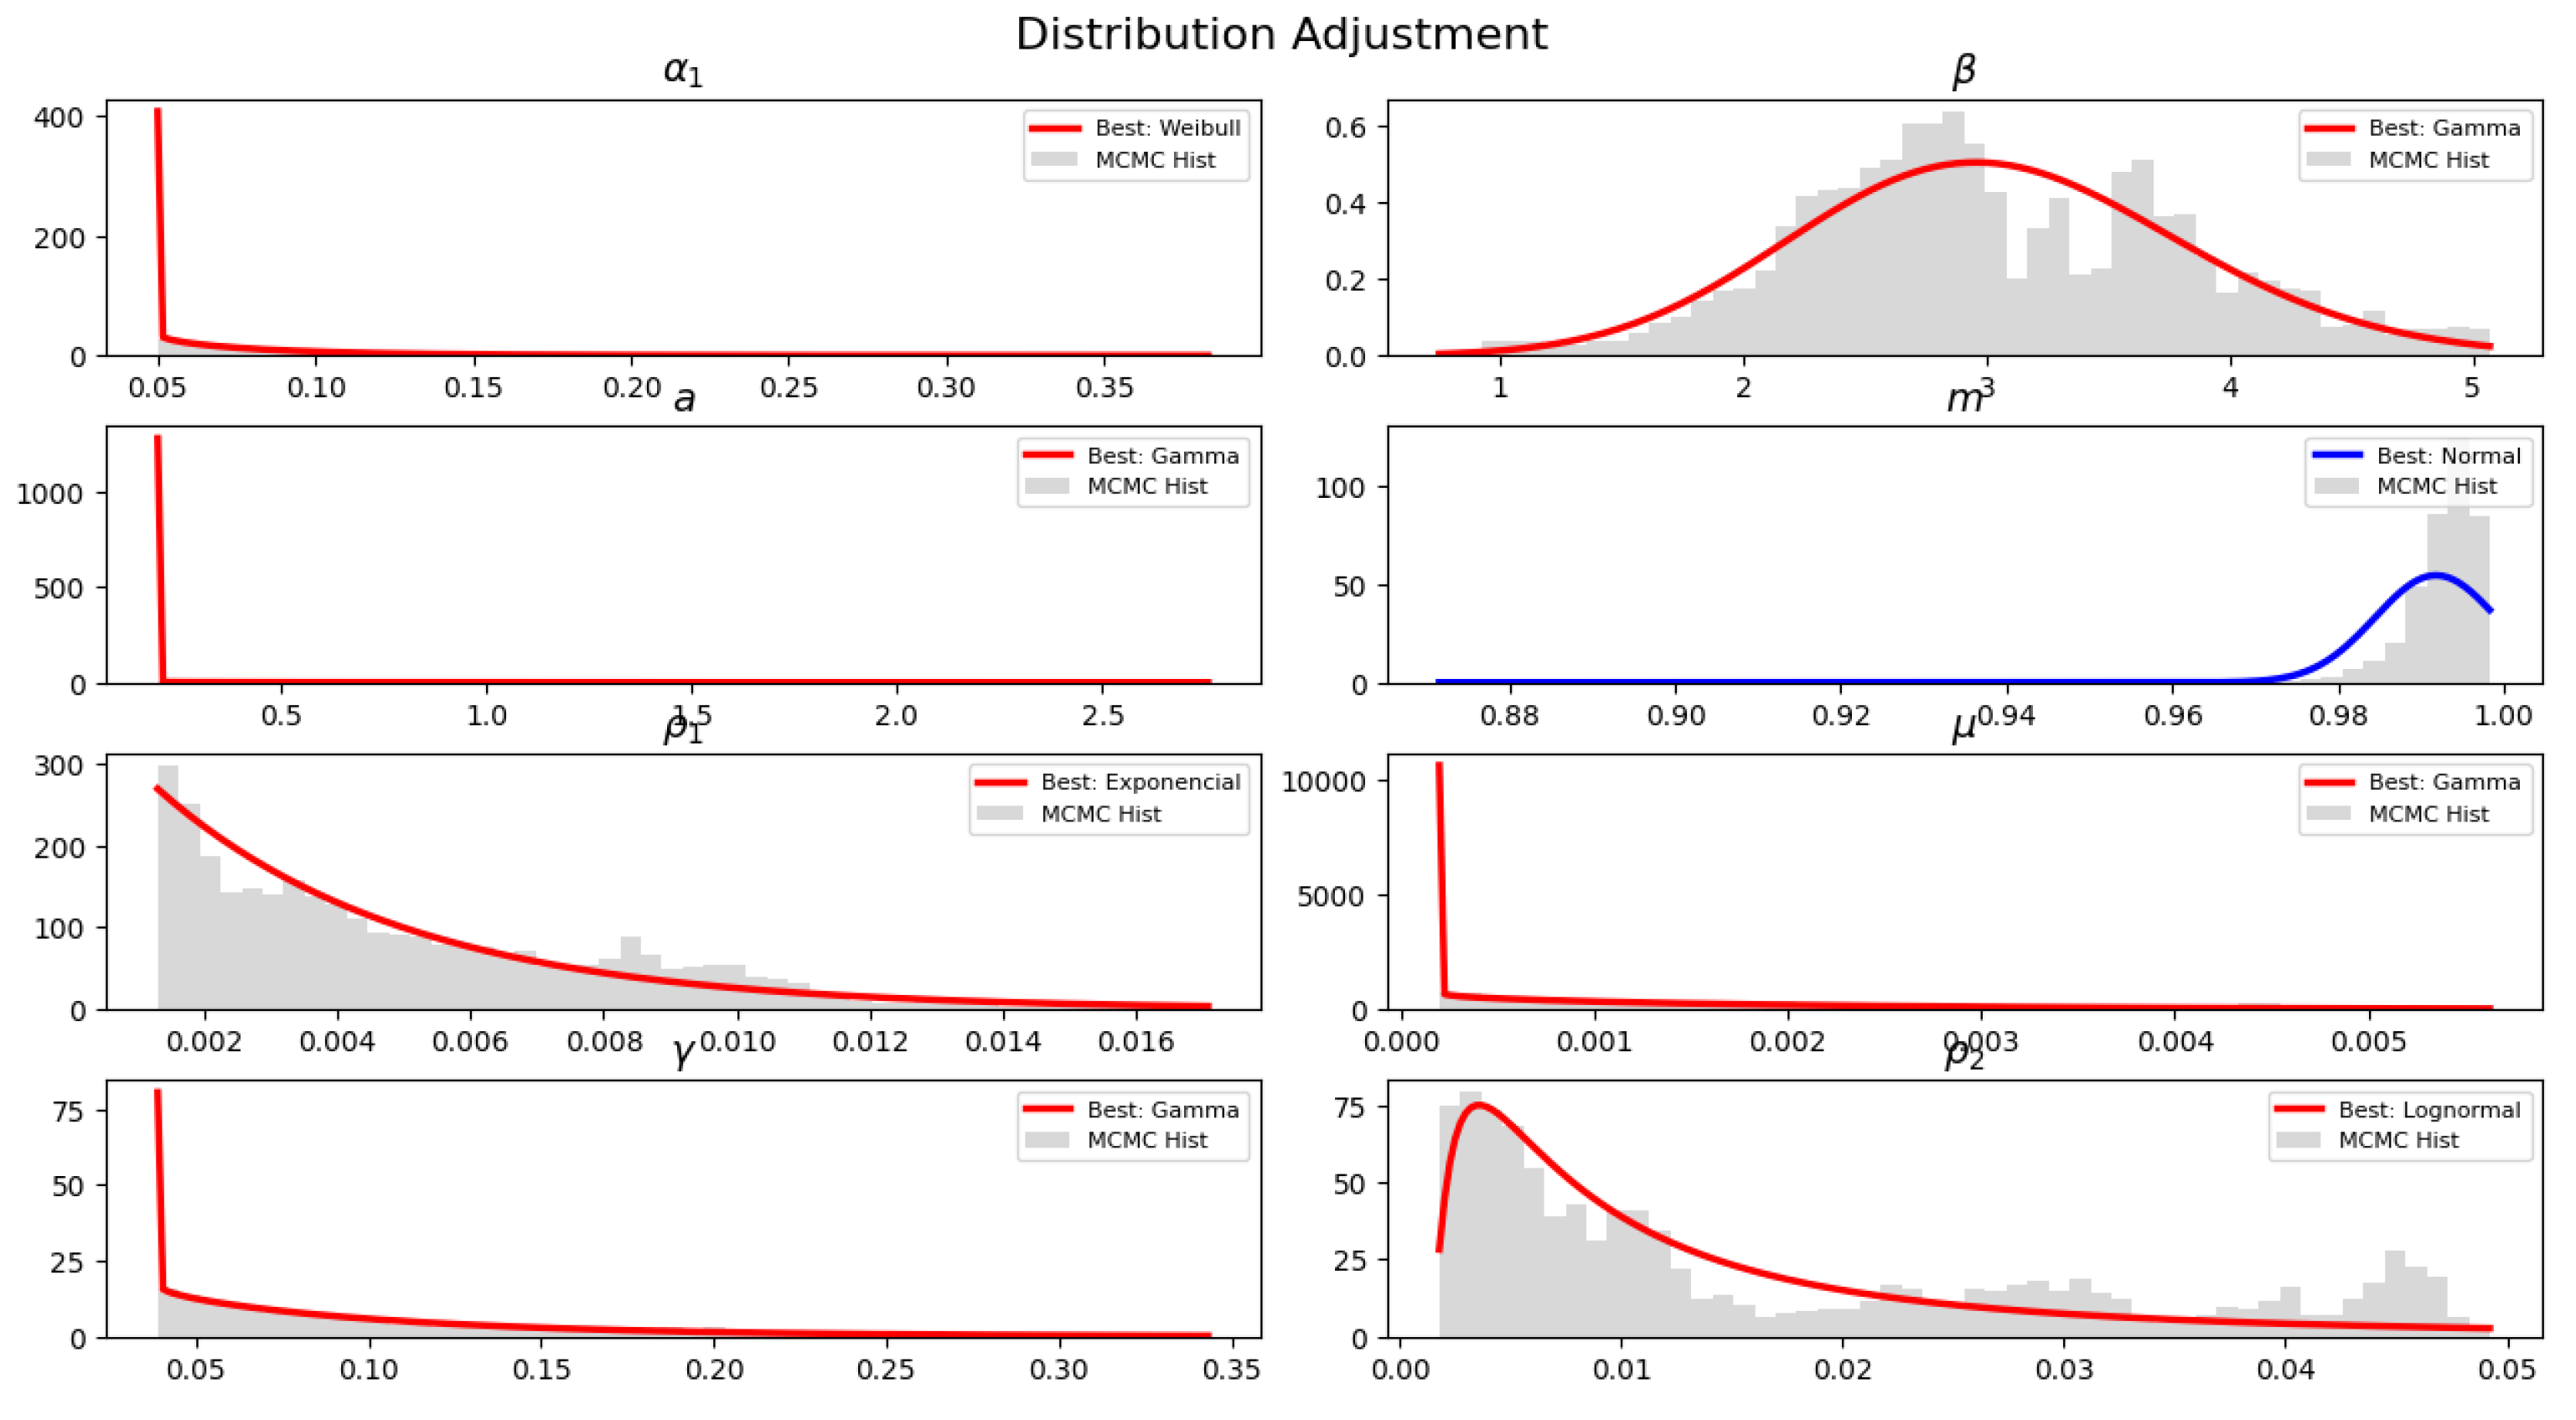
In Figure 1 we can see the obtained solution for every data set in Table 2. Notice that the obtained solution by using every estimated dataset parameter adjusts in good agreement with the experimental data. The differences between these solutions are minimal, but the one obtained using the mean is the best. Furthermore, we can notice how the solution improves from the prior information to the posterior information. In this case, we have proposed a uniform distribution centered on the prior information for every parameter in the mathematical model. Comparisons between the prior distribution and posterior distribution are shown in Figure 2. Also, the posterior distribution for each parameter after Bayesian inference is shown in Table 3, and these distributions are depicted in Figure 3.
To investigate the relationships among the parameters estimated for the fed population, we calculated the correlation matrix shown in Figure 4. Most correlations are weak, suggesting that the parameters represent largely independent biological mechanisms within the model for the fed population. Nevertheless, several important relationships can be identified.
The strongest correlation, with a value of , occurs between and m, which represent food quality and handling time, respectively. Biologically, this indicates that improving the quality of the supplied food reduces the need to monitor and isolate cannibalistic individuals. Thus, adequate feeding may reduce the occurrence of cannibalistic behavior in the initial population.
A moderate positive correlation of is observed between and m, indicating that an increase in the rate at which vulnerable individuals transition to the cannibalistic class entails a greater handling time. Likewise, the negative correlations of between and and between and indicate that better feeding conditions reduce the need for vulnerable and cannibalistic individuals to transition to the non-vulnerable class. This may occur because high-quality food decreases the stress and competition associated with cannibalism.
Moreover, parameters such as the interference coefficient a, the mortality rate , and the cannibalism parameter exhibit correlations close to zero with the remaining parameters. This suggests that these mechanisms operate relatively independently within the population dynamics of the fed system. Overall, the correlation analysis highlights food quality as one of the most important factors in reducing cannibalistic interactions and the handling time required during the culture of Atractosteus tropicus larvae under fed conditions.
3.2. Case 2: Larvae Is Not Fed
In this section the behavior when the larvae are not fed is simulated, the data for this experiment is shown in Table 4.
In this simulation we reach an acceptance rate of 23.8%, and the approximated numerical parameters are shown in Table 5. From the Figure 5, we can observe an important improvement of the numerical solution given by the prior information in comparison with the one given by the posterior information. In this case, the best approximation in the first time is given by the mode, but the best adjustment for the final ones is the mean; therefore, in order to predict the posterior behavior of the larvae population, both of them can be employed. As we have done before, in this case, a uniform distribution centered on the theoretical value is taken into account as prior information. The comparison between the prior distribution and posterior distribution is shown in Figure 6. In Table 6 we can find the best-adjusted marginal distribution for each of the parameters.
Figure 7 presents the correlation analysis among the parameters for the unfed population. Under these conditions, the larval population decreased from on day 8 to only on day 14, demonstrating the strong effect of food deprivation on the survival of Atractosteus tropicus larvae. The correlation matrix indicates that, under nutritional stress, the dynamics of the system are primarily determined by the interplay among mortality, the development of surviving individuals, and the emergence of cannibalistic behavior.
The strongest positive correlation, with a value of , occurs between the mortality rate and the transition rate of cannibalistic individuals to the non-vulnerable class . Biologically, this relationship suggests that as mortality caused by food deprivation increases, population persistence becomes more dependent on the ability of cannibalistic individuals to develop into less vulnerable stages. This behavior is consistent with the hypothesis that, in the absence of external resources, only individuals with greater competitive advantages are able to survive and continue their development [26]. This relationship also indicates that the emergence of cannibalistic behavior is one of the most important mechanisms contributing to the persistence of a proportion of the population. In addition, a positive correlation of is observed between the rate at which vulnerable individuals become cannibalistic, , and the handling time, m, indicating that a greater prevalence of cannibalistic individuals requires more handling time. The estimated values of reported in Table 5 remain high, whereas the parameter m increases considerably relative to its theoretical value. This suggests that a greater prevalence of cannibalism would require increased monitoring and isolation efforts to reduce population losses under culture conditions.
Figure 8.
Better distribution for each one of the parameters.
Conversely, the negative correlations between the cannibalism rate and the transition rate of vulnerable individuals to the non-vulnerable class (), as well as between interference among cannibalistic individuals a and (), indicate that increased aggressive interactions hinder the normal development of individuals. In particular, an increase in cannibalism reduces the likelihood that vulnerable individuals will survive, whereas greater interference among cannibalistic individuals decreases the efficiency with which they exploit the resources obtained through cannibalism. Furthermore, Table 5 shows that the parameter , which represents food quality, is lower than its theoretical value, reflecting the effective absence of nutritional resources during the experiment. These results suggest that when the larval population is not fed, cannibalism ceases to function solely as a mechanism of intraspecific competition and instead becomes a survival strategy that contributes to the persistence of a small proportion of the population. Therefore, the correlation matrix supports the hypothesis that food availability is one of the most important factors regulating the intensity of cannibalism and maintaining the survival of Atractosteus tropicus larvae in culture systems.
4. Conclusions
In this study, Bayesian parameter estimation using the Metropolis-Hastings algorithm was successfully applied to a mathematical model who describes the cannibalistic dynamics of Atractosteus tropicus larvae. The model was evaluated under two distinct nutritional scenarios, fed and unfed, providing deep insights into the mechanisms driving intracohort cannibalism.
The numerical results highlight that food availability fundamentally alters the role of cannibalism within the population:
Under fed conditions: Cannibalism acts primarily as an opportunistic behavior driven by intraspecific competition. The parameter estimation revealed a strong negative correlation between food quality, , and the required handling time m. This demonstrates that supplying high-quality food is the most effective strategy to mitigate cannibalistic interactions, consequently reducing the operational effort required to monitor and isolate aggressive individuals.
Under unfed conditions: The dynamics shift drastically, and cannibalism becomes a critical survival strategy rather than mere competition. This is evidenced by the strong positive correlation between the mortality rate and the transition rate of cannibalistic individuals to the non-vulnerable class . In the absence of external nutritional resources, only those individuals that resort to cannibalism acquire the necessary energy to develop into advanced, non vulnerable stages, allowing a small fraction of the population 27.14% to persist.
Furthermore, both scenarios show a positive correlation between the rate at which vulnerable individuals become cannibalistic and the handling time m. This underscores a direct practical application for larviculture: minimizing the emergence of cannibals through adequate feeding protocols directly optimizes farm management by reducing labor-intensive monitoring.
In summary, the mathematical modeling and Bayesian inference applied in this work quantitatively validate that cannibalism in Atractosteus tropicus is a complex, resource-dependent dynamic. Providing high-quality food substantially reduces both cannibalism and handling time, thereby maximizing the overall survival and morphological development of the cultured species
Author Contributions
Conceptualization, J.C.G.-A., M.F.J. and G.B.; methodology, J.C.G.-A., M.F.J., G.B., R.M.-G., C.A.A.-G. and A.Y.H.; software, J.C.G.-A. and M.F.J; validation, G.B., R.M.-G. and C.A.A.-G.; formal analysis, J.C.G.-A., M.F.J. and G.B.; investigation, J.C.G.-A., M.F.J.and G.B.; resources, J.C.G.-A., M.F.J., G.B., R.M.-G., C.A.A.-G. and A.Y.H.; data curation, R.M.-G. and C.A.A.-G.; writing—original draft preparation, J.C.G.-A., M.F.J.and G.B.; writing—review and editing, J.C.G.-A., M.F.J., G.B. and A.Y.H.; visualization, J.C.G.-A. and M.F.J.; supervision, G.B.; project administration, R.M.-G., C.A.A.-G. and G.B. All authors have read and agreed to the published version of the manuscript.
Funding
This research received no external funding.
Institutional Review Board Statement
Not applicable.
Informed Consent Statement
Not applicable.
Data Availability Statement
Data is contained within the article or supplementary material.
Acknowledgments
The second and last authors thank SECIHTI for the postdoctoral fellowship.
Conflicts of Interest
The authors declare no conflicts of interest.
References
- Pereira, L. S.; Agostinho, A. A.; Winemiller, K. O. Revisiting cannibalism in fishes. Rev. Fish. Biol. Fish. 2017, 27, 499–513. [Google Scholar] [CrossRef]
- Baras, E.; Jobling, M. Dynamics of intracohort cannibalism in cultured fish. Aquac. Res. 2002, 33(7), 461–479. [Google Scholar] [CrossRef]
- Katavić, I.; Jug-Dujaković, J.; Glamuzina, B. Cannibalism as a factor affecting the survival of intensively cultured sea bass (Dicentrarchus labrax) fingerlings. Aquaculture 1989, 77(2–3), 135–143. [Google Scholar] [CrossRef]
- Hecht, T.; Pienaar, A. G. A review of cannibalism and its implications in fish larviculture. J. World Aquac. Soc. 1993, 24(2), 246–261. [Google Scholar] [CrossRef]
- Riesch, R.; Araújo, M. S.; Bumgarner, S.; Filla, C.; Pennafort, L.; Goins, T. R.; Lucion, D.; Makowicz, A. M.; Martin, R. A.; Pirroni, S.; et al. Resource competition explains rare cannibalism in the wild in livebearing fishes. Ecol. Evol. 2022, 12(5), e8872. [Google Scholar] [CrossRef] [PubMed]
- Bose, A. P. H.; Cogliati, K. M.; Howe, H. S.; Balshine, S. Factors influencing cannibalism in the plainfin midshipman fish. Anim. Behav. 2014, 96, 159–166. [Google Scholar] [CrossRef]
- Liu, X.; Yang, Z.; Chen, Z.; Fan, Q.; Dai, L.; Xu, L.; Han, D.; Cao, J.; Tian, S.; Chen, Y. Evaluating ecological drivers of fish cannibalism: Impacts of populational and environmental factors. Mar. Ecol. Prog. Ser. 2025, 775, 153–169. [Google Scholar] [CrossRef]
- Edeline, E.; Bennevault, Y.; Rozen-Rechels, D. Habitat structural complexity increases age-class coexistence and population growth rate through relaxed cannibalism in a freshwater fish. Peer Community J. 2025, 5. [Google Scholar] [CrossRef]
- Guedes, G. H. S.; Franco, A. C. S.; dos Santos, L. N.; dos Santos, A. F. G. N.; Araújo, F. G. Cannibalism facilitates and sustains the invasion of top-predator fish (Cichlidae: Cichla) in human-modified ecosystems. Freshw. Biol. 2024, 69(7), 1001–1015. [Google Scholar] [CrossRef]
- Zhang, F.; Chen, Y.; Li, J. Dynamical analysis of a stage-structured predator-prey model with cannibalism. Math. Biosci. 2019, 307, 33–41. [Google Scholar] [CrossRef] [PubMed]
- Al Basheer, A.; Parshad, R. D.; Quansah, E.; Yu, S.; Upadhyay, R. K. Exploring the dynamics of a Holling–Tanner model with cannibalism in both predator and prey population. Int. J. Biomath. 2018, 11(1), 1850010. [Google Scholar] [CrossRef]
- Lin, Q.; Liu, C.; Xie, X.; Xue, Y. Global attractivity of Leslie–Gower predator-prey model incorporating prey cannibalism. Adv. Differ. Equ. 2020, 2020(1), 1–15. [Google Scholar] [CrossRef]
- Mortoja, S. G.; Panja, P.; Mondal, S. K. Stability analysis of plankton–fish dynamics with cannibalism effect and proportionate harvesting on fish. Mathematics 2023, 11(13), 3011. [Google Scholar] [CrossRef]
- Takyi, E. M.; Cooper, K.; Dreher, A.; McCrorey, C. The (de)stabilizing effect of juvenile prey cannibalism in a stage-structured model. Math. Biosci. Eng. 2022, 20(2). [Google Scholar] [CrossRef] [PubMed]
- Jiménez, M. F.; Blé, G.; Sepúlveda-Quiroz, C. A.; Martínez-García, R.; Álvarez-González, C. A. A mathematical model for captive fish with cannibalism [Preprint]. arXiv 2026. [Google Scholar]
- Petzold, L. Automatic selection of methods for solving stiff and nonstiff systems of ordinary differential equations. SIAM J. Sci. Stat. Comput. 1983, 4(1), 136–148. [Google Scholar] [CrossRef]
- Bashforth, F.; Adams, J. C. An attempt to test the theories of capillary action by comparing the theoretical and measured forms of drops of fluid; Cambridge University Press, 1883. [Google Scholar]
- Moulton, F. R. New methods in exterior ballistics; University of Chicago Press, 1926. [Google Scholar]
- Gear, C. W. The automatic integration of ordinary differential equations. Commun. ACM 1971, 14(3), 176–179. [Google Scholar] [CrossRef]
- Bishop, C. M. Pattern recognition and machine learning; Springer, 2006. [Google Scholar]
- Chib, S.; Greenberg, E. Understanding the Metropolis–Hastings algorithm. Am. Stat. 1995, 49(4), 327–335. [Google Scholar] [CrossRef]
- Robert, C. P.; Casella, G. Monte Carlo statistical methods; Springer, 1999; Vol. 2. [Google Scholar]
- Gelman, A.; Carlin, J. B.; Stern, H. S.; Dunson, D. B.; Vehtari, A.; Rubin, D. B. Bayesian data analysis, 3rd ed.; Taylor & Francis, 2013. [Google Scholar]
- Gelman, A.; Gilks, W. R.; Roberts, G. O. Weak convergence and optimal scaling of random walk Metropolis algorithms. Ann. Appl. Probab. 1997, 7(1), 110–120. [Google Scholar] [CrossRef]
- Sepúlveda-Quiroz, C. A.; Alvarez-Villagomez, C. S.; Álvarez-González, C. A.; Jiménez-Martínez, L. D.; Pérez-Jiménez, G. M.; Asencio-Alcudia, G. G.; Mendoza-Porras, O.; López-Hernández, J. F.; Pérez-Morales, A.; Galaviz-Espinoza, M. A.; Tovar-Ramirez, D.; Ramírez-Martínez, C.; Martínez-García, R. Intra-cohort cannibalism and aggressive behavior in tropical gar (Atractosteus tropicus) larvae: Effects of stocking density and starvation. Aquaculture 2024, 593, 741324. [Google Scholar] [CrossRef]
- Baras, E. Sibling cannibalism among juvenile vundu under controlled conditions. I. Cannibalistic behaviour, prey selection and prey size selectivity. J. Fish. Biol. 1999, 54(1), 82–105. [Google Scholar] [CrossRef]
Figure 1.
Fitting data when the population is fed.
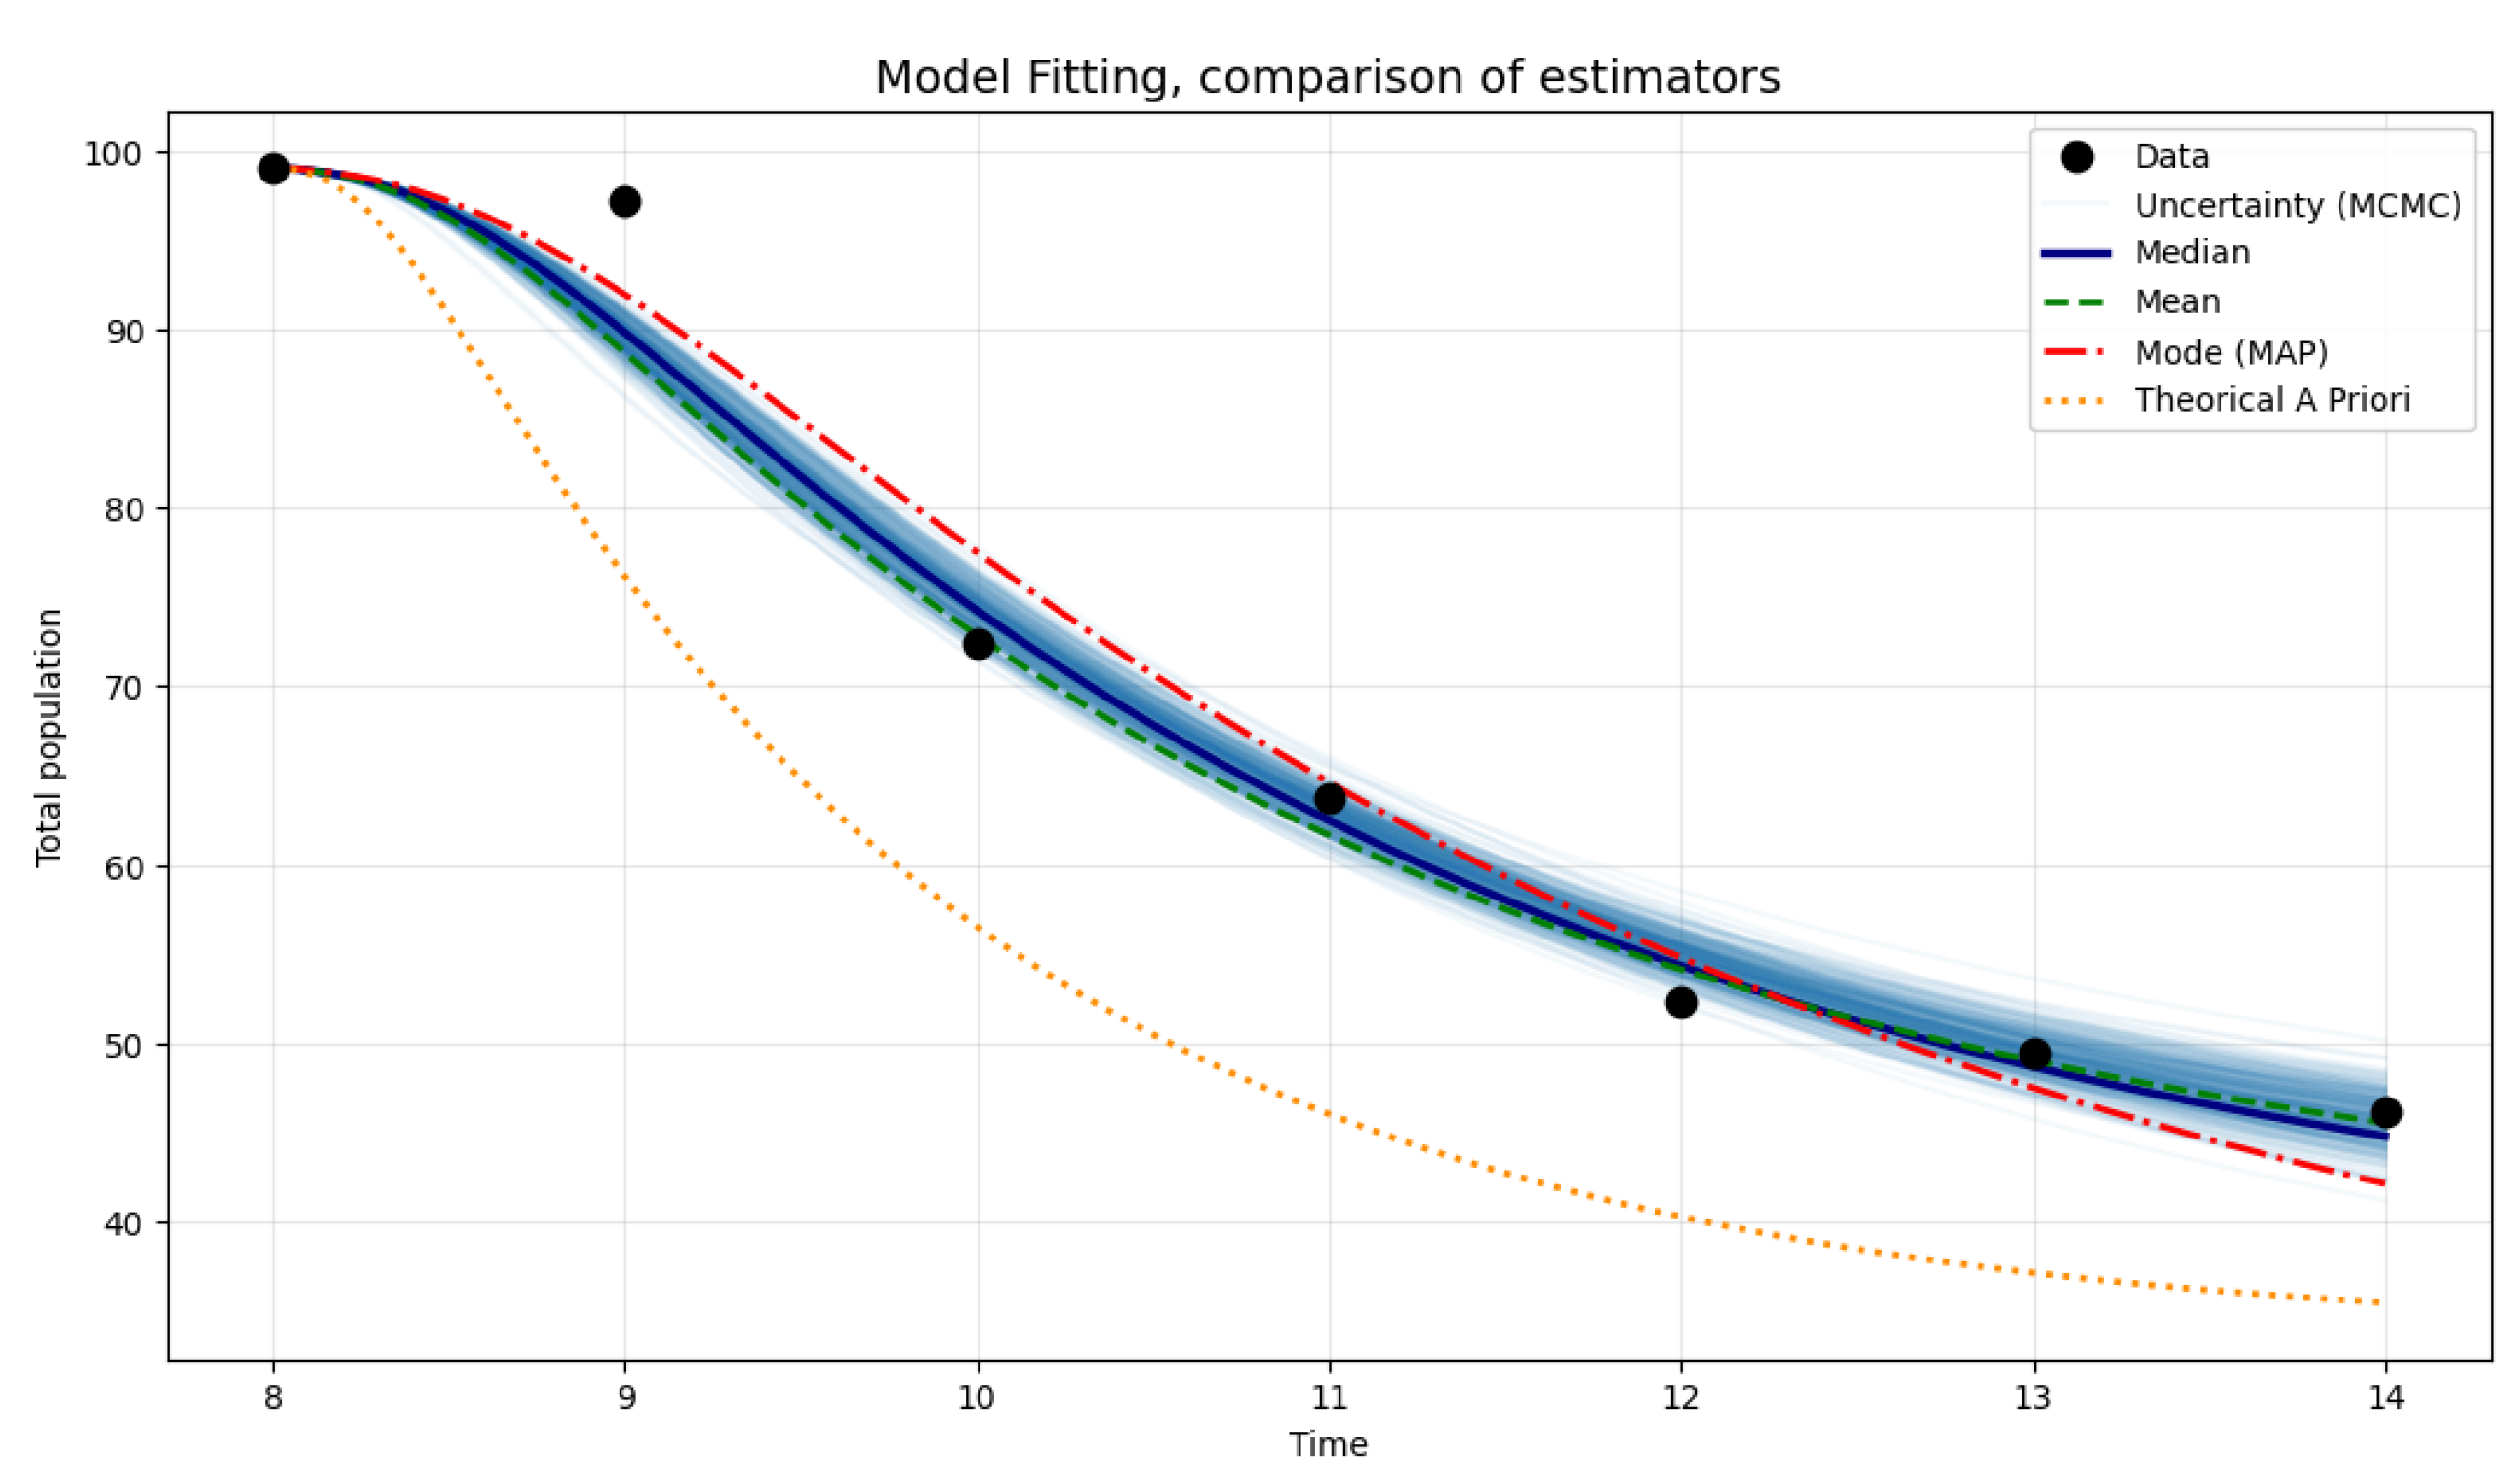
Figure 2.
Prior vs Posterior Distributions
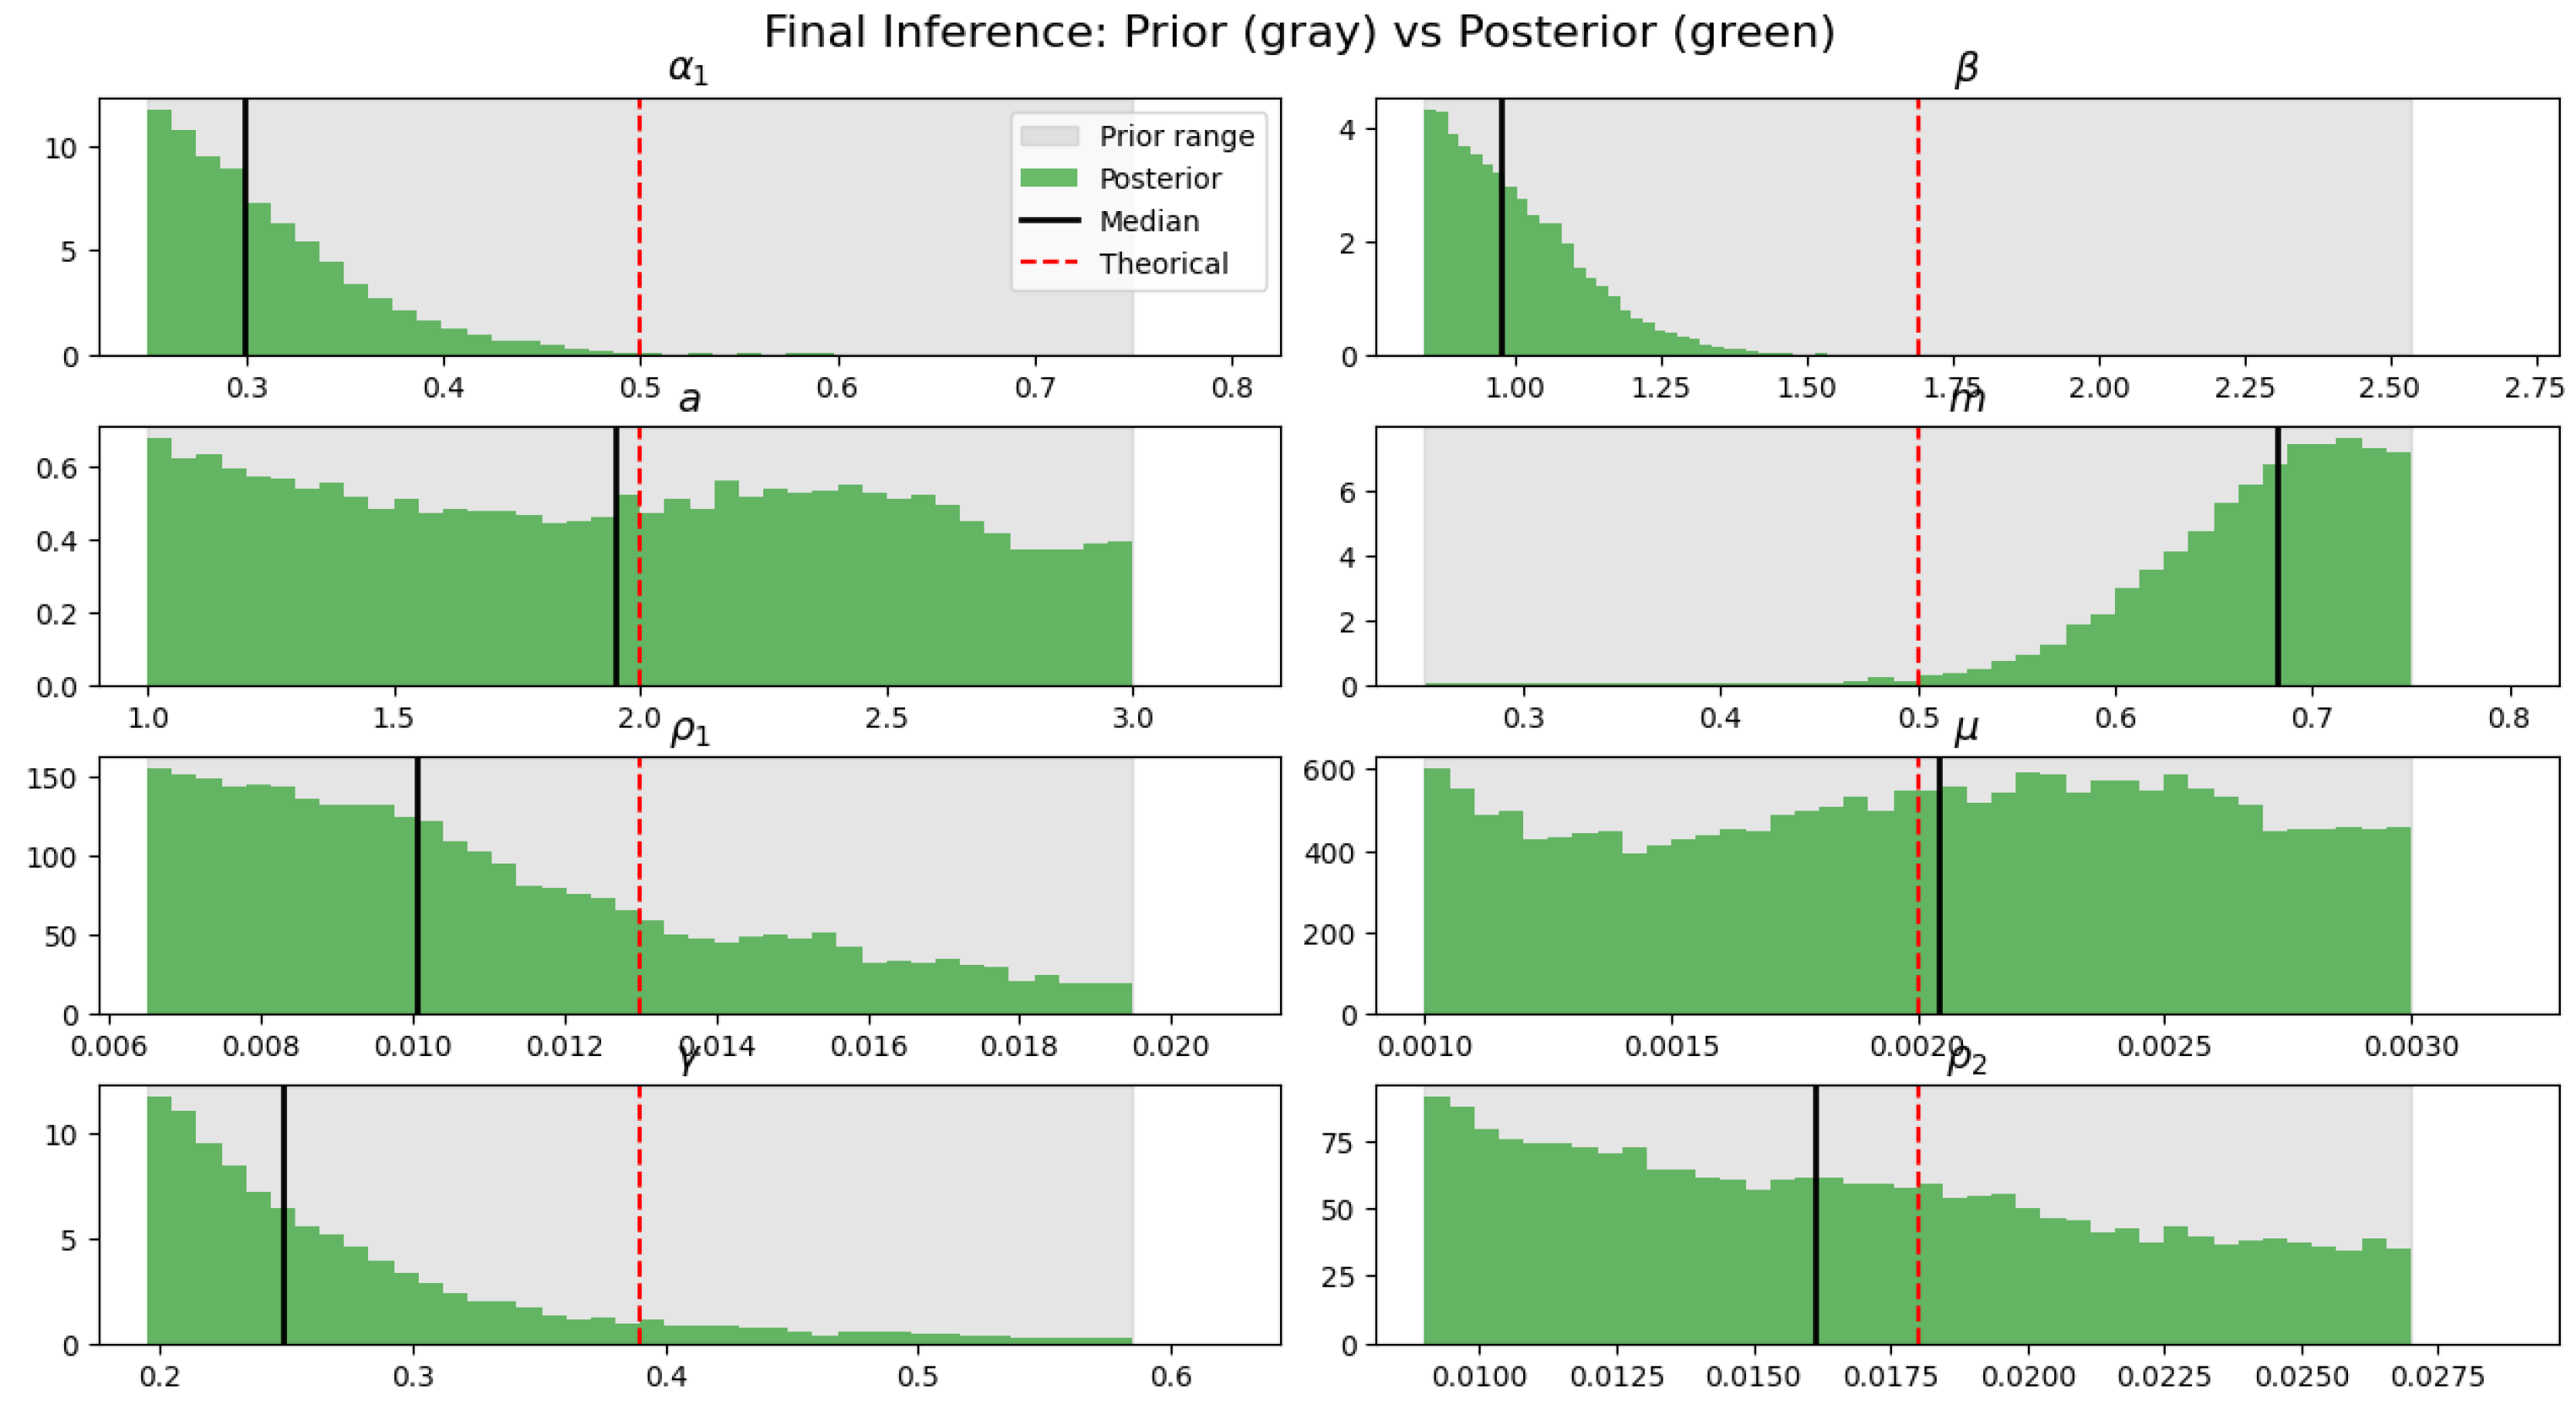
Figure 3.
Better distribution for each one of the parameters
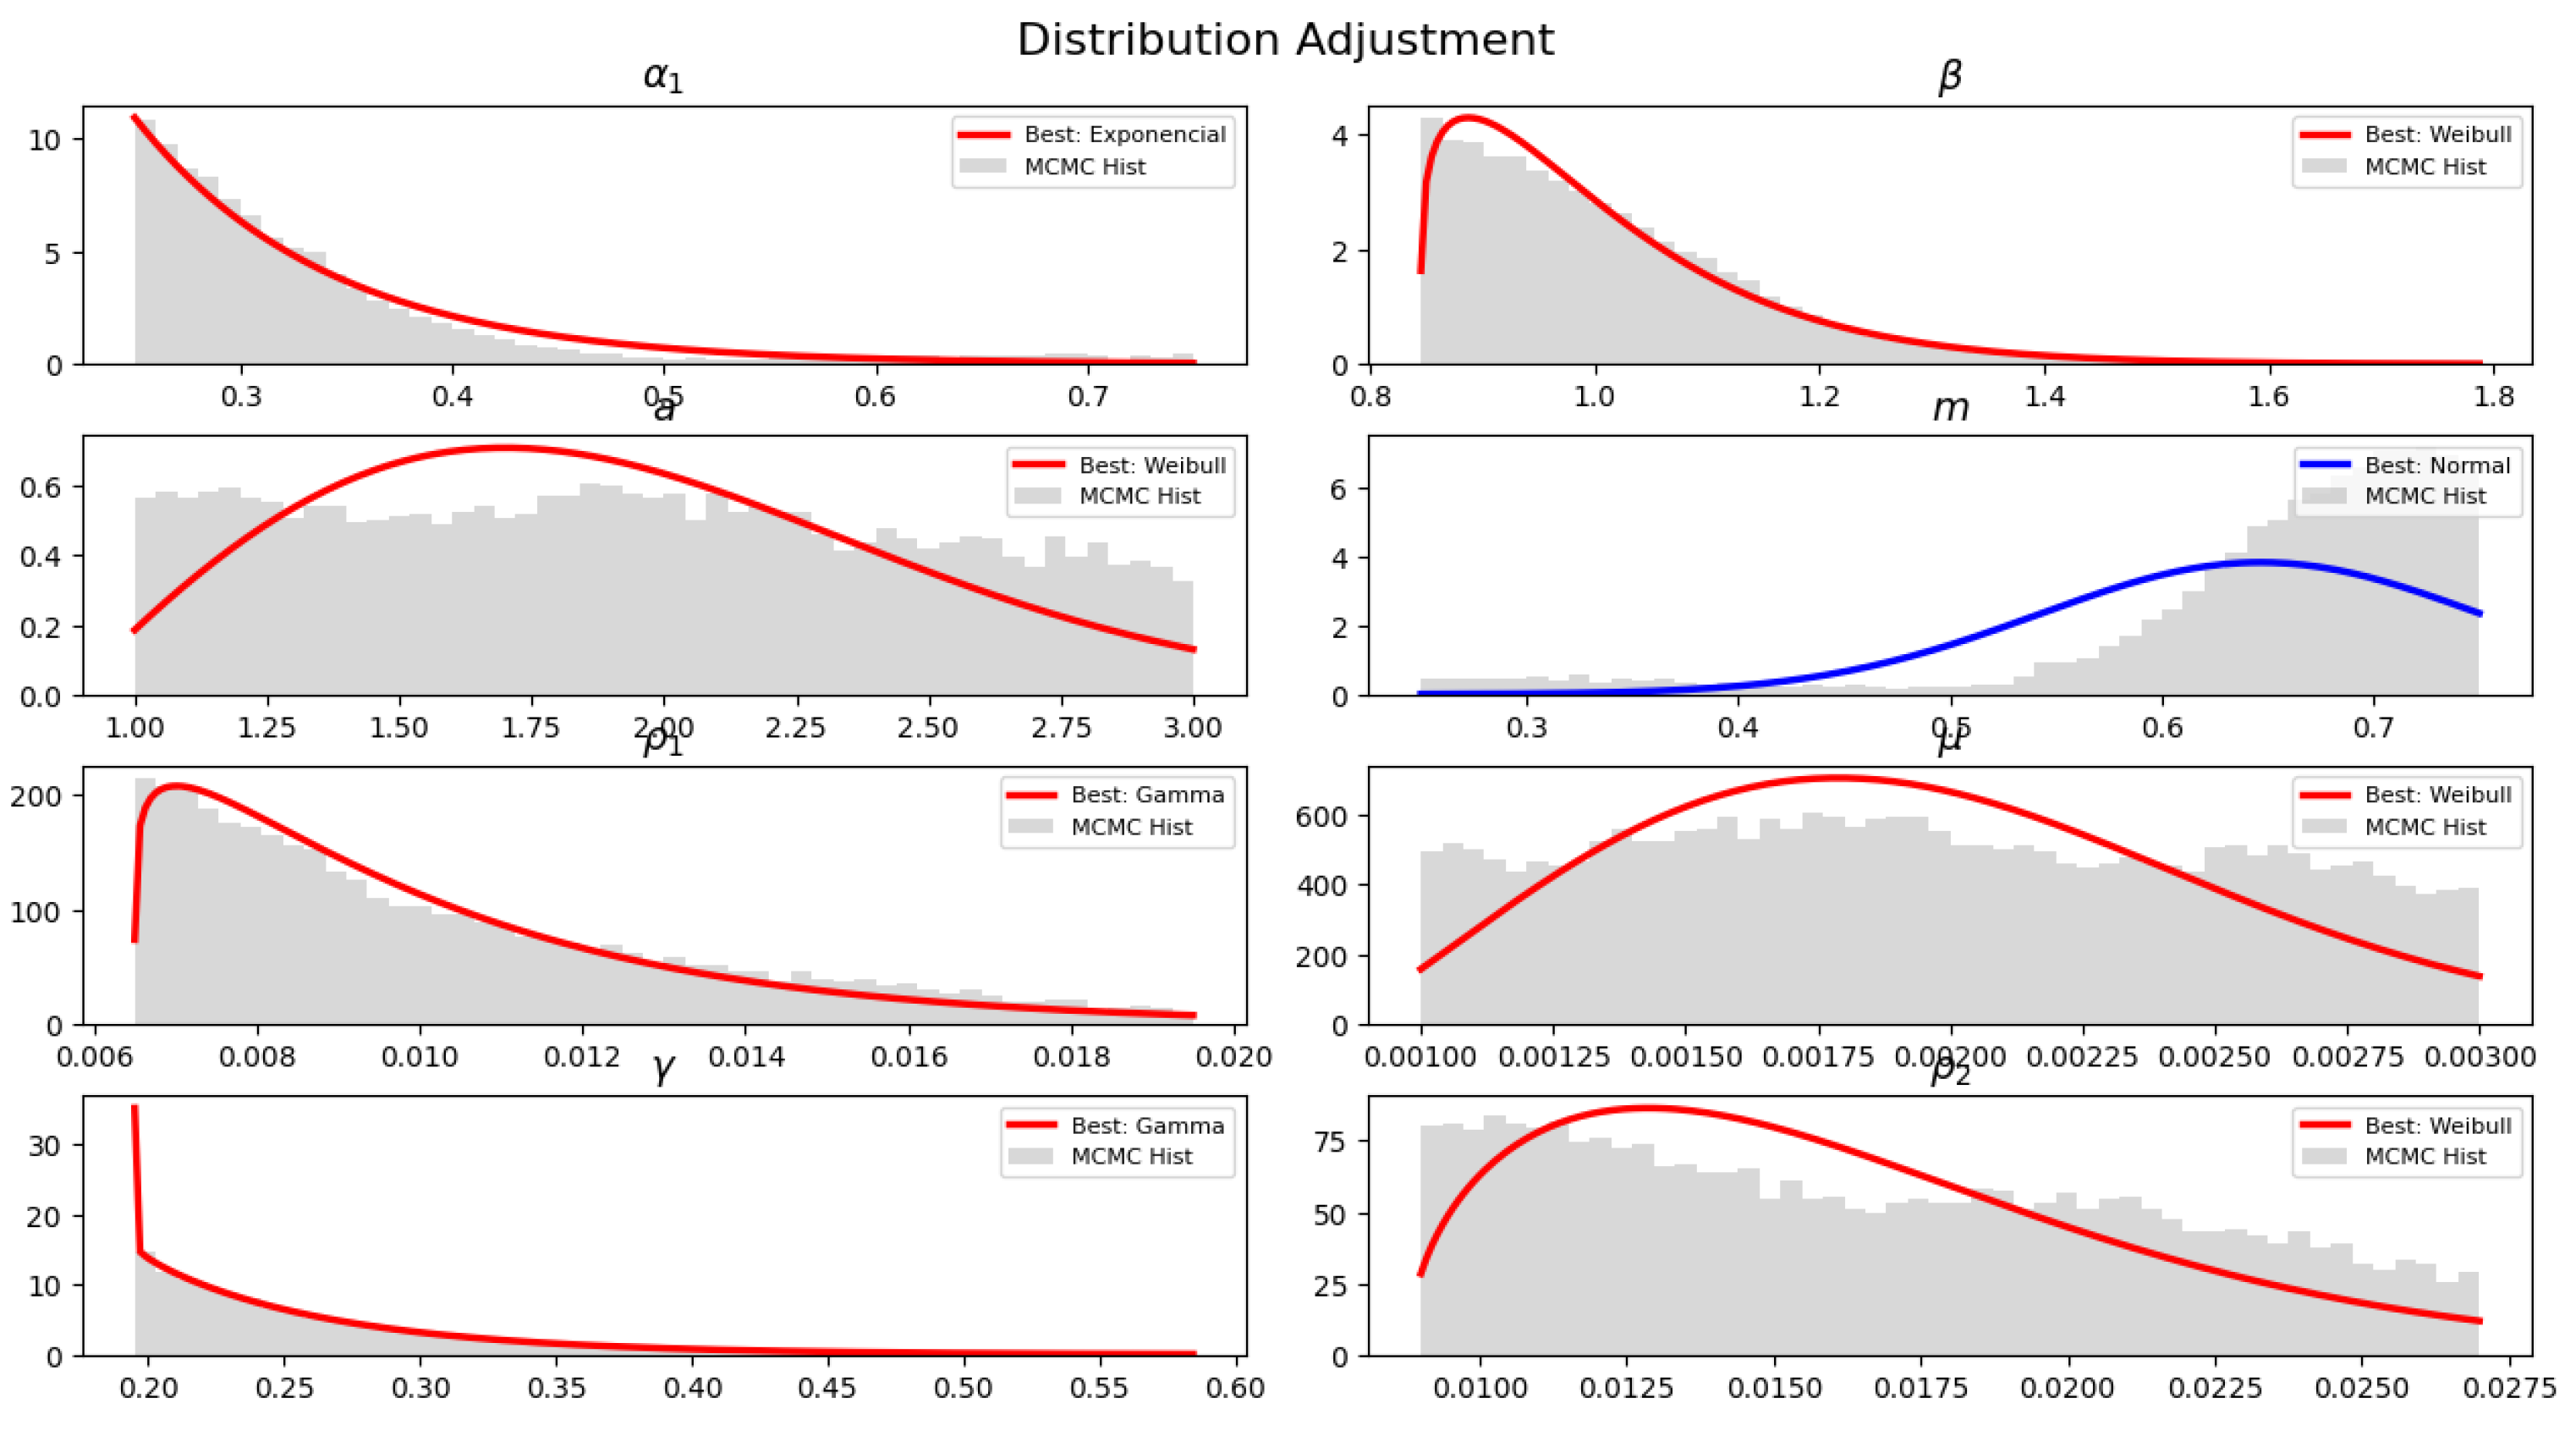
Figure 4.
Correlation matrix of parameters when the population is fed.
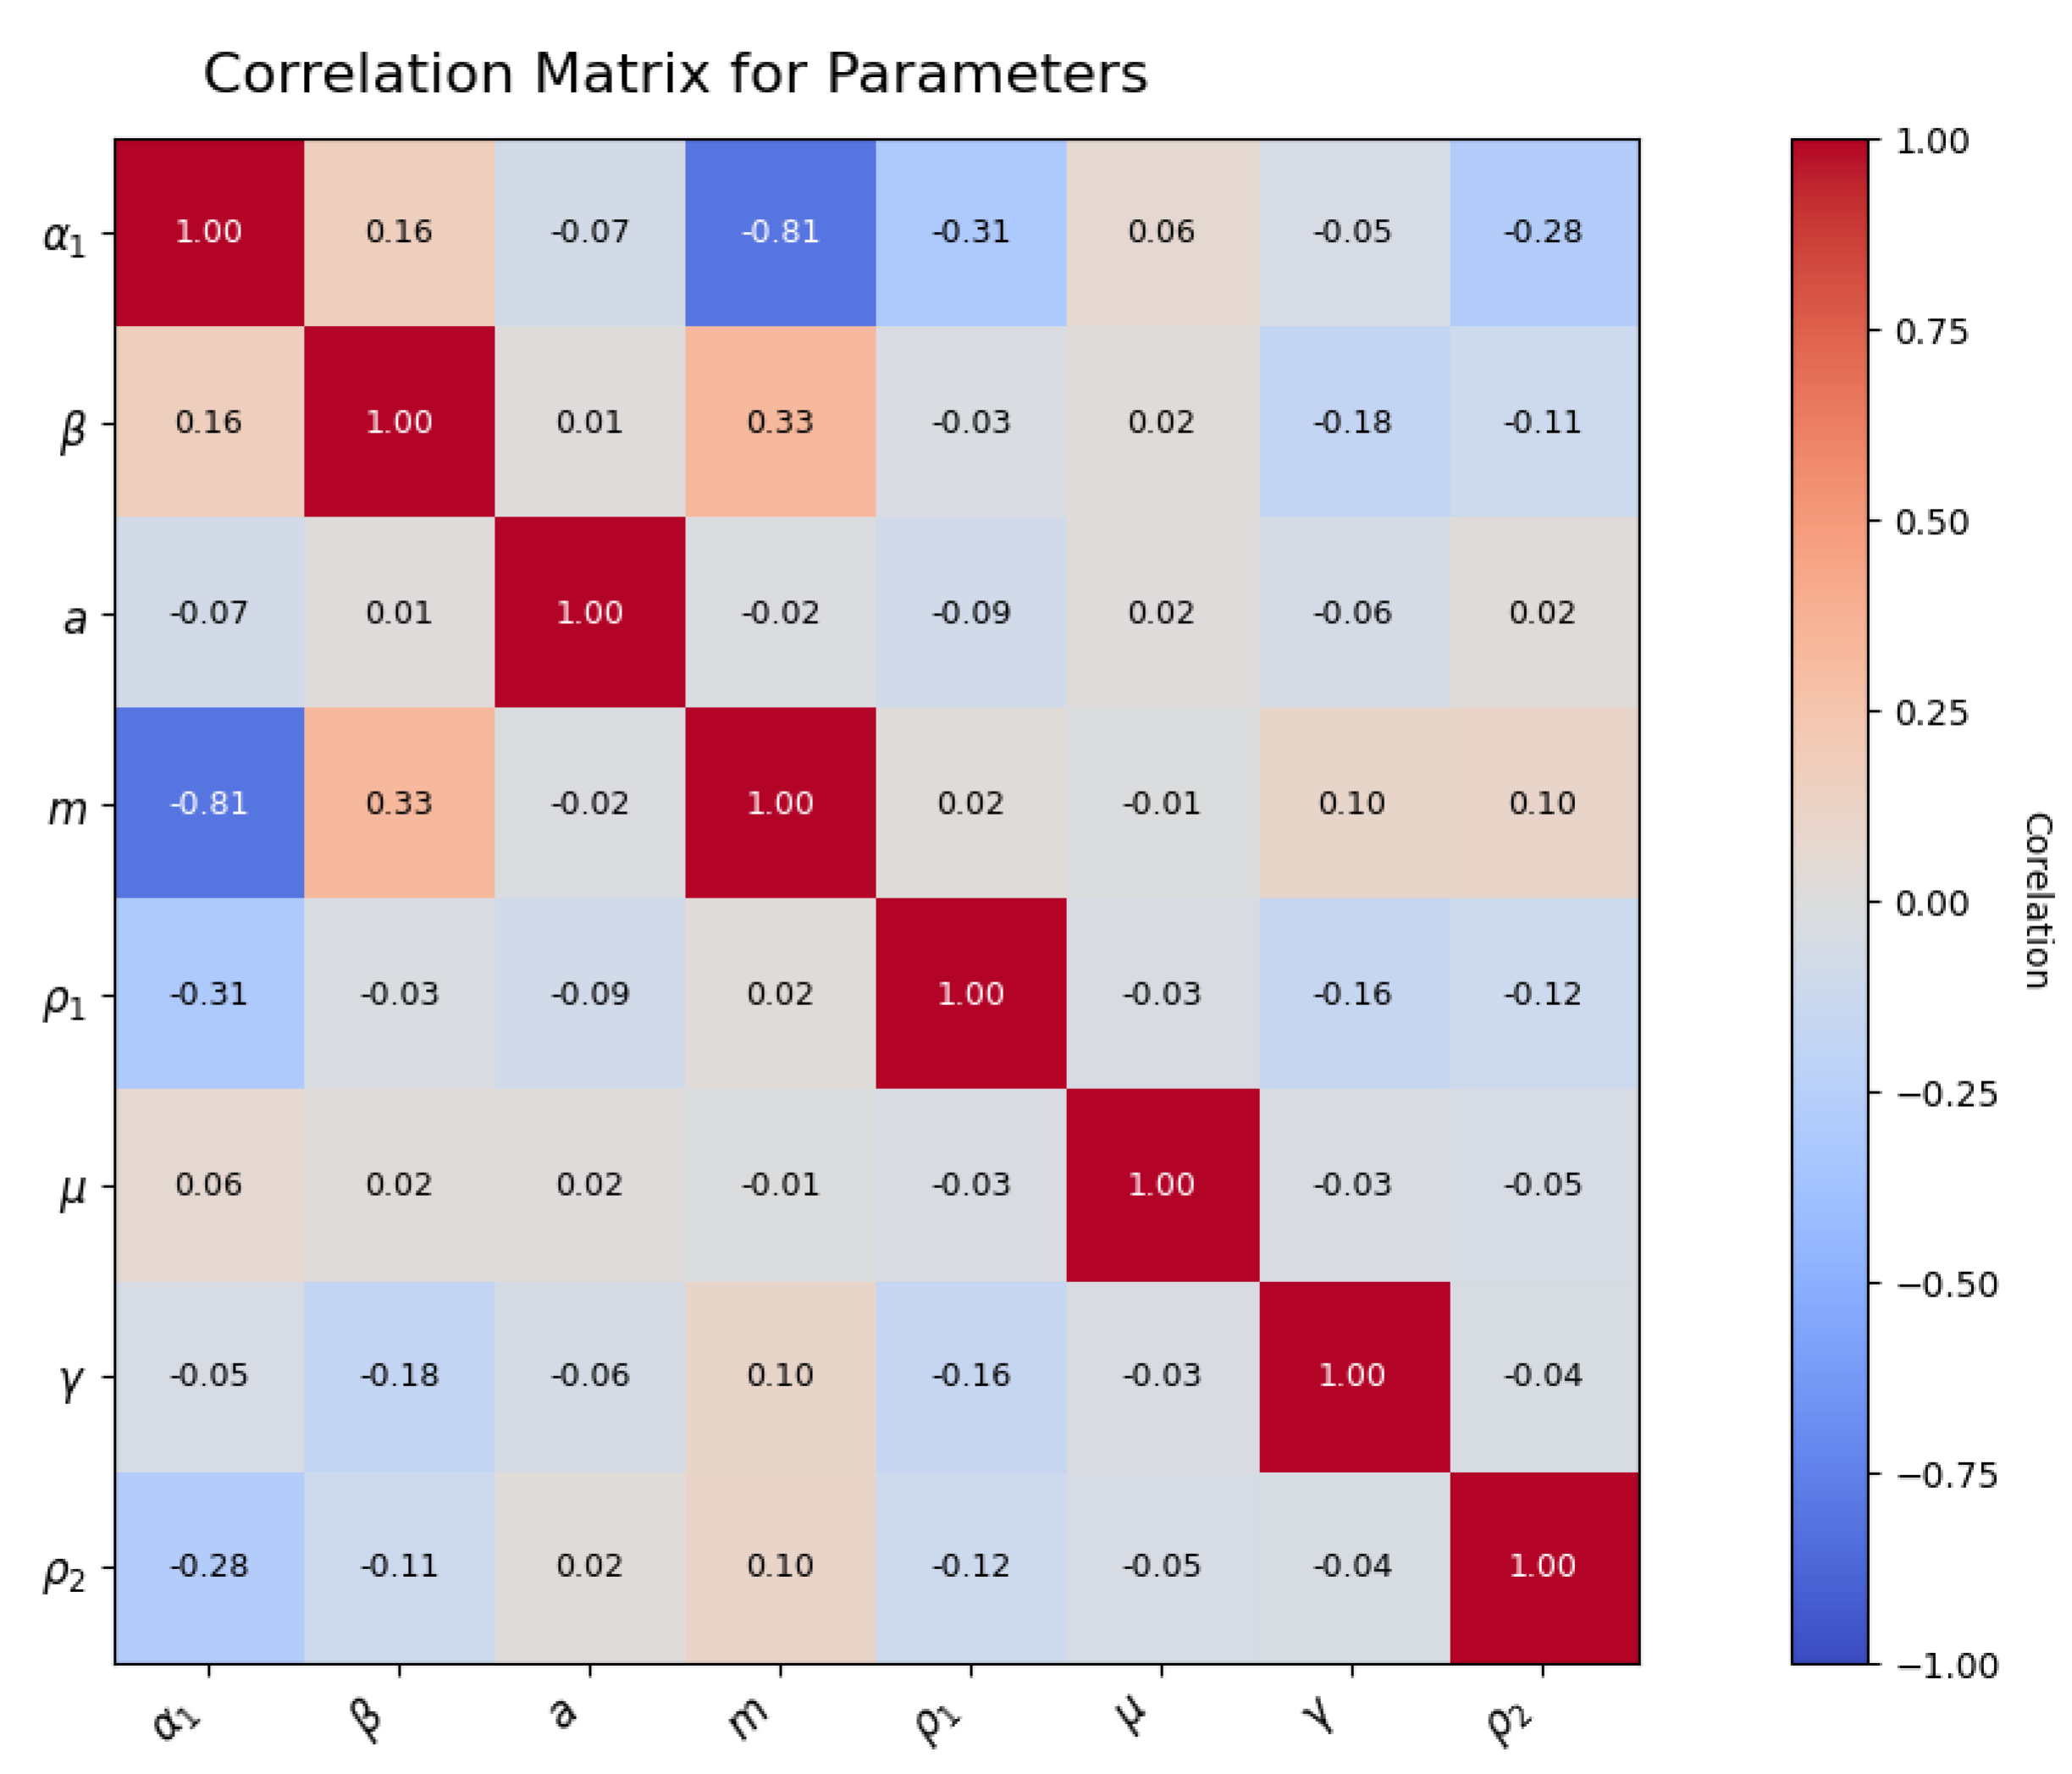
Figure 5.
Fitting data when the population is not fed.
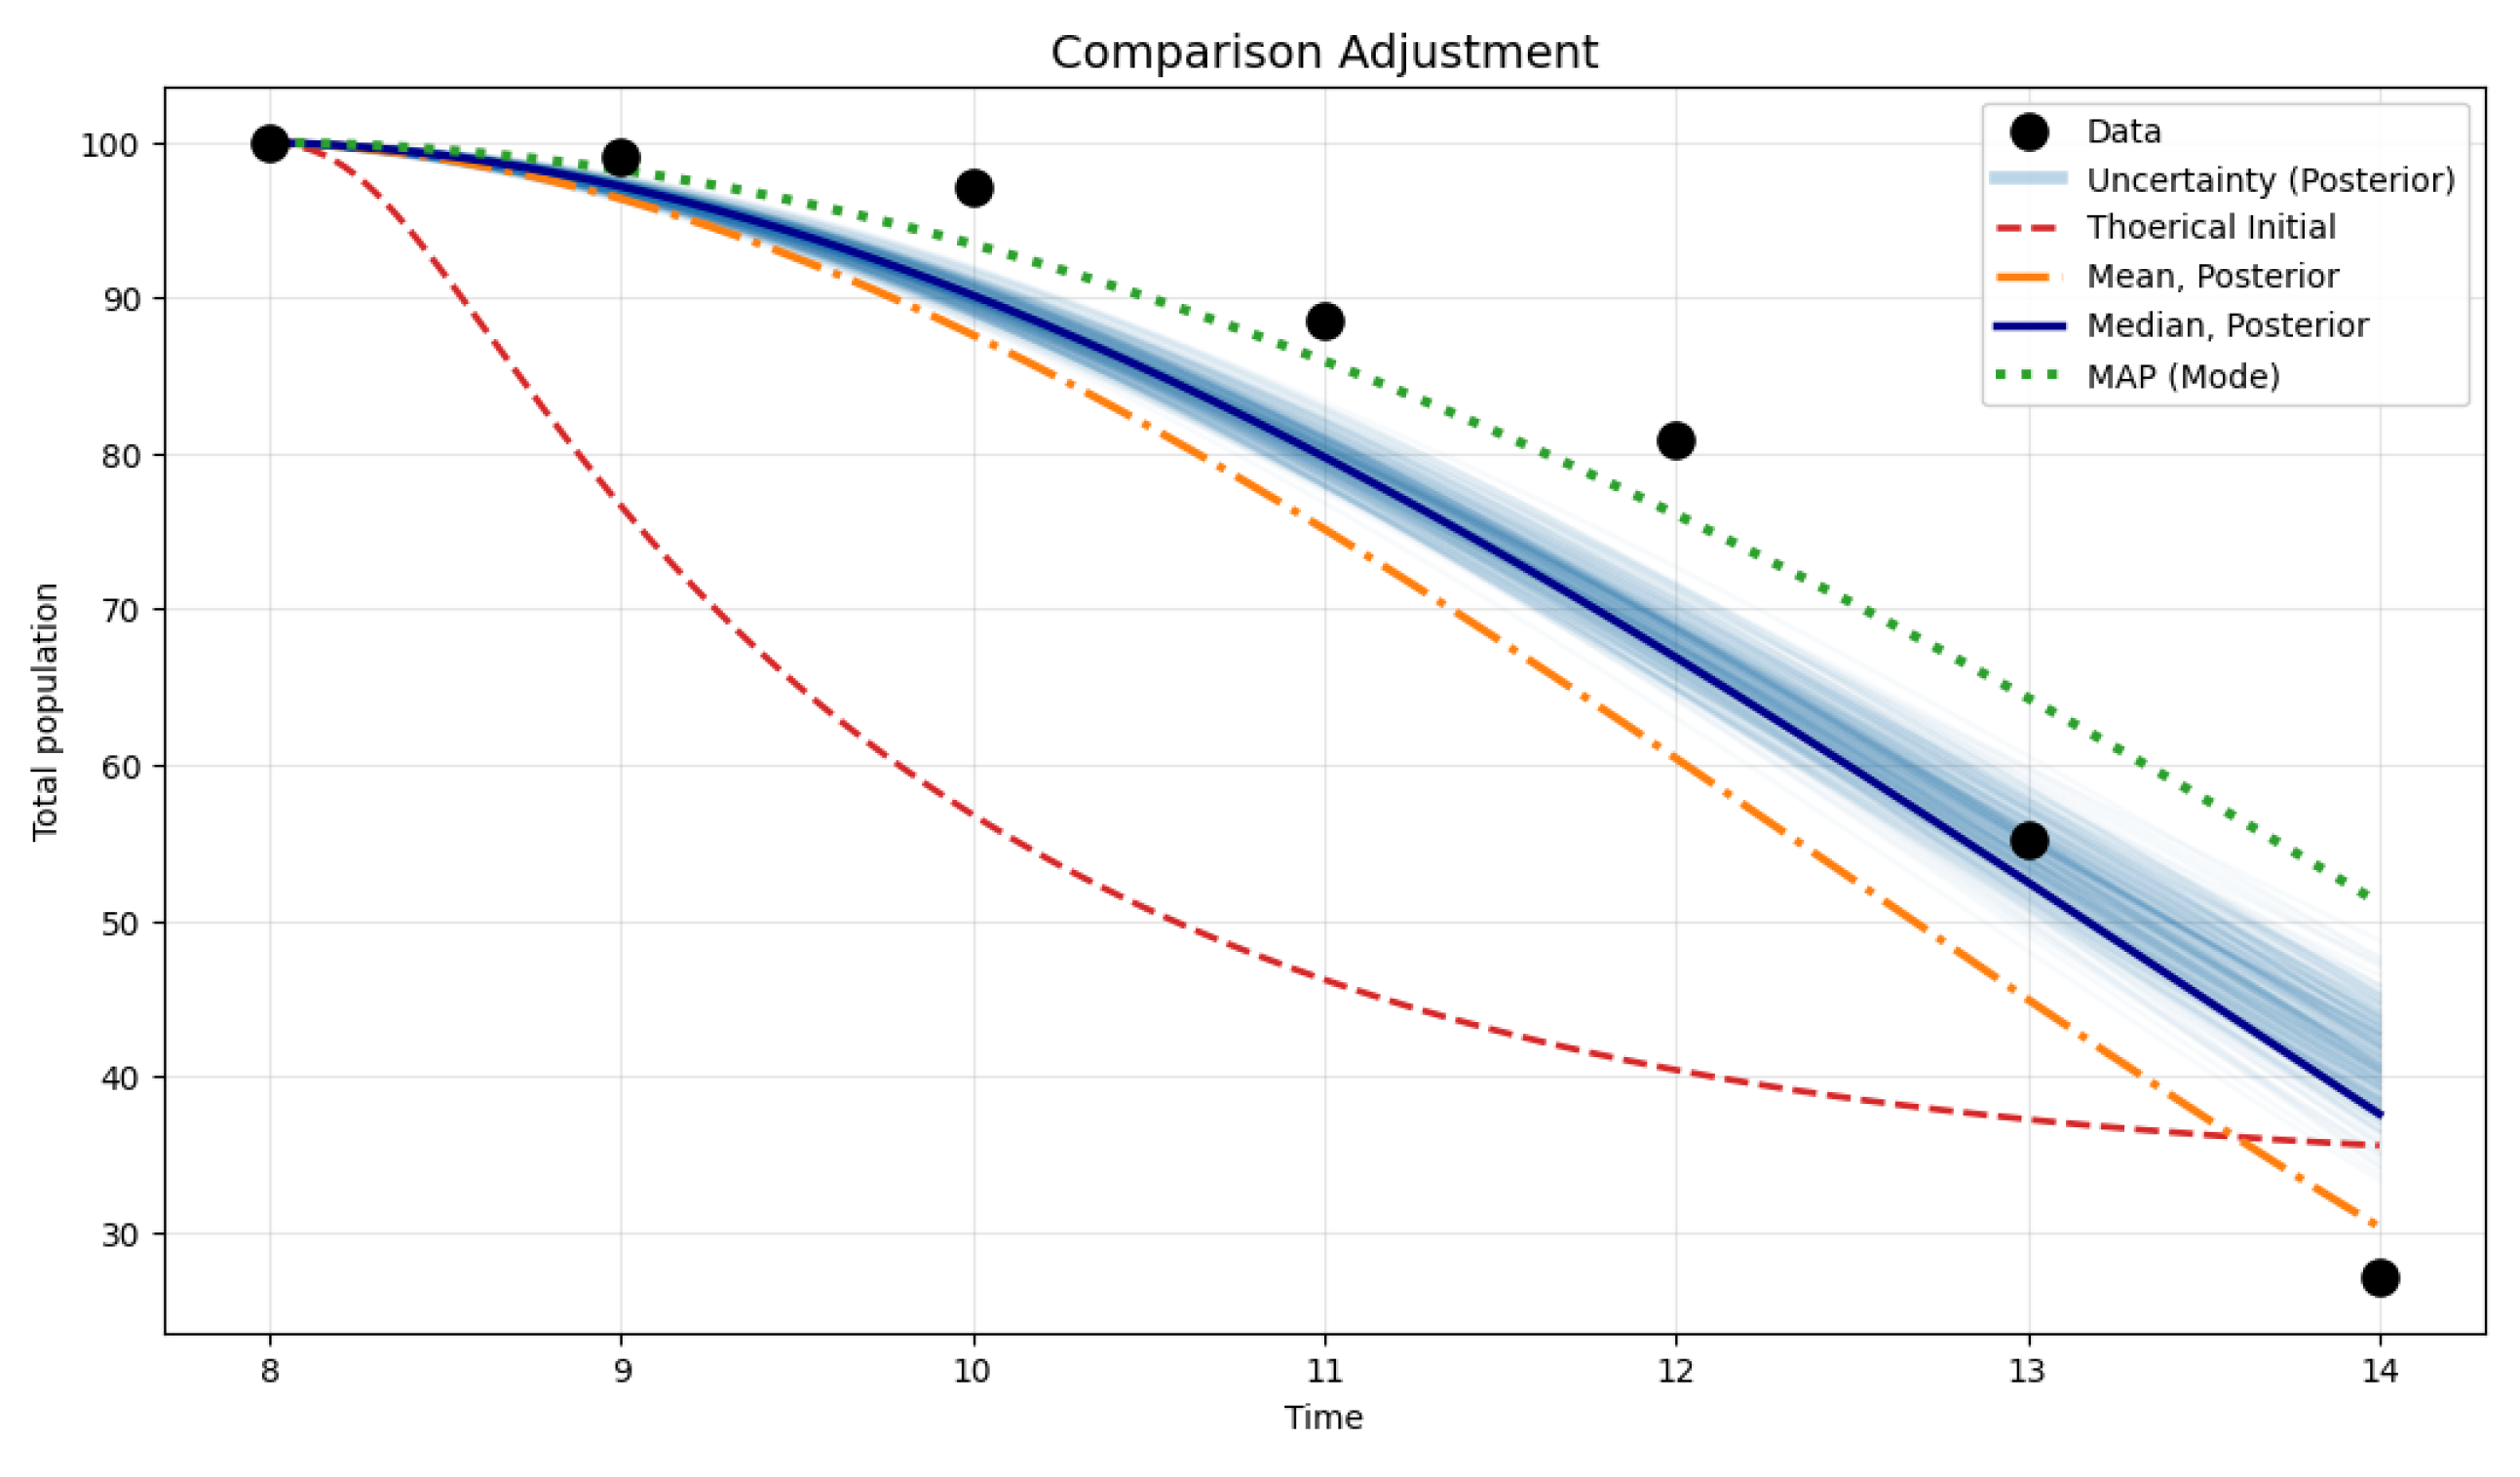
Figure 6.
Prior vs Posterior Distributions
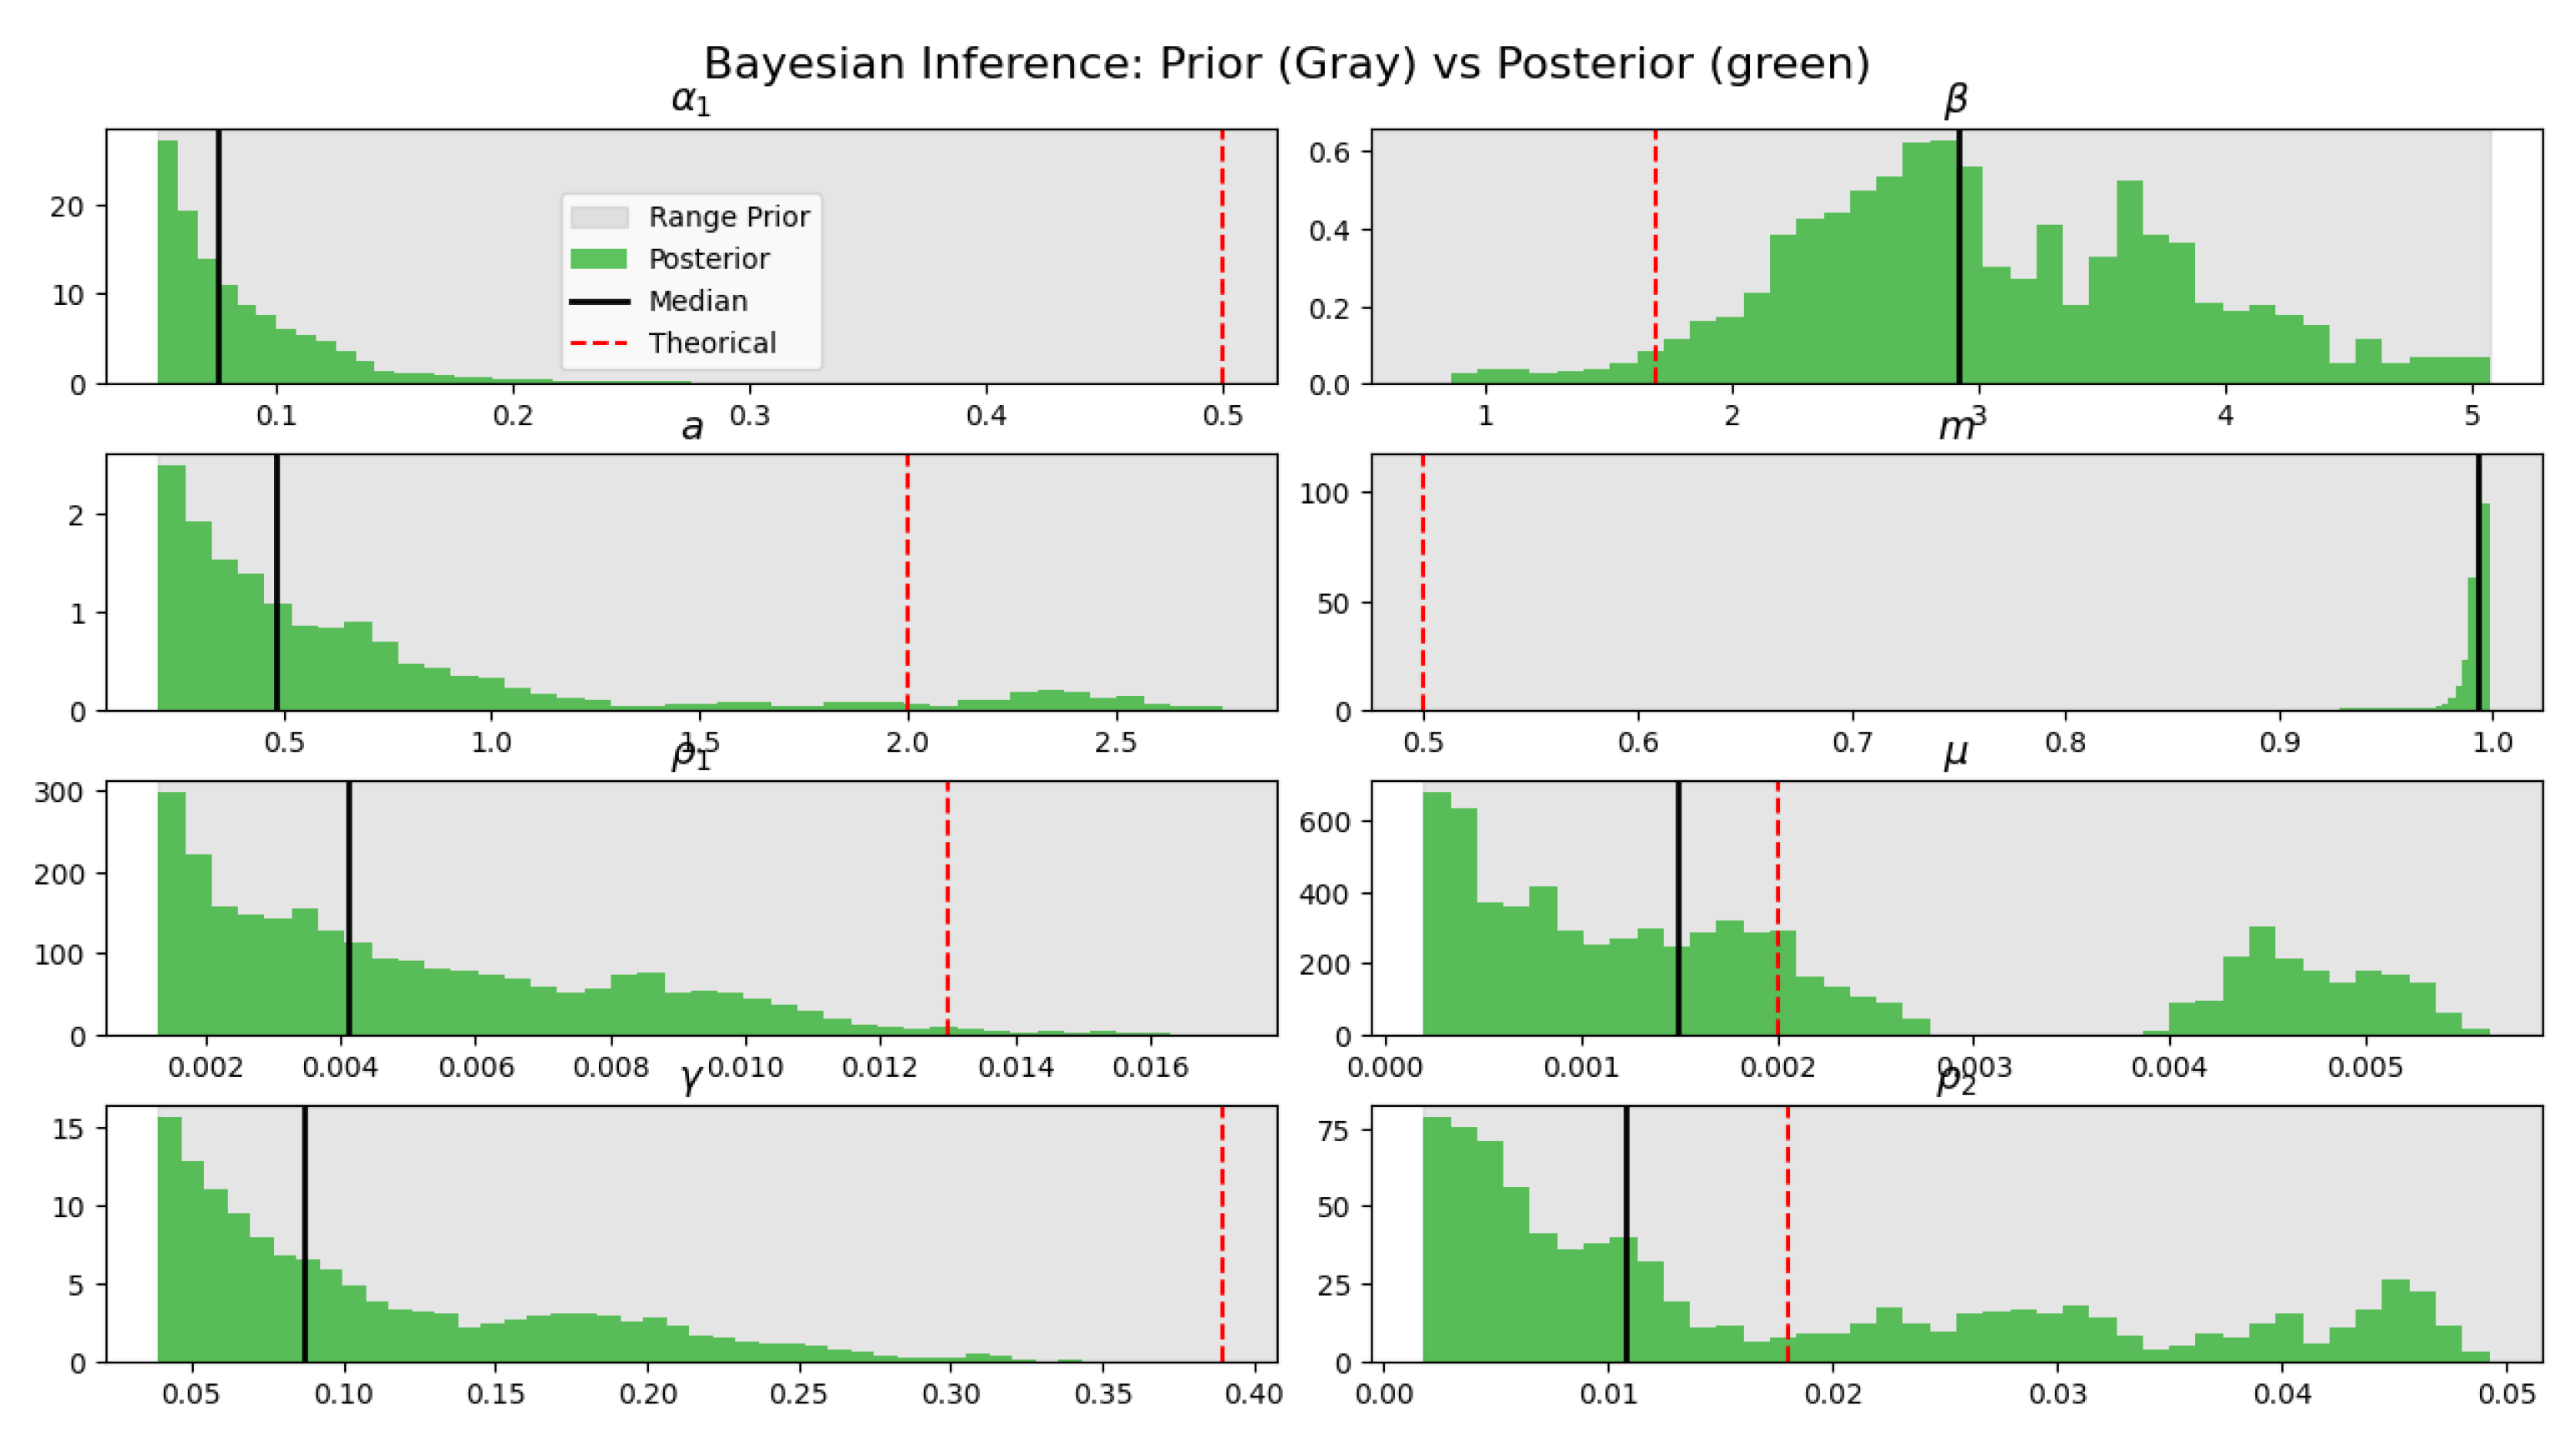
Figure 7.
Correlation matrix of parameters when the population is not fed.
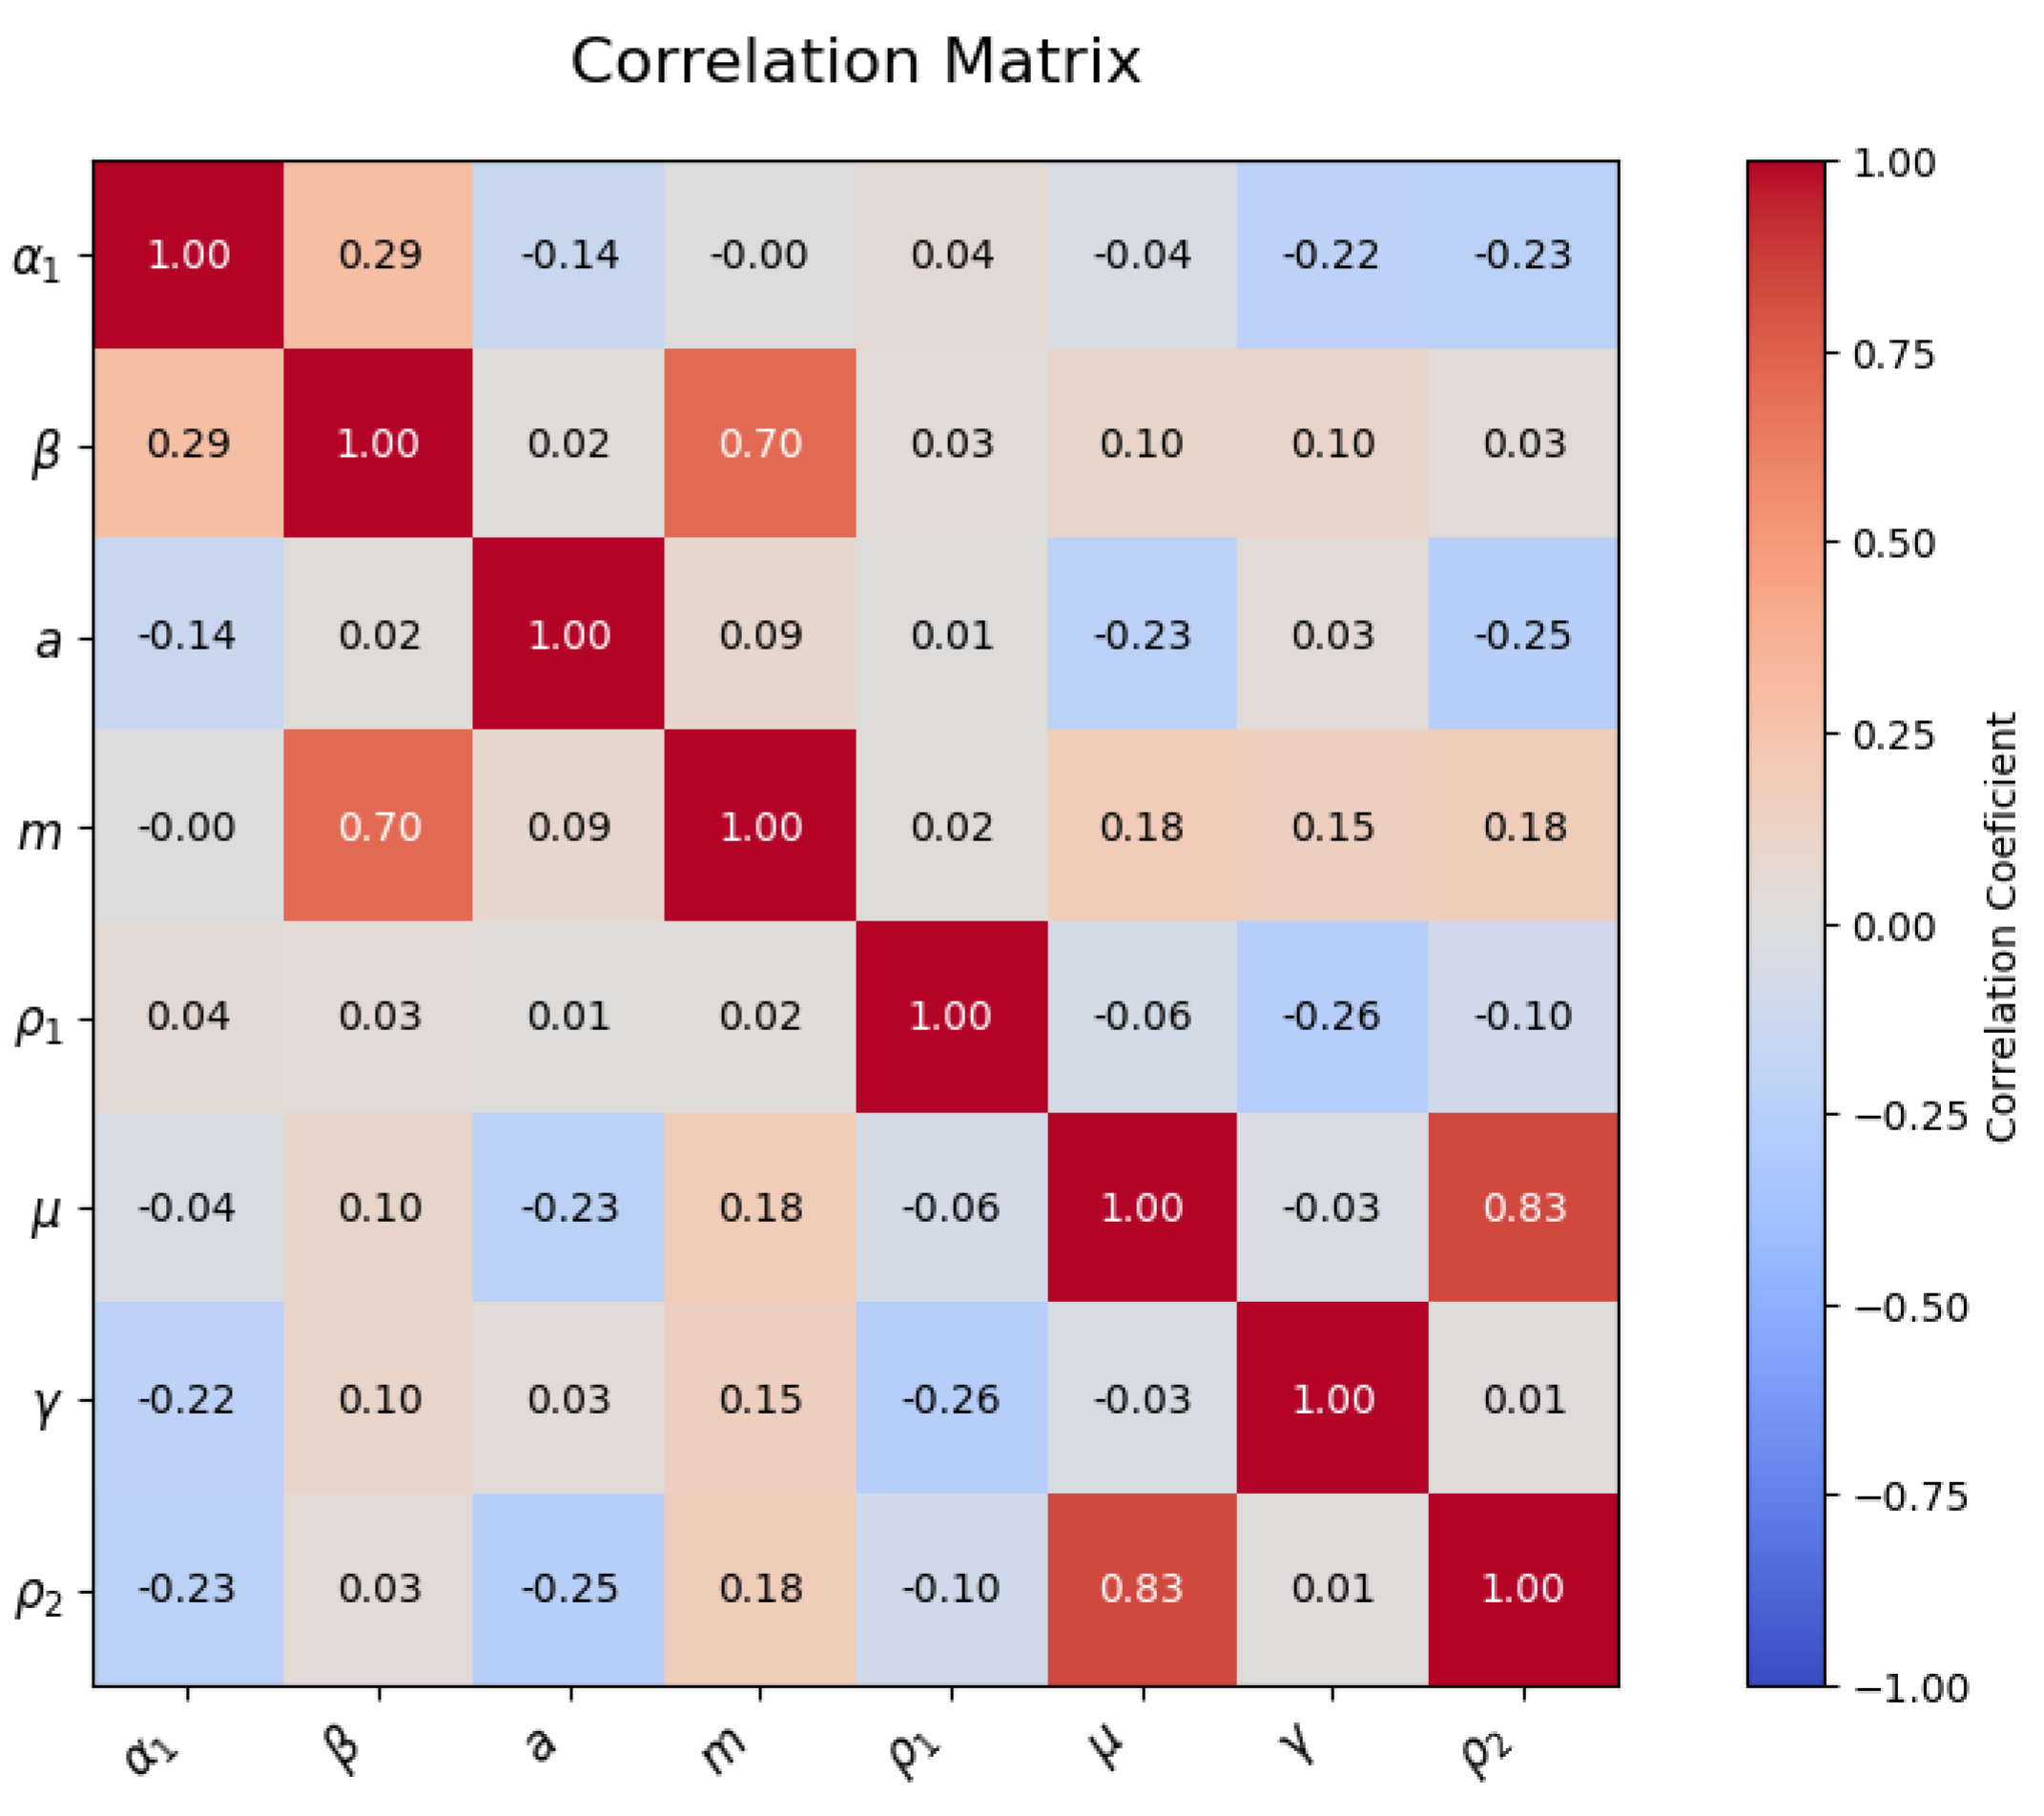

Table 1.
Population rate of larvae through time when they are fed. Getting from [25]
Table 1.
Population rate of larvae through time when they are fed. Getting from [25]
| Day | 8 | 9 | 10 | 11 | 12 | 13 | 14 |
|---|---|---|---|---|---|---|---|
| Population rate | 99.04 | 97.14 | 72.39 | 63.81 | 52.38 | 48.52 | 46.19 |
Table 2.
Approximated parameter values when the larvae is fed
| Parameter | Initial | Mean | Median | MAP (Mode) |
|---|---|---|---|---|
| 0.5000 | 0.3500 | 0.3157 | 0.2665 | |
| 1.6900 | 1.0040 | 0.9704 | 0.8708 | |
| a | 2.0000 | 1.9403 | 1.8854 | 1.1201 |
| m | 0.5000 | 0.6359 | 0.6647 | 0.7285 |
| 0.0130 | 0.0107 | 0.0098 | 0.0071 | |
| 0.0020 | 0.0020 | 0.0019 | 0.0014 | |
| 0.3900 | 0.2631 | 0.2410 | 0.2051 | |
| 0.0180 | 0.0158 | 0.0149 | 0.0105 |
Table 3.
Adjusted marginal distributions for the parameters. Case, fed larvae
| Parameter | Better Distribution |
|---|---|
| a | |
| m | |
Table 4.
Population rate of larvae through of time when they are not fed. Getting from [25]
Table 4.
Population rate of larvae through of time when they are not fed. Getting from [25]
| Day | 8 | 9 | 10 | 11 | 12 | 13 | 14 |
|---|---|---|---|---|---|---|---|
| Population rate | 100 | 99.04 | 97.14 | 88.57 | 80.95 | 55.23 | 27.14 |
Table 5.
Approximated parameter values when the larvae is not fed.
| Parameter | Theorical | Mean | Median | MAP |
|---|---|---|---|---|
| 0.5000 | 0.0812 | 0.0701 | 0.0544 | |
| 1.6900 | 1.7020 | 1.9081 | 2.0317 | |
| a | 2.0000 | 0.9270 | 0.5099 | 0.3219 |
| m | 0.5000 | 0.8711 | 0.9839 | 0.9838 |
| 0.0130 | 0.0053 | 0.0029 | 0.0019 | |
| 0.0020 | 0.0022 | 0.0015 | 0.0012 | |
| 0.3900 | 0.1398 | 0.1015 | 0.0525 | |
| 0.0180 | 0.0088 | 0.0074 | 0.0029 |
Table 6.
Adjusted marginal distribution for parameters, case: larvae not fed
| Parameter | Adjusted distribution |
|---|---|
| a | |
| m | |
Disclaimer/Publisher’s Note: The statements, opinions and data contained in all publications are solely those of the individual author(s) and contributor(s) and not of MDPI and/or the editor(s). MDPI and/or the editor(s) disclaim responsibility for any injury to people or property resulting from any ideas, methods, instructions or products referred to in the content. |
© 2026 by the authors. Licensee MDPI, Basel, Switzerland. This article is an open access article distributed under the terms and conditions of the Creative Commons Attribution (CC BY) license (http://creativecommons.org/licenses/by/4.0/).
Copyright: This open access article is published under a Creative Commons CC BY 4.0 license, which permit the free download, distribution, and reuse, provided that the author and preprint are cited in any reuse.