

Submitted:
15 September 2026
Posted:
16 September 2026
You are already at the latest version
Abstract
Background/Objectives: High-fat diet (HFD) feeding disrupts systemic metabolism and hypothalamic mechanisms that coordinate energy balance. Whether quercetin modifies the coordinated transcriptional systems linking m6A-related regulation with leptin-insulin and melanocortin biology remains unclear. We examined the metabolic and hypothalamic transcriptional response to quercetin during chronic HFD exposure. Methods: Male Wistar rats were studied for 16 weeks in a 2 × 2 factorial design: Control (n = 8), Control + quercetin (n = 5), HFD (n = 5), and HFD + quercetin (n = 6). Quercetin was administered orally at 100 mg/kg/day. Body weight, fasting glucose, oral glucose tolerance, visceral adiposity, serum lipids, and terminal tissue measures were evaluated. Hypothalamic expression of 21 transcripts spanning m6A regulation, leptin-insulin signaling, melanocortin-associated genes, and oxidative response was quantified by RT-qPCR. Gene-level inference was complemented by principal component analysis, PERMANOVA, module-level analyses, bootstrap resampling, leave-one-sample-out sensitivity testing, and treatment-adjusted gene-gene covariance. Results: At week 16, HFD + quercetin reduced glucose AUC relative to HFD by 2415 mg·min/dL (q = 0.0029), visceral fat by 5.16 g (q = 0.004), and triglycerides by 47.03 mg/dL (q < 0.001), without a corresponding difference in final body weight. Sixteen of 21 transcripts met the predefined robustness criteria for the HFD + quercetin versus HFD contrast. PC1 and PC2 captured 73.5% of transcriptional variance, and the four groups differed in global molecular structure (PERMANOVA R² = 0.628, p = 0.0001). All three predefined transcriptional modules showed robust HFD + quercetin versus HFD differences. Conclusions: Quercetin attenuated major metabolic consequences of HFD feeding and was accompanied by coordinated hypothalamic transcriptional remodeling across m6A-regulatory, leptin-insulin, and melanocortin-associated domains. These data identify a transcriptional network for mechanistic follow-up without implying direct measurement of m6A activity or pathway activation.
Keywords:
quercetin
; high-fat diet
; hypothalamus
; m6A
; FTO
; leptin signaling
; melanocortin system
; RT-qPCR
; metabolic dysfunction
; transcriptional network
1. Introduction
High-fat feeding alters metabolic regulation through peripheral and central mechanisms. The hypothalamus is particularly relevant because it integrates hormonal and nutrient-related signals that shape energy balance, glucose regulation, and feeding behavior [1,2]. Experimental exposure to high-fat diets promotes inflammatory responses within the hypothalamus and can impair central leptin and insulin responsiveness, particularly within the mediobasal hypothalamus and arcuate nucleus [2,3].
Leptin and insulin converge on intracellular systems that include IRS-PIK3R1-AKT-FOXO1 signaling, while SOCS3 participates in negative regulation of leptin action [4,5,6]. POMC and AGRP/NPY neurons respond to these metabolic cues and form a central component of the melanocortin system, in which MC4R contributes to downstream control of food intake and energy expenditure [7,8]. High-fat feeding can alter the transcription of appetite-related genes in the hypothalamus, including Lepr and neuropeptide-associated targets [9].
RNA N6-methyladenosine (m6A) adds another regulatory layer to metabolic gene control. The METTL3-METTL14 methyltransferase complex and associated proteins such as WTAP, RBM15/RBM15B, VIRMA, and ZC3H13 participate in m6A deposition; FTO and ALKBH5 remove the modification, whereas YTH-domain proteins recognize m6A-marked RNA and influence RNA fate [10]. Altered expression or activity of these regulators has been linked to glucose and lipid metabolism and to metabolic disease [10,11].
The relationship between m6A-associated regulation and hypothalamic metabolic control is becoming increasingly specific. In mice exposed to prolonged HFD feeding, hypothalamic FTO contributed to leptin resistance through an m6A-dependent CX3CL1 mechanism, and FTO deficiency in leptin-receptor-expressing neurons partially attenuated the phenotype [12]. This work provides experimental support for direct molecular coupling between an m6A regulator and hypothalamic leptin responsiveness under obesogenic conditions.
Quercetin has been investigated in experimental models of diet-induced metabolic dysfunction. In HFD-fed rats, quercetin reduced adipocyte hypertrophy and attenuated insulin resistance and inflammatory changes [13]. Other rodent studies have reported improved glucose tolerance and lower circulating triglyceride and cholesterol concentrations [14]. A central response has also been described: quercetin reduced hypothalamic inflammatory cytokines and microglial activation in HFD-fed obese mice [15].
From a human nutrition perspective, the metabolic relevance of quercetin remains of interest, although clinical evidence has been heterogeneous. Randomized controlled trials and meta-analyses in humans have generally not demonstrated consistent effects on body weight, fasting glucose, or insulin resistance, although modest improvements in selected cardiometabolic outcomes have been reported under specific doses, durations, or clinical conditions [41,42,43]. Importantly, a randomized controlled trial in overweight-to-obese individuals found no significant effects of quercetin supplementation on circulating leptin or several systemic metabolic markers [44]. This heterogeneity suggests that the metabolic effects of quercetin may not be adequately captured by anthropometric outcomes alone and raises the possibility that tissue-specific regulatory mechanisms contribute to inter-individual differences in response. In this context, experimental models can provide mechanistic information that cannot be readily obtained from nutritional intervention studies in humans, particularly regarding hypothalamic transcriptional regulation and its potential integration with m6A, leptin-insulin, and melanocortin signaling.
These observations raise the possibility that quercetin-associated metabolic improvement is accompanied by broader changes in hypothalamic transcription. The present study therefore examined male Wistar rats exposed to HFD with or without quercetin and evaluated both metabolic phenotype and a 21-gene hypothalamic panel spanning m6A regulation, leptin-insulin signaling, melanocortin-associated transcription, and oxidative response. The analysis was designed to test individual transcripts and coordinated transcriptional structure through multivariate, module-level, and treatment-adjusted covariance approaches.
2. Materials and Methods
2.1. Animals and Ethical Approval
Adult male Wistar rats were housed under controlled environmental conditions with free access to food and water. Experimental procedures followed institutional guidelines for the care and use of laboratory animals and were approved by the Bioethics Committee of the Escuela Nacional de Medicina y Homeopatía, Instituto Politécnico Nacional (approval no. CBE/005/2021). Animals entered the protocol at 8 weeks of age and were followed for 16 weeks.
2.2. Experimental Design and Quercetin Administration
The experiment used a 2 × 2 factorial design defined by diet (Control or HFD) and quercetin treatment (No or Yes). Final analytical group sizes were Control (n = 8), Control + quercetin (n = 5), HFD (n = 5), and HFD + quercetin (n = 6). Control animals received standard rodent diet (5001 formulation). The HFD condition consisted of a hypercaloric high-fat/high-carbohydrate formulation prepared from approximately 50% (w/w) powdered standard rodent chow, 20% vegetable shortening, 15% vegetable oil, and 15% corn syrup. Quercetin (≥95% purity by HPLC; Sigma-Aldrich, Q4951, St. Louis, MO, USA) was administered by oral gavage at 100 mg/kg/day throughout the intervention; non-quercetin groups received the corresponding vehicle. The experimental timeline and molecular panel are summarized in Figure 1.
2.3. Longitudinal Metabolic Phenotyping and Oral Glucose Tolerance Testing
Body weight and fasting blood glucose were recorded longitudinally from baseline to week 16. Naso-anal length was measured for calculation of the Lee index. OGTTs were performed at baseline and at weeks 8 and 16. After a 12 h overnight fast, glucose was administered orally at 2 g/kg body weight. Tail-blood glucose was measured immediately before the glucose load (0 min) and at 30, 60, 90, and 120 min. Total area under the curve (AUC) and incremental AUC (iAUC) were calculated from the serial glucose measurements.
2.4. Terminal Tissue Collection and Lipid Measurements
At week 16, animals were deeply anesthetized with sodium pentobarbital (150 mg/kg, intraperitoneally) and euthanized by exsanguination after loss of consciousness. Visceral adipose tissue, whole brain, and hypothalamic tissue were collected and weighed. Blood was obtained for terminal biochemical assessment. Total cholesterol, triglycerides, and high-density lipoprotein cholesterol (HDL-C) were measured using the Mission® Cholesterol Meter system with the corresponding lipid panel. Low-density lipoprotein cholesterol (LDL-C) was obtained from the value calculated by the same lipid-analysis system. Concentrations are reported in mg/dL.
2.5. Hypothalamic RNA Isolation and cDNA Synthesis
Hypothalamic tissue was dissected immediately after brain removal, rapidly frozen, and stored at −80 °C until molecular analysis. Total RNA was isolated from individual samples using TRIzol™ Reagent (Invitrogen, Thermo Fisher Scientific) by phenol-chloroform extraction. Tissue was homogenized in TRIzol, followed by chloroform-induced phase separation, recovery of the aqueous phase, isopropanol precipitation, washing with 75% ethanol, and resuspension in RNase-free water. RNA concentration and purity were determined using a NanoDrop™ 2000 spectrophotometer (Thermo Fisher Scientific). Complementary DNA was synthesized from total RNA using M-MLV Reverse Transcriptase (Invitrogen, Thermo Fisher Scientific, Waltham, MA, USA) according to the manufacturer’s instructions.
2.6. Quantitative Real-Time PCR and Transcriptional Panel
Quantitative real-time PCR was performed using a Rotor-Gene Q system (QIAGEN) with SYBR Green qPCR Master Mix (No ROX; MedChemExpress, HY-K0523). Reactions were prepared in a final volume of 10 µL using gene-specific forward and reverse primers and cDNA as template. No-template controls were included for each primer pair. Amplification used assay-specific conditions; primer sequences, NCBI RefSeq accessions, and assay-specific annealing temperatures are provided in Appendix A, Table A1. Relative transcript abundance was normalized to β-actin (ACTB) and calculated by the comparative 2−ΔΔCt method using the Control group as the calibrator. Statistical modeling used log2(2−ΔΔCt), which provides a symmetric scale for increases and decreases in relative transcript abundance.
The 21-target panel comprised FTO, ALKBH5, METTL3, METTL14, WTAP, RBM15, RBM15B, VIRMA, ZC3H13, and YTHDC1 for m6A-associated regulation; LEPR, IRS1, a PIK3R1-related assay target, AKT2, SOCS3, and FOXO1 for metabolic signaling; POMC, NPY, AGRP, and MC4R for melanocortin-associated transcription; and SOD2 as an oxidative-response transcript. Molecular results are interpreted as differences in mRNA abundance and not as direct measurements of protein abundance, enzymatic activity, pathway activation, or global m6A levels.
2.7. Statistical Analysis
The statistical analysis followed the 2 × 2 factorial design, with diet and quercetin as the main factors. The diet × quercetin interaction tested whether the association with quercetin differed according to dietary condition. Prespecified contrasts were HFD versus Control, HFD + quercetin versus HFD, and Control + quercetin versus Control.
Longitudinal phenotypic variables were analyzed using repeated-measures models that included diet, quercetin, time, and their interactions. An autoregressive first-order correlation structure was used when supported by model convergence. OGTT-derived AUC and iAUC were analyzed across baseline, week 8, and week 16. Week-16 AUC and iAUC were additionally evaluated by ANCOVA using the corresponding baseline measurement as covariate, and the complete week-16 glucose response was modeled across the five sampling times.
Terminal phenotypic outcomes and individual qPCR measurements were evaluated using factorial linear models. Heteroscedasticity-consistent HC3 standard errors were used for linear-model inference because final group sizes were modest and unequal. Multiplicity across the 21-gene panel was controlled using the Benjamini-Hochberg false-discovery-rate procedure; adjusted probabilities are reported as q values.
To characterize transcription beyond individual targets, the 21-gene matrix was standardized gene-wise and analyzed by unsupervised principal component analysis (PCA). Global group differences were assessed by PERMANOVA on Euclidean distances with 9999 permutations. Because the factorial design was unbalanced, sequential models were evaluated with both factor orders and the diet × quercetin component was also examined in a marginal framework. Homogeneity of multivariate dispersion was tested for the four-group factor and the two main factors.
Three predefined transcriptional modules were analyzed: m6A-regulatory, leptin-insulin signaling, and melanocortin-related. Within each module, the first principal component (PC1) was used as a composite score for the dominant axis of transcriptional covariation. Gene standardization, PCA, and loadings were recalculated within stratified bootstrap resampling (10,000 iterations), and leave-one-sample-out analyses were used to assess stability.
Treatment-adjusted gene-gene covariance was evaluated for all 210 possible transcript pairs after centering expression within experimental group. Pearson correlations were complemented by rank-based sensitivity analysis, FDR correction, leave-one-sample-out assessment, and 10,000-iteration bootstrap resampling. Network edges represent residual co-variation and were not interpreted as evidence of regulatory direction or causality. Analyses were performed in R version 4.6.1 (R Foundation for Statistical Computing, Vienna, Austria). All tests were two-sided; q < 0.05 was used where multiplicity correction applied.
3. Results
3.1. Longitudinal Body Weight and Fasting Glucose
Body weight increased throughout the 16-week intervention in all four groups and showed the expected deceleration over time. A quadratic week term was strongly supported (F = 319.35, p < 0.001), whereas the diet × quercetin interaction did not materially modify the longitudinal weight trajectory. Absolute and percentage weight gain likewise showed substantial overlap among groups (Figure 2A-C).
Fasting glucose displayed a different longitudinal pattern. The diet × time component was significant after multiplicity adjustment (q < 0.001), whereas the three-way diet × quercetin × time interaction was not (q = 0.448). At week 16, fasting glucose was 27.22 mg/dL higher in HFD than in Control animals (q < 0.001). HFD + quercetin showed a mean difference of −6.10 mg/dL relative to HFD alone, which did not remain significant after adjustment (q = 0.222) (Figure 2D).
3.2. Glucose Tolerance and Terminal Metabolic Phenotype
OGTT responses diverged progressively during the intervention (Figure 3A-C). At week 8, baseline-adjusted AUC was 3201 mg·min/dL higher in HFD than in Control animals (q = 0.0023); the HFD + quercetin versus HFD contrast was not significant at this time point (q = 0.237). By week 16, the HFD-Control difference had increased to 6115 mg·min/dL (95% CI, 4884 to 7345; q < 0.001). In HFD-fed animals, quercetin was associated with an AUC reduction of 2415 mg·min/dL (95% CI, −3819 to −1011; q = 0.0029), and the diet × quercetin interaction for week-16 AUC was −2483 mg·min/dL (q = 0.0126).
The incremental response showed a compatible pattern. Week-16 iAUC was 2571 mg·min/dL higher in HFD than in Control animals (95% CI, 1360 to 3781; q < 0.001), whereas HFD + quercetin showed an iAUC reduction of 1320 mg·min/dL relative to HFD (95% CI, −2511 to −130; q = 0.047). Longitudinal AUC trajectories are shown in Figure 3D.
Terminal adiposity and triglycerides provided the clearest non-glycemic metabolic contrasts (Figure 3E-H; Table 1). HFD increased visceral fat by 8.27 g relative to Control (q < 0.001) and by 1.79 percentage points when expressed relative to body weight (q < 0.001). HFD + quercetin was lower than HFD by 5.16 g (95% CI, −7.37 to −3.05; q = 0.004) and 1.08 percentage points (95% CI, −1.59 to −0.57; q = 0.006), respectively. Triglycerides were 69.39 mg/dL higher in HFD than in Control (q < 0.001) and 47.03 mg/dL lower in HFD + quercetin than in HFD (95% CI, −60.65 to −34.34; q < 0.001). Total cholesterol was lower in HFD + quercetin than in HFD by 13.01 mg/dL, but this contrast did not remain significant after FDR correction (q = 0.118). No HFD + quercetin versus HFD differences were detected for HDL-C, LDL-C, brain weight, hypothalamus weight, or final body weight.
3.3. Global Hypothalamic Transcriptional Structure
Analysis of the complete 21-gene panel revealed a marked separation in global hypothalamic transcriptional structure among the experimental groups (Figure 4). PC1 accounted for 52.9% of standardized expression variance and PC2 for 20.6%, capturing 73.5% of total variance together. HFD samples were displaced along PC1, whereas HFD + quercetin occupied a region distinct from HFD and closer to the non-HFD groups.
A four-group PERMANOVA confirmed differences in multivariate transcriptional structure (R2 = 0.628, p = 0.0001). Multivariate dispersion did not differ significantly across the four groups (p = 0.0614), supporting interpretation of the omnibus group effect. In the factorial model, the diet × quercetin component accounted for 28.7% of multivariate variation (R2 = 0.287, p = 0.0001). Dispersion differed when samples were grouped by diet alone (p = 0.0002); the isolated main diet effect was therefore interpreted cautiously.
The heatmap provided a complementary representation of this structure. HFD animals showed coordinated differences across m6A-regulatory, leptin-insulin, melanocortin-associated, and oxidative-response transcripts, while HFD + quercetin displayed a distinct cross-domain expression pattern (Figure 4B).
3.4. Gene-Level Hypothalamic Transcriptional Response
Gene-level analysis showed that the global separation was accompanied by broad transcript-specific differences (Table 2). Fifteen of 21 transcripts met the predefined robustness criteria for the diet × quercetin interaction, and 16 of 21 did so for the HFD + quercetin versus HFD contrast. Robustness classification incorporated HC3 inference, Benjamini-Hochberg correction, 10,000-iteration stratified bootstrap resampling, and leave-one-sample-out sensitivity analysis.
Within the m6A-regulatory group, HFD + quercetin differed most strongly from HFD for FTO, which was lower by 4.39 log2 units (95% bootstrap CI, −4.78 to −4.04; q < 0.001). METTL14 (+3.64 [3.01, 4.21]), METTL3 (+1.78 [1.18, 2.21]), RBM15B (+1.66 [1.23, 2.06]), and WTAP (+1.73 [0.68, 2.89]) were higher, with q < 0.001 for the first three and q = 0.031 for WTAP. ALKBH5, RBM15, VIRMA, YTHDC1, and ZC3H13 did not show robust HFD + quercetin versus HFD differences.
A comparably broad response occurred among metabolic-signaling transcripts. Relative to HFD, HFD + quercetin showed higher LEPR (+1.77 log2 units), IRS1 (+1.39), the PIK3R1-related target (+1.86), and AKT2 (+0.75), all with q < 0.001. FOXO1 (−1.38) and SOCS3 (−0.91) were lower (both q < 0.001). POMC showed one of the largest positive contrasts (+3.13 [2.23, 3.79], q < 0.001); AGRP (+1.84, q < 0.001), MC4R (+1.55, q = 0.002), NPY (+0.29, q = 0.023), and SOD2 (+1.07, q < 0.001) were also higher in HFD + quercetin than in HFD.
3.5. Coordinated Module-Level Transcriptional Response
To determine whether gene-level effects extended to coordinated transcriptional patterns, three predefined molecular modules were analyzed separately (Figure 5A-C). PC1 accounted for 47.0% of variance within the m6A-regulatory module, 69.9% within the leptin-insulin module, and 73.1% within the melanocortin-related module.
All three modules showed evidence of a diet × quercetin interaction that remained robust under nested sensitivity analysis. Interaction estimates were 4.33 (95% bootstrap interval, 1.55 to 6.84; q = 0.028) for the m6A-regulatory module, 5.97 (4.69 to 6.92; q < 0.001) for the leptin-insulin module, and 4.90 (3.44 to 6.19; q < 0.001) for the melanocortin-related module. The HFD + quercetin versus HFD contrasts were 3.89 (0.97 to 5.89; q = 0.005), 4.59 (3.52 to 5.25; q < 0.001), and 3.22 (2.18 to 4.09; q < 0.001), respectively. Module scores summarize dominant transcriptional covariation and are not measures of pathway activation.
3.6. Robust Cross-Family Transcriptional Covariation
Treatment-adjusted covariance was then evaluated across the 210 possible transcript pairs. Seventy associations met the predefined criteria for robust covariation, 46 were classified as moderate, and 94 as unstable. Forty-two robust associations connected transcripts assigned to different molecular families (Figure 5D).
Among the strongest cross-family associations, AGRP and the PIK3R1-related target showed an adjusted Pearson correlation of r = 0.91 (q < 0.001; bootstrap interval, 0.70 to 0.97). Strong residual covariation was also observed for METTL3-PIK3R1 (r = 0.87), METTL3-AGRP (r = 0.86), MC4R-SOD2 (r = 0.86), METTL3-MC4R (r = 0.84), and POMC-PIK3R1 (r = 0.82). The direction of these associations was retained in rank-based and resampling analyses. The network therefore represents reproducible residual co-variation after removal of experimental-group means; it does not establish regulatory direction, direct molecular interaction, or causality.
Figure 5.
Coordinated hypothalamic transcriptional response and robust cross-family covariation. (A) m6A-regulatory module PC1. (B) Leptin-insulin module PC1. (C) Melanocortin-related module PC1. Individual observations, group distributions, and means are shown. (D) Network of 42 robust treatment-adjusted cross-family associations. Nodes are grouped by molecular domain; edges denote associations that remained robust across Pearson, rank-based, FDR, leave-one-sample-out, and bootstrap analyses. Network edges are undirected and do not imply causal regulation.
Figure 5.
Coordinated hypothalamic transcriptional response and robust cross-family covariation. (A) m6A-regulatory module PC1. (B) Leptin-insulin module PC1. (C) Melanocortin-related module PC1. Individual observations, group distributions, and means are shown. (D) Network of 42 robust treatment-adjusted cross-family associations. Nodes are grouped by molecular domain; edges denote associations that remained robust across Pearson, rank-based, FDR, leave-one-sample-out, and bootstrap analyses. Network edges are undirected and do not imply causal regulation.
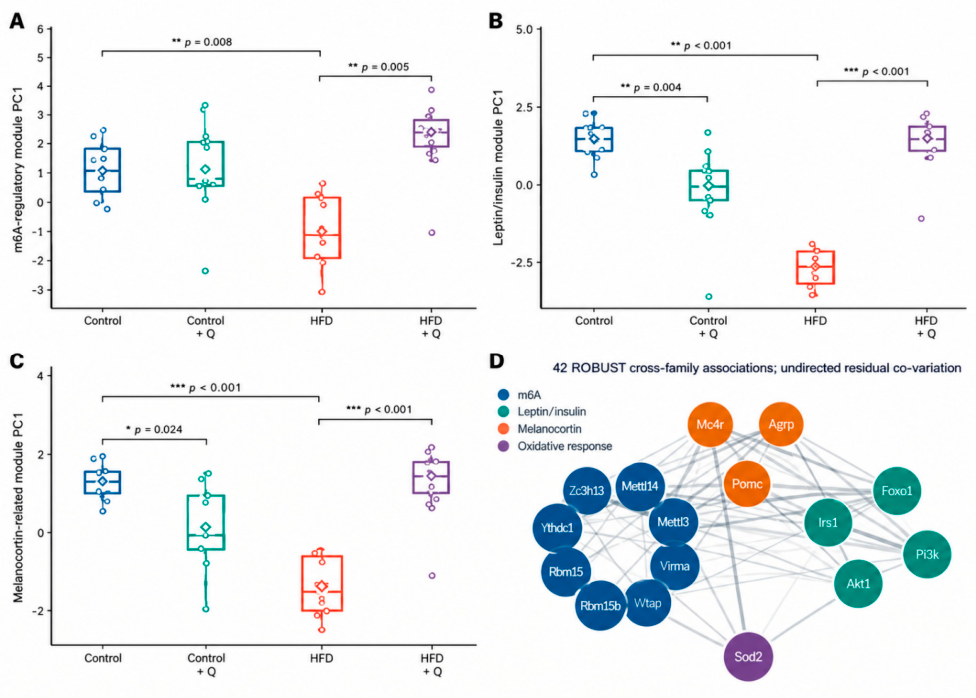

Table 3.
Multilevel robustness of the hypothalamic molecular findings.
| Level | Endpoint | Test | Estimate | p/q | Note |
| Global molecular profile | PC1 + PC2 | Variance explained | 73.5% | PC1 52.9%; PC2 20.6% | |
| Global molecular profile | Four experimental groups | PERMANOVA omnibus | R2 = 0.628 | <0.001 | Dispersion p = 0.061 |
| Global molecular profile | Diet × Quercetin | PERMANOVA component | R2 = 0.287 | <0.001 | Diet-only dispersion p = <0.001; interpret diet main effect cautiously. |
| Nested module | m6A-regulatory | Diet × Quercetin | 4.33 [1.55, 6.84] | 0.028 | ROBUST |
| Nested module | Leptin-insulin signaling | Diet × Quercetin | 5.97 [4.69, 6.92] | <0.001 | ROBUST |
| Nested module | Melanocortin-related | Diet × Quercetin | 4.90 [3.44, 6.19] | <0.001 | ROBUST |
| Nested module | m6A-regulatory | HFD + Q vs HFD | 3.89 [0.97, 5.89] | 0.005 | ROBUST |
| Nested module | Leptin-insulin signaling | HFD + Q vs HFD | 4.59 [3.52, 5.25] | <0.001 | ROBUST |
| Nested module | Melanocortin-related | HFD + Q vs HFD | 3.22 [2.18, 4.09] | <0.001 | ROBUST |
| Network | All adjusted gene-gene associations | Sensitivity classification | 70/210 ROBUST | Adjusted Pearson + rank sensitivity + bootstrap + LOO | |
| Network | Cross-family associations | ROBUST residual co-variation | 42 edges | Undirected associations; no causal interpretation |
Module estimates correspond to first-principal-component transcriptional scores. Confidence intervals derive from nested bootstrap analyses in which gene standardization, PCA, and component loadings were recalculated within each iteration. Q, quercetin; HFD, high-fat diet; PCA, principal component analysis; PERMANOVA, permutational multivariate analysis of variance.
4. Discussion
The principal finding of this study is that quercetin exposure under HFD conditions was associated with broad reorganization of hypothalamic transcription rather than isolated shifts in a small number of metabolic genes. Sixteen of the 21 transcripts differed robustly between HFD + quercetin and HFD animals, spanning m6A-regulatory, leptin-insulin, melanocortin-associated, and oxidative-response domains. This gene-level pattern was supported by the global PCA/PERMANOVA structure, by robust differences in all three predefined transcriptional modules, and by cross-family residual covariance. The molecular response occurred alongside improved glucose tolerance, lower visceral adiposity, and lower triglycerides without a major difference in final body weight. Prior experimental work has independently linked quercetin to metabolic improvement and hypothalamic responses, while HFD-associated FTO signaling provides a mechanistic bridge between m6A regulation and central leptin resistance [12,13,14,15].
The dissociation between final body weight and metabolic improvement is biologically informative. Quercetin-treated HFD animals had lower visceral adiposity, triglycerides, and OGTT responses even though terminal body weight remained comparable with untreated HFD animals. Quercetin has produced similar patterns in rodent models, including reductions in adiposity, dyslipidemia, glucose intolerance, adipose inflammation, or insulin resistance without a uniform requirement for large weight loss [13,14,16,17,18,19]. Kábelová et al. also showed that metabolic improvement with quercetin can coexist with extensive transcriptional remodeling in metabolically active tissues, supporting the broader concept that quercetin-responsive phenotypes may reflect tissue-level regulatory changes rather than simple reduction in body mass [16].
The hypothalamic response extends this metabolic phenotype into a central tissue that integrates nutrient and endocrine information. Quercetin has previously reduced HFD-associated hypothalamic inflammatory cytokines and microglial activation [15]. Orally administered quercetin and methylated derivatives have also been detected in perfused rat brain tissue, demonstrating that quercetin-derived compounds can reach the central nervous system under experimental conditions [20]. The present data do not resolve whether the transcriptional response originated from direct exposure of hypothalamic cells, circulating metabolites, or systemic signals generated by improved peripheral metabolism. They do establish that the hypothalamic transcriptional state is a component of the response observed under HFD plus quercetin [15,20].
Within the molecular panel, the marked reduction in FTO expression in HFD + quercetin animals deserves specific consideration. Manipulation of hypothalamic FTO has long been known to influence feeding behavior, and more recent work has connected hypothalamic FTO to leptin responsiveness and HFD-induced metabolic dysfunction [12,21,22]. Inhibition of hypothalamic FTO can enhance ERK1/2-STAT3 signaling and reduce food intake and body weight, while selective loss of FTO in leptin-receptor-expressing neurons partially attenuates HFD-induced leptin resistance [12,22]. The pronounced FTO contrast in the present study therefore identifies a plausible transcriptional point of convergence between nutritional exposure, m6A-associated regulation, and leptin biology. It should not be interpreted as evidence that global hypothalamic m6A abundance increased, because expression of a demethylase does not determine transcript-specific methylation stoichiometry or reader engagement [12,21,22].
The accompanying METTL3 and METTL14 responses place the current results within a rapidly developing area of hypothalamic epitranscriptomics. Li et al. demonstrated that POMC-neuron METTL14, YTHDC1, and YTHDF2 are required for normal energy balance and identified an m6A-dependent METTL14/YTHDC1/POMC axis; METTL14 overexpression in POMC neurons protected against diet-induced obesity [23]. Shen et al. independently showed that loss of METTL14 during hypothalamic development impairs generation of feeding-related neurons and produces adult obesity and altered glucose-insulin homeostasis, with related phenotypes after disruption of METTL3 or YTHDC1 [24]. The concurrent increase in METTL14, METTL3, and POMC in HFD + quercetin animals is therefore mechanistically interesting. Our experiment does not establish that quercetin altered methylation of POMC or another specific RNA, but it identifies a coordinated transcriptional configuration that is directly testable with transcript-specific m6A methods [23,24].
Tissue context is essential when interpreting m6A-regulatory genes. METTL14 is not uniformly metabolically beneficial across organs. Adipocyte METTL14 can suppress beta-adrenergic signaling and lipolysis, promoting HFD-associated obesity and insulin resistance, whereas hepatic METTL14 can increase m6A-dependent G6pc biosynthesis and hepatic glucose production [25,26]. These effects differ from the protective role reported in hypothalamic POMC neurons [23,24]. The contrast illustrates why the present whole-hypothalamus data should be interpreted as transcriptional remodeling of m6A-associated machinery rather than a global change in m6A activity with a predetermined metabolic direction [23,24,25,26].
The leptin-insulin component provides a second coherent layer of the transcriptional response. HFD + quercetin animals showed higher LEPR, IRS1, PIK3R1-related target, and AKT2 expression together with lower SOCS3 and FOXO1 relative to HFD. Region-specific leptin resistance is a characteristic feature of diet-induced obesity, and SOCS3 contributes directly to this process: neural Socs3 deficiency enhances leptin sensitivity, whereas increased SOCS3 within AgRP neurons can participate in the early development of HFD-associated cellular leptin resistance [27,28,29]. Hypothalamic FTO has also been linked to SOCS3 and impaired leptin-STAT3 signaling under HFD conditions [12]. The lower SOCS3 and higher LEPR expression observed with quercetin therefore fit a biologically coherent transcriptional context, while remaining distinct from direct evidence of improved receptor signaling [12,27,28,29].
The IRS-PIK3R1-AKT-FOXO1 pattern is similarly compatible with altered central metabolic signaling, but transcript abundance and signaling activity must remain conceptually separate. Chronic HFD can impair leptin responsiveness and change the electrophysiological behavior of POMC neurons [30]. PIK3R1 signaling is required for key acute actions of leptin in POMC neurons and contributes to hypothalamic control of energy expenditure [31,32]. FOXO1 integrates insulin and leptin-related signals and regulates appetite-associated transcription; experimental manipulation of hypothalamic or POMC-neuron FOXO1 changes food intake, body weight, and neuropeptide regulation [33,34,35]. Thus, higher IRS1, PIK3R1-related target, and AKT2 together with lower FOXO1 define a transcriptional state compatible with altered leptin-insulin responsiveness, but phosphorylation of AKT, FOXO1, STAT3, or the leptin receptor was not measured [30,31,32,33,34,35].
The melanocortin-associated findings argue against reducing the response to a simple anorexigenic-versus-orexigenic switch. POMC and MC4R were substantially higher in HFD + quercetin than in HFD, yet AGRP and NPY also increased. Dietary composition, inflammatory state, and duration of HFD exposure can change the direction and functional meaning of hypothalamic neuropeptide responses [30,36,37]. Recent cell-specific work adds another layer: FTO in AgRP neurons regulates Kif1a splicing, axonal vesicle trafficking, and secretion of NPY/AgRP-containing dense-core vesicles, demonstrating that transcript abundance and neuropeptide output need not move in parallel [38]. The present pattern is therefore better described as remodeling of melanocortin-associated transcription than as restoration of a fixed anorexigenic/orexigenic balance [30,36,37,38].
The multilevel analysis strengthens the interpretation that quercetin-associated molecular change was coordinated. The global expression structure, three predefined modules, and residual cross-family network converge on a distributed transcriptional response rather than dependence on FTO, POMC, or any single target. Experimental studies now provide direct mechanistic links for selected connections represented within these domains, including FTO with leptin resistance, METTL14/YTHDC1 with POMC regulation, and FTO-dependent regulation of AgRP-neuron vesicle trafficking [12,23,24,38]. Our network does not reproduce those mechanisms directly; it maps treatment-adjusted transcriptional co-variation that can be used to prioritize mechanistic experiments [12,23,24,38].
The origin of the hypothalamic transcriptional response may involve both central and systemic routes. Brain exposure to quercetin-derived compounds has been demonstrated experimentally [20], but peripheral mechanisms can also generate signals capable of changing central metabolic state. In mice, quercetin reshaped gut microbiota and bile-acid composition, increasing non-12-hydroxylated bile acids and TGR5-dependent thermogenic responses; fecal microbiota transfer reproduced part of that metabolic phenotype [39]. A separate 2025 study linked quercetin-driven Akkermansia muciniphila enrichment to indole-3-lactic acid and an FTO/m6A/YTHDF2/CYP8B1 pathway controlling bile-acid metabolism [40]. These mechanisms were demonstrated outside the hypothalamus and should not be transferred directly to our tissue. They do support a physiologic model in which hypothalamic transcriptional remodeling can coexist with, and potentially respond to, quercetin-induced peripheral metabolic communication [20,39,40].
The scope of inference is defined by the experimental design and the level of molecular measurement. Final group sizes were modest and unequal, although the principal analyses incorporated HC3 inference, FDR correction, bootstrap resampling, leave-one-sample-out assessment, and explicit testing of multivariate dispersion. RNA was measured in whole hypothalamic tissue, so the cell populations contributing to each transcriptional difference cannot be resolved. Cell-specific studies of METTL14, YTHDC1, FTO, and POMC/AgRP neurons illustrate the additional resolution that targeted approaches can provide [23,24,30,38]. The m6A-related results describe expression of the regulatory machinery rather than global or transcript-specific RNA methylation, and transcript abundance does not establish corresponding protein abundance or phosphorylation-dependent signaling. The covariance network is therefore interpreted as undirected transcriptional association. The experiment was conducted in male rats; sex-dependent responses require a dedicated design [23,24,30,38].
The design also provides complementary strengths. Metabolic status was followed longitudinally, OGTTs were repeated across the intervention, terminal adiposity and lipids were measured within the same factorial framework, and the molecular analysis covered 21 hypothalamic targets rather than a single candidate gene. Molecular findings were evaluated at four levels: individual transcripts, global multivariate structure, predefined biological modules, and treatment-adjusted covariance. This approach extends prior work focused primarily on peripheral metabolic outcomes, hypothalamic inflammation, or individual m6A regulators [13,14,15,16,23,24]. The use of resampling and influence analyses adds information about result stability that is particularly useful for a targeted molecular panel with unequal final group sizes [16,23,24].
The combined metabolic and molecular data support a model in which quercetin attenuates major consequences of HFD feeding while reshaping the hypothalamic transcriptional state. FTO, METTL3, METTL14, LEPR, SOCS3, FOXO1, POMC, and the cross-domain covariance structure emerge as priority targets because independent experimental studies connect these systems to leptin responsiveness, energy homeostasis, and cell-specific m6A regulation [12,23,24,38]. Peripheral microbiota-bile-acid and m6A-linked mechanisms may contribute to the systemic signals surrounding this central response [39,40]. Direct m6A mapping, protein-level signaling assays, and cell-type-resolved analyses will be required to determine which components are causal, but the present data define a reproducible transcriptional architecture for that next stage of investigation [12,23,24,38,39,40].
The relevance of these findings to human metabolic health should be considered in the context of heterogeneous clinical responses to quercetin supplementation. Human randomized trials have not consistently demonstrated reductions in body weight or fasting glucose, although some studies and subgroup analyses have reported improvements in selected cardiometabolic outcomes [41,42,43]. This pattern is compatible with the present observation that quercetin improved glucose tolerance, visceral adiposity, and triglycerides without significantly reducing final body weight. Rather than supporting a simple weight-loss effect, these findings raise the possibility that metabolic responses to quercetin may involve tissue-specific regulatory adaptations that are not necessarily reflected by changes in body mass. The hypothalamus is particularly relevant to this interpretation because it integrates circulating nutritional and hormonal signals and coordinates energy and glucose homeostasis.
Nevertheless, extrapolation of the present molecular findings to humans requires caution. The current study was performed in male Wistar rats receiving quercetin at 100 mg/kg/day, and the hypothalamic analyses were based on transcriptional abundance rather than direct measurements of RNA methylation, protein abundance, enzymatic activity, or signaling-pathway activation. Accordingly, the observed changes in Fto, Mettl3, Mettl14, Lepr, Socs3, Foxo1, Pomc, and related transcripts should be considered mechanistic candidates rather than validated human targets. In humans, confirmation of this model will require studies integrating clinically relevant quercetin exposure with metabolic phenotyping and, where feasible, molecular biomarkers of m6A regulation and leptin-melanocortin function. Such studies could help determine whether hypothalamic regulatory mechanisms contribute to the variable metabolic responses observed in human nutritional interventions.
From a nutritional implementation perspective, the present findings should therefore be viewed as a mechanistic framework rather than evidence of clinical efficacy. The identified transcriptional architecture provides experimentally testable hypotheses for future nutritional intervention studies, including whether variation in m6A-related regulation and leptin-melanocortin signaling is associated with differences in metabolic response to quercetin. Such an approach may be particularly informative for moving beyond anthropometric outcomes and toward mechanistically informed nutritional strategies.
5. Conclusions
Quercetin attenuated key metabolic alterations associated with HFD feeding, particularly impaired glucose tolerance, visceral adiposity, and hypertriglyceridemia, without producing a major difference in final body weight. This metabolic response was accompanied by broad changes in hypothalamic gene expression involving m6A-regulatory transcripts and genes associated with leptin-insulin and melanocortin biology. The same signal was retained across individual-gene, multivariate, module-level, and covariance analyses.
The pronounced responses of Fto, Mettl3, Mettl14, Lepr, Socs3, Foxo1, and Pomc identify molecular targets for mechanistic follow-up. The findings support hypothalamic transcriptional remodeling as a component of the quercetin response under HFD conditions; however, they do not constitute direct evidence of altered m6A methylation or signaling-pathway activation. Cell-type-resolved experiments, transcript-specific m6A measurements, and protein-level signaling analyses are therefore required to establish causal relationships within this network.
From a translational perspective, these findings provide a mechanistic framework for investigating whether hypothalamic m6A-leptin-melanocortin regulation contributes to the metabolic effects of quercetin in humans. However, translation to human nutrition requires confirmation of molecular targets, tissue- and cell-specific mechanisms, clinically relevant exposure levels, and efficacy in well-controlled human intervention studies.
Supplementary Materials
The following supporting information can be downloaded at the website of this paper posted on Preprints.org, Table S1: Individual raw Ct values for the 21 target transcripts and the endogenous reference gene ACTB; Table S2: Complete RT-qPCR normalization and relative-expression dataset, including ΔCt, ΔΔCt, 2^−ΔΔCt, and log2-transformed relative-expression values; Table S3: Module PC1 loadings and gene- and module-level robustness analyses; Table S4: Complete treatment-adjusted transcriptional covariance network and robustness classification; Figure S1: Scree plot of the principal component analysis of the 21-gene hypothalamic transcriptional panel; Figure S2: Leave-one-sample-out stability analysis of gene-level FDR-adjusted results.
Author Contributions
Conceptualization, A.A.G.-R. and A.D.-L.; methodology, A.A.G.-R., A.M.-G. and A.D.-L.; software, A.A.G.-R.; validation, A.A.G.-R. and A.D.-L.; formal analysis, A.A.G.-R.; investigation, A.A.G.-R., A.M.-G., A.A.-G., M.A.M.-G., M.C.C.-H. and G.G.-B.; resources, A.M.-G., M.C.C.-H., G.G.-B. and A.D.-L.; data curation, A.A.G.-R.; writing—original draft preparation, A.A.G.-R.; writing—review and editing, A.A.G.-R., A.M.-G., A.A.-G., M.A.M.-G., M.C.C.-H., G.G.-B. and A.D.-L.; visualization, A.A.G.-R.; supervision, A.D.-L.; project administration, A.A.G.-R. and A.D.-L. All authors have read and agreed to the published version of the manuscript.
Funding
This research received no external funding.
Institutional Review Board Statement
The animal study protocol was approved by the Bioethics Committee of the Escuela Nacional de Medicina y Homeopatía, Instituto Politécnico Nacional (protocol code CBE/005/2021).
Informed Consent Statement
Not applicable.
Data Availability Statement
The data supporting the findings of this study are provided within the article, its Supplementary Materials, and the public GitHub repository associated with this work. The repository includes individual raw qPCR Ct values, RT-qPCR normalization and relative-expression datasets, analysis-ready phenotypic data, R scripts used for statistical analysis and figure generation, reproducibility files, and supplementary analytical outputs. The repository is publicly available at: https://github.com/alexciencia94/quercetin-hfd-hypothalamus-m6a.
Acknowledgments
Alexis Alejandro García-Rivero acknowledges the scholarship support provided by the Secretaría de Ciencia, Humanidades, Tecnología e Innovación (SECIHTI), Mexico (CVU: 1173783). The authors also acknowledge the institutional and research support provided by the Sección de Estudios de Posgrado e Investigación (SEPI), Escuela Superior de Medicina, Instituto Politécnico Nacional, during the development of this study.
Conflicts of Interest
The authors declare no conflicts of interest.
Abbreviations
ACTB, beta-actin; AGRP, agouti-related peptide; AKT, protein kinase B; AUC, area under the curve; FDR, false discovery rate; FOXO1, forkhead box O1; HFD, high-fat diet; HDL-C, high-density lipoprotein cholesterol; iAUC, incremental area under the curve; IRS1, insulin receptor substrate 1; LDL-C, low-density lipoprotein cholesterol; LEPR, leptin receptor; m6A, N6-methyladenosine; MC4R, melanocortin 4 receptor; OGTT, oral glucose tolerance test; PCA, principal component analysis; PERMANOVA, permutational multivariate analysis of variance; POMC, proopiomelanocortin; Q, quercetin; RT-qPCR, reverse-transcription quantitative polymerase chain reaction; SOCS3, suppressor of cytokine signaling 3.
Appendix A
Table A1.
Primer sequences, amplicon characteristics, and assay-specific RT-qPCR conditions for the 21 target transcripts and ACTB.
Table A1.
Primer sequences, amplicon characteristics, and assay-specific RT-qPCR conditions for the 21 target transcripts and ACTB.
| Gene | Forward primer (5′–3′) | Reverse primer (5′–3′) | Annealing temperature (°C) | NCBI RefSeq |
| Agrp | GCAGACCGAGCAGAAGATGT | GCGGTTCTGTGGATCTAGCA | 60 | NM_033650.1 |
| Akt2 | ACCCCCAGACCGATATGACA | GGAGAACTGGGGGAAGTGTG | 60 | NM_017093.1 |
| Alkbh5 | GGTCTGCTGCCCTACATCTC | CCAACCTGAACAGTGGGGAA | 60 | NM_001191643.1 |
| Foxo1 | CAGCCAGGCACCTCATAACA | GTTTGCTGTGCATGTCCAGG | 60 | NM_001191846.3 |
| Fto | GCTCTCCGTGGAACAAAGGA | TCCTCAGATTCTGGCGCATG | 60 | NM_001039713.1 |
| Irs1 | GAGTGGCCCCAATGGCTAC | GACCCACCTCCAATGTCAGG | 60 | NM_012969.2 |
| Lepr | CGCCACCGAGTACAACTGAT | GAAGCCCCCTTCAAAGACGA | 60 | NM_012596.3 |
| Mc4r | TTGCTCGCATCCATTTGCAG | TGGTACTGGAGCGCGTAAAA | 60 | NM_013099.3 |
| Mettl3 | GCCACTCAAGATGGGGTAGAAA | TAGGAGACCTCGCTTTACCTCA | 60 | NM_001024794.1 |
| Mettl14 | TGGAAATAGGAGCGCAGTGG | ACGACAAGGAAAGAGCACCA | 60 | NM_001399249.1 |
| Npy | TGGCCAGATACTACTCCGCT | CTCAGGGCTGGATCTCTTGC | 60 | NM_012614.2 |
| Pik3r1 | GAGGATTTGCCCCACCATGA | CTCGCAATAGGTTCTCGGCT | 60 | NM_013005.3 |
| Pomc | CCTCAGAGAGCTGCCTTTCC | CCTGAGCGACTGTAGCAGAA | 60 | NM_139326.3 |
| Rbm15 | TGAGTGATGGACAGCGCTTT | TCCGGCGGCTGAATAAAGTT | 60 | NM_001399561.1 |
| Rbm15b | GGAGCATTCGGACCATCGAT | GCATCCAGGCTCTCGTACTG | 60 | NM_001399320.1 |
| Socs3 | CGAGAAGATCCCGCTGGTAC | CGACAAAGATGCTGGAGGGT | 60 | NM_053565.2 |
| Sod2 | AATCAGGACCCACTGCAAGG | TAGTAAGCGTGCTCCCACAC | 60 | NM_017051.2 |
| Virma | CATGCAAGCAGAACACCCAC | TCGACAGAAGCAAGGTGACC | 60 | NM_001107915.1 |
| Wtap | TCGTCTGGCAAATGGACCAA | GCTCCCCTCCCTGTGAAATC | 60 | NM_001113542.1 |
| Ythdc1 | GCTTCAGTTCTCAGTCAGCCT | GTGCCTTAATTGCTGCAGCTT | 60 | NM_001024756.1 |
| Zc3h13 | CTCACAGAAGACAGGCAGGG | AGCGCCTTGAACTCTCCTTC | 60 | NM_001170471.1 |
| Actb | GGTGTGATGGTGGGTATGGG | AGGGTCAGGATGCCTCTCTT | 60 | NM_031144.3 |
Primer sequences are shown in the 5′→3′ orientation. Gene symbols follow Rattus norvegicus nomenclature. ACTB was used as the endogenous reference gene for RT-qPCR normalization.
References
- Yan, L.; Li, J. The central nervous system control of energy homeostasis: High fat diet induced hypothalamic microinflammation and obesity. Brain Res. Bull. 2022, 185, 99–106. [Google Scholar] [CrossRef] [PubMed]
- Ullah, R.; Rauf, N.; Nabi, G.; Yi, S.; Yu-Dong, Z.; Fu, J. Mechanistic insight into high-fat diet-induced metabolic inflammation in the arcuate nucleus of the hypothalamus. Biomed. Pharmacother. 2021, 142, 112012. [Google Scholar] [CrossRef] [PubMed]
- Santos, L.S.; Cordeiro, G.S.; Matos, R.J.B.; et al. High-fat diet promotes hypothalamic inflammation in animal models: A systematic review. Nutr. Rev. 2022, 80, 392–399. [Google Scholar] [CrossRef] [PubMed]
- Kwon, O.; Kim, K.W.; Kim, M.S. Leptin signalling pathways in hypothalamic neurons. Cell Mol. Life Sci. 2016, 73, 1457–1477. [Google Scholar] [CrossRef] [PubMed]
- Niswender, K.D.; Schwartz, M.W. Insulin and leptin revisited: Adiposity signals with overlapping physiological and intracellular signaling capabilities. Front. Neuroendocrinol. 2003, 24, 1–10. [Google Scholar] [CrossRef] [PubMed]
- Thon, M.; Hosoi, T.; Ozawa, K. Possible integrative actions of leptin and insulin signaling in the hypothalamus targeting energy homeostasis. Front. Endocrinol. 2016, 7, 138. [Google Scholar] [CrossRef] [PubMed]
- Vohra, M.S.; Benchoula, K.; Serpell, C.J.; Hwa, W.E. AgRP/NPY and POMC neurons in the arcuate nucleus and their potential role in treatment of obesity. Eur. J. Pharmacol. 2022, 915, 174611. [Google Scholar] [CrossRef] [PubMed]
- Lavoie, O.; Michael, N.J.; Caron, A. A critical update on the leptin-melanocortin system. J. Neurochem. 2023, 165, 467–486. [Google Scholar] [CrossRef] [PubMed]
- Xu, R.Y.; Wan, Y.P.; Tang, Q.Y.; Wu, J.; Cai, W. The effects of high fat on central appetite genes in Wistar rats: A microarray analysis. Clin. Chim. Acta 2008, 397, 96–100. [Google Scholar] [CrossRef] [PubMed]
- Deng, L.J.; Deng, W.Q.; Fan, S.R.; et al. m6A modification: Recent advances, anticancer targeted drug discovery and beyond. Mol. Cancer 2022, 21, 52. [Google Scholar] [CrossRef] [PubMed]
- Zhang, Y.; Chen, W.; Zheng, X.; et al. Regulatory role and mechanism of m6A RNA modification in human metabolic diseases. Mol. Ther. Oncolytics 2021, 22, 52–63. [Google Scholar] [CrossRef] [PubMed]
- Liu, S.; Song, S.; Wang, S.; et al. Hypothalamic FTO promotes high-fat diet-induced leptin resistance in mice through increasing CX3CL1 expression. J. Nutr. Biochem. 2024, 123, 109512. [Google Scholar] [CrossRef] [PubMed]
- Perdicaro, D.J.; Rodriguez Lanzi, C.; Gambarte Tudela, J.; Miatello, R.M.; Oteiza, P.I.; Vazquez Prieto, M.A. Quercetin attenuates adipose hypertrophy, in part through activation of adipogenesis in rats fed a high-fat diet. J. Nutr. Biochem. 2020, 79, 108352. [Google Scholar] [CrossRef] [PubMed]
- Gao, X.R.; Chen, Z.; Fang, K.; Xu, J.X.; Ge, J.F. Protective effect of quercetin against the metabolic dysfunction of glucose and lipids and its associated learning and memory impairments in NAFLD rats. Lipids Health Dis. 2021, 20, 164. [Google Scholar] [CrossRef] [PubMed]
- Yang, J.; Kim, C.S.; Tu, T.H.; et al. Quercetin protects obesity-induced hypothalamic inflammation by reducing microglia-mediated inflammatory responses via HO-1 induction. Nutrients 2017, 9, 650. [Google Scholar] [CrossRef] [PubMed]
- Kábelová, A.; Malínská, H.; Marková, I.; Hűttl, M.; Chylíková, B.; Šeda, O. Quercetin supplementation alters adipose tissue and hepatic transcriptomes and ameliorates adiposity, dyslipidemia, and glucose intolerance in adult male rats. Front. Nutr. 2022, 9, 952065. [Google Scholar] [CrossRef] [PubMed]
- Panchal, S.K.; Poudyal, H.; Brown, L. Quercetin ameliorates cardiovascular, hepatic, and metabolic changes in diet-induced metabolic syndrome in rats. J. Nutr. 2012, 142, 1026–1032. [Google Scholar] [CrossRef] [PubMed]
- Wein, S.; Behm, N.; Petersen, R.K.; Kristiansen, K.; Wolffram, S. Quercetin enhances adiponectin secretion by a PPAR-gamma independent mechanism. Eur. J. Pharm. Sci. 2010, 41, 16–22. [Google Scholar] [CrossRef] [PubMed]
- Arias, N.; Macarulla, M.T.; Aguirre, L.; Martínez-Castaño, M.G.; Portillo, M.P. Quercetin can reduce insulin resistance without decreasing adipose tissue and skeletal muscle fat accumulation. Genes Nutr. 2014, 9, 361. [Google Scholar] [CrossRef] [PubMed]
- Ishisaka, A.; Ichikawa, S.; Sakakibara, H.; Piskula, M.K.; Nakamura, T.; Kato, Y.; et al. Accumulation of orally administered quercetin in brain tissue and its antioxidative effects in rats. Free Radic. Biol. Med. 2011, 51, 1329–1336. [Google Scholar] [CrossRef] [PubMed]
- Tung, Y.C.L.; Ayuso, E.; Shan, X.; Bosch, F.; O’Rahilly, S.; Coll, A.P.; et al. Hypothalamic-specific manipulation of Fto, the ortholog of the human obesity gene FTO, affects food intake in rats. PLoS ONE 2010, 5, e8771. [Google Scholar] [CrossRef] [PubMed]
- Hu, F.; Yan, H.J.; Gao, C.X.; Sun, W.W.; Long, Y.S. Inhibition of hypothalamic FTO activates STAT3 signal through ERK1/2 associated with reductions in food intake and body weight. Neuroendocrinology 2023, 113, 80–91. [Google Scholar] [CrossRef] [PubMed]
- Li, Y.; Kim, M.H.; Ren, D.; Rui, L. POMC neuron METTL14/m6A/YTHDC1/YTHDF2 pathways safeguard energy balance, body weight, and metabolism. Nat. Commun. 2026, 17, 5232. [Google Scholar] [CrossRef] [PubMed]
- Shen, Y.; Wong, S.Z.H.; Ma, T.; Zhang, F.; Wang, Q.; Kawaguchi, R.; Geschwind, D.H.; Wang, J.; He, C.; Ming, G.L.; Song, H. m6A deficiency impairs hypothalamic neurogenesis of feeding-related neurons in mice and human organoids and leads to adult obesity in mice. Cell Stem Cell 2025, 32, 727–743.e8. [Google Scholar] [CrossRef] [PubMed]
- Kang, Q.; Zhu, X.; Ren, D.; Ky, A.; MacDougald, O.A.; O’Rourke, R.W.; Rui, L. Adipose METTL14-elicited N6-methyladenosine promotes obesity, insulin resistance, and NAFLD through suppressing beta-adrenergic signaling and lipolysis. Adv. Sci. 2023, 10, e2301645. [Google Scholar] [CrossRef] [PubMed]
- Zheng, Q.; Zhong, X.; Kang, Q.; Zhang, Z.; Ren, D.; Liu, Y.; Rui, L. METTL14-induced m6A methylation increases G6pc biosynthesis, hepatic glucose production and metabolic disorders in obesity. Adv. Sci. 2025, 12, e2417355. [Google Scholar] [CrossRef] [PubMed]
- Münzberg, H.; Flier, J.S.; Bjørbaek, C. Region-specific leptin resistance within the hypothalamus of diet-induced obese mice. Endocrinology 2004, 145, 4880–4889. [Google Scholar] [CrossRef] [PubMed]
- Mori, H.; Hanada, R.; Hanada, T.; et al. Socs3 deficiency in the brain elevates leptin sensitivity and confers resistance to diet-induced obesity. Nat. Med. 2004, 10, 739–743. [Google Scholar] [CrossRef] [PubMed]
- Olofsson, L.E.; Unger, E.K.; Cheung, C.C.; Xu, A.W. Modulation of AgRP-neuronal function by SOCS3 as an initiating event in diet-induced hypothalamic leptin resistance. Proc. Natl. Acad. Sci. USA 2013, 110, E697–E706. [Google Scholar] [CrossRef] [PubMed]
- Başer, Ö.; Yavuz, Y.; Özen, D.Ö.; Özgün, H.B.; Ağuş, S.; Civaş, C.C.; Atasoy, D.; Yılmaz, B. Effects of chronic high fat diet on mediobasal hypothalamic satiety neuron function in POMC-Cre mice. Mol. Metab. 2024, 82, 101904. [Google Scholar] [CrossRef] [PubMed]
- Hill, J.W.; Williams, K.W.; Ye, C.; et al. Acute effects of leptin require PIK3R1 signaling in hypothalamic proopiomelanocortin neurons in mice. J. Clin. Invest. 2008, 118, 1796–1805. [Google Scholar] [CrossRef] [PubMed]
- Xu, Y.; Hill, J.W.; Fukuda, M.; et al. PIK3R1 signaling in the ventromedial hypothalamic nucleus is required for normal energy homeostasis. Cell Metab. 2010, 12, 88–95. [Google Scholar] [CrossRef] [PubMed]
- Kim, M.S.; Pak, Y.K.; Jang, P.G.; et al. Role of hypothalamic Foxo1 in the regulation of food intake and energy homeostasis. Nat. Neurosci. 2006, 9, 901–906. [Google Scholar] [CrossRef] [PubMed]
- Kitamura, T.; Feng, Y.; Kitamura, Y.I.; et al. Forkhead protein FoxO1 mediates Agrp-dependent effects of leptin on food intake. Nat. Med. 2006, 12, 534–540. [Google Scholar] [CrossRef] [PubMed]
- Plum, L.; Lin, H.V.; Dutia, R.; et al. The obesity susceptibility gene Cpe links FoxO1 signaling in hypothalamic pro-opiomelanocortin neurons with regulation of food intake. Nat. Med. 2009, 15, 1195–1201. [Google Scholar] [CrossRef] [PubMed]
- la Fleur, S.E.; van Rozen, A.J.; Luijendijk, M.C.M.; Groeneweg, F.; Adan, R.A.H. A free-choice high-fat high-sugar diet induces changes in arcuate neuropeptide expression that support hyperphagia. Int. J. Obes. 2010, 34, 537–546. [Google Scholar] [CrossRef] [PubMed]
- Dalvi, P.S.; Chalmers, J.A.; Luo, V.; et al. High fat induces acute and chronic inflammation in the hypothalamus: Effect of high-fat diet, palmitate and TNF-alpha on appetite-regulating NPY neurons. Int. J. Obes. 2017, 41, 149–158. [Google Scholar] [CrossRef] [PubMed]
- Kohno, D.; Kawabata-Iwakawa, R.; Ichinose, S.; Suyama, S.; Ohashi, K.; Sasaki, T.; et al. FTO promotes weight gain via altering Kif1a splicing and axonal vesicle trafficking in AgRP neurons. EMBO J. 2025, 44, 4919–4961. [Google Scholar] [CrossRef] [PubMed]
- Zhu, X.; Dai, X.; Zhao, L.; Li, J.; Zhu, Y.; He, W.; Guan, X.; Wu, T.; Liu, L.; Song, H.; Lei, L. Quercetin activates energy expenditure to combat metabolic syndrome through modulating gut microbiota-bile acids crosstalk in mice. Gut Microbes 2024, 16, 2390136. [Google Scholar] [CrossRef] [PubMed]
- Liu, J.; Liu, Y.; Huang, C.; He, C.; Yang, T.; Ren, R.; Xin, Z.; Wang, X. Quercetin-driven Akkermansia muciniphila alleviates obesity by modulating bile acid metabolism via an ILA/m6A/CYP8B1 signaling. Adv. Sci. 2025, 12, e2412865. [Google Scholar] [CrossRef] [PubMed]
- Ostadmohammadi, V.; Milajerdi, A.; Ayati, E.; Kolahdooz, F.; Asemi, Z. Effects of quercetin supplementation on glycemic control among patients with metabolic syndrome and related disorders: A systematic review and meta-analysis of randomized controlled trials. Phytother. Res. 2019, 33, 1330–1340. [Google Scholar] [CrossRef] [PubMed]
- Huang, H.; Liao, D.; Dong, Y.; Pu, R. Clinical effectiveness of quercetin supplementation in the management of weight loss: A pooled analysis of randomized controlled trials. Diabetes Metab. Syndr. Obes. 2019, 12, 553–563. [Google Scholar] [CrossRef] [PubMed]
- Huang, H.; Liao, D.; Dong, Y.; Pu, R. Effect of quercetin supplementation on plasma lipid profiles, blood pressure, and glucose levels: A systematic review and meta-analysis. Nutr. Rev. 2020, 78, 615–626. [Google Scholar] [CrossRef] [PubMed]
- Brüll, V.; Burak, C.; Stoffel-Wagner, B.; Wolffram, S.; Nickenig, G.; Müller, C.; Langguth, P.; Alteheld, B.; Fimmers, R.; Stehle, P.; Egert, S. No effects of quercetin from onion skin extract on serum leptin and adiponectin concentrations in overweight-to-obese patients with (pre-)hypertension: A randomized double-blinded, placebo-controlled crossover trial. Eur. J. Nutr. 2017, 56, 2265–2275. [Google Scholar] [CrossRef] [PubMed]
Figure 1.
Experimental design and hypothalamic transcriptional panel. (A) Four experimental groups were followed for 16 weeks with longitudinal body-weight and fasting-glucose measurements, oral glucose tolerance tests (OGTTs) at weeks 0, 8, and 16, and terminal metabolic and tissue collection. (B) RT-qPCR targeted 21 hypothalamic transcripts assigned to m6A-regulatory, leptin-insulin signaling, melanocortin-related, and oxidative-response domains. HFD, high-fat diet; Q, quercetin.
Figure 1.
Experimental design and hypothalamic transcriptional panel. (A) Four experimental groups were followed for 16 weeks with longitudinal body-weight and fasting-glucose measurements, oral glucose tolerance tests (OGTTs) at weeks 0, 8, and 16, and terminal metabolic and tissue collection. (B) RT-qPCR targeted 21 hypothalamic transcripts assigned to m6A-regulatory, leptin-insulin signaling, melanocortin-related, and oxidative-response domains. HFD, high-fat diet; Q, quercetin.
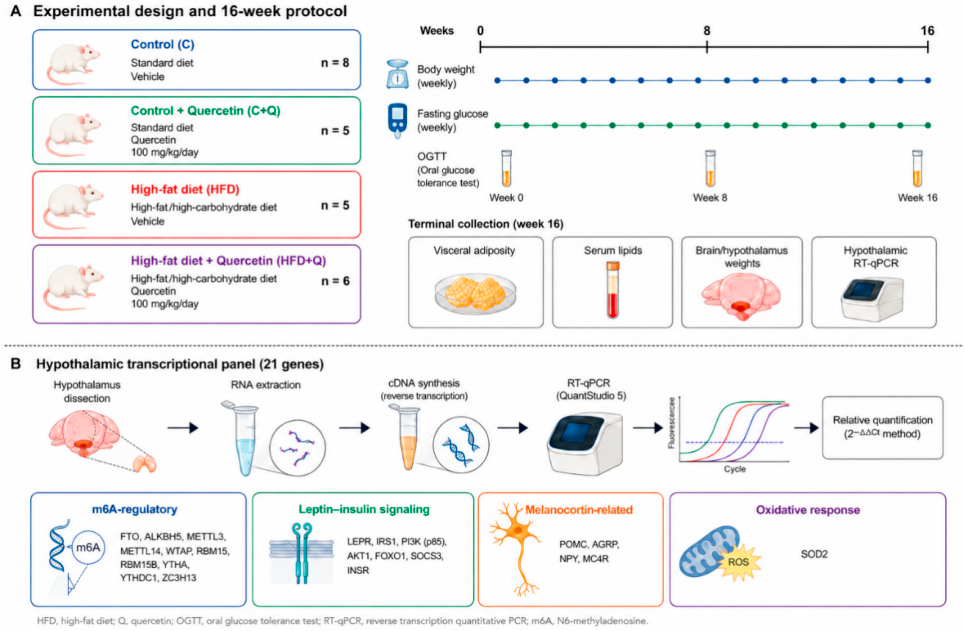
Figure 2.
Longitudinal metabolic phenotype. (A) Body-weight trajectories across 16 weeks. (B) Absolute body-weight gain. (C) Percentage body-weight gain. (D) Longitudinal fasting glucose. Thin lines indicate individual trajectories and thicker lines indicate group means; distribution panels show individual observations and group summaries. Q, quercetin; HFD, high-fat diet.
Figure 2.
Longitudinal metabolic phenotype. (A) Body-weight trajectories across 16 weeks. (B) Absolute body-weight gain. (C) Percentage body-weight gain. (D) Longitudinal fasting glucose. Thin lines indicate individual trajectories and thicker lines indicate group means; distribution panels show individual observations and group summaries. Q, quercetin; HFD, high-fat diet.
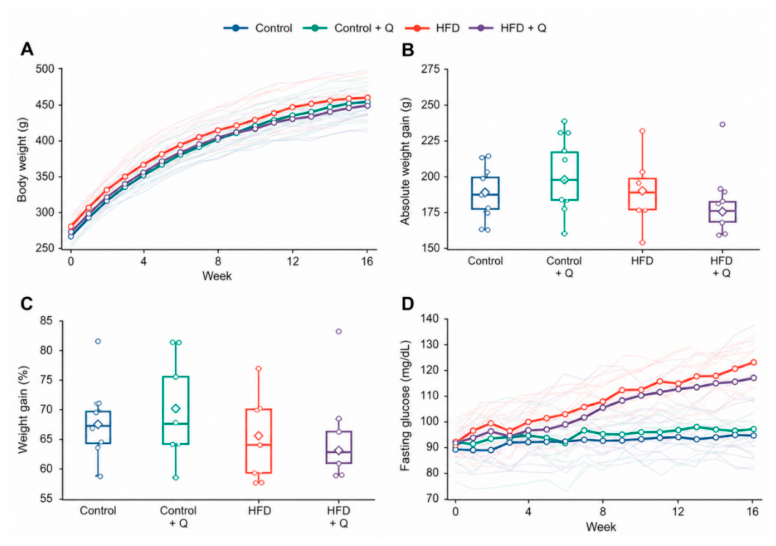
Figure 3.
Glucose tolerance and terminal metabolic phenotype. (A-C) OGTT curves at weeks 0, 8, and 16, respectively. (D) Longitudinal OGTT AUC. (E-H) Triglycerides, visceral fat, visceral fat expressed as percentage of body weight, and total cholesterol. Significant brackets correspond to prespecified model-based contrasts; FDR-adjusted q values are reported in Table 1.
Figure 3.
Glucose tolerance and terminal metabolic phenotype. (A-C) OGTT curves at weeks 0, 8, and 16, respectively. (D) Longitudinal OGTT AUC. (E-H) Triglycerides, visceral fat, visceral fat expressed as percentage of body weight, and total cholesterol. Significant brackets correspond to prespecified model-based contrasts; FDR-adjusted q values are reported in Table 1.
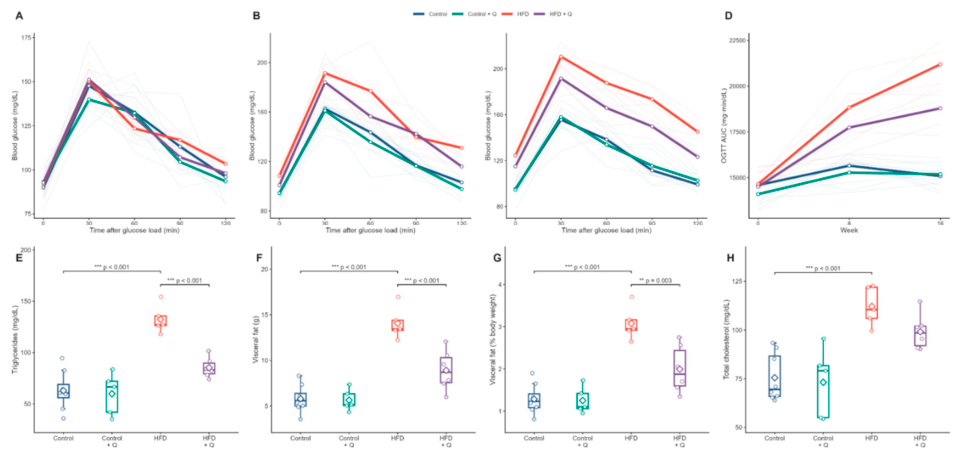
Figure 4.
Global hypothalamic transcriptional profile. (A) Unsupervised PCA of standardized expression values for 21 hypothalamic transcripts. PC1 and PC2 accounted for 52.9% and 20.6% of total variance, respectively; diamonds denote group centroids and dashed ellipses provide a descriptive view of within-group spread. (B) Heatmap of gene-wise standardized expression values ordered by experimental group and molecular domain. PIK3R1 denotes the PIK3R1-related assay target.
Figure 4.
Global hypothalamic transcriptional profile. (A) Unsupervised PCA of standardized expression values for 21 hypothalamic transcripts. PC1 and PC2 accounted for 52.9% and 20.6% of total variance, respectively; diamonds denote group centroids and dashed ellipses provide a descriptive view of within-group spread. (B) Heatmap of gene-wise standardized expression values ordered by experimental group and molecular domain. PIK3R1 denotes the PIK3R1-related assay target.
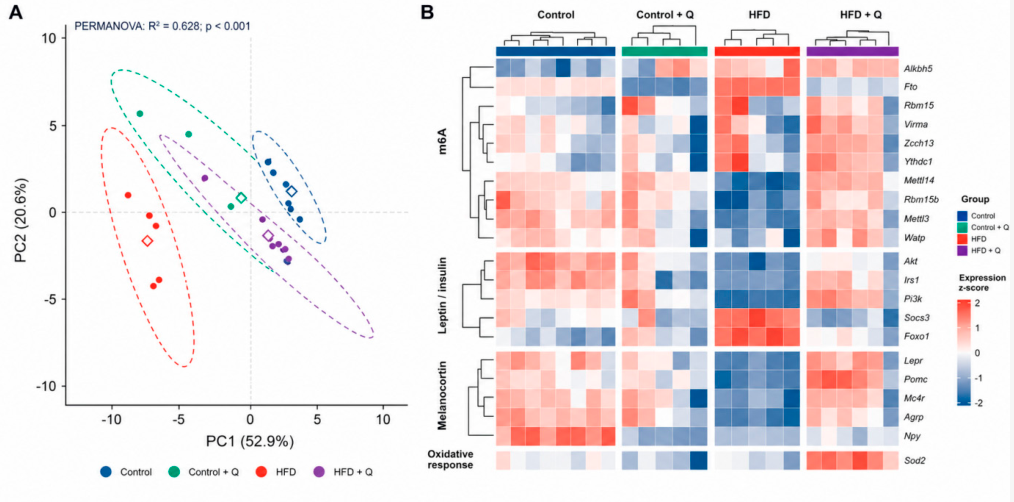
Table 1.
Experimental phenotype and terminal metabolic outcomes.
| Outcome | Unit | Control | Control + Q | HFD | HFD + Q | Diet × Q effect [95% CI] | Diet × Q q | HFD + Q vs HFD effect [95% CI] | HFD + Q vs HFD q |
| Brain weight | g | 1.92 ± 0.07 | 1.93 ± 0.08 | 1.85 ± 0.10 | 1.89 ± 0.10 | 0.03 [-0.11, 0.16] | 0.948 | 0.04 [-0.07, 0.14] | 0.603 |
| Fasting glucose | mg/dL | 94.06 ± 6.32 | 95.52 ± 5.64 | 121.28 ± 7.81 | 115.18 ± 10.83 | -7.55 [-18.73, 4.31] | 0.412 | -6.10 [-15.73, 3.87] | 0.452 |
| Final body weight | g | 453.01 ± 11.58 | 454.94 ± 21.51 | 458.16 ± 26.14 | 450.75 ± 30.69 | -9.34 [-44.68, 26.06] | 0.679 | -7.41 [-36.73, 23.43] | 0.700 |
| HDL cholesterol | mg/dL | 45.94 ± 4.59 | 51.22 ± 5.35 | 35.72 ± 7.28 | 38.95 ± 5.95 | -2.05 [-10.73, 6.94] | 0.883 | 3.23 [-3.91, 10.53] | 0.482 |
| Hypothalamus weight | mg | 41.34 ± 2.52 | 41.86 ± 1.80 | 39.70 ± 1.33 | 40.33 ± 1.87 | 0.11 [-2.67, 2.80] | 0.948 | 0.63 [-1.09, 2.30] | 0.603 |
| LDL cholesterol | mg/dL | 17.16 ± 11.74 | 11.99 ± 13.22 | 49.96 ± 13.68 | 43.13 ± 8.41 | -1.66 [-19.35, 15.85] | 0.883 | -6.83 [-19.16, 5.13] | 0.482 |
| Total cholesterol | mg/dL | 75.50 ± 12.28 | 73.16 ± 17.98 | 112.14 ± 10.11 | 99.13 ± 9.13 | -10.67 [-29.78, 8.84] | 0.771 | -13.01 [-23.19, -2.67] | 0.118 |
| Triglycerides | mg/dL | 62.91 ± 18.74 | 59.82 ± 20.60 | 132.30 ± 13.82 | 85.27 ± 9.96 | -43.94 [-68.21, -20.09] | 0.033 | -47.03 [-60.65, -34.34] | <0.001 |
| Visceral fat | g | 5.80 ± 1.49 | 5.64 ± 1.20 | 14.07 ± 1.79 | 8.91 ± 2.23 | -5.01 [-7.57, -2.53] | 0.019 | -5.16 [-7.37, -3.05] | 0.004 |
| Visceral fat | % body weight | 1.28 ± 0.35 | 1.25 ± 0.32 | 3.08 ± 0.40 | 1.99 ± 0.56 | -1.05 [-1.66, -0.45] | 0.025 | -1.08 [-1.59, -0.57] | 0.006 |
Values are mean ± SD for descriptive group summaries. Effects are factorial-model estimates with HC3 inference; q values are Benjamini-Hochberg-adjusted where applicable. Q, quercetin; HFD, high-fat diet; HDL-C, high-density lipoprotein cholesterol; LDL-C, low-density lipoprotein cholesterol.
Table 2.
Gene-level hypothalamic transcriptional effects.
| Gene | Diet × Q effect [95% CI] | Forest | q | HFD + Q vs HFD effect [95% CI] | Forest | q |
| Alkbh5 | -0.81 [-1.57, 0.00] |  |
0.158 | 0.12 [-0.27, 0.50] |  |
0.686 |
| Fto | -0.36 [-0.80, 0.05] |  |
0.220 | -4.39 [-4.78, -4.04] |  |
<0.001 |
| Mettl14 | 3.44 [2.58, 4.29] |  |
<0.001 | 3.64 [3.01, 4.21] |  |
<0.001 |
| Mettl3 | 2.52 [1.59, 3.37] |  |
<0.001 | 1.78 [1.18, 2.21] |  |
<0.001 |
| Rbm15 | -0.50 [-1.49, 0.42] |  |
0.440 | 0.11 [-0.72, 0.86] |  |
0.826 |
| Rbm15b | 1.96 [1.28, 2.62] |  |
<0.001 | 1.66 [1.23, 2.06] |  |
<0.001 |
| Virma | 0.84 [-0.13, 1.84] |  |
0.223 | 0.51 [-0.26, 1.27] |  |
0.382 |
| Wtap | 2.41 [0.99, 3.96] |  |
0.030 | 1.73 [0.68, 2.89] |  |
0.031 |
| Ythdc1 | 0.15 [-0.72, 1.01] |  |
0.789 | 0.16 [-0.55, 0.81] |  |
0.758 |
| Zc3h13 | 0.57 [-0.46, 1.61] |  |
0.437 | 0.32 [-0.54, 1.10] |  |
0.627 |
| Akt2 | 1.32 [0.88, 1.72] |  |
<0.001 | 0.75 [0.48, 1.00] |  |
<0.001 |
| Foxo1 | -1.84 [-2.44, -1.22] |  |
<0.001 | -1.38 [-1.69, -1.14] |  |
<0.001 |
| Irs1 | 2.63 [1.77, 3.46] |  |
<0.001 | 1.39 [0.91, 1.80] |  |
<0.001 |
| Pik3r1 | 1.80 [1.08, 2.42] |  |
<0.001 | 1.86 [1.30, 2.24] |  |
<0.001 |
| Socs3 | -0.79 [-1.11, -0.50] |  |
<0.001 | -0.91 [-1.06, -0.75] |  |
<0.001 |
| Agrp | 2.57 [1.57, 3.51] |  |
<0.001 | 1.84 [1.17, 2.37] |  |
<0.001 |
| Lepr | 2.36 [1.55, 3.07] |  |
<0.001 | 1.77 [1.13, 2.21] |  |
<0.001 |
| Mc4r | 2.22 [1.10, 3.42] |  |
0.010 | 1.55 [0.79, 2.13] |  |
0.002 |
| Npy | 2.00 [1.69, 2.27] |  |
<0.001 | 0.29 [0.10, 0.44] |  |
0.023 |
| Pomc | 3.36 [2.33, 4.23] |  |
<0.001 | 3.13 [2.23, 3.79] |  |
<0.001 |
| Sod2 | 1.70 [1.10, 2.42] |  |
0.001 | 1.07 [0.73, 1.40] |  |
<0.001 |
Effects are expressed on the log2(2−ΔΔCt) scale. Confidence intervals were obtained by stratified bootstrap resampling with 10,000 iterations. q values were derived using Benjamini-Hochberg FDR correction. Q, quercetin; HFD, high-fat diet. PIK3R1-related target denotes the assay label used in the experimental dataset.
Disclaimer/Publisher’s Note: The statements, opinions and data contained in all publications are solely those of the individual author(s) and contributor(s) and not of MDPI and/or the editor(s). MDPI and/or the editor(s) disclaim responsibility for any injury to people or property resulting from any ideas, methods, instructions or products referred to in the content. |
© 2026 by the authors. Licensee MDPI, Basel, Switzerland. This article is an open access article distributed under the terms and conditions of the Creative Commons Attribution (CC BY) license (http://creativecommons.org/licenses/by/4.0/).
Copyright: This open access article is published under a Creative Commons CC BY 4.0 license, which permit the free download, distribution, and reuse, provided that the author and preprint are cited in any reuse.