

Submitted:
15 September 2026
Posted:
16 September 2026
You are already at the latest version
Abstract
Resting metabolic rate (RMR) primarily depends on age, gender, and body composition, with most findings derived from urban populations. However, RMR in non-urban populations remains under-researched. This study aimed to examine how anthropometry and body composition influence RMR prediction in populations from four altitude regions and to propose a tailored prediction equation for these groups. This cross-sectional study spanned four altitude gradients, involving 493 elderly participants aged 60–80 years. Measurements included height, weight, and waist-hip circumference, with RMR assessed via indirect calorimetry (IC). The Shapiro-Wilk test determined normality in statistical analysis. We evaluated the accuracy (90%–110%) and error rate (underestimation110%) of equations such as FAO/WHONU and our proposed equation against the actual RMR measurements. Hierarchical multiple linear regression and analysis of covariance explored relationships between age, gender, anthropometry, body composition, altitude, and RMR IC among the elderly across different altitudes. Men's RMR (RMR IC) ranged from 1700 to 2100 kcal/day, while women's ranged from 1500 to 1700 kcal/day. Both were positively correlated with body weight, waist circumference (WC), hip circumference (HC), fat-free mass (FFM), and fat mass (FM), and negatively correlated with age. Altitude significantly affected RMR (p < 0.001). For the elderly across the four altitude gradients, our proposed prediction equation outperformed other equations mentioned in this study. We recommend considering the specificity, applicability, and suitability of non-localised RMR prediction equations to avoid significant underestimation or overestimation of the elderly population's energy needs.
Keywords:
resting metabolic rate
; older adult
; predictive equation
; altitude
; indirect calorimetry
1. Introduction
Energy metabolism constitutes a fundamental physiological determinant of health in older adults. Misestimation of individual energy requirements, whether under- or overes-timation, results in inappropriate dietary prescriptions and suboptimal management of nutritional intake. Total human energy expenditure is principally composed of physical activity, the thermic effect of food and the basal metabolic rate (BMR). BMR is currently defined as the minimum rate of energy expenditure necessary to maintain life and accounts for approximately 50% – 70% of total daily energy expenditure. From the second decade of life onwards, this baseline declines by an average of 1% – 2% per decade [1].
The discrepancy between resting metabolic rate (RMR) and basal metabolic rate (BMR) is approximately 10%, chiefly owing to differences in the thermic effect of food [2]. Major determinants of RMR include body composition, body shape, sex, age and dietary patterns [3]. Fat-free mass (FFM) is the principal determinant [4,5,6,7,8,9], although several studies have shown that fat mass (FM) also influences RMR [10,11,12]. In addition, ageing and chronic disease reduce components of total energy expenditure and modify body composition [13,14,15]. These changes manifest as a gradual loss of FFM alongside a notable increase in centrally distributed FM [16]. Waist circumference, hip circumference and body mass index (BMI) are useful predictors of FM distribution, with waist circumference being particularly informative [17,18,19,20].
Indirect calorimetry (IC) is currently the gold standard for measuring resting metabolic rate (RMR). This method is non-invasive, simple, and verifiable [21,22]. It calculates RMR by measuring the concentrations of carbon dioxide and oxygen in exhaled air [23,24]. However, its high cost and need for specialized equipment and operators limit its application, particularly for individuals in unique environments, such as high-altitude areas.
Individuals residing at high altitudes for extended periods may experience significant metabolic adaptations to their environment. Research indicates a strong link between prolonged altitude exposure and the physiological regulation of human energy metabolism [25,26,27,28]. Despite this, there remains a scarcity of measured resting metabolic rate (RMR) data and predictive equations tailored for high-altitude populations, which are essential for devising precise nutrition and exercise plans. In clinical settings, RMR is a standard metric for assessing energy balance, often calculated using prediction equations include the Harris-Benedict [29], FAO/WHO/UNU [30], Owen [31], and Mifflin-Jeor [32] equations, with the latter endorsed by the American Dietetic Association (ADA) [33]. However, these equations, developed for lowland or urban populations, may not accurately reflect the metabolic needs of those living at high altitudes [34,35]. Applying these general equations can result in significant errors, typically overestimating RMR, which is a critical consideration for high-altitude residents requiring nutritional and exercise guidance [36,37,38].
This study aimed to examine variations in body composition among the elderly across different altitude regions. It also sought to develop region-specific prediction equations for resting metabolic rate (RMR) and assess how altitude influences RMR.
2. Materials and Methods
2.1. Study Design
This study is an analytical cross-sectional study based on the measured data of resting metabolic rate (RMR IC) of elderly individuals across four altitude gradients.
2.2. Sample
The study used non-probability sampling to recruit 493 participants aged 60-80 years. They were drawn from four sites: Hongyuan County (3500 m, n = 101), Maoxian County (2500 m, n = 143), Zhaojue County (2000 m, n = 94) and rural Rongchang District, Chongqing (350 m, n = 155). All participants met the following inclusion criteria: at least three generations of their family had resided in the testing area; they were in good health and functionally independent; body weight had remained stable (±3 kg) over the preceding six months; and they had no anaemia, metabolic or endocrine disorders, or severe cardiovascular, cerebrovascular, pulmonary, hepatic or renal disease. Individuals with hypertension were eligible only if blood pressure was controlled with medication. In addition, no participant had taken drugs known to affect resting metabolic rate (RMR) prior to testing.
The Human Research Ethics Committee of Southwest Minzu University reviewed and approved this study, and all participants signed informed consent forms. The research procedures also complied with the ethical guidelines of the Declaration of Helsinki and the Council for International Organizations of Medical Sciences (CIOMS).
2.3. Anthropometric Measurements
Body weight was measured simultaneously using a body composition analyser (MC-780MA). Height, waist circumference, and hip circumference were recorded with a non-elastic measuring tape, accurate to 1 mm. Each test was conducted twice, and the final results were calculated as the average of the two measurements [39,40].
When measuring waist and hip circumferences, take measurements during the pause between exhalation and the next inhalation. Measure waist circumference between the inferior border of the tenth rib and the anterior superior iliac spine. Measure hip circumference where the buttocks are fullest, wrapping the tape horizontally around this area. Waist circumference is considered the best indicator of abdominal obesity, with normal values being <90 cm for men and <80 cm for women [41]. In plateau regions, the value for men remains <90 cm, but for women, it is <85 cm [42,43].
2.4. Body Composition
Body composition was measured using a TANITA MC-780MA body composition analyser (TANITA Corporation, Japan). The device employs bioelectrical impedance analysis (BIA), recording the impedance of both lower limbs while the subject stands and subsequently calculating whole-body fat-free mass (FFM) and fat mass (FM).
On the day before resting metabolic rate measurement, participants were instructed to empty their bladder and bowels, wear minimal clothing and remove all jewellery. They stood barefoot for measurement of height and weight. Fat-free mass (FFM) and fat mass (FM) were then measured using a body composition analyser.
2.5. Indirect Calorimetry
Resting metabolic rate (RMR) was assessed using indirect calorimetry (IC). Participants abstained from caffeine, smoking, and high-intensity physical activities for 24 hours before the test and fasted for over 10 hours. Prior to testing, participants' identities and health statuses were verified. Vital signs were monitored during the measurement, ensuring a breathing frequency of 12–18 breaths per minute and heart rate fluctuations of less than 8 - 10 beats per minute. The measurement took place in the early morning after participants woke up.
Prior to formal measurement, calibration adhered to the instrument's technical specifications using a 5L air duct, CO₂ desiccant, and standard gas (16.0% O₂ and 5.0% CO₂, ±1.0%). The environmental CO₂ concentration was maintained below 5.0%, with ambient temperatures between 20 and 25°C. Upon arrival at the test site, participants rested quietly for 30 minutes. Subsequently, the tester assisted them in donning a test mask to collect exhaled gases. A Cosmed K5 cardiopulmonary function measuring instrument (Rome, Italy) was employed to measure these gases. Once the test reached a steady state, the tester recorded data from the instrument, including VO₂ consumption, VCO₂ production, and the respiratory quotient (RQ). The test's accuracy and validity were assessed by determining the RQ value, with a physiological range of 0.7 to 1.0, verified by VO₂ and VCO₂ fluctuations [44]. The steady state was defined as a coefficient of variation (CV) of VO₂ and VCO₂ of ≤ 10% within the first 5 minutes of the test [45], which lasted 15 to 20 minutes.
2.6. Adequacy of Predictive Equations with Resting Metabolic Rate Measured by Indirect Calorimetry
The adequacy of the prediction equations from Harris-Benedict 1919 [29], FAO/WHO/UNU 1985 [30], Owen 1988 [31], Mifflin-St Jeor 1990 [32], Porter 2023 [46], and the equation proposed in this study was evaluated based on the percentage difference range of RMR IC. An equation was deemed adequate if the percentage difference between the predicted RMR value and RMR IC fell within ±10% (90%-110%RMR IC). Specifically, if the predicted RMR value was outside the ±10% range of RMR IC, it was classified as an underestimation (< 90% RMR IC) or overestimation (> 110% RMR IC) [47].
2.7. Statistical Analysis
In this study, variable data are presented as measures of central tendency (Mean±SD) and dispersion (IQR Q25, Q75). The Shapiro-Wilk test assesses data normality. Pearson's correlation test estimates correlations among variables like RMR IC, anthropometry, and body composition, with the Spearman test used for verification.
Subjects were categorised into four altitude gradients based on variables such as age, gender (coded: Male = 1; Female = 0), anthropometry, and body composition. Hierarchical multiple linear regression analysis was then performed to develop models for each altitude. Variables were selected using the stepwise method. For each altitude, the model with the lowest Akaike Information Criterion (AIC) [48] and the highest adjusted R2 was deemed optimal. Assumptions of multicollinearity, residual normality, and homoscedasticity were assessed using the Variance Inflation Factor (VIF), the Shapiro-Wilk test, and the Breusch-Pagan test, respectively.
The regression equation, including2 the model probability value (p), the coefficient of determination (R2), the standard error of the estimate (SEE), and the standardized coefficient (), was derived using hierarchical multiple linear regression analysis. To assess the accuracy between the resting metabolic rate (RMR) values predicted by the model and those measured by indirect calorimetry (RMR IC), the Bland-Altman method [49,50,51] and the intra-class correlation coefficient (ICC) were employed.
The Shapiro-Wilk test for normality indicated the need for the Kruskal-Wallis test to compare RMR values from various prediction equations. To ensure robust statistical outcomes, ANCOVA analysis was conducted with dual verification using the heteroscedasticity-robust standard error method (HC3) and the Bootstrap method, with 1,000 resamples. Following verification of the regression slopes' parallelism assumption, adjustments were made for age, gender, FM, and FFM to assess the independent environmental impact of altitude on RMR IC. Additionally, the Bonferroni correction was applied for post-hoc comparisons. Statistical analyses utilised SPSS Statistics 27.0 (IBM Corp, Armonk, NY, USA) and GraphPad Prism 11.0 (GraphPad Software, San Diego, CA, USA), with a significance level set at α = 0.05.
3. Results
3.1. Basic Characteristics of the Participants
Table 1 and Appendix A.1 Table A1 presents the fundamental characteristics of the participants, comprising 539 elderly individuals aged 60 to 80 from four altitude gradients, with approximately 46% being male. For males, the median ages across the 350 m to 3500 m groups were 70.0 (63.0, 74.0), 67.0 (62.0, 72.0), 68.0 (62.0, 73.0), and 68.0 (64.0, 73.0), respectively. For females, the median ages were 68.0 (62.0, 71.0), 70.5 (62.0, 75.3), 69.5 (63.3, 75.0), and 67.0 (62.0, 70.0), respectively. In terms of height, males across all altitude regions measured between 1.6 ± 0.1 m and 1.7 ± 0.1 m, while females ranged from 1.5 ± 0.1 m to 1.6 ± 0.1 m. The highest weights and BMIs were observed in the 3500 m group, with males weighing 69.3 ± 10.5 kg and females 61.1 ± 14.5 kg, and BMIs of 25.2 ± 3.4 kg/m² for males and 26.0 ± 5.5 kg/m² for females. Waist circumferences were also largest in the 3500 m group, measuring 93.7 ± 9.6 cm for males and 90.1 ± 10.8 cm for females. However, the highest hip circumferences were found in the 350 m group, with males at 98.0 (92.0, 104.0) cm and females at 101.0 (93.3, 105.0) cm. Regarding body composition, both fat-free mass (FFM) and fat mass (FM) were greatest in the 3500 m group. Males had an FM of 19.1 ± 6.4 kg and an FFM of 50.2 ± 6.1 kg, while females had an FM of 23.5 ± 11.6 kg and an FFM of 37.6 ± 4.8 kg. The highest resting metabolic rate (RMR IC) was recorded in the 2000 m group, with males at 2031.7 ± 479.9 kcal/day and females at 1702.6 ± 384.9 kcal/day. (Additional data can be found in Table A1.)
3.2. Correlation Results Between Resting Metabolic Rate (RMR IC) and Age, Sex, Anthropometric Measurements, and Body Composition
Figure 1 presents the correlation test results. Notably, the RMR IC-Age correlation in the 2000 m group (Spearman coefficient) and the RMR IC-FM correlation in the 350 m group (Pearson coefficient) showed inconsistencies. However, the Pearson and Spearman test results for other variables were largely consistent. In the 3500 m group, the resting metabolic rate (RMR IC) exhibited a negative correlation with Age (r = -0.009) and Height (r = -0.393), while showing significant positive correlations with Sex (r = 0.402), Weight (r = 0.488), WC (r = 0.390), HC (r = 0.322), BMI (r = 0.470), FM (r = 0.285), and FFM (r = 0.457). Similarly, in the 2500 m group, RMR IC was negatively correlated with Age (r = -0.084) and positively correlated with Sex (r = 0.290), Height (r = 0.492), Weight (r = 0.587), WC (r = 0.272), HC (r = 0.308), BMI (r = 0.381), FM (r = 0.238), and FFM (r = 0.524). These findings align with trends observed in the 2000 m and 350 m groups. The correlation coefficients for the 2000 m group are as follows: RMR IC - Age (r = -0.262), Sex (r = 0.356), Height (r = 0.451), Weight (r = 0.573), WC (r = 0.406), HC (r = 0.470), BMI (r = 0.468), FM (r = 0.438), and FFM (r=0.486). For the 350 m group, the coefficients are: RMR IC - Age (r = -0.164), Sex (r = 0.258), Height (r = 0.350), Weight (r = 0.370), WC (r = 0.190), HC (r = 0.120), BMI (r = 0.101), FM (r = 0.106), and FFM (r = 0.426).
3.3. Development of Prediction Equations for Four Altitude Gradients and Comparative Analysis with Existing Equations
Table 2 and Appendix A.2 Table A2 presents the prediction equations. In the 350m group, Age and Sex accounted for 16% of the variance in RMR IC, while FM and FFM explained 7% and 12%, respectively. Hierarchical multiple linear regression analysis identified Age, Sex, FM, and FFM as the optimal predictors for RMR IC in this group. The prediction equation is: RMR = 1350.8 - 9.9Age(y) + 27.5Sex(Male = 1, Female = 0) + 5.8FM(kg) + 21.5FFM(kg).In the 2000m group, WC and HC initially explained 22% of the variance in RMR IC. However, their contribution decreased significantly after including FM and FFM. Consequently, Age, Sex, FM, and FFM emerged as the best predictors for this group. The prediction equation is: RMR = 1278.3 - 3.4Age(y) + 386.5Sex(Male = 1, Female = 0) + 35.5FM(kg) + 1.6FFM(kg).For the 2500m group, WC and HC explained 19% of the variance in RMR IC. Including FM and FFM yielded results similar to those in the 2000m group, confirming Age, Sex, FM, and FFM as the optimal predictors. The prediction equation is: RMR = 107.2 + 1.2Age - 22.70Sex(Male = 1, Female = 0) + 15.9FM + 28.6FFM.In the 3500m group, Age and Sex explained 17% of the variance, while FM and FFM together accounted for 15%. Thus, Age, Sex, FM, and FFM were optimal explanatory variables for RMR IC in this group. The prediction equation is: RMR = 429.9 + 5.1Age + 345.0Sex + 10.4FFM + 18.0FM. (Additional data can be found in Table A2.)
Figure 2 illustrates the statistically significant differences in resting metabolic rate (RMR) as estimated by various prediction equations. For the 3500m group, no significant differences were observed between the actual RMR measured via indirect calorimetry (IC) and the equations proposed in this study, as well as the FAO/WHO/UNU, Harris-Benedict, Mifflin-St Jeor, Owen, and Poter equations (p > 0.05). In contrast, other groups displayed significant differences between the IC method and the FAO/WHO/UNU, Harris-Benedict, Mifflin-St Jeor, Owen, and Poter equations (p < 0.001). However, no significant differences were found between the IC method and the equation proposed in this study (p > 0.05).
3.4. Prediction Equations and the Percentage of Adequacy for Resting Metabolic Rate (RMR IC)
Table 3 and Appendix A.3 Table A3 presents the adequacy percentages of the predicted resting metabolic rate (RMR) values, derived from the proposed equations, against the actual values measured by indirect calorimetry (IC). In the altitude groups ranging from 350m to 3500m, 39.2%, 35.1%, 47.6%, and 35.6% of elderly participants, respectively, had predicted RMR values within 90% to 110% of the actual IC values. This indicates that the prediction equations developed for these altitude regions outperform those of FAO/WHO/UNU, Harris-Benedict, Mifflin-St Jeor, Owen, and Poter in terms of adequacy. Nonetheless, within the same groups, 24.7%, 28.7%, 24.4%, and 28.8% of the elderly had predicted values that underestimated the actual RMR IC values (< 90% RMR IC). Conversely, overestimations (> 110% RMR IC) occurred in 36.1%, 36.2%, 28.0%, and 35.6% of the participants, respectively. (Additional data can be found in Table A3.)
Figure 3 illustrates the estimated values of prediction equations incorporating variables such as Age, Sex, WC, HC, FM, and FFM across four altitude gradients. The study employed the Bland-Altman method and the intra-class correlation coefficient (ICC) to assess consistency with RMR IC. For the altitude groups ranging from 350 m to 3500 m, the ICC values were 0.559 (95% CI: 0.395 - 0.679), 0.717 (95% CI: 0.574 - 0.812), 0.702 (95% CI: 0.586 - 0.786), and 0.650 (95% CI: 0.480 - 0.764), respectively.
3.5. Results: Analysis of Altitude Effects on Resting Metabolic Rate in the Elderly Across Four Regions
The ANCOVA analysis, employing the heteroscedasticity-robust standard error method (HC3 method), revealed a significant main effect of altitude after adjusting for Age, Sex, FM, and FFM (F = 12.706, p < 0.001, partial = 0.073). Using the 350 m group (1668.1 kcal/day) as a reference, only the resting metabolic rate (RMR) of the 2000 m group showed a significant increase (difference: +242.7 kcal, robust standard error: 46.2, 95% CI: [154.3, 332.3], p < 0.001). In contrast, no significant differences were observed between the 2500 m group (difference: -16.8 kcal, robust standard error: 36.2, 95% CI: [-86.3, 51.0], p = 0.645) and the 350 m group, nor between the 3500 m group (difference: +7.0 kcal, robust standard error: 47.6, 95% CI: [-91.5, 98.4], p = 0.877) and the 350 m group. Furthermore, the Bootstrap method results were entirely consistent with those of the HC3 method. Among the covariates, FFM (kg) (B: 16.99, p < 0.001), FM (kg) (B: 15.98, p < 0.001), and Sex (B: 144.3, p = 0.018) were significant predictors, whereas Age (p = 0.590) did not independently contribute after adjustment. (date not shown)
4. Discussion
In this study, body composition, particularly fat-free mass (FFM), emerged as the primary determinant of resting metabolic rate (RMR) in individuals over 60 across four altitude regions, aligning with previous research findings [3,5,8,52]. While RMR measured by indirect calorimetry (IC) showed a stronger correlation with body weight, this was attributed to the fat mass (FM) to FFM ratio. Notably, except for the 3500 m group, where age and RMR IC had a non-significant negative correlation (r = -0.009), significant negative correlations were observed in other altitude groups. Aging typically reduces RMR per kilogram of body weight and decreases FFM [11,14,53,54,55]. Interestingly, at 2000 m, the negative correlation between RMR IC and age was more pronounced; however, above 2000 m, this correlation weakened (Group 350 m: r=-0.164; Group 2000 m: r=-0.262; Group 2500 m: r=-0.084). This suggests that mild hypoxic adaptation at altitudes above 2000 m might alleviate the adverse effects of aging on RMR. Studies indicate that moderate or intermittent hypoxia can enhance certain inflammatory, metabolic, and cardiovascular markers through a low-dose stress response [56,57]. Conversely, prolonged exposure to altitudes above 3500 m may accelerate aging [58].
In the 3500 m group, we observed a significant negative correlation between height and resting metabolic rate (RMR) (r = -0.393). Conversely, participants in other groups showed significant positive correlations. This finding contrasts with the general expectation of predicting RMR based on overall body types. It may indicate variations in weight-height relationships, body compositions, gender distributions, and age groups within the sample. Thus, this association should not be directly interpreted as a causal inhibitory effect of height on RMR.
In the 2000-3500 m groups among the elderly, statistically significant positive correlations were observed between waist and hip circumferences and resting metabolic rate (RMR), except in the 350 m group (WC: all r > 0.27; HC: all r > 0.30; p < 0.05). These findings align with previous studies[59,60,61], although fat-free mass (FFM) and fat mass (FM) typically influence this relationship. Multiple linear regression analysis revealed that waist circumference (WC) and hip circumference (HC) accounted for 22% and 19% of the variability in RMR prediction equations for the 2000 m and 2500 m group, respectively, while their impact in the 350 m and 3500 m group was minimal. After adjusting for FM and FFM, WC and HC only increased the variability of the original RMR by 1%-2% in the 2000 m-2500 m group. Additionally, a significant positive correlation between FM and RMR was found in the 2000 m-3500 m groups (all r > 0.23, p < 0.05), though FM’s contribution to RMR varied significantly, ranging from 1% to 14%, consistent with some studies [10,11,62]. In the 350 m group, despite no significant positive correlation between FM and RMR, FM still explained 7% of the variance. Notably, while the explanatory power of WC and HC diminished after including FM and FFM, WC and HC remain valuable substitutes when body composition data are unavailable.
The application of resting metabolic rate (RMR) prediction equations, such as the FAO/WHO/UNU 1985 and Harris-Benedict equations, should be considered as reference points or controls rather than definitive measures. These equations are highly specific, developed based on populations with distinct environmental and racial/ethnic characteristics. When applied to different racial or ethnic groups, significant variations in dietary habits, lifestyles, environments, and physical activity can lead to inaccurate RMR estimates. This study exemplifies this issue. No statistically significant differences were found between the RMR estimates from equations developed for four altitude gradients and the corresponding RMR IC values (all p > 0.05). However, significant discrepancies were observed between the RMR IC of elderly individuals in the 350m-2500m altitude group and estimates from equations like Harris-Benedict [29], FAO/WHO/UNU 1985 [30], Owen [31], Mifflin-St Jeor [32], and Poter [46] (p < 0.0001). Furthermore, while the optimal equations for the four altitude gradients in this study showed limited adequacy (35%-47%) and consistency, with extreme differences of 530 to 814 kcal and ICC coefficients of 0.559 to 0.717, this is largely due to the variability in the body composition of the elderly, especially those with altitude-related backgrounds. The study’s large sample size might have introduced confounding factors, affecting the adequacy and consistency of results. In comparison, other prediction equations demonstrated even lower adequacy (0%-29%), with significant underestimation of RMR IC values (>60% underestimation and <12% overestimation), contrasting with some studies [37,46,63,64,65]. Although these equations tend to overestimate less than those proposed in this study, their overall accuracy is weaker. As noted by Cioffi et al., no formula can provide fully accurate and precise predictions at both population and individual levels [37]. Therefore, the equations proposed in this study should be used as references or controls for populations with altitude-related backgrounds, with further investigation needed to assess their applicability.
After adjusting for age, sex, FM, and FFM, we identified a non-linear relationship between altitude and resting metabolic rate (RMR) in the elderly. The RMR IC of the 2000m group was significantly higher than that of other groups, with no significant differences observed among the remaining groups. Previous research indicates that hypoxic exposure can elevate RMR while reducing appetite and energy intake [66,67,68]. However, the metabolic response to hypoxia may diminish during adaptation. In a study involving obese men at 2650m, basal metabolic rate (BMR) increased, energy intake decreased, and physical activity remained unchanged, suggesting hypoxic stimulation influences energy metabolism [69]. Thus, the elevated RMR in the 2000m group might result from moderate hypoxic stimulation combined with long-term adaptation. Nonetheless, current evidence is inadequate to establish 2000m as the general metabolic peak for human RMR. Furthermore, the roles of the sympathetic nervous system, thyroid hormones, or energy-protective inhibition remain unconfirmed by this study alone [70,71]. Future research should employ continuous altitude variables and non-linear models, incorporating factors such as energy intake, physical activity, sympathetic nerve activity, and endocrine indicators for comprehensive analysis.
After adjusting for fat mass (FM) and fat-free mass (FFM), males exhibited a higher resting metabolic rate (RMR) than females. This finding aligns with previous studies on elderly RMR, suggesting that differences in FM and FFM do not fully account for males' elevated RMR levels [72,73]. However, inconsistencies in conclusions from various studies after body composition correction imply that gender effects might be influenced by the methods of body composition measurement and model settings [74]. The higher RMR in males could relate to organ tissue mass, skeletal muscle metabolic characteristics, and sex hormone pathways [75,76], although these mechanisms were not directly assessed in this study. Future research should explore the interactions among sex hormones, organ tissue mass, mitochondrial function, and hypoxic exposure.
In this study, both fat mass (FM) and fat-free mass (FFM) were independently linked to resting metabolic rate (RMR) [8,10,59], with similar regression coefficients observed. This aligns with previous research indicating FM's contribution is distinct from FFM's explanatory scope [59]. Studies on the elderly have also suggested that FM and fat distribution may influence RMR [77,78]. Adipose tissue, known for its metabolic, endocrine, and immunomodulatory roles [79,80,81], regulates energy metabolism homeostasis through leptin, adiponectin, and inflammation-related signals [82,83,84]. Thus, it should not be viewed as metabolically inert. However, similar regression coefficients for FM and FFM do not suggest identical metabolic rates per unit mass, nor do they prove that adipose tissue's oxidative metabolic contribution equals that of FFM. The FM regression coefficient might reflect total adipose tissue, adipokine secretion, inflammatory status, fat distribution, and interactions with other tissues [76]. Consequently, this study suggests a potential statistical association between FM and RMR in the elderly from four altitude regions, after controlling for other variables. Nonetheless, further research is needed to clarify the physiological basis through measurements of organ and tissue mass, adipokines, thyroid hormones, and tissue metabolism.
5. Conclusions
In summary, among elderly individuals living in diverse environmental regions, fat-free mass (FFM) primarily determines resting metabolic rate (RMR). Nonetheless, fat mass (FM) significantly affects those residing at high altitudes. The waist-to-hip ratio, reflecting abdominal fat distribution, slightly improves RMR prediction accuracy in this study's sample, thereby reducing errors. Although the proposed equation's predictive power is somewhat limited, it surpasses other prediction equations overall. Moreover, when using RMR prediction equations based on factors such as regional environments, ethnicities, lifestyles, dietary habits, and physical activity patterns, it is essential to consider their suitability for the specific population. Directly assessing daily energy requirements from these predictions is inadvisable, as it could adversely affect elderly individuals needing nutritional and sports-health guidance.
Author Contributions
Conceptualization, Z.C.Z., J.Z. and Y.D.G.; methodology, Z.C.Z., J.Z. and Y.D.G.; software, S.H.Z. and X.S.; validation, Z.C.Z., J.Z. and Y.D.G.; formal analysis, Z.C.Z., J.Z. and Y.D.G.; investigation, S.H.Z., X.S., H.C., B.S.Z., K.Y.J., X.Y.L. and Z.C.Z.; resources, Z.C.Z., J.Z. and Y.D.G. ; data curation, S.H.Z., X.S., X.Y.L.; writing—original draft preparation, S.H.Z.; writing—review and editing, Z.C.Z.; visualization, S.H.Z.; supervision, Z.C.Z., J.Z. and Y.D.G.; project administration, Z.C.Z., J.Z. and Y.D.G.; funding acquisition, Z.C.Z., J.Z. and Y.D.G. All authors have read and agreed to the published version of the manuscript.
Funding
This study received support from a sub-project of the Key R&D Programme of the National Ministry of Science and Technology of China, as well as a special project from the central universities of Southwest Minzu University, under project numbers 2024YFC3607301 and 2024SPYZX05YB.
Institutional Review Board Statement
The study complied with the Declaration of Helsinki and received approval from the Human Research Ethics Committee at Southwest Minzu University (Approval No.: SUM-202401171).
Informed Consent Statement
Informed consent was obtained from all subjects involved in the study.
Data Availability Statement
The data presented in this study are available on request from the corresponding author due to privacy restrictions.
Acknowledgments
The authors express their sincere gratitude to the Plateau Grand Health Team at Southwest Minzu University for their support.
Conflicts of Interest
The authors declare no conflict of interest.
Appendix A
Appendix A.1

Table A1.
Age, anthropometry, body composition, and resting metabolic rate of the participants measured by indirect calorimetry.
Table A1.
Age, anthropometry, body composition, and resting metabolic rate of the participants measured by indirect calorimetry.
| Variable | 350m | 2000m | 2500m | 3500m | ||||
| Male (n=71) | Female (n=84) | Male (n=48) | Female (n=46) | Male (n=67) | Female (n=76) | Male (n=43) | Female (n=58) | |
| Age (y) | 70.0 (63.0;74.0) |
68.0 (62.0;71.0) |
67.0 (62.0;72.0) | 70.5 (62.0;75.3) |
68.0 (62.0;73.0) |
69.5 (63.3;75.0) |
68.0 (64.0;73.0) |
67.0 (62.0;70.0) |
| Height (m) | 1.6±0.1 | 1.5±0.1 | 1.7±0.1 | 1.6±0.1 | 1.7±0.1 | 1.5±0.1 | 1.7±0.1 | 1.5±0.1 |
| Weight (kg) | 60.8±9.3 | 55.5±9.8 | 60.6±9.4 | 52.2±11.8 | 62.2±9.1 | 56.3±10.4 | 69.3±10.5 | 61.1±14.5 |
| BMI (kg/m2) | 23.0±3.0 | 23.9±3.5 | 21.2±2.8 | 21.5±3.8 | 22.4±2.5 | 24.5±3.9 | 25.2±3.4 | 26.0±5.5 |
| WC (cm) | 87.7±10.9 | 90.5±12.5 | 85.9±8.5 | 84.7±10.4 | 87.2±8.0 | 89.0±9.7 | 93.7±9.6 | 90.1±10.8 |
| HC (cm) | 98.0 (92.0;104.0) |
101.0 (93.3;105.0) |
94.0 (91.0,99.8) |
94.5 (90.0;100.0) |
96.0 (93.0,99.0) |
97.0 (92.0,102.5) |
98.0 (95.0,100.0) |
96.0 (90.0;104.3) |
| FM (kg) | 14.5±4.6 | 19.3±7.0 | 14.7±4.9 | 17.0±7.6 | 14.1±4.5 | 20.7±8.1 | 19.1±6.4 | 23.5±11.6 |
| FFM (kg) | 46.3±5.9 | 36.2±3.9 | 45.9±5.9 | 35.3±5.0 | 48.1±6.5 | 35.7±3.6 | 50.2±6.1 | 37.6±4.8 |
| RMR IC (kcal/day) |
1731.1±304.3 | 1570.1±300.1 | 2031.7±479.9 | 1702.6±384.9 | 1767.0±383.4 | 1540.6±369.1 | 1989.2±493.6 | 1583.7±436.2 |
Appendix A.2
Table A2.
Predictive equations used to estimate resting metabolic rate based on age, sex, waist circumference, hip circumference, fat mass, fat-free mass.
Table A2.
Predictive equations used to estimate resting metabolic rate based on age, sex, waist circumference, hip circumference, fat mass, fat-free mass.
| Regression Equation | P | R2 | SEE | AIC | ||
| 350m组(n=155) | ||||||
| I | RMR=2761.0-17.6Age+241.2Sex | <0.001 | 0.16 | 338.3 | 1843.2 | (-0.28; 0.33) |
| II | RMR=2274.2-14.8Age+302.9Sex+15.5FM | <0.001 | 0.23 | 324.9 | 1831.5 | (-0.23; 0.41; 0.28) |
| III | RMR=1284.8-9.6Age-43.5Sex+25.8FFM | <0.001 | 0.28 | 314.8 | 1821.4 | (-0.15; -0.06; 0.52) |
| IV | RMR=1350.8-9.9Age+27.5Sex+5.8FM+21.5FFM | <0.001 | 0.28 | 314.4 | 1822.1 | (-0.16; 0.04; 0.11; 0.43) |
| 2000m组(n=94) | ||||||
| I | RMR=2556.4-12.3Age+308.9Sex | <0.001 | 0.16 | 431.1 | 1143.4 | (-0.17;0.33) |
| II | RMR=183.8-4.6Age+294.1Sex+21.7WC | <0.001 | 0.34 | 383.3 | 1122.4 | (-0.06;0.32;0.44) |
| III | RMR=-1253.2-1.7Age+339.7Sex+7.0WC+25.9HC | <0.001 | 0.38 | 374.8 | 1118.9 | (-0.02;0.37;0.14;0.37) |
| IV | RMR=1278.3-3.4Age+386.5Sex+35.5FM+1.6FFM | <0.001 | 0.39 | 371.3 | 1117.1 | (-0.05;0.42;0.49;0.03) |
| 2500m组(n=143) | ||||||
| I | RMR=1780.0-3.5Age+222.9Sex | <0.001 | 0.09 | 376.6 | 1699.3 | (-0.06;0.29) |
| II | RMR=-496.1-6.3Age+249.2Sex+16.7WC | <0.001 | 0.21 | 347.4 | 1677.1 | (-0.10;0.32;0.38) |
| III | RMR=-350.8-5.6Age+270.1Sex-2.1WC+21.3HC | <0.001 | 0.28 | 337.8 | 1670.1 | (-0.09;0.35;0.05;0.40) |
| IV | RMR=107.2+1.2Age-22.7Sex+15.9FM+28.6FFM | <0.001 | 0.37 | 315.0 | 1650.1 | (0.20;-0.03;0.30;0.59) |
| 3500m组(n=101) | ||||||
| I | RMR=1124.4+6.5Age+448.7Sex | <0.001 | 0.17 | 462.6 | 1242.6 | (-0.07; 0.41) |
| II | RMR=360.8+4.8Age+93.9Sex+24.0FFM | <0.001 | 0.22 | 450.2 | 1238.1 | (0.05; 0.09; 0.40) |
| III | RMR=1047.3+1.0Age+492.1Sex+20.0FM | <0.001 | 0.31 | 423.3 | 1225.6 | (0.01; 0.49; 0.40) |
| IV | RMR=429.9+5.1Age+345.0Sex+10.4FFM+18.0FM | <0.001 | 0.32 | 423.0 | 1225.3 | (0.05; 0.34; 0.17; 0.36) |
Appendix A.3
Table A3.
Percent adequacy(underestimation/ overestimation) of predictive equations as related to resting metabolic rate measured by indirect calorimetry.
Table A3.
Percent adequacy(underestimation/ overestimation) of predictive equations as related to resting metabolic rate measured by indirect calorimetry.
| Predictive Equation |
Underestimation (<90%) |
Adequacy (90%to110%) |
Overestimation (>110%) |
| 350m group (n=155) | |||
| Proposal | 24.7 | 39.2 | 36.1 |
| FAO/WHO/UNU | 82.5 | 15.2 | 2.3 |
| Harris-Benedict | 87.7 | 10.5 | 1.8 |
| Mifflin-St Jeor | 91.2 | 7.6 | 1.2 |
| Owen | 66.6 | 28.7 | 4.7 |
| Poter | 90.0 | 8.8 | 1.2 |
| 2000m group (n=94) | |||
| Proposal | 28.7 | 35.1 | 36.2 |
| FAO/WHO/UNU | 90.6 | 8.4 | 1.0 |
| Harris-Benedict | 93.4 | 5.6 | 1.0 |
| Mifflin-St Jeor | 99.0 | 0.0 | 1.0 |
| Owen | 86.9 | 11.2 | 1.9 |
| Poter | 97.1 | 1.9 | 1.0 |
| 2500m group (n=143) | |||
| Proposal | 24.4 | 47.6 | 28.0 |
| FAO/WHO/UNU | 79.4 | 12.5 | 8.1 |
| Harris-Benedict | 83.7 | 10.0 | 6.3 |
| Mifflin-St Jeor | 84.9 | 11.3 | 3.8 |
| Owen | 68.7 | 19.4 | 11.9 |
| Poter | 83.7 | 11.3 | 5.0 |
| 3500m group (n=101) | |||
| Proposal | 28.8 | 35.6 | 35.6 |
| FAO/WHO/UNU | 79.2 | 12.9 | 7.9 |
| Harris-Benedict | 77.2 | 13.9 | 8.9 |
| Mifflin-St Jeor | 86.2 | 5.9 | 7.9 |
| Owen | 72.2 | 17.9 | 9.9 |
| Poter | 83.2 | 7.9 | 8.9 |
References
- Pinheiro Volp, A.C.; Esteves de Oliveira, F.C.; Duarte Moreira Alves, R.; Esteves, E.A.; Bressan, J. Energy expenditure: Components and evaluation methods. Nutr. Hosp. 2011, 26(3), 430–440. [Google Scholar] [CrossRef] [PubMed]
- Mataix, J.; Martínez, J.A. Balance de energía corporal. In Nutrición y Alimentación Humana; Matrix, J., Ed.; Ocean/Ergon: Barcelona, Spain, 2006; pp. 703–722. [Google Scholar]
- Mahan, L.; Escott-Stump, S.; Raymond, J. Dietoterapia de Krause, 12th ed.; Elsevier: Amsterdam, The Netherlands, 2009; p. 1263. [Google Scholar]
- Wang, Z.; Heshka, S.; Gallagher, D.; Boozer, C.N.; Kotler, D.P.; Heymsfield, S.B. Resting energy expenditure-fat-free mass relationship: New insights provided by body composition modeling. Am. J. Physiol. Endocrinol. Metab. 2000, 279(3), E539–E545. [Google Scholar] [CrossRef] [PubMed]
- Westerterp, K.R. Control of energy expenditure in humans. Eur. J. Clin. Nutr. 2017, 71, 340–344. [Google Scholar] [CrossRef] [PubMed]
- Heymsfield, S.B.; Thomas, D.; Bosy-Westphal, A.; Shen, W.; Peterson, C.M.; Müller, M.J. Evolving concepts on adjusting human resting energy expenditure measurements for body size. Obes. Rev. 2012, 13(11), 1001–1014. [Google Scholar] [CrossRef] [PubMed]
- Cunningham, J.J. A reanalysis of the factors influencing basal metabolic rate in normal adults. Am. J. Clin. Nutr. 1980, 33(11), 2372–2374. [Google Scholar] [CrossRef] [PubMed]
- Johnstone, A.M.; Murison, S.D.; Duncan, J.S.; Rance, K.A.; Speakman, J.R. Factors influencing variation in basal metabolic rate include fat-free mass, fat mass, age, and circulating thyroxine but not sex, circulating leptin, or triiodothyronine. Am. J. Clin. Nutr. 2005, 82(5), 941–948. [Google Scholar] [CrossRef] [PubMed]
- Ravussin, E.; Bogardus, C. Relationship of genetics, age, and physical fitness to daily energy expenditure and fuel utilization. Am. J. Clin. Nutr. 1989, 49((5) Suppl, 968–975. [Google Scholar] [CrossRef] [PubMed]
- Nelson, K.M.; Weinsier, R.L.; Long, C.L.; Schutz, Y. Prediction of resting energy expenditure from fat-free mass and fat mass. Am. J. Clin. Nutr. 1992, 56, 848–856. [Google Scholar] [CrossRef] [PubMed]
- Rising, R.; Harper, I.T.; Fontvieille, A.M.; Ferraro, R.T.; Spraul, M.; Ravussin, E. Determinants of total daily energy expenditure: variability in physical activity. Am. J. Clin. Nutr. 1994, 59, 800–804. [Google Scholar] [CrossRef] [PubMed]
- Maury-Sintjago, E.; Rodríguez-Fernández, A.; Parra-Flores, J.; Ruíz-De la Fuente, M. Obese Women Have a High Carbohydrate Intake without Changes in the Resting Metabolic Rate in the Luteal Phase. Nutrients 2022, 14. [Google Scholar] [CrossRef] [PubMed]
- Manini, T.M. Energy expenditure and aging. Ageing Res. Rev. 2010, 9(1), 1–11. [Google Scholar] [CrossRef] [PubMed]
- St-Onge, M.P.; Gallagher, D. Body composition changes with aging: The cause or the result of alterations in metabolic rate and macronutrient oxidation? Nutrition 2010, 26(2), 152–155. [Google Scholar] [CrossRef] [PubMed]
- Elia, M.; Ritz, P.; Stubbs, R.J. Total energy expenditure in the elderly. Eur. J. Clin. Nutr. 2000, 54 (Suppl. 3), S92–S103. [Google Scholar] [CrossRef] [PubMed]
- Zamboni, M.; Zoico, E.; Scartezzini, T.; Mazzali, G.; Tosoni, P.; Zivelonghi, A.; Gallagher, D.; De Pergola, G.; Di Francesco, V.; Bosello, O. Body composition changes in stable-weight elderly subjects: The effect of sex. Aging Clin. Exp. Res. 2003, 15(4), 321–327. [Google Scholar] [CrossRef] [PubMed]
- Rankinen, T.; Kim, S.Y.; Pérusse, L.; Després, J.P.; Bouchard, C. The prediction of abdominal visceral fat level from body composition and anthropometry: ROC analysis. Int. J. Obes. Relat. Metab. Disord. 1999, 23, 801–809. [Google Scholar] [CrossRef] [PubMed]
- Torun, C.; Ankaralı, H.; Oğuz, A. Prediction of visceral adipose tissue magnitude using a new model based on simple clinical measurements. Front. Endocrinol. 2024, 15, 1411678. [Google Scholar] [CrossRef] [PubMed]
- Pinho, C.P.S.; Diniz, A.S.; Rodrigues, I.G. Predictive models for estimating visceral fat: The contribution from anthropometric parameters. PLoS ONE 2017, 12(7), e0178958. [Google Scholar] [CrossRef] [PubMed]
- Eastwood, S.V.; Tillin, T.; Chaturvedi, N. Estimation of CT-derived abdominal visceral and subcutaneous adipose tissue depots from anthropometry in Europeans, South Asians and African Caribbeans. PLoS ONE 2013, 8(9), e75085. [Google Scholar] [CrossRef] [PubMed]
- Delsoglio, M.; Achamrah, N.; Berger, M.M.; Pichard, C. Indirect calorimetry in clinical practice. J. Clin. Med. 2019, 8, 1387. [Google Scholar] [CrossRef] [PubMed]
- Cooper, J.A.; Watras, A.C.; O’Brien, M.J.; Luke, A.; Dobratz, J.R.; Earthman, C.P.; Schoeller, D.A. Assessing validity and reliability of resting metabolic rate in six gas analysis systems. J. Am. Diet. Assoc. 2009, 109, 128–132. [Google Scholar] [CrossRef] [PubMed]
- Compher, C.; Frankenfield, D.; Keim, N.; Roth-Yousey, L. Best practice methods to apply to measurement of resting metabolic rate in adults: a systematic review. J. Am. Diet. Assoc. 2006, 106, 881–903. [Google Scholar] [CrossRef] [PubMed]
- Mtaweh, H.; Tuira, L.; Floh, A.A.; Parshuram, C.S. Indirect calorimetry: History, technology, and application. Front. Pediatr. 2018, 6, 257. [Google Scholar] [CrossRef] [PubMed]
- Murray, A.J. Energy metabolism and the high-altitude environment. Exp. Physiol. 2016, 101(1), 23–27. [Google Scholar] [CrossRef] [PubMed]
- West, J.B. High-altitude medicine. Am. J. Respir. Crit. Care Med. 2012, 186(12), 1229–1237. [Google Scholar] [CrossRef] [PubMed]
- Bigham, A.W.; Lee, F.S. Human high-altitude adaptation: Forward genetics meets the HIF pathway. Genes Dev. 2014, 28(20), 2189–2204. [Google Scholar] [CrossRef] [PubMed]
- Hochachka, P.W.; Rupert, J.L.; Monge, C. Adaptation and conservation of physiological systems in the evolution of human hypoxia tolerance. Comp. Biochem. Physiol. A Mol. Integr. Physiol. 1999, 124(1), 1–17. [Google Scholar] [CrossRef] [PubMed]
- Harris, J.A.; Benedict, F.G. 1919. A Biometric Study of Basal Metabolism in Man Publication No. 279. Carnegie Institution of Washington: Washington, DC, USA. [Google Scholar]
- FAO/WHO/UNU. Energy and Protein Requirements: Report of a Joint FAO/WHO/UNU Expert Consultation; WHO Technical Report Series No. 724; World Health Organization: Geneva, Switzerland, 1985. [Google Scholar]
- Owen, O.E. Resting metabolic requirements of men and women. Mayo Clin. Proc. 1988, 63, 503–510. [Google Scholar] [CrossRef] [PubMed]
- Mifflin, M.D.; St Jeor, S.T.; Hill, L.A.; Scott, B.J.; Daugherty, S.A.; Koh, Y.O. A new predictive equation for resting energy expenditure in healthy individuals. Am. J. Clin. Nutr. 1990, 51, 241–247. [Google Scholar] [CrossRef] [PubMed]
- Seagle, H.M.; Strain, G.W.; Makris, A.; Reeves, R.S. Position of the American Dietetic Association: Weight management. J. Am. Diet. Assoc. 2009, 109, 330–346. [Google Scholar] [CrossRef] [PubMed]
- Case, K.O.; Brahler, C.J.; Heiss, C. Resting energy expenditures in Asian women measured by indirect calorimetry are lower than expenditures calculated from prediction equations. J. Am. Diet. Assoc. 1997, 97, 1288–1292. [Google Scholar] [CrossRef] [PubMed]
- Song, T.; Venkataraman, K.; Gluckman, P.; Seng, C.Y.; Meng, K.C.; Khoo, E.Y.; Leow, M.K.; Seng, L.Y.; Shyong, T.E. Validation of prediction equations for resting energy expenditure in Singaporean Chinese men. Obes. Res. Clin. Pract. 2014, 8, e283–e290. [Google Scholar] [CrossRef] [PubMed]
- Müller, M.J.; Bosy-Westphal, A.; Klaus, S.; Kreymann, G.; Lührmann, P.M.; Neuhäuser-Berthold, M.; Noack, R.; Pirke, K.M.; Platte, P.; Selberg, O.; Steiniger, J. World Health Organization equations have shortcomings for predicting resting energy expenditure in persons from a modern, affluent population: Generation of a new reference standard from a retrospective analysis of a German database of resting energy expenditure. Am. J. Clin. Nutr. 2004, 80, 1379–1390. [Google Scholar] [CrossRef] [PubMed]
- Cioffi, I.; Marra, M.; Pasanisi, F.; Scalfi, L. Prediction of resting energy expenditure in healthy older adults: A systematic review. Clin. Nutr. 2021, 40, 3094–3103. [Google Scholar] [CrossRef] [PubMed]
- Siervo, M.; Bertoli, S.; Battezzati, A.; Wells, J.C.; Lara, J.; Ferraris, C.; Tagliabue, A. Accuracy of predictive equations for the measurement of resting energy expenditure in older subjects. Clin. Nutr. 2014, 33, 613–619. [Google Scholar] [CrossRef] [PubMed]
- Cui, Y.; Gao, Y.-T.; Cai, Q.; Qu, S.; Cai, H.; Li, H.-L.; Wu, J.; Ji, B.-T.; Yang, G.; Chow, W.-H.; Shu, X.-O.; Zheng, W. Associations of leukocyte telomere length with body anthropometric indices and weight change in Chinese women. Obesity 2013, 21, 2582–2588. [Google Scholar] [CrossRef] [PubMed]
- Li, A.; Zhou, Q.; Mei, Y.; Zhao, J.; Zhao, M.; Xu, J.; Ge, X.; Xu, Q. Novel strategies for assessing associations between selenium biomarkers and cardiometabolic risk factors: Concentration, visit-to-visit variability, or individual mean? Evidence from a repeated-measures study of older adults with high selenium. Front. Nutr. 2022, 9, 838613. [Google Scholar] [CrossRef] [PubMed]
- Peng, W.; Li, K.; Yan, A.F.; Shi, Z.; Zhang, J.; Cheskin, L.J.; Hussain, A.; Wang, Y. Prevalence, Management, and Associated Factors of Obesity, Hypertension, and Diabetes in Tibetan Population Compared with China Overall. Int. J. Environ. Res. Public Health 2022, 19, 8787. [Google Scholar] [CrossRef] [PubMed]
- Ma, Y.; Li, Y.; Zhang, Z.; Du, G.; Huang, T.; Zhao, Z.Z.; Liu, S.; Dang, Z. Establishment of a risk prediction model for metabolic syndrome in high altitude areas in Qinghai Province, China: A cross-sectional study. Diabetes Metab. Syndr. Obes. 2024, 17, 2041–2052. [Google Scholar] [CrossRef] [PubMed]
- Zhou, J.; He, R.; Shen, Z.; Zhang, Y.; Gao, X.; Dejiquzong; Xiao, X.; Zhang, T.; Yang, D.; Wang, Y.; Song, H.; Guo, Y.; Li, S.; Chen, G.; Yin, J.; Zhao, X. China Multi-Ethnic Cohort (CMEC) collaborative group. Altitude and metabolic syndrome in China: beneficial effects of healthy diet and physical activity. J. Glob. Health 2023, 13, 04061. [Google Scholar] [CrossRef] [PubMed]
- Boullata, J.; Williams, J.; Cottrell, F.; Hudson, L.; Compher, C. Accurate determination of energy needs in hospitalized patients. J. Am. Diet. Assoc. 2007, 107, 393–401. [Google Scholar] [CrossRef] [PubMed]
- Wasyluk, W.; Zwolak, A.; Jonckheer, J.; De Waele, E.; Dąbrowski, W. Methodological aspects of indirect calorimetry in patients with sepsis—possibilities and limitations. Nutrients 2022, 14, 930. [Google Scholar] [CrossRef] [PubMed]
- Porter, J.; Ward, L.C.; Nguo, K.; Davidson, Z.; Gibson, S.; Prentice, R.; Neuhouser, M.L.; Truby, H. Development and validation of new predictive equations for the resting metabolic rate of older adults aged ≥65 y. Am. J. Clin. Nutr. 2023, 117, 1164–1173. [Google Scholar] [CrossRef] [PubMed]
- Frankenfield, D.; Roth-Yousey, L.; Compher, C. Comparison of predictive equations for resting metabolic rate in healthy nonobese and obese adults: A systematic review. J. Am. Diet. Assoc. 2005, 105, 775–789. [Google Scholar] [CrossRef] [PubMed]
- Akaike, H. Information Theory and an Extension of the Maximum Likelihood Principle. In Selected Papers of Hirotugu Akaike. Springer Series in Statistics.; Parzen, E., Tanabe, K., Kitagawa, G., Eds.; Springer: New York, NY, 1998; pp. 199–213. [Google Scholar] [CrossRef]
- Bland, J.M.; Altman, D.G. Measuring agreement in method comparison studies. Stat. Methods Med. Res. 1999, 8, 135–160. [Google Scholar] [CrossRef] [PubMed]
- Mansournia, M.A.; Waters, R.; Nazemipour, M.; Bland, M.; Altman, D.G. Bland-Altman methods for comparing methods of measurement and response to criticisms. Glob. Epidemiol. 2020, 3, 100045. [Google Scholar] [CrossRef] [PubMed]
- Haghayegh, S.; Kang, H.-A.; Khoshnevis, S.; Smolensky, M.H.; Diller, K.R. A comprehensive guideline for Bland–Altman and intra class correlation calculations to properly compare two methods of measurement and interpret findings. Physiol. Meas. 2020, 41, 055012. [Google Scholar] [CrossRef] [PubMed]
- Zhou, W.; Su, H.; Tong, J.; Du, W.; Wang, B.; Chen, P.; Wan, H.; Zhou, M. Multiple factor assessment for determining resting metabolic rate in young adults. Sci. Rep. 2024, 14, 11821. [Google Scholar] [CrossRef] [PubMed]
- Lührmann, P.M.; Edelmann-Schäfer, B.; Neuhäuser-Berthold, M. Changes in resting metabolic rate in an elderly German population: Cross-sectional and longitudinal data. J. Nutr. Health Aging 2010, 14(3), 232–236. [Google Scholar] [CrossRef] [PubMed]
- Geisler, C.; Braun, W.; Pourhassan, M.; Schweitzer, L.; Glüer, C.-C.; Bosy-Westphal, A.; Müller, M.J. Age-Dependent Changes in Resting Energy Expenditure (REE): Insights from Detailed Body Composition Analysis in Normal and Overweight Healthy Caucasians. Nutrients 2016, 8, 322. [Google Scholar] [CrossRef] [PubMed]
- Zampino, M.; AlGhatrif, M.; Kuo, P.-L.; Simonsick, E.M.; Ferrucci, L. Longitudinal Changes in Resting Metabolic Rates with Aging Are Accelerated by Diseases. Nutrients 2020, 12, 3061. [Google Scholar] [CrossRef] [PubMed]
- Raberin, A.; Burtscher, J.; Burtscher, M.; Millet, G.P. Hypoxia and the aging cardiovascular system. Aging Dis. 2023, 14(6), 2051–2070. [Google Scholar] [CrossRef] [PubMed]
- Burtscher, J.; Samaja, M. Healthy aging at moderate altitudes: hypoxia and hormesis. Gerontology 2024, 70(11), 1152–1160. [Google Scholar] [CrossRef] [PubMed]
- Xiao, Y.; Li, Y.; Mao, Y.; et al. High altitude–mediated immune remodeling accelerates aging. Sci. Adv. 2026, 12(17), eaeb5599. [Google Scholar] [CrossRef] [PubMed]
- Lührmann, P.M.; Herbert, B.M.; Neuhäuser-Berthold, M. Effects of fat mass and body fat distribution on resting metabolic rate in the elderly. Metabolism 2001, 50, 972–975. [Google Scholar] [CrossRef] [PubMed]
- Khalaj Hedayati, K.; Dittmar, M. Body circumferences are predictors of weight adjusted resting energy expenditure in older people. J. Nutr. Health Aging 2011, 15, 803–808. [Google Scholar] [CrossRef] [PubMed]
- Chase, K.L.; Patek, K.T.; Walker, J.L.; Mettler, J.A. Predicting resting metabolic rate with easily obtained measures: The influence of body circumference. Transl. J. Am. Coll. Sports Med. 2021, 6, 1–12. [Google Scholar] [CrossRef]
- Nielsen, S.; Hensrud, D.D.; Romanski, S.; Levine, J.A.; Burguera, B.; Jensen, M.D. Body composition and resting energy expenditure in humans: Role of fat, fat-free mass and extracellular fluid. Int. J. Obes. Relat. Metab. Disord. 2000, 24, 1153–1157. [Google Scholar] [CrossRef] [PubMed]
- Maury-Sintjago, E.; Muñoz-Mendoza, C.; Rodríguez-Fernández, A.; Ruíz-De la Fuente, M. Predictive Equation to Estimate Resting Metabolic Rate in Older Chilean Women. Nutrients 2022, 14, 3199. [Google Scholar] [CrossRef] [PubMed]
- Pourhassan, M.; Daubert, D.; Wirth, R. Measured and Predicted Resting Energy Expenditure in Malnourished Older Hospitalized Patients: A Cross-Sectional and Longitudinal Comparison. Nutrients 2020, 12, 2240. [Google Scholar] [CrossRef] [PubMed]
- Siervo, M.; Bertoli, S.; Battezzati, A.; Wells, J.C.; Lara, J.; Ferraris, C.; Tagliabue, A. Accuracy of predictive equations for the measurement of resting energy expenditure in older subjects. Clin. Nutr. 2014, 33, 613–619. [Google Scholar] [CrossRef] [PubMed]
- Westerterp, K.R. Energy and water balance at high altitude. News Physiol. Sci. 2001, 16, 134–137. [Google Scholar] [CrossRef] [PubMed]
- Westerterp, K.R.; Kayser, B. Body mass regulation at altitude. Eur. J. Gastroenterol. Hepatol. 2006, 18, 1–3. [Google Scholar] [CrossRef] [PubMed]
- Palmer, B.F.; Clegg, D.J. Ascent to altitude as a weight loss method: The good and bad of hypoxia inducible factor activation. Obesity 2014, 22, 311–317. [Google Scholar] [CrossRef] [PubMed]
- Lippl, F.J.; Neubauer, S.; Schipfer, S.; Lichter, N.; Tufman, A.; Otto, B.; Fischer, R. Hypobaric hypoxia causes body weight reduction in obese subjects. Obesity 2010, 18, 675–681. [Google Scholar] [CrossRef] [PubMed]
- Hansen, J.; Sander, M. Sympathetic neural overactivity in healthy humans after prolonged exposure to hypobaric hypoxia. J. Physiol. 2003, 546, 921–929. [Google Scholar] [CrossRef] [PubMed]
- Richalet, J.-P.; Letournel, M.; Souberbielle, J.-C. Effects of high-altitude hypoxia on the hormonal response to hypothalamic factors. Am. J. Physiol. Regul. Integr. Comp. Physiol. 2010, 299, R1685–R1692. [Google Scholar] [CrossRef] [PubMed]
- Poehlman, E.T.; Toth, M.J.; Ades, P.A.; Calles-Escandon, J. Gender differences in resting metabolic rate and noradrenaline kinetics in older individuals. Eur. J. Clin. Invest. 1997, 27, 23–28. [Google Scholar] [CrossRef] [PubMed]
- Arciero, P.J.; Goran, M.I.; Poehlman, E.T. Resting metabolic rate is lower in women than in men. J. Appl. Physiol. 1993, 75, 2514–2520. [Google Scholar] [CrossRef] [PubMed]
- Buchholz, A.C.; Rafii, M.; Pencharz, P.B. Is resting metabolic rate different between men and women? Br. J. Nutr. 2001, 86, 641–646. [Google Scholar] [CrossRef] [PubMed]
- Wang, Z.; Ying, Z.; Bosy-Westphal, A.; Zhang, J.; Heller, M.; Later, W.; Heymsfield, S.B.; Müller, M.J. Evaluation of specific metabolic rates of major organs and tissues: comparison between nonobese and obese women. Obesity 2012, 20, 95–100. [Google Scholar] [CrossRef] [PubMed]
- Heymsfield, S.B.; Smith, B.; Dahle, J.; Kennedy, S.; Fearnbach, N.; Thomas, D.M.; Bosy-Westphal, A.; Müller, M.J. Resting energy expenditure: from cellular to whole-body level, a mechanistic historical perspective. Obesity 2021, 29, 500–511. [Google Scholar] [CrossRef] [PubMed]
- Neuhäuser-Berthold, M.; Herbert, B.M.; Lührmann, P.M.; Sültemeier, A.A.; Blum, W.F.; Frey, J.; Hebebrand, J. Resting metabolic rate, body composition, and serum leptin concentrations in a free-living elderly population. Eur. J. Endocrinol. 2000, 142, 486–492. [Google Scholar] [CrossRef] [PubMed]
- Serfaty, D.; Rein, M.; Schwarzfuchs, D.; Shelef, I.; Gepner, Y.; Bril, N.; Cohen, N.; Shemesh, E.; Sarusi, B.; Kovsan, J.; et al. Abdominal fat sub-depots and energy expenditure: Magnetic resonance imaging study. Clin. Nutr. 2017, 36, 804–811. [Google Scholar] [CrossRef] [PubMed]
- Scheja, L.; Heeren, J. The endocrine function of adipose tissues in health and cardiometabolic disease. Nat. Rev. Endocrinol. 2019, 15, 507–524. [Google Scholar] [CrossRef] [PubMed]
- Liu, Y.; Qian, S.-W.; Tang, Y.; Tang, Q.-Q. The secretory function of adipose tissues in metabolic regulation. Life Metab. 2024, 3, loae003. [Google Scholar] [CrossRef] [PubMed]
- Kawai, T.; Autieri, M.V.; Scalia, R. Adipose tissue inflammation and metabolic dysfunction in obesity. Am. J. Physiol. Cell Physiol. 2021, 320, C375–C391. [Google Scholar] [CrossRef] [PubMed]
- Kershaw, E.E.; Flier, J.S. Adipose tissue as an endocrine organ. J. Clin. Endocrinol. Metab. 2004, 89, 2548–2556. [Google Scholar] [CrossRef] [PubMed]
- Bettini, S.; Favaretto, F.; Compagnin, C.; Belligoli, A.; Sanna, M.; Fabris, R.; Serra, R.; Dal Prà, C.; Prevedello, L.; Foletto, M.; et al. Resting energy expenditure, insulin resistance and UCP1 expression in human subcutaneous and visceral adipose tissue of patients with obesity. Front. Endocrinol. 2019, 10, 548. [Google Scholar] [CrossRef] [PubMed]
- Francisco, V.; Pino, J.; Campos-Cabaleiro, V.; Ruiz-Fernández, C.; Mera, A.; Gonzalez-Gay, M.A.; Gómez, R.; Gualillo, O. Obesity, fat mass and immune system: Role for leptin. Front. Physiol. 2018, 9, 640. [Google Scholar] [CrossRef] [PubMed]
Figure 1.
Pearson and Spearman correlation analyses were conducted to examine the relationship between resting metabolic rate (RMR IC) and variables such as age, anthropometry, and body composition. a: 350 m group; b: 2000 m group; c: 2500 m group; d: 3500 m group.
Figure 1.
Pearson and Spearman correlation analyses were conducted to examine the relationship between resting metabolic rate (RMR IC) and variables such as age, anthropometry, and body composition. a: 350 m group; b: 2000 m group; c: 2500 m group; d: 3500 m group.
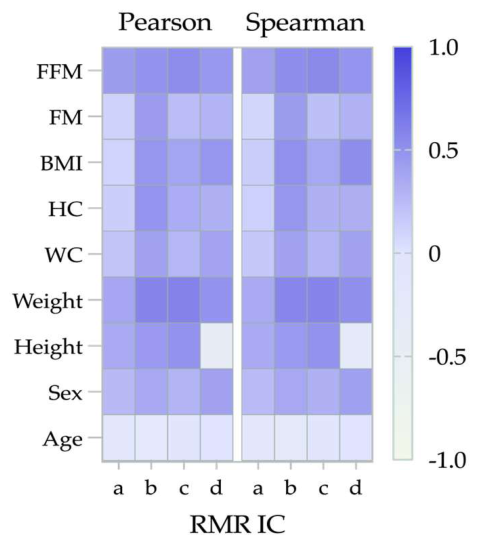
Figure 2.
Comparison of Resting Metabolic Rate: Indirect Calorimetry vs Prediction Equations Across Four Altitude Regions. IC: indirect calorimetry; a: proposal equation; b: FAO/WHO/UNU equation; c: Harris-Benedict equation; d: Mifflin-St Jeor equation; e: Owen equation; f: Poter equation.
Figure 2.
Comparison of Resting Metabolic Rate: Indirect Calorimetry vs Prediction Equations Across Four Altitude Regions. IC: indirect calorimetry; a: proposal equation; b: FAO/WHO/UNU equation; c: Harris-Benedict equation; d: Mifflin-St Jeor equation; e: Owen equation; f: Poter equation.
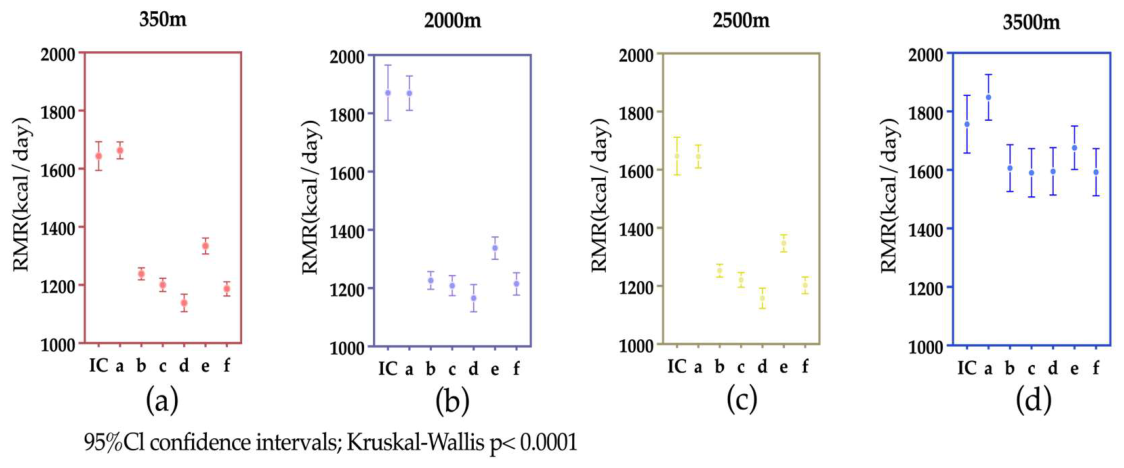
Figure 3.
Consistency between the RMR estimated by the proposed equation versus the RMR IC according to the Bland and Altman method.
Figure 3.
Consistency between the RMR estimated by the proposed equation versus the RMR IC according to the Bland and Altman method.
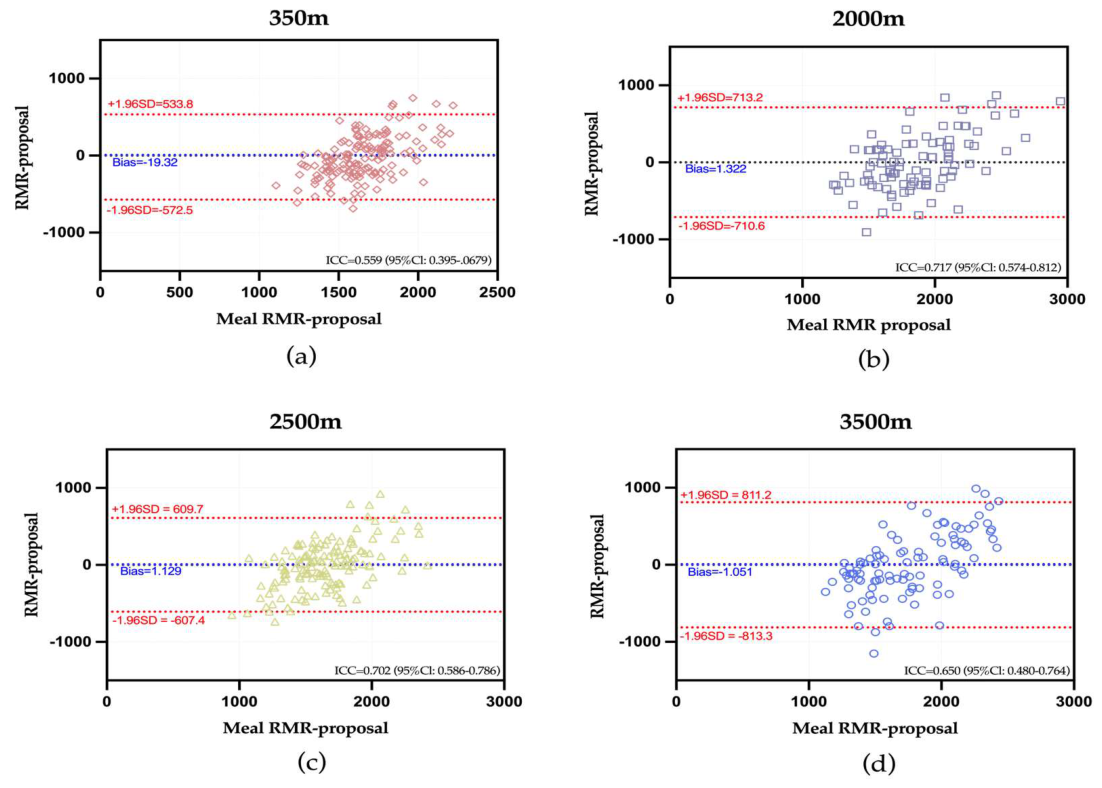
Table 1.
Age, anthropometry, body composition, and resting metabolic rate of the participants measured by indirect calorimetry.
Table 1.
Age, anthropometry, body composition, and resting metabolic rate of the participants measured by indirect calorimetry.
| Variable | 350m | 2000m | 2500m | 3500m | ||||
|---|---|---|---|---|---|---|---|---|
| Male (n=71) | Female (n=84) | Male (n=48) | Female (n=46) | Male (n=67) | Female (n=76) | Male (n=43) | Female (n=58) | |
| Age (y) | 70.0 (63.0;74.0) |
68.0 (62.0;71.0) |
67.0 (62.0;72.0) | 70.5 (62.0;75.3) |
68.0 (62.0;73.0) |
69.5 (63.3;75.0) |
68.0 (64.0;73.0) |
67.0 (62.0;70.0) |
| FM (kg) | 14.5±4.6 | 19.3±7.0 | 14.7±4.9 | 17.0±7.6 | 14.1±4.5 | 20.7±8.1 | 19.1±6.4 | 23.5±11.6 |
| FFM (kg) | 46.3±5.9 | 36.2±3.9 | 45.9±5.9 | 35.3±5.0 | 48.1±6.5 | 35.7±3.6 | 50.2±6.1 | 37.6±4.8 |
| RMR IC (kcal/day) |
1731.1±304.3 | 1570.1±300.1 | 2031.7±479.9 | 1702.6±384.9 | 1767.0±383.4 | 1540.6±369.1 | 1989.2±493.6 | 1583.7±436.2 |
FM: fat mass; FFM: fat-free mass; RMR IC: resting metabolic rate measured by indirect calorimetry.
Table 2.
Predictive equations used to estimate resting metabolic rate based on age, sex, waist circumference, hip circumference, fat mass, fat-free mass.
Table 2.
Predictive equations used to estimate resting metabolic rate based on age, sex, waist circumference, hip circumference, fat mass, fat-free mass.
| Regression Equation | P | R2 | SEE | AIC | ||
|---|---|---|---|---|---|---|
| 350m组(n=155) | ||||||
| RMR=1350.8-9.9Age+27.5Sex+5.8FM+21.5FFM | <0.001 | 0.28 | 314.4 | 1822.1 | (-0.16; 0.04; 0.11; 0.43) | |
| 2000m组(n=94) | ||||||
| RMR=1278.3-3.4Age+386.5Sex+35.5FM+1.6FFM | <0.001 | 0.39 | 371.3 | 1117.1 | (-0.05;0.42;0.49;0.03) | |
| 2500m组(n=143) | ||||||
| RMR=107.2+1.2Age-22.7Sex+15.9FM+28.6FFM | <0.001 | 0.37 | 315.0 | 1650.1 | (0.20;-0.03;0.30;0.59) | |
| 3500m组(n=101) | ||||||
| RMR=429.9+5.1Age+345.0Sex+10.4FFM+18.0FM | <0.001 | 0.32 | 423.0 | 1225.3 | (0.05; 0.34; 0.17; 0.36) | |
R2: coefficient of determination; SEE: standard error of estimate: AIC: akaike information criterion; RMR: resting metabolic rate; WC: waist circumference; HC: hip circumference; FM: fat mass; FFM: fat-free mass; Sex: (male=1, female=0).
Table 3.
Percent adequacy(underestimation/ overestimation) of predictive equations as related to resting metabolic rate measured by indirect calorimetry.
Table 3.
Percent adequacy(underestimation/ overestimation) of predictive equations as related to resting metabolic rate measured by indirect calorimetry.
| Predictive Equation | Underestimation (<90%) | Adequacy (90%to110%) | Overestimation (>110%) |
|---|---|---|---|
| 350m group (n=155) | |||
| Proposal | 24.7 | 39.2 | 36.1 |
| 2000m group (n=94) | |||
| Proposal | 28.7 | 35.1 | 36.2 |
| 2500m group (n=143) | |||
| Proposal | 24.4 | 47.6 | 28.0 |
| 3500m group (n=101) | |||
| Proposal | 28.8 | 35.6 | 35.6 |
Disclaimer/Publisher’s Note: The statements, opinions and data contained in all publications are solely those of the individual author(s) and contributor(s) and not of MDPI and/or the editor(s). MDPI and/or the editor(s) disclaim responsibility for any injury to people or property resulting from any ideas, methods, instructions or products referred to in the content. |
© 2026 by the authors. Licensee MDPI, Basel, Switzerland. This article is an open access article distributed under the terms and conditions of the Creative Commons Attribution (CC BY) license (http://creativecommons.org/licenses/by/4.0/).
Copyright: This open access article is published under a Creative Commons CC BY 4.0 license, which permit the free download, distribution, and reuse, provided that the author and preprint are cited in any reuse.