

Submitted:
15 September 2026
Posted:
16 September 2026
You are already at the latest version
Abstract
Pressure-limited dynamic capacity in the Lopín structure is controlled primarily by reservoir transmissibility rather than by static pore volume. This study applies a MATLAB/MRST vertical-equilibrium (VE) workflow to the Lopín horst, a deep Triassic Buntsandstein aquifer in the Ebro Basin, NE Spain, and evaluates the sensitivity of the results to seven petrophysical, fluid, and operational parameters using a one-at-a-time sensitivity design (35 sensitivity cases plus one base case). Across the tested range, horizontal permeability produced the largest variation in maximum injectable CO₂ mass, from 4.67 to 16.25 Mt (range 11.59 Mt), followed by the adopted BHP threshold (range 5.33 Mt) and CO₂ density (range 4.74 Mt). Porosity and brine compressibility had only minor effects, whereas injection rate and residual CO₂ saturation did not change the BHP-limited capacity under the adopted capacity-search formulation. The base-case operational BHP limit was 28.5 MPa, selected below the site-specific allowable and estimated fracture-pressure thresholds reported for Lopín. These results show that pressure dissipation, hydraulic transmissibility, and the explicit choice of operational pressure criterion are the dominant controls on dynamic CO₂ storage capacity in this fault-bounded saline aquifer.
Keywords:
geological CO₂ storage
; dynamic storage capacity
; bottom-hole pressure
; vertical equilibrium
; MRST
; Lopín horst
1. Introduction
Geological storage of CO₂ is widely recognized as a key component of carbon capture and storage (CCS) strategies for reducing emissions from industrial sectors that are difficult to decarbonize through electrification alone [1,2]. Among the available geological options, deep saline aquifers are particularly relevant because of their broad distribution in sedimentary basins and their high theoretical storage potential [1,3,4]. However, these systems present specific technical challenges, including limited prior subsurface information, buoyancy-driven CO₂ migration, brine displacement, lower storage efficiency than depleted hydrocarbon reservoirs, and pressure build-up during injection [3,4]. Therefore, reliable assessment of saline aquifer storage sites requires not only estimating available pore volume, but also dynamically analysing pressure evolution, injectivity, plume migration, and long-term containment.
The concept of CO₂ storage capacity has evolved from static volumetric estimation toward dynamic, pressure-constrained assessments. Static methods commonly estimate capacity as a fraction of the available pore volume using storage-efficiency coefficients [5]. These approaches are useful for regional screening, but they do not fully capture the hydraulic response of the reservoir during injection. Several studies have shown that pressure build-up may become a primary limitation on the effective capacity of deep saline aquifers, especially in closed or semi-closed systems where displaced brine cannot dissipate freely [6,7,8,9]. In such cases, the technically achievable capacity may be significantly lower than the theoretical volumetric capacity, and the maximum injectable mass is controlled by reservoir transmissibility, boundary conditions, well configuration, injection strategy, and admissible pressure thresholds.
Regarding pressure management is closely linked to storage safety. Quick pressure increase may sometimes compromise seal integrity, induce hydraulic fracturing, reactivate faults, or generate leakage pathways through pre-existing discontinuities [6,7,10]. For this reason, operational storage assessments commonly incorporate bottom-hole pressure (BHP) limits or other admissible pressure criteria as practical constraints on injection. These thresholds establish a link between multiphase-flow simulation and geomechanical safety, even when fully coupled hydro-mechanical modelling is not yet available. Consequently, pressure-limited dynamic capacity should be reported together with the adopted pressure criterion and its geological or geomechanical justification.
In this sense, numerical simulation provides the most appropriate framework for evaluating pressure-limited dynamic capacity because it can represent the coupled effects of multiphase flow, buoyancy, pressure propagation, fluid properties, and operational constraints. Three-dimensional models can capture geological heterogeneity in detail, but their computational cost increases considerably when long-term post-injection behaviour, uncertainty, or multiple sensitivity scenarios must be analysed. Vertical-equilibrium (VE) models offer an efficient alternative for laterally extensive saline aquifers, where vertical segregation of CO₂ by buoyancy occurs faster than large-scale lateral migration [11,12]. In VE formulations, the three-dimensional problem is reduced to a vertically integrated representation that preserves the dominant physics of buoyancy-driven migration, pressure dissipation, and regional plume evolution.
The MATLAB Reservoir Simulation Toolbox (MRST) [15] and its co2lab module [SINTEF] have played an important role in developing open-source workflows for geological CO₂ storage modelling. MRST-co2lab includes tools for structural trapping analysis, spill-point identification, VE simulation, long-term migration assessment, and basin-scale capacity estimation [12,13,14,15,16,34]. Previous MRST/co2lab studies have demonstrated the value of vertically integrated models for estimating trapping capacity, optimizing aquifer-wide storage, and simulating large-scale CO₂ migration over long time scales [13,14,15,16,17]. Recent work has also demonstrated three-dimensional geological CO₂ sequestration simulations using MRST [33], while other studies have expanded the use of VE and reduced-complexity models to evaluate storage efficiency, well placement, and computationally efficient sensitivity workflows [18,19,20]. These advances show that VE and MRST-based approaches are well established; however, their application to real cases of fault bounded saline aquifers, considering site specific pressure limits and systematic BHP constrained capacity ranking, remains poorly studied.
In Spain, CO₂ storage research has advanced through national screening initiatives, site specific characterization studies, and European collaborative projects. The ALGECO2 initiative provided an early framework for identifying suitable structures for geological storage. Subsequent studies focused on the Hontomín experimental plant and on the petrographic, hydraulic, geological, and geochemical characterization of potential reservoirs and seals [21,22,23,24,25]. In the Ebro Basin, recent work has highlighted the potential of several structures and has applied integrated geological and geophysical methodologies to the Lopín structure [26]. European initiatives including STRATEGY CCUS, PilotSTRATEGY, and GSEU have further reinforced interest in deep saline aquifers as a strategic resource for regional decarbonization [27,28,29,30,31,32,35].
Despite these advances, a specific gap of knowledge remains at the intersection of pressure-limited dynamic capacity, and fault-bounded saline aquifers. Previous studies have provided important advances in static capacity estimation, pressure-constrained capacity theory, VE model development, MRST/co2lab workflows, and characterization of Spanish storage sites [5,6,7,8,9,10,11,12,13,14,15,16,17,18,19,20,21,22,23,24,25,26,27,28,29,30,31,32,33,34,35]. However, few published studies combine: (i) a real ECLIPSE/GRDECL geocelular model, where GRDECL refers to the grid and property-deck format commonly used by reservoir simulators, of an onshore saline aquifers in Spain; (ii) a VE workflow adapted to a fault-bounded horst structure; (iii) mixed hydraulic boundary conditions representing partial lateral connection with the regional aquifer; and (iv) a systematic one-at-a-time ranking of BHP-limited dynamic capacity.
The Lopín structure, located in the southern sector of the Ebro Basin (Spain), provides a suitable case study to address this gap. The target reservoir, confined by low-permeability sealing units and bounded by normal faults, makes this structural configuration in Lopín particularly relevant for analyzing how permeability, lateral pressure dissipation, hydraulic boundary conditions, and operational pressure limits control dynamic storage capacity. In this context, the present study develops and applies a MATLAB/MRST VE workflow to quantify the parametric controls on pressure-limited CO₂ storage capacity in the Lopín structure.
The central hypothesis of this work is that, in fault-bounded saline aquifers such as Lopín, operational CO₂ storage capacity is governed more strongly by pressure dissipation and hydraulic transmissibility than by static pore volume alone. To test this hypothesis, the study uses a probabilistic realization with two injection wells, mixed hydraulic boundary conditions, and a BHP-constrained capacity-search algorithm over a 30-year injection period. A one-at-a-time sensitivity analysis is then performed on seven parameter groups: porosity, horizontal permeability, injection rate, BHP limit, brine compressibility, residual CO₂ saturation, and CO₂ density. By identifying the parameters that most strongly control dynamic capacity, this work aims to support early-stage site characterization, pilot design, and preliminary safety assessment of structurally compartmentalized saline aquifers.
2. Geological setting
The Lopín structure is located in the southern sector of the Ebro Basin, northeastern Spain (Figure 1 and Figure 2). The Ebro Basin is one of the major sedimentary basins of the Iberian Peninsula and contains several deep geological formations that have been evaluated for subsurface energy applications and CO₂ storage [24,25,26,27,28]. Within this setting, Lopín is an onshore, fault-bounded structural high selected as a candidate site within the H2020 PilotSTRATEGY project as a candidate site for geological CO₂ storage [27,28].
Structurally, Lopín is interpreted as a NW-SE-trending horst bounded by normal faults (Figure 3). The main target reservoir is the Triassic Buntsandstein B1 unit, a sandstone formation located at approximately 1760 m depth. The reservoir is overlain by low-permeability Triassic clay-rich and evaporitic units that constitute the main sealing interval. The fault-bounded geometry is relevant for storage assessment because it may control both hydraulic compartmentalization and lateral pressure dissipation [26,27,28].
3. Dataset and Methods
3.1. Dataset
The geological and petrophysical data used in this study were provided by IGME-CSIC within the PilotSTRATEGY project in ECLIPSE/GRDECL format [27,28]. The files included the three-dimensional reservoir geometry, porosity distribution, horizontal permeability fields, geological units, shale volume, active-cell mask, and fault traces.
The original geocelular model contains 160,532 active cells. From this model, a VE representation was generated with 2820 columns, of which 2808 were active for simulation. The P10, P50, and P90 probabilistic realizations were supplied by IGME-CSIC as pre-built ECLIPSE/GRDECL models generated within the upstream PilotSTRATEGY geological-modelling workflow; their generation and calibration were not performed as part of this study. Accordingly, the present work treats them as externally provided geological uncertainty realizations. The P50 realization was selected as the reference case because it represents the central condition of the available dataset, whereas P10 and P90 define the broader uncertainty context.
The pressure-limited dynamic capacity, hereafter CapBHP, is defined as the maximum injectable CO₂ mass over 30 years that does not exceed the adopted BHP limit.
3.2. Methodology
3.2.1. Modelling Approach
CO₂ injection and migration were simulated using a VE approach in MATLAB/MRST. The formulation assumes that buoyant CO₂ segregates rapidly toward the top of the reservoir compared with large-scale lateral migration. Under these conditions, each vertical reservoir column can be represented through integrated variables, allowing the model to capture reservoir-scale pressure evolution and plume migration at a lower computational cost than a full three-dimensional multiphase model.
The main dynamic variables were pore pressure and accumulated CO₂ height in each column. From these variables, equivalent CO₂ saturation, plume extent, pressure evolution, and trapping indicators were estimated during the injection and post-injection periods. MRST/co2lab served as a conceptual and computational reference, but the workflow was adapted to the Lopín geometry to control directly the vertical integration of the original 3D geocelular grid into VE columns, the mixed boundary conditions, the well configuration, and the iterative BHP-limited capacity search.
The numerical workflow followed five main stages: 1) input-data preparation, 2) conversion from the 3D grid to the VE grid, 3) Application of the MRST’s fully implicit Newton-AD solver to calculate the pressure and CO₂-height variables, 4) BHP-based injection control, and 5) post-processing of plume geometry, pressure evolution, dynamic capacity, trapping inventory, and mass balance (Figure 4).
3.2.2. Boundary Conditions, Wells, and Capacity Criterion
The geological configuration of the Lopín horst was represented in the numerical model using mixed hydraulic boundary conditions to simulate a partially open system. The northern and southern boundaries, corresponding to the main faults that structurally bound the horst, were defined as no-flow boundaries. In contrast, the eastern and western boundaries were assigned hydrostatic pressure conditions to represent lateral hydraulic connection with the regional aquifer. This configuration represents an intermediate hydraulic behaviour between a closed structural compartment and a fully open saline aquifer.
Injection was simulated through two active wells, C1 and C2. C1 is located on the northwestern flank and C2 near the structural crest (Figure 6); therefore, this pair was selected as the reference configuration to distribute injection and reduce local pressure build-up. The nominal total injection rate for the reference scenario was 0.254 Mt/year over 30 years, distributed between both wells. The complete set of base-case parameters is summarized in Table 1.
Dynamic storage capacity was defined as the maximum mass of CO₂ that can be injected over the 30-year period without exceeding the selected operational BHP criterion (28.5 MPa). This definition distinguishes pressure-constrained dynamic capacity from static pore-volume capacity and explicitly links the capacity estimate to an operational pressure constraint.
The reference BHP limit was set to 28.5 MPa as a conservative operational constraint within the site-specific geomechanical pressure envelope reported for Lopín [28]. This threshold is 1.1 MPa below P90 scenario (P90 = 29.6 MPa), 2.0 MPa below the allowable pressure (pAllow = 30.5 MPa), and 4.4 MPa below the estimated fracture pressure (pFrac = 32.9 Mpa). The 28.5 MPa value is therefore not interpreted as the fracture pressure itself, but as a modelling threshold that preserves a pressure buffer to the upper geomechanical limits. The sensitivity analysis subsequently varies this operational threshold from 26.31 to 30.50 MPa to quantify how the selected pressure criterion affects dynamic capacity. The reference pressure evolution is contextualized against the site-specific p80, p90, pAllow, and pFrac levels in Figure 5; these contextual lines do not control the capacity-search algorithm.
3.2.3. Sensitivity Analysis Design
The central objective of the sensitivity analysis was to identify which parameters exert the strongest control on pressure-limited dynamic storage capacity. For this purpose, a one-at-a-time (OAT) analysis was applied, in which one parameter is modified while all others remain at their base-case values to evaluate the real impact of the variation of this parameter over the modelling.
Seven parameter groups were evaluated: porosity, permeability, injection rate, BHP limit, brine compressibility, residual CO₂ saturation, and CO₂ density. Each parameter group was evaluated using five prescribed parameter values, resulting in 35 sensitivity simulations plus one base case, for a total of 36 simulations. The tested parameters and base values are summarized in Table 2. The system response was evaluated using two indicators: pressure-limited dynamic capacity, expressed in Mt CO₂, and maximum pressure reached during the simulation, expressed in MPa.
4. Results
The results presented in this section correspond to the P50 reference case, using the C1–C2 well configuration and mixed hydraulic boundary conditions described in Section 3.2.2. This configuration was kept fixed throughout the sensitivity analysis to isolate the influence of petrophysical, fluid, and operational parameters on pressure-limited dynamic capacity.
Two different simulation outputs are reported. First, the P50 reference simulation follows the injection of 8.46 Mt of CO₂ over 30 years and evaluates pressure evolution, plume migration, and trapping behaviour during 1000 years of post-injection. Second, the BHP-limited capacity search estimates the maximum injectable mass over the same 30-year injection period without exceeding the adopted operational pressure limit. The reference injected mass and the maximum pressure-limited capacity are therefore not the same quantity.
4.1. Pressure Evolution, Plume Migration, and Dynamic Capacity
In the long-term P50 reference simulation, approximately 8.46 Mt CO₂ are injected over 30 years. Maximum pressure increases during injection, reaches its peak near the end of the injection phase, and then decreases rapidly once injection stops. This decline reflects pressure dissipation through the hydraulically open east-west boundaries, whereas the north and south boundaries, associated with faults, restrict transverse flow.
The maximum-pressure curve exceeds the conservative p80 threshold during injection and approaches the threshold corresponding to 90% of the fracture pressure but remains below the allowable-pressure and estimated fracture-pressure criteria. This behaviour indicates that the reference configuration preserves a safety margin with respect to the upper limits, although it temporarily operates within the conservative alert zone.
Plume migration is governed by buoyancy-driven upward segregation within each VE column and lateral spreading beneath the seal (Figure 6). At early injection times, the plume develops around C1 and C2 sites as two separate accumulations. By the end of injection, both accumulations expand laterally following the structural relief of the reservoir top. During post-injection, the plume continues to redistribute, increases its lateral extent, and preferentially concentrates in structurally shallower areas.
4.2. Storage Mechanisms
The long-term reference simulation indicates that storage security evolves after the end of injection as the CO₂ plume redistributes beneath the vertical seal and is progressively partitioned among mobile, residual, structural, and dissolved fractions. During the post-injection period, part of the mobile CO₂ becomes immobilized by residual trapping as the plume migrates, while another fraction is retained in local structural closures or dissolves into the brine.
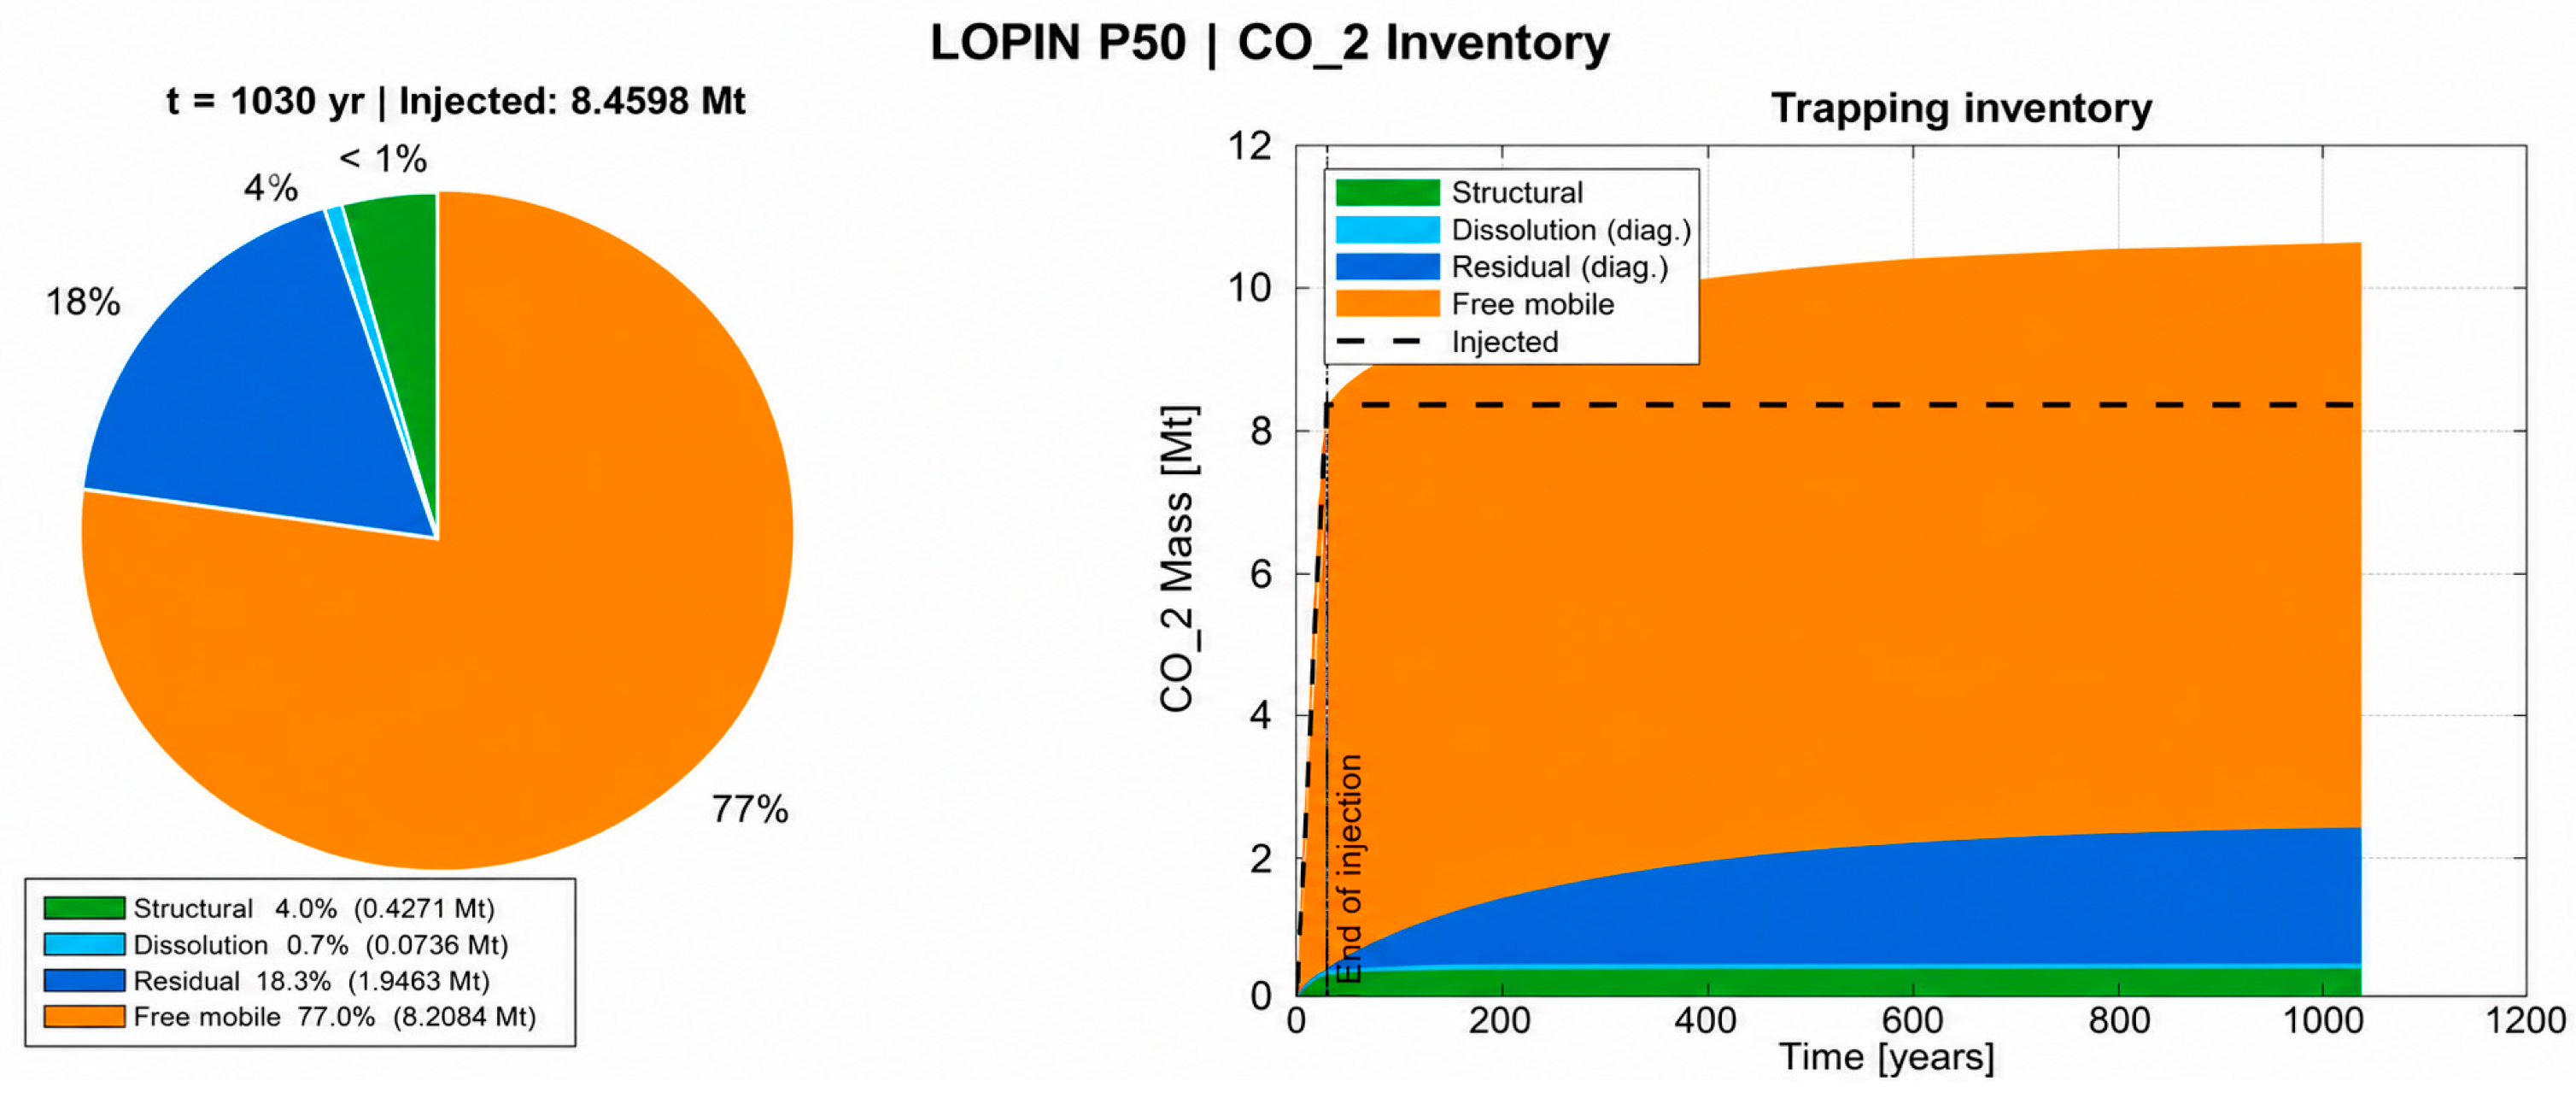
At 1030 years, the diagnostic inventory indicates that approximately 77% of the CO₂ remains mobile, 18% is residually trapped, 4% is structurally trapped, and less than 1% is dissolved (Figure 7). These results show that, for the simulated configuration, storage security depends not only on structural retention but also on the progressive evolution of residual trapping. At the same time, the high proportion of mobile CO₂ underlines the importance of evaluating long-term plume migration and seal continuity.
Figure 6.
Spatial evolution of integrated CO₂ plume height in the P50 reference scenario, arranged as a 2-column × 3-row sequence for improved readability. Panels show t = 0, 5.1, and 30 years during injection, followed by t = 30, 295, and 1030 years during post-injection. Stars indicate the C1 and C2 injection wells; coloured cells represent integrated CO₂ height h, and contours show reservoir-top depth and the structural framework controlling migration.
Figure 6.
Spatial evolution of integrated CO₂ plume height in the P50 reference scenario, arranged as a 2-column × 3-row sequence for improved readability. Panels show t = 0, 5.1, and 30 years during injection, followed by t = 30, 295, and 1030 years during post-injection. Stars indicate the C1 and C2 injection wells; coloured cells represent integrated CO₂ height h, and contours show reservoir-top depth and the structural framework controlling migration.
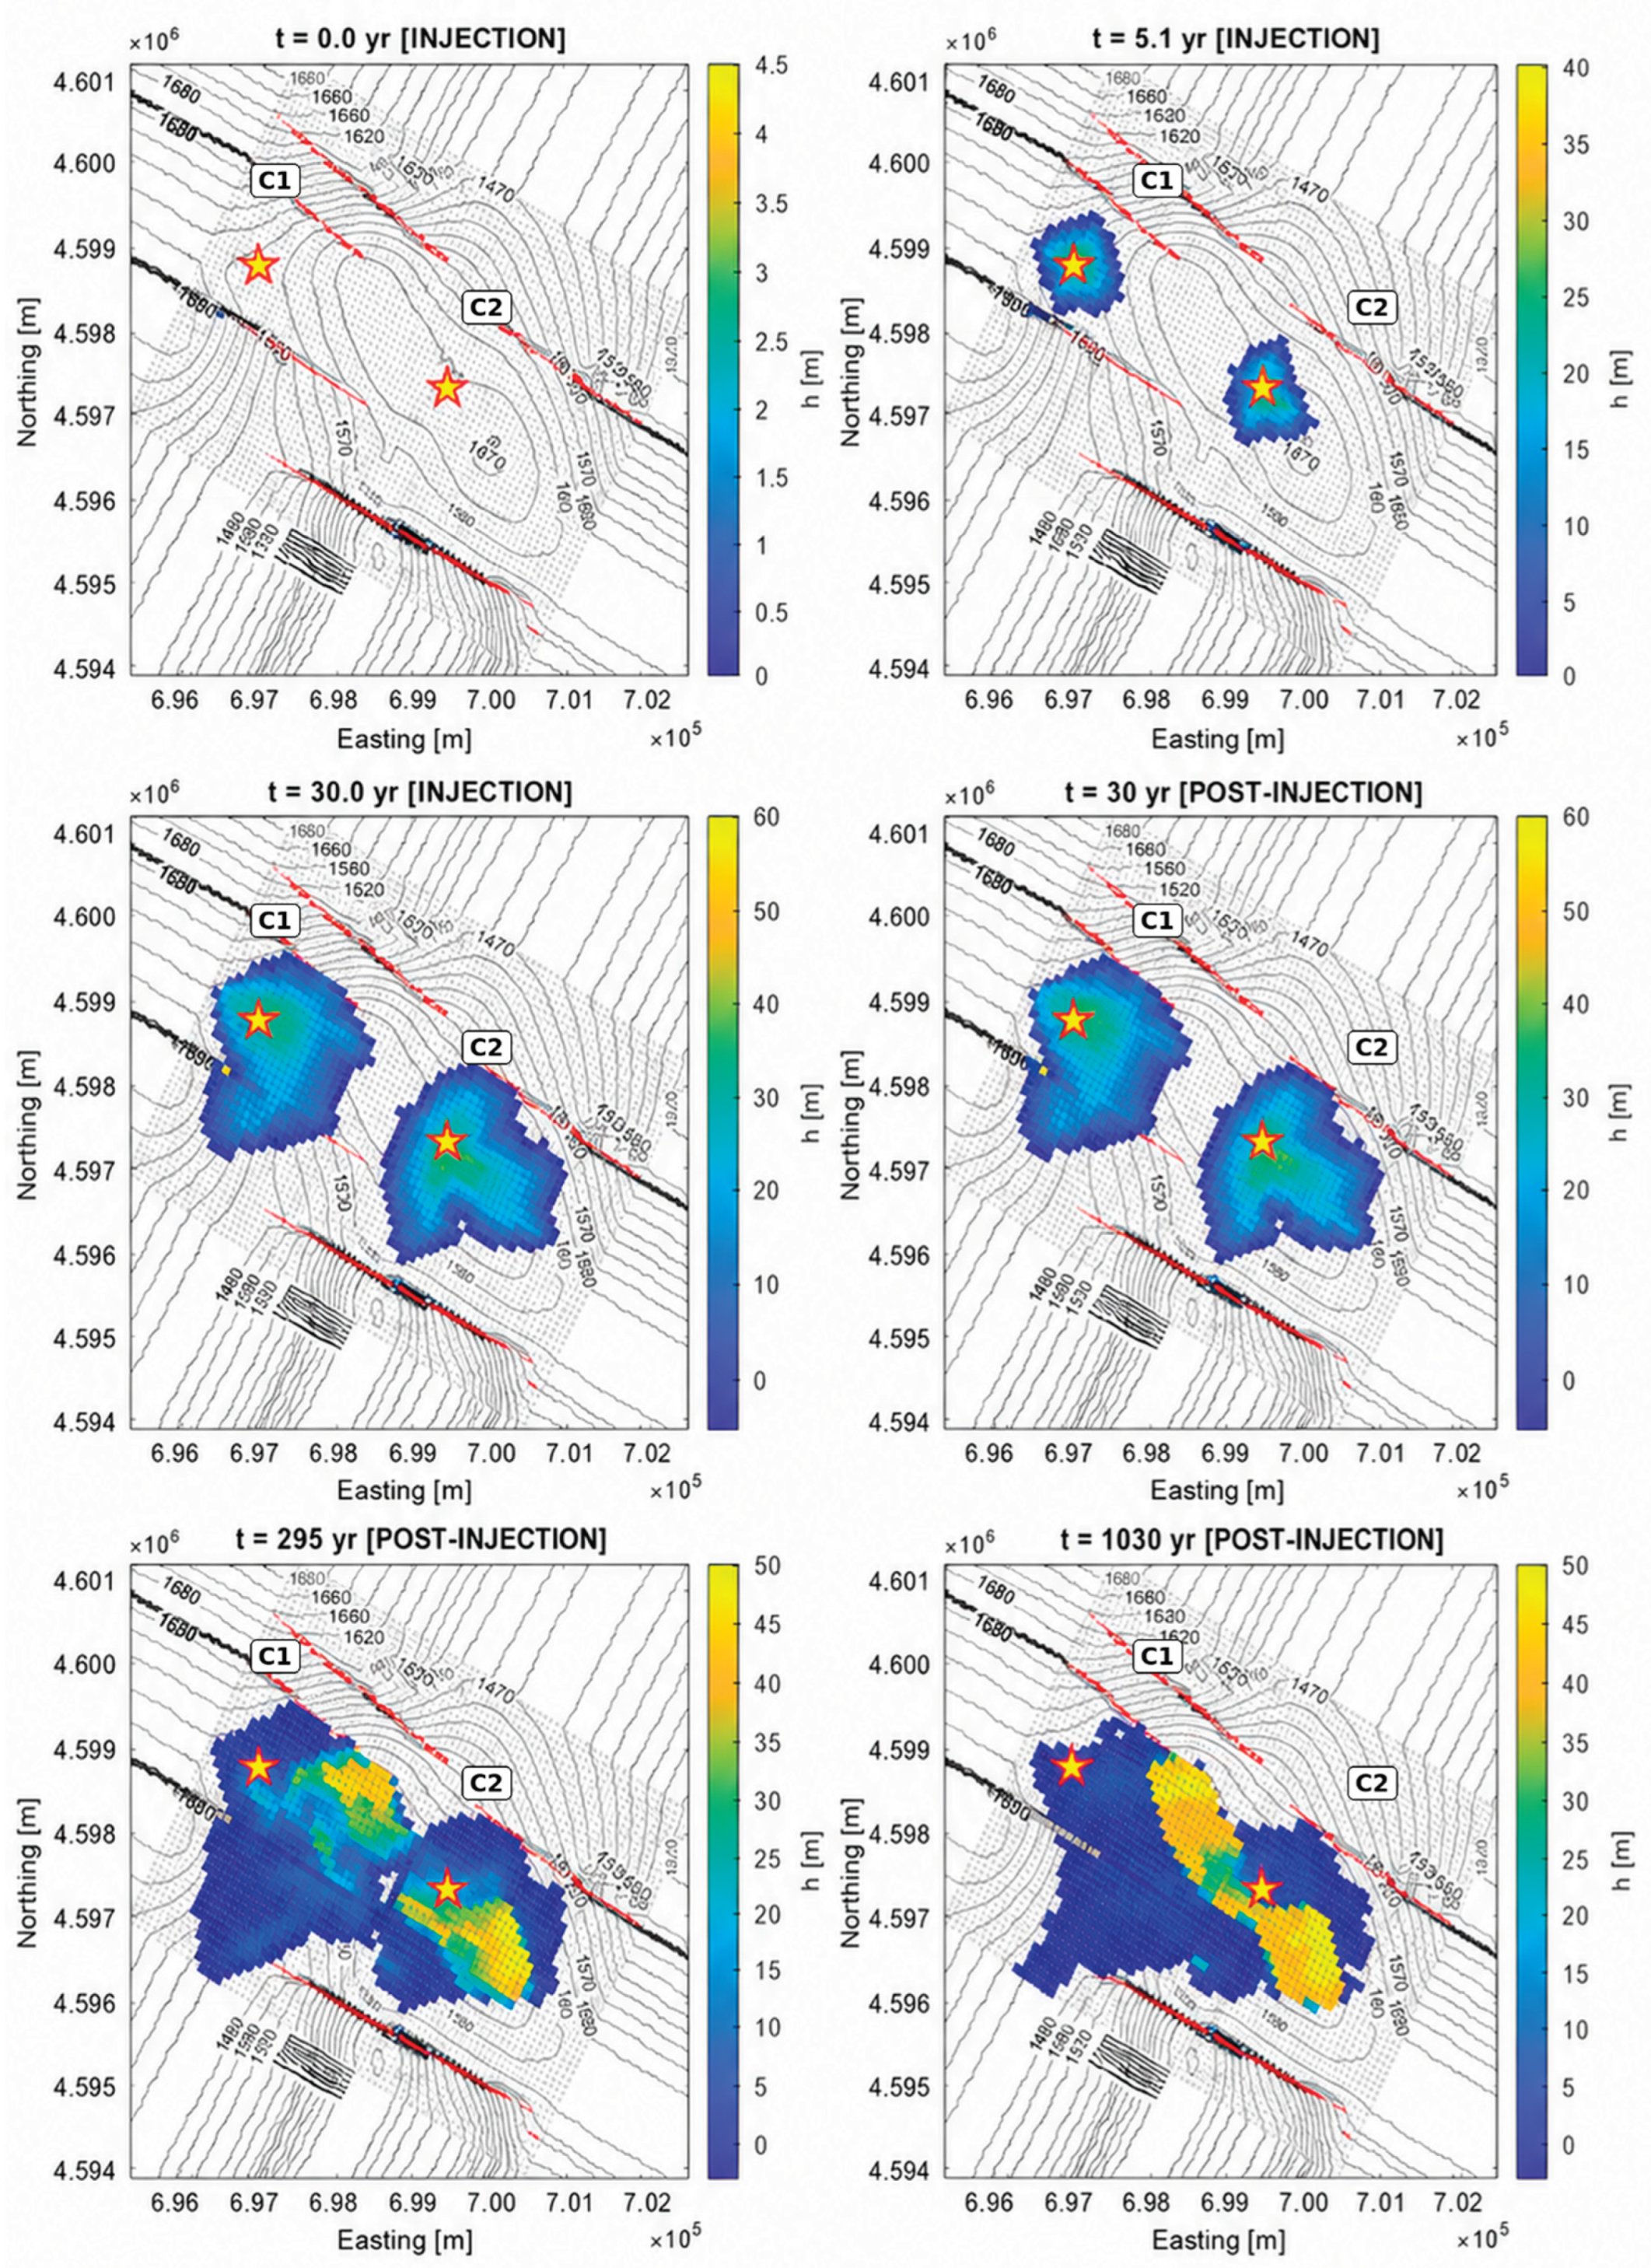
Figure 7.
CO₂ trapping inventory for the P50 reference scenario. Left: final partitioning of CO₂ among structural, dissolved, residual, and mobile fractions after 1030 years. Right: temporal evolution of the trapping inventory throughout the full simulation, including cumulative injected mass.
Figure 7.
CO₂ trapping inventory for the P50 reference scenario. Left: final partitioning of CO₂ among structural, dissolved, residual, and mobile fractions after 1030 years. Right: temporal evolution of the trapping inventory throughout the full simulation, including cumulative injected mass.
4.3. Parametric Sensitivity Ranking of Dynamic Capacity
The P50 reference case, using the C1–C2 well configuration and mixed boundary conditions, fixed throughout the sensitivity analysis, allows the individual influence of petrophysical, fluid, and operational parameters on pressure-limited dynamic capacity to be isolated. The one-at-a-time (OAT) analysis described in Section 3.2.3 varies each parameter group independently while keeping the others at their base-case values.
Among the seven parameter groups, horizontal permeability appears to be the dominant controlling factor. When the permeability multiplier varies between ×0.25 and ×4.00, Cap_BHP ranges from 4.665 to 16.252 Mt, with a total range of 11.588 Mt. This range is approximately 107.7% of the base-case capacity (Table 3; Figure 8). Here, Cap_BHP denotes the maximum injectable CO₂ mass over the 30-year injection period without exceeding the adopted BHP limit.
The second most influential parameter is the BHP limit. When the admissible pressure threshold varies between 26.31 and 30.50 MPa, capacity changes from 7.931 to 13.257 Mt, corresponding to a range of 5.326 Mt. This confirms that the operational definition of the pressure limit has a direct effect on the maximum injectable mass.
The third most influential parameter is CO₂ density. Over the evaluated range between 550 and 850 kg/m³, capacity varies from 8.347 to 13.090 Mt, with a range of 4.743 Mt. Together, these three parameters permeability, BHP limit, and CO₂ density explain nearly all relevant variability in pressure-limited dynamic capacity. In contrast, porosity and brine compressibility show much smaller influence, while injection rate and residual CO₂ saturation do not change Cap_BHP under the adopted search formulation.
Permeability exhibits the strongest and non linear response (Figure 9). When the permeability multiplier is reduced to ×0.25, capacity decreases to 4.66 Mt, indicating a strong limitation in lateral pressure dissipation. With a multiplier of ×0.50, capacity increases to 6.60 Mt but remains clearly below the base case. In contrast, doubling permeability increases capacity to 16.25 Mt, the maximum robust value obtained across the sensitivity set. The ×4.00 case produced an anomalous numerical response with non-finite maximum pressure and should therefore be interpreted as solver instability under extreme conditions rather than as a physical capacity reduction.
The BHP limit acts as direct design control. When the conservative threshold of 26.31 MPa is used, maximum capacity decreases to 7.93 Mt. When the criterion is relaxed to 30.50 MPa, capacity increases to 13.25 Mt. This difference shows that the selected pressure limit can have an impact comparable to key physical properties of the storage system.
CO₂ density also significantly affects capacity. At the lowest evaluated density, 550 kg/m³, capacity decreases to 8.34 Mt. At the highest density, 850 kg/m³, it increases to 13.090 Mt. This response indicates that thermodynamic fluid properties influence pressure behaviour and, consequently, the maximum mass that can be injected under the BHP criterion.
4.4. Secondary Control Mechanisms
Porosity has a limited effect on dynamic capacity. Although changing porosity modifies available pore volume, the capacity range remains narrow, between 10.34 and 10.76 Mt. This indicates that, under the evaluated conditions, pore volume is not the primary operational limitation.
Brine compressibility also produces a minor variation, with capacities between 10.59 and 10.92 Mt. This effect is consistent with the role of compressibility in pressure propagation, although its magnitude is much smaller than that of permeability or the BHP limit.
Injection rate does not modify the maximum capacity estimated by the BHP-search algorithm, which remains 10.76 Mt for all evaluated levels. This does not mean that injection rate is operationally irrelevant. Maximum pressure increases from 23.49 MPa at 0.15 Mt/year to 28.60 MPa at 0.40 Mt/year, placing the highest-rate case close to the operational BHP limit. Therefore, injection rate remains important for operational design, even if it does not change the final BHP-limited capacity calculated by the search algorithm.
Residual CO₂ saturation also does not modify Cap_BHP over the evaluated range. Capacity remains constant at 10.760 Mt. This result reflects the fact that the capacity criterion is controlled by injection-period pressure, whereas residual saturation mainly affects post-injection redistribution and trapping.
4.5. Secondary Control Mechanisms
The heatmap provides a compact comparison of the 35 sensitivity cases relative to the base case (Figure 10). The largest relative changes are concentrated in permeability, BHP limit, and CO₂ density. Levels associated with porosity, brine compressibility, injection rate, and residual CO₂ saturation show small or negligible changes in dynamic capacity.
This visual synthesis reinforces the main result of the analysis: under the evaluated configuration, the operational capacity of the Lopín system is controlled primarily by the reservoir’s ability to dissipate pressure rather than by static pore volume alone.
5. Discussion
5.1. Pressure-Limited Dynamic Capacity and Dominant Controls
The results show that CO₂ storage capacity in the Lopín structure cannot be interpreted solely as a function of available pore volume. Although porosity defines the physical space potentially available for CO₂ storage, its influence on pressure-limited dynamic capacity was secondary within the tested range. In contrast, horizontal permeability, the BHP limit, and CO₂ density explained most of the observed variability in maximum injectable mass.
This behaviour supports the central hypothesis of the study: in fault-bounded saline aquifers, operational capacity depends primarily on the ability of the system to dissipate injection-induced overpressure. Therefore, the limiting factor is not simply how much CO₂ can be accommodated within the reservoir pore volume, but how much CO₂ can be injected without exceeding admissible pressure limits. This distinction is fundamental because static volumetric estimates may overestimate effective capacity when pressure evolution is not explicitly considered [3,5,12].
Horizontal permeability was the dominant parameter in the analysis. Its effect is explained by its control on reservoir transmissibility and, therefore, on the ability of the brine displaced by CO₂ injection to redistribute laterally [5,6]. Lower permeability promotes pressure build-up near the injection wells and reduces the maximum injectable mass. Conversely, higher permeability enhances pressure dissipation and increases capacity before the pressure limit is reached. In this sense, permeability is not only a petrophysical property of the reservoir, but also direct control on the operational feasibility of storage.
The BHP limit appears as the second main control. In the base case, 28.5 MPa is used as an operational modelling threshold rather than as a fracture-pressure estimate. Its position below p90, pAllow, and pFrac preserves an explicit pressure buffer to the site-specific geomechanical limits reported for Lopín [28]. The sensitivity range from 26.31 to 30.50 MPa therefore quantifies how different conservative-to-permissive operational criteria affect the inferred dynamic capacity; it does not imply that all tested thresholds are equally acceptable for field operation. A final injection design would require site-specific coupled geomechanical analysis and validation of fault and seal stability. CO₂ density also has a significant influence because it modifies the relationship among injected mass, occupied volume, buoyancy, and pressure response.
5.2. Implications for Site Characterization and Pilot Design
The results have direct implications for early-stage geological CO₂ storage assessment. For systems like Lopín, the priority should not be limited to refining the available pore volume but should also focus on reducing uncertainty in the parameters that control pressure dissipation. Characterization of reservoir permeability and lateral transmissibility should be considered a priority, as these factors condition operational capacity under pressure constraints.
The definition of the BHP limit is also a critical design decision. A more conservative threshold reduces the estimated capacity, whereas a more permissive limit increases the maximum injectable mass. However, such an increase is acceptable only when supported by site-specific geomechanical evidence. In the present model, the 28.5 MPa base-case threshold provides a conservative buffer to the p90, pAllow, and pFrac values reported for Lopín [28]. BHP therefore functions as an operational link between hydraulic simulation and mechanical safety, but it does not replace coupled geomechanical assessment of reservoir deformation, fault stability, or induced-fracturing risk [6,10].
The influence of CO₂ density indicates that fluid properties must also be treated carefully. This study used constant values to explore sensitivity trends, but a more advanced assessment should incorporate pressure-, temperature-, and salinity-dependent properties through equations of state. This would reduce uncertainty in absolute capacity estimation and improve the representation of CO₂ behaviour under reservoir conditions.
5.3. Model Limitations
The VE approach enabled multiple sensitivity scenarios to be explored efficiently, but it has limitations that must be acknowledged. The formulation assumes that CO₂ segregates rapidly toward the top of the reservoir and that the main dynamics can be represented through vertically integrated columns [11,12]. This approximation is suitable for preliminary prospect-scale assessment, providing a more detailed level of analysis than regional-scale screening. However, it may not capture local-scale processes such as vertical channeling, subvertical heterogeneity, complex capillary effects, or migration through discrete fractures.
Faults are represented in a simplified way through structural traces and boundary conditions, but multiphase flow through fault planes and the evolution of fault permeability are not explicitly modelled. This simplification is relevant because the hydraulic behaviour of faults can modify pressure evolution, plume migration, and storage security.
Another important limitation is the absence of explicit geomechanical coupling. Pressure limits allow safety criteria to be incorporated, but they do not replace a complete analysis of reservoir deformation, fault stability, or induced-fracturing risk, and induced seismicity issues [6,10]. Therefore, the results should be interpreted as a preliminary dynamic flow-based assessment, not as a final demonstration of geomechanical safety.
Finally, the extreme permeability case ×4 produced an anomalous numerical response with non-finite pressure. This result should not be interpreted as a robust physical response of the system, but as an indication of the numerical limits of the solver under conditions far from the base case. The main conclusion regarding the dominant role of permeability remains valid, but it should be supported by the overall behaviour of the tested range rather than by this extreme point.
6. Conclusions
This research developed and applied a numerical VE workflow in MATLAB/MRST to evaluate the key parametric controls on dynamic CO₂ storage capacity in the Lopín structure, Ebro Basin, NE Spain. Unlike static volumetric estimates, the approach defines capacity as the maximum mass of CO₂ that can be injected over a 30-year period without exceeding an explicit operational BHP limit, thereby linking the capacity estimate to pressure-constrained injectability.
For the P50 reference configuration, plume evolution is controlled by the C1-C2 well layout, buoyancy-driven migration, structural relief, and lateral pressure dissipation through the open east-west boundaries. The long-term simulation shows that, after 1030 years, most of the CO₂ remains as a mobile phase, whereas residual, structural, and dissolution trapping provide additional immobilization.
The sensitivity analysis shows that dynamic capacity is controlled primarily by horizontal permeability, followed by the BHP limit and CO₂ density. Permeability produced the largest capacity variation, confirming that reservoir transmissibility and lateral pressure dissipation are critical factors for storage feasibility. In contrast, porosity, brine compressibility, nominal injection rate, and residual CO₂ saturation had a secondary influence within the tested ranges.
These findings support the central hypothesis of this work: in fault-bounded saline aquifers such as Lopín, operational capacity is not governed only by available pore volume, but by the hydraulic ability of the system to dissipate injection-induced overpressure. Early-stage geological CO₂ storage assessments should therefore prioritize permeability characterization, lateral connectivity, transparent justification of operational pressure thresholds, and accurate representation of CO₂ thermodynamic properties. For Lopín, coupled geomechanical assessment and improved characterization of fault transmissibility remain essential before the sensitivity-based pressure limits can be translated into field-operational criteria
Author Contributions
Conceptualization, C.A.Q.T.; methodology, C.A.Q.T.; software, C.A.Q.T.; validation, C.A.Q.T.; formal analysis, C.A.Q.T.; investigation, C.A.Q.T.; resources, J.G.-C. and P.F.-C.; data curation, C.A.Q.T.; writing—original draft preparation, C.A.Q.T.; writing—review and editing, C.A.Q.T., M.G.-O., I.H., J.G.-C. and P.F.-C.; visualization, C.A.Q.T.; supervision, M.G.-O. and I.H.; project administration, I.H. All authors have read and agreed to the published version of the manuscript.
Funding
This research was funded by the Institut Cartogràfic i Geològic de Catalunya (ICGC) through a student grant awarded to the first author, C.A.Q.T, within the Master’s Degree in Renewable Energy and Energy Sustainability, Faculty of Physics, University of Barcelona (UB), 08028 Barcelona, Spain.
Data Availability Statement
The geological and petrophysical input data were provided by IGME-CSIC within the European H2020 PilotSTRATEGY project (Grant Agreement No. 101022664),.and are subject to the access conditions of the data owners and project partners. Requests for access to the source data should be directed to the relevant data owners. Derived numerical outputs may be made available by the corresponding author upon reasonable request, subject to those restrictions.
Acknowledgments
The authors thank IGME-CSIC and the PilotSTRATEGY consortium for providing geological and petrophysical data, and the ICGC and UB for institutional and scientific support during the development of the modelling work. We acknowledge support from grant PID2022-140850OB-C21 and PID2022-140850OB-C22 from MICIU/AEI/10.13039/501100011033 and ‘ERDF/EU’ and the “Consolidación Investigadora” grant CNS2023-145382 funded by MCIN/ AEI/10.13039/50110001103. Additional support was provided by the Generalitat de Catalunya (2021SGR00076). During the preparation of this manuscript, the authors used generative artificial intelligence tools, including Gemini (versions 3.1 Pro and 3.6 Flash) and Claude (Sonnet 5), solely for translation and editorial support, such as restructuring paragraphs and improving the organization and readability of the text. These tools were not used to generate scientific content, develop the methodology, analyze or interpret data, produce results or conclusions, or otherwise influence the originality, intellectual contribution, or scientific merit of the manuscript. The authors reviewed and edited all AI-assisted output and take full responsibility for the content of this publication.
Conflicts of Interest
Declare conflicts of interest or state “The authors declare no conflicts of interest.” Authors must identify and declare any personal circumstances or interest that may be perceived as inappropriately influencing the representation or interpretation of reported research results. Any role of the funders in the design of the study; in the collection, analyses or interpretation of data; in the writing of the manuscript; or in the decision to publish the results must be declared in this section. If there is no role, please state “The funders had no role in the design of the study; in the collection, analyses, or interpretation of data; in the writing of the manuscript; or in the decision to publish the results”.
Abbreviations
The following abbreviations are used in this manuscript:
| MRST | MATLAB Reservoir Simulation Toolbox |
| VE | Vertical Equilibrium |
| BHP | Bottom Hole Pressure |
| CCS | Carbon Capture and Storage |
| CapBHP | Pressure Limited dynamic capacity |
References
- IPCC. IPCC Special Report on Carbon Dioxide Capture and Storage; Metz, B., Davidson, O., de Coninck, H., Loos, M., Meyer, L., Eds.; Cambridge University Press: Cambridge, UK, 2005. [Google Scholar]
- IEA. Carbon Capture, Utilisation and Storage; International Energy Agency: Paris, France, 2023. [Google Scholar]
- Worden, R.H. Carbon Dioxide Capture and Storage (CCS) in Saline Aquifers versus Depleted Gas Fields. Geosciences 2024, 14, 146. [Google Scholar] [CrossRef]
- Massarweh, O.; Abushaikha, A.S. CO₂ sequestration in subsurface geological formations: A review of trapping mechanisms and monitoring techniques. Earth-Sci. Rev. 2024, 253, 104793. [Google Scholar] [CrossRef]
- Bachu, S. Review of CO₂ storage efficiency in deep saline aquifers. Int. J. Greenh. Gas. Control 2015, 40, 188–202. [Google Scholar] [CrossRef]
- Zhou, Q.; Birkholzer, J.T.; Tsang, C.-F.; Rutqvist, J. A method for quick assessment of CO₂ storage capacity in closed and semi-closed saline formations. Int. J. Greenh. Gas. Control 2008, 2, 626–639. [Google Scholar] [CrossRef]
- Birkholzer, J.T.; Oldenburg, C.M.; Zhou, Q. CO₂ migration and pressure evolution in deep saline aquifers. Int. J. Greenh. Gas. Control 2015, 40, 203–220. [Google Scholar] [CrossRef]
- Szulczewski, M.L.; MacMinn, C.W.; Juanes, R. Theoretical analysis of how pressure buildup and CO₂ migration can both constrain storage capacity in deep saline aquifers. Int. J. Greenh. Gas. Control 2014, 23, 113–118. [Google Scholar] [CrossRef]
- Thibeau, S.; Mucha, V. Have we overestimated saline aquifer CO₂ storage capacities? Oil Gas. Sci. Technol. 2011, 66, 81–92. [Google Scholar] [CrossRef]
- Rutqvist, J. The geomechanics of CO₂ storage in deep sedimentary formations. Geotech. Geol. Eng. 2012, 30, 525–551. [Google Scholar] [CrossRef]
- Nordbotten, J.M.; Celia, M.A. Similarity solutions for fluid injection into confined aquifers. J. Fluid Mech. 2006, 561, 307–327. [Google Scholar] [CrossRef]
- Nilsen, H.M.; Lie, K.-A.; Andersen, O. Robust simulation of sharp-interface models for fast estimation of CO₂ trapping capacity in large-scale aquifer systems. Comput. Geosci. 2016, 20, 93–113. [Google Scholar] [CrossRef]
- Nilsen, H.M.; Lie, K.-A.; Møyner, O.; Andersen, O. Spill-point analysis and structural trapping capacity in saline aquifers using MRST-co2lab. Comput. Geosci. 2015, 75, 33–43. [Google Scholar] [CrossRef]
- Nilsen, H.M.; Lie, K.-A.; Andersen, O. Analysis of CO₂ trapping capacities and long-term migration for geological formations in the Norwegian North Sea using MRST-co2lab. Comput. Geosci. 2015, 79, 15–26. [Google Scholar] [CrossRef]
- Lie, K.-A.; Nilsen, H.M.; Andersen, O.; Møyner, O. A simulation workflow for large-scale CO₂ storage in the Norwegian North Sea. Comput. Geosci. 2016, 20, 607–622. [Google Scholar] [CrossRef]
- Andersen, O.; Lie, K.-A.; Nilsen, H.M. An open-source toolchain for simulation and optimization of aquifer-wide CO₂ storage. Energy Procedia 2016, 86, 324–333. [Google Scholar] [CrossRef]
- Møyner, O.; Nilsen, H.M. Multiresolution coupled vertical equilibrium model for fast flexible simulation of CO₂ storage. Comput. Geosci. 2019, 23, 1–21. [Google Scholar] [CrossRef]
- de Jonge-Anderson, I.; Ramachandran, H.; Nicholson, U.; Geiger, S.; Widyanita, A.; Doster, F. Determining CO₂ storage efficiency within a saline aquifer using reduced complexity models. Adv. Geo-Energy Res. 2024, 13, 22–31. [Google Scholar] [CrossRef]
- Temizel, C.; Karcıoğlu, G.; Behzadan, A.; Çetin, C.; Pamukçu, Y.Z. A Comparative Study of Solvers and Preconditioners for an SPE CO₂ Storage Benchmark Reservoir Simulation Model. Geosciences 2025, 15, 169. [Google Scholar] [CrossRef]
- Zeynolabedini, M.; Jahanbani Ghahfarokhi, A. Vertical Equilibrium Model Analysis for CO₂ Storage. Gases 2025, 5, 16. [Google Scholar] [CrossRef]
- Alcalde, J.; Marzán, I.; Saura, E.; Martí, D.; Ayarza, P.; Juhlin, C.; Pérez-Estaún, A.; Carbonell, R. 3D geological characterization of the Hontomín CO₂ storage site, Spain: Multidisciplinary approach from seismic, well-log and regional data. Tectonophysics 2014, 627, 6–25. [Google Scholar] [CrossRef]
- de Dios, J.C.; Delgado, M.A.; Martínez, C.; Ramos, A.; Álvarez, I.; Marín, J.A.; Salvador, I. Hydraulic characterization of fractured carbonates for CO₂ geological storage: Experiences and lessons learned in Hontomín Technology Development Plant. Int. J. Greenh. Gas. Control 2017, 58, 185–200. [Google Scholar] [CrossRef]
- Le Gallo, Y.; de Dios, J.C.; Salvador, I.; Acosta Carballo, T. Geological Model of a Storage Complex for a CO₂ Storage Operation in a Naturally-Fractured Carbonate Formation. Geosciences 2018, 8, 354. [Google Scholar] [CrossRef]
- Mateos-Redondo, F.; Kovács, T.; Berrezueta, E. Petrographic and Petrophysical Characterization of Detrital Reservoir Rocks for CO₂ Geological Storage (Utrillas and Escucha Sandstones, Northern Spain). Geosciences 2018, 8, 246. [Google Scholar] [CrossRef]
- Ordóñez, B.; Mediato, J.F.; Kovács, T.; Martínez-Martínez, J.; Fernández-Canteli, P.; González-Menéndez, L.; Roces, S.; Caicedo-Potosí, J.; del Moral, B.; Berrezueta, E. Experimental geochemical assessment of a seal-reservoir system exposed to supercritical CO₂: A case study from the Ebro Basin, Spain. Int. J. Greenh. Gas. Control 2024, 137, 104233. [Google Scholar] [CrossRef]
- Ayala, C.; Benjumea, B.; Mediato, J.F.; García-Crespo, J.; Clariana, P.; Soto, R.; Rubio, F.; Rey-Moral, C.; Pueyo, E.L.; Martín-León, J.; et al. Developing a new innovative methodology to integrate geophysical techniques into characterization of potential CO₂ storage sites: Lopín structure, southern Ebro Basin, Spain; Geological Society, London, Special Publications, 2023; p. 528. [Google Scholar] [CrossRef]
- Wilkinson, M. Geological Characterization of the Lopín Structure, Ebro Basin; PilotSTRATEGY Deliverable D2.7, H2020 Grant Agreement No. 101022664, 2023. [PubMed]
- Eguilior, S.; Hurtado, A.; Recreo, F. Safety and Performance Analysis of the Lopín Structure, Ebro Basin; PilotSTRATEGY Deliverable D5.3, H2020 Grant Agreement No. 101022664, 2025.
- IGME. Geological Storage of CO₂ Plan (ALGECO2 Project); Spanish Geological Survey (IGME): Madrid, Spain, 2010; Available online: https://info.igme.es.
- GSEU Project. Online Pan-European Atlas of Sustainable Geo-Energy Capacities. Geological Service for Europe, 2025. Available online: https://www.europe-geology.eu/.
- Gil-Ortiz, M.; Gomez-Rivas, E.; Alcalde, J.; Cabello, P.; Yeste, L. M.; Zamora, G.; Carrasco, Á.; García Fernández-Valderrama, D.; Martín-Monge, A.; Mañas, M.; Olgado Azpiazu, M. V.; Ron Martín, M.; Lukito, P.; Pángaro, F. Characterization of the Miocene Castellón Sandstones Formation in the Western Mediterranean as a potential geological carbon storage site. Mar. Pet. Geol. 2025, 181, 107493. [Google Scholar] [CrossRef]
- Martín Monge, A.; Mañas Fernández, M.; Olgado Azpiazu, V.; Torres Torremocha, J.; Vayssaire, A.; Pángaro, F. Sealing potential of the Ebro Formation, offshore Ebro Basin: Implications for the safe storage of CO₂. 86th EAGE Annual Conference & Exhibition 2025, 2025; European Association of Geoscientists & Engineers; pp. 1–5. [Google Scholar] [CrossRef]
- Saló-Salgado, L.; Møyner, O.; Lie, K.-A.; Juanes, R. Three-dimensional simulation of geologic carbon dioxide sequestration using MRST. Adv. Geo-Energy Res. 2024, 14, 34–48. [Google Scholar] [CrossRef]
- Lie, K.-A. An Introduction to Reservoir Simulation Using MATLAB/GNU Octave: User Guide for the MATLAB Reservoir Simulation Toolbox (MRST); Cambridge University Press: Cambridge, UK, 2019. [Google Scholar]
- STRATEGY CCUS Project. Strategic Planning of Regions and Territories in Europe for Low-Carbon Energy and Industry through CCUS. Available online: https://www.igme.es/en/proyecto/strategy-ccus-project/.
Figure 1.
Regional setting of the Ebro Basin in northeastern Spain.
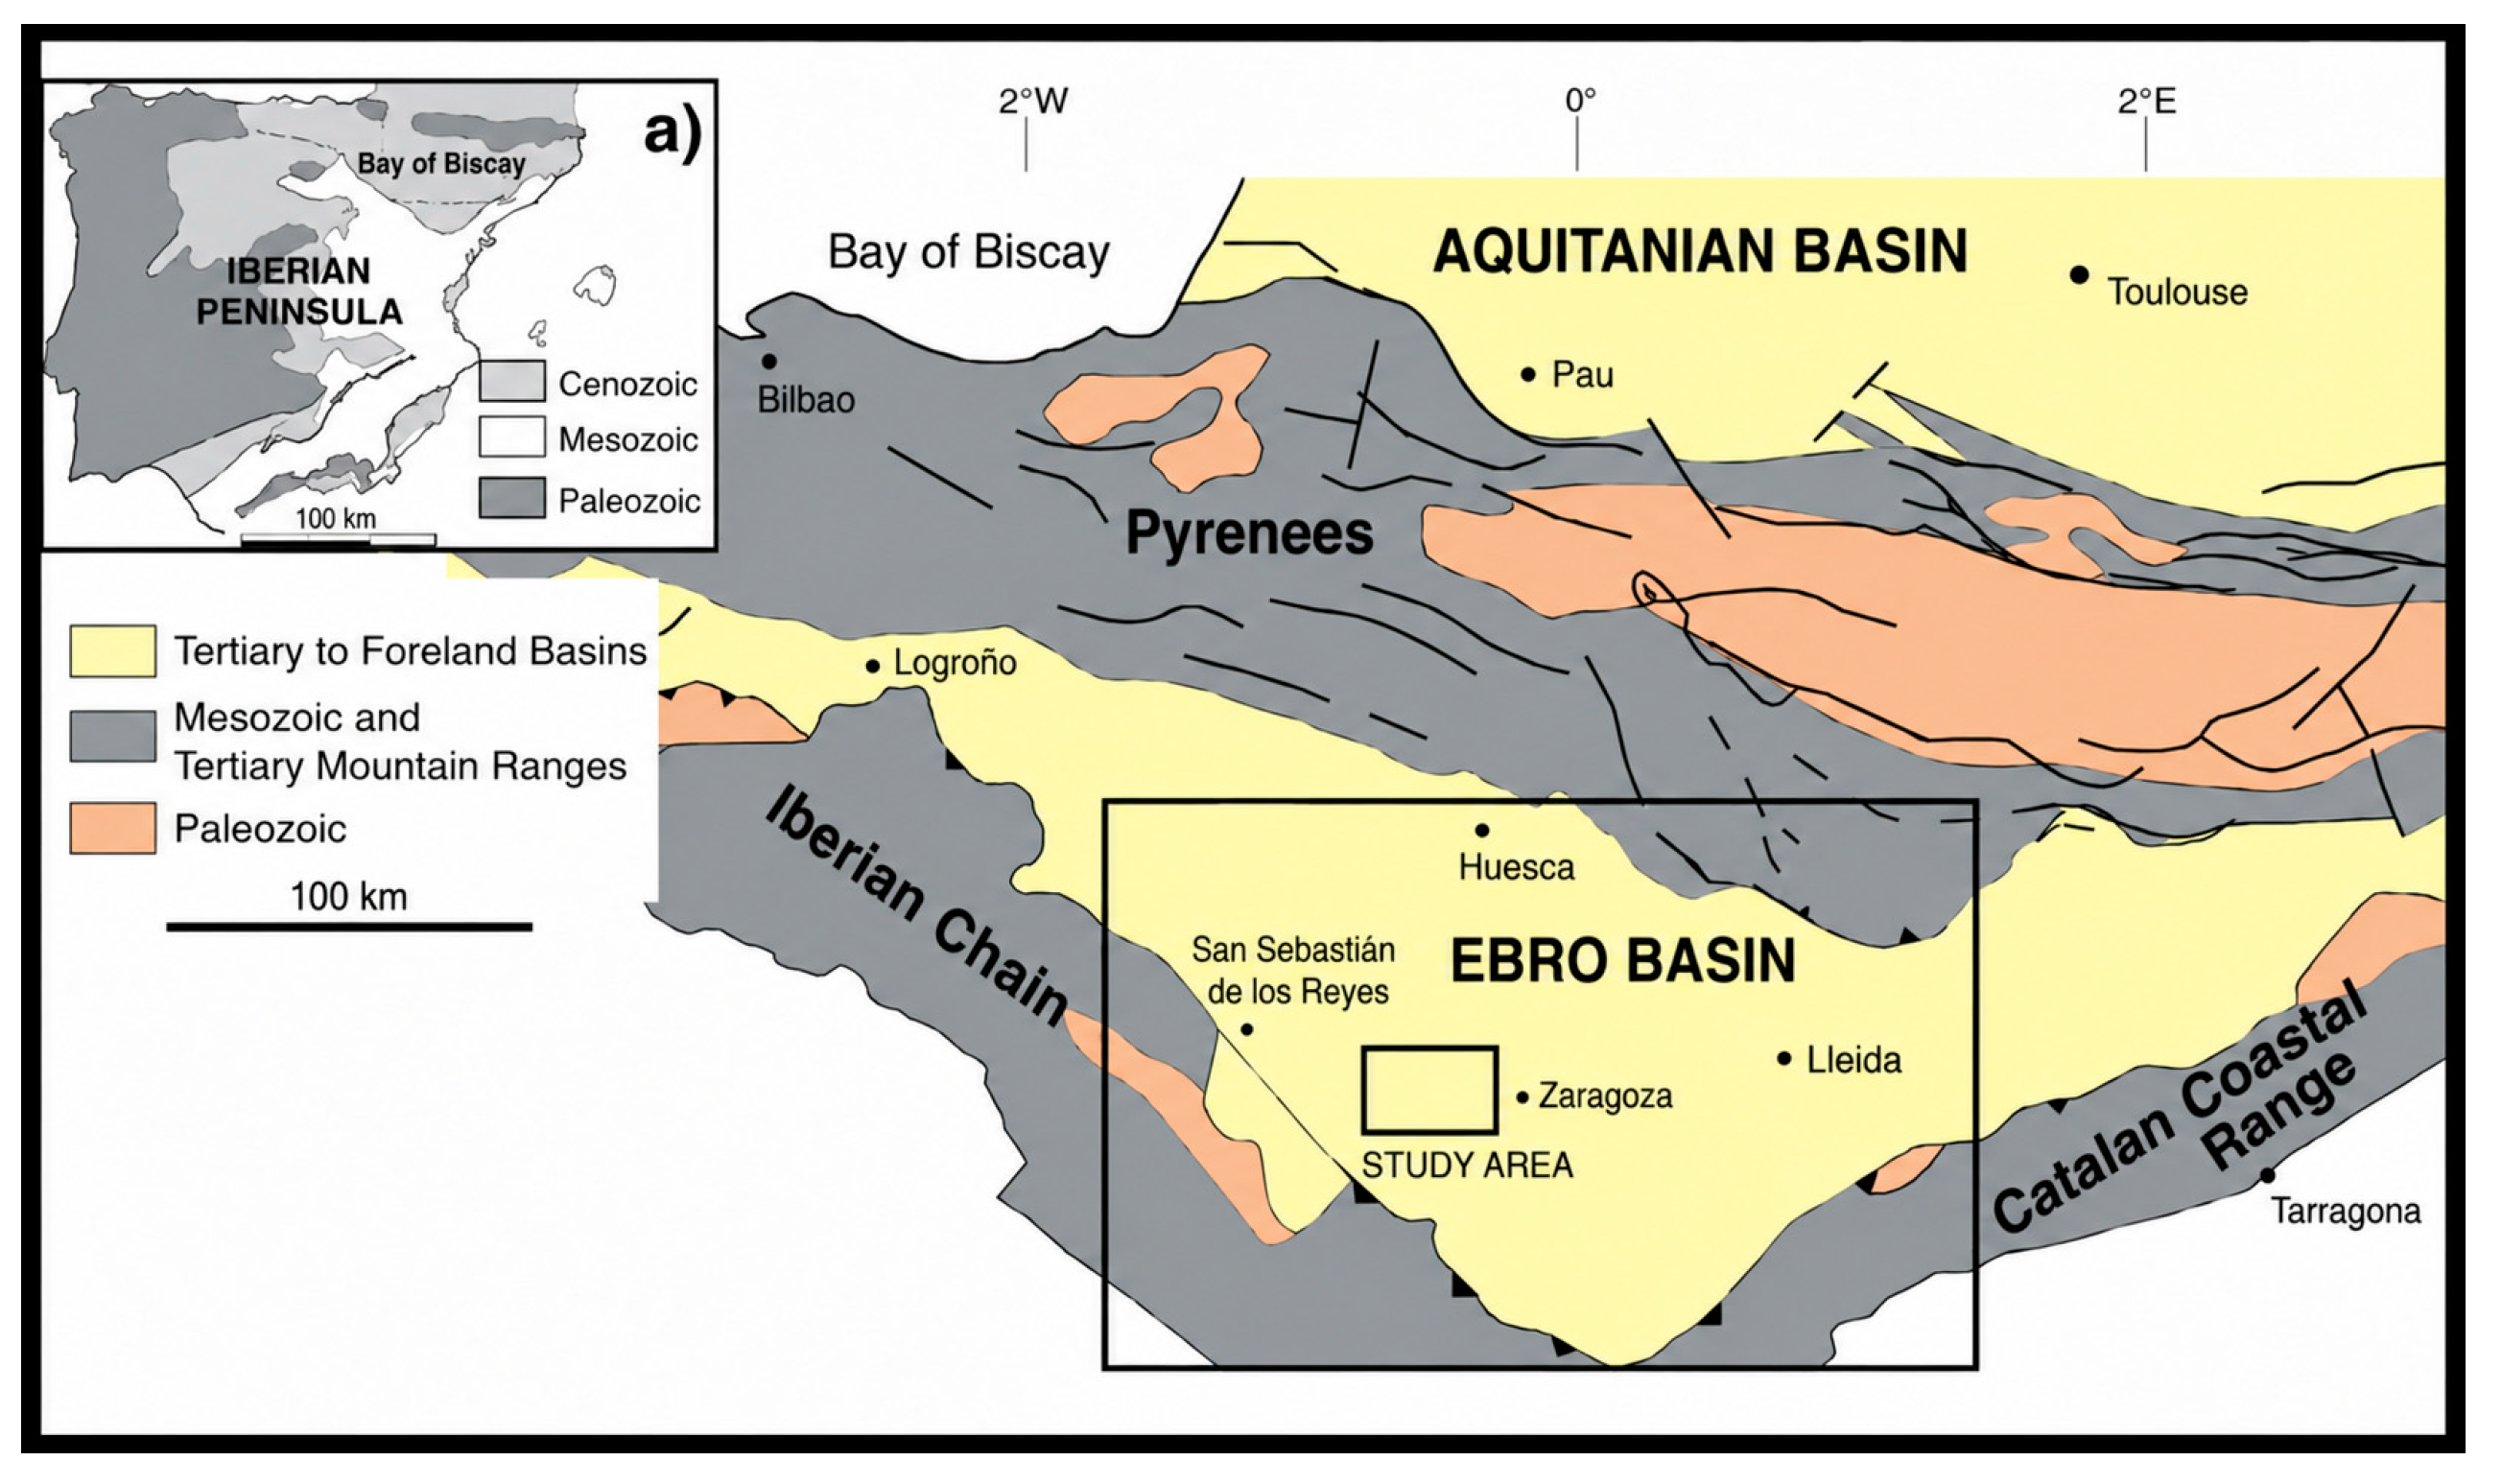
Figure 2.
Geological map of the Lopín area showing the interpreted structural closure of the storage structure and the simulation-grid domain used in the numerical model. The green shaded area in the panel represents the structural closure/modelled domain, not a lithological unit.
Figure 2.
Geological map of the Lopín area showing the interpreted structural closure of the storage structure and the simulation-grid domain used in the numerical model. The green shaded area in the panel represents the structural closure/modelled domain, not a lithological unit.
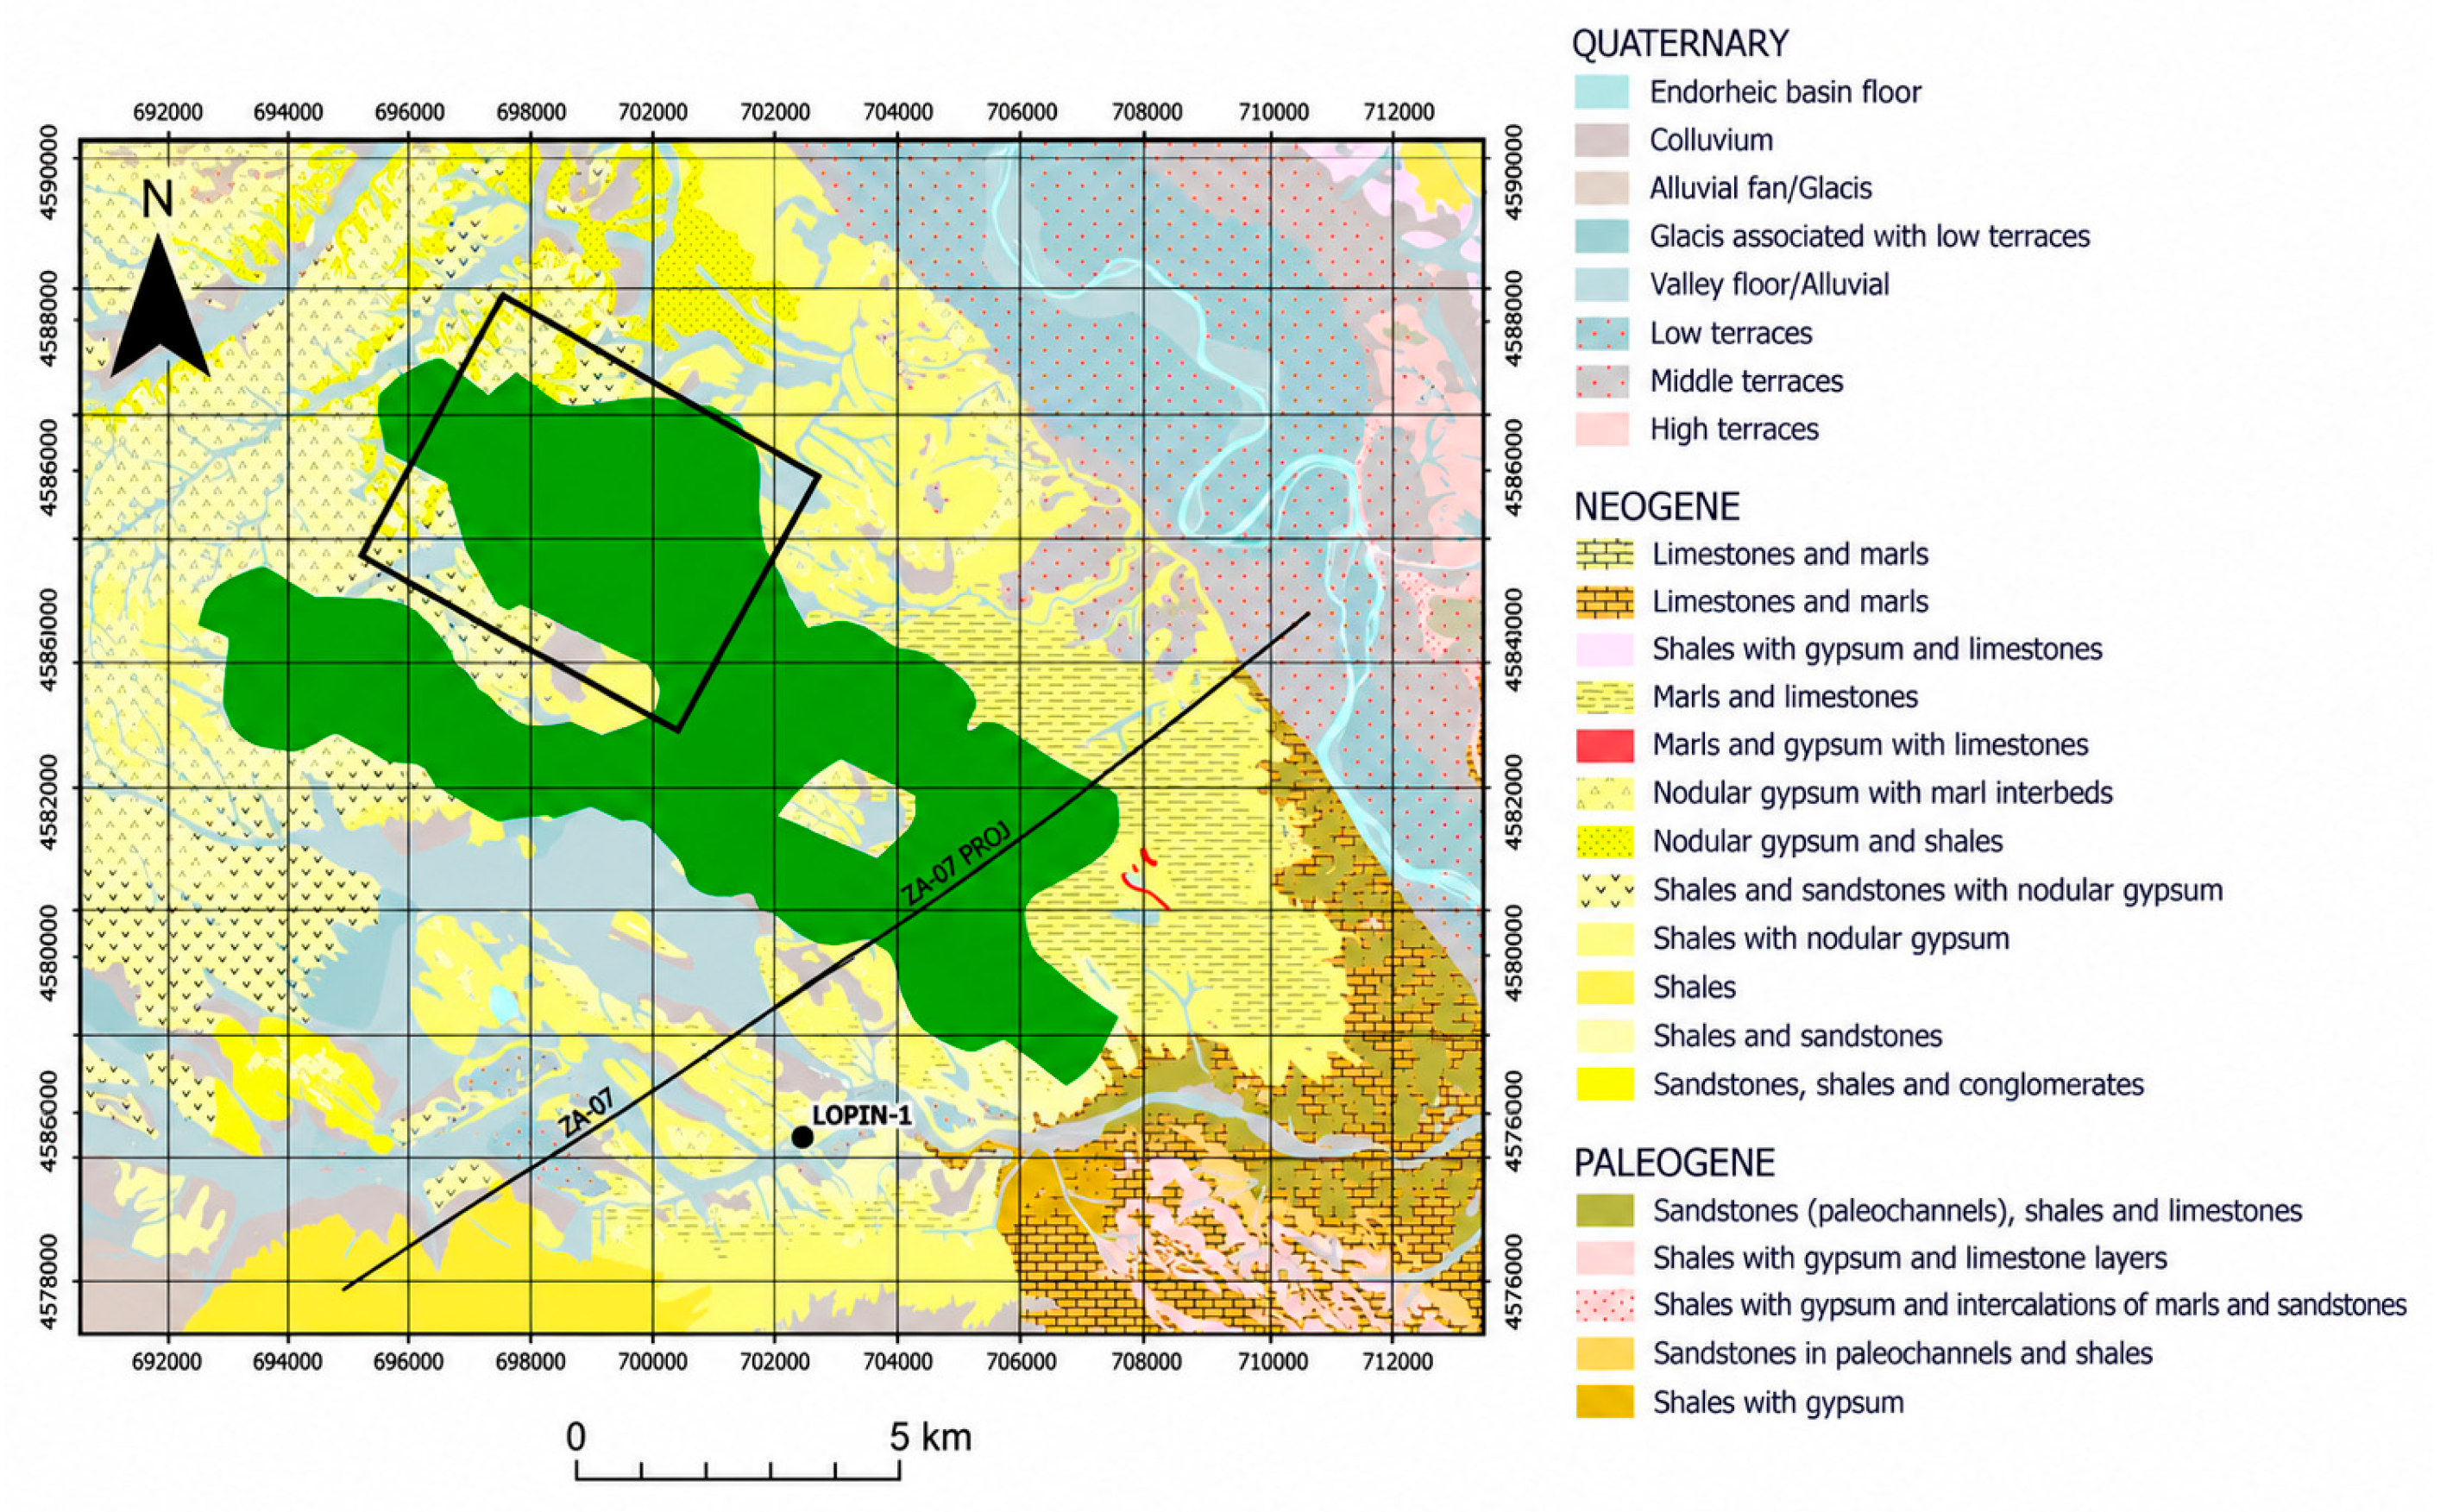
Figure 3.
Interpreted geological cross-section along seismic profiles ZA-7 and ZA-7-PROL, showing the main stratigraphic units, basement structure, normal faults, and the position of the Lopin-1 well. Panels adapted from the PilotSTRATEGY geological characterization [27,28].
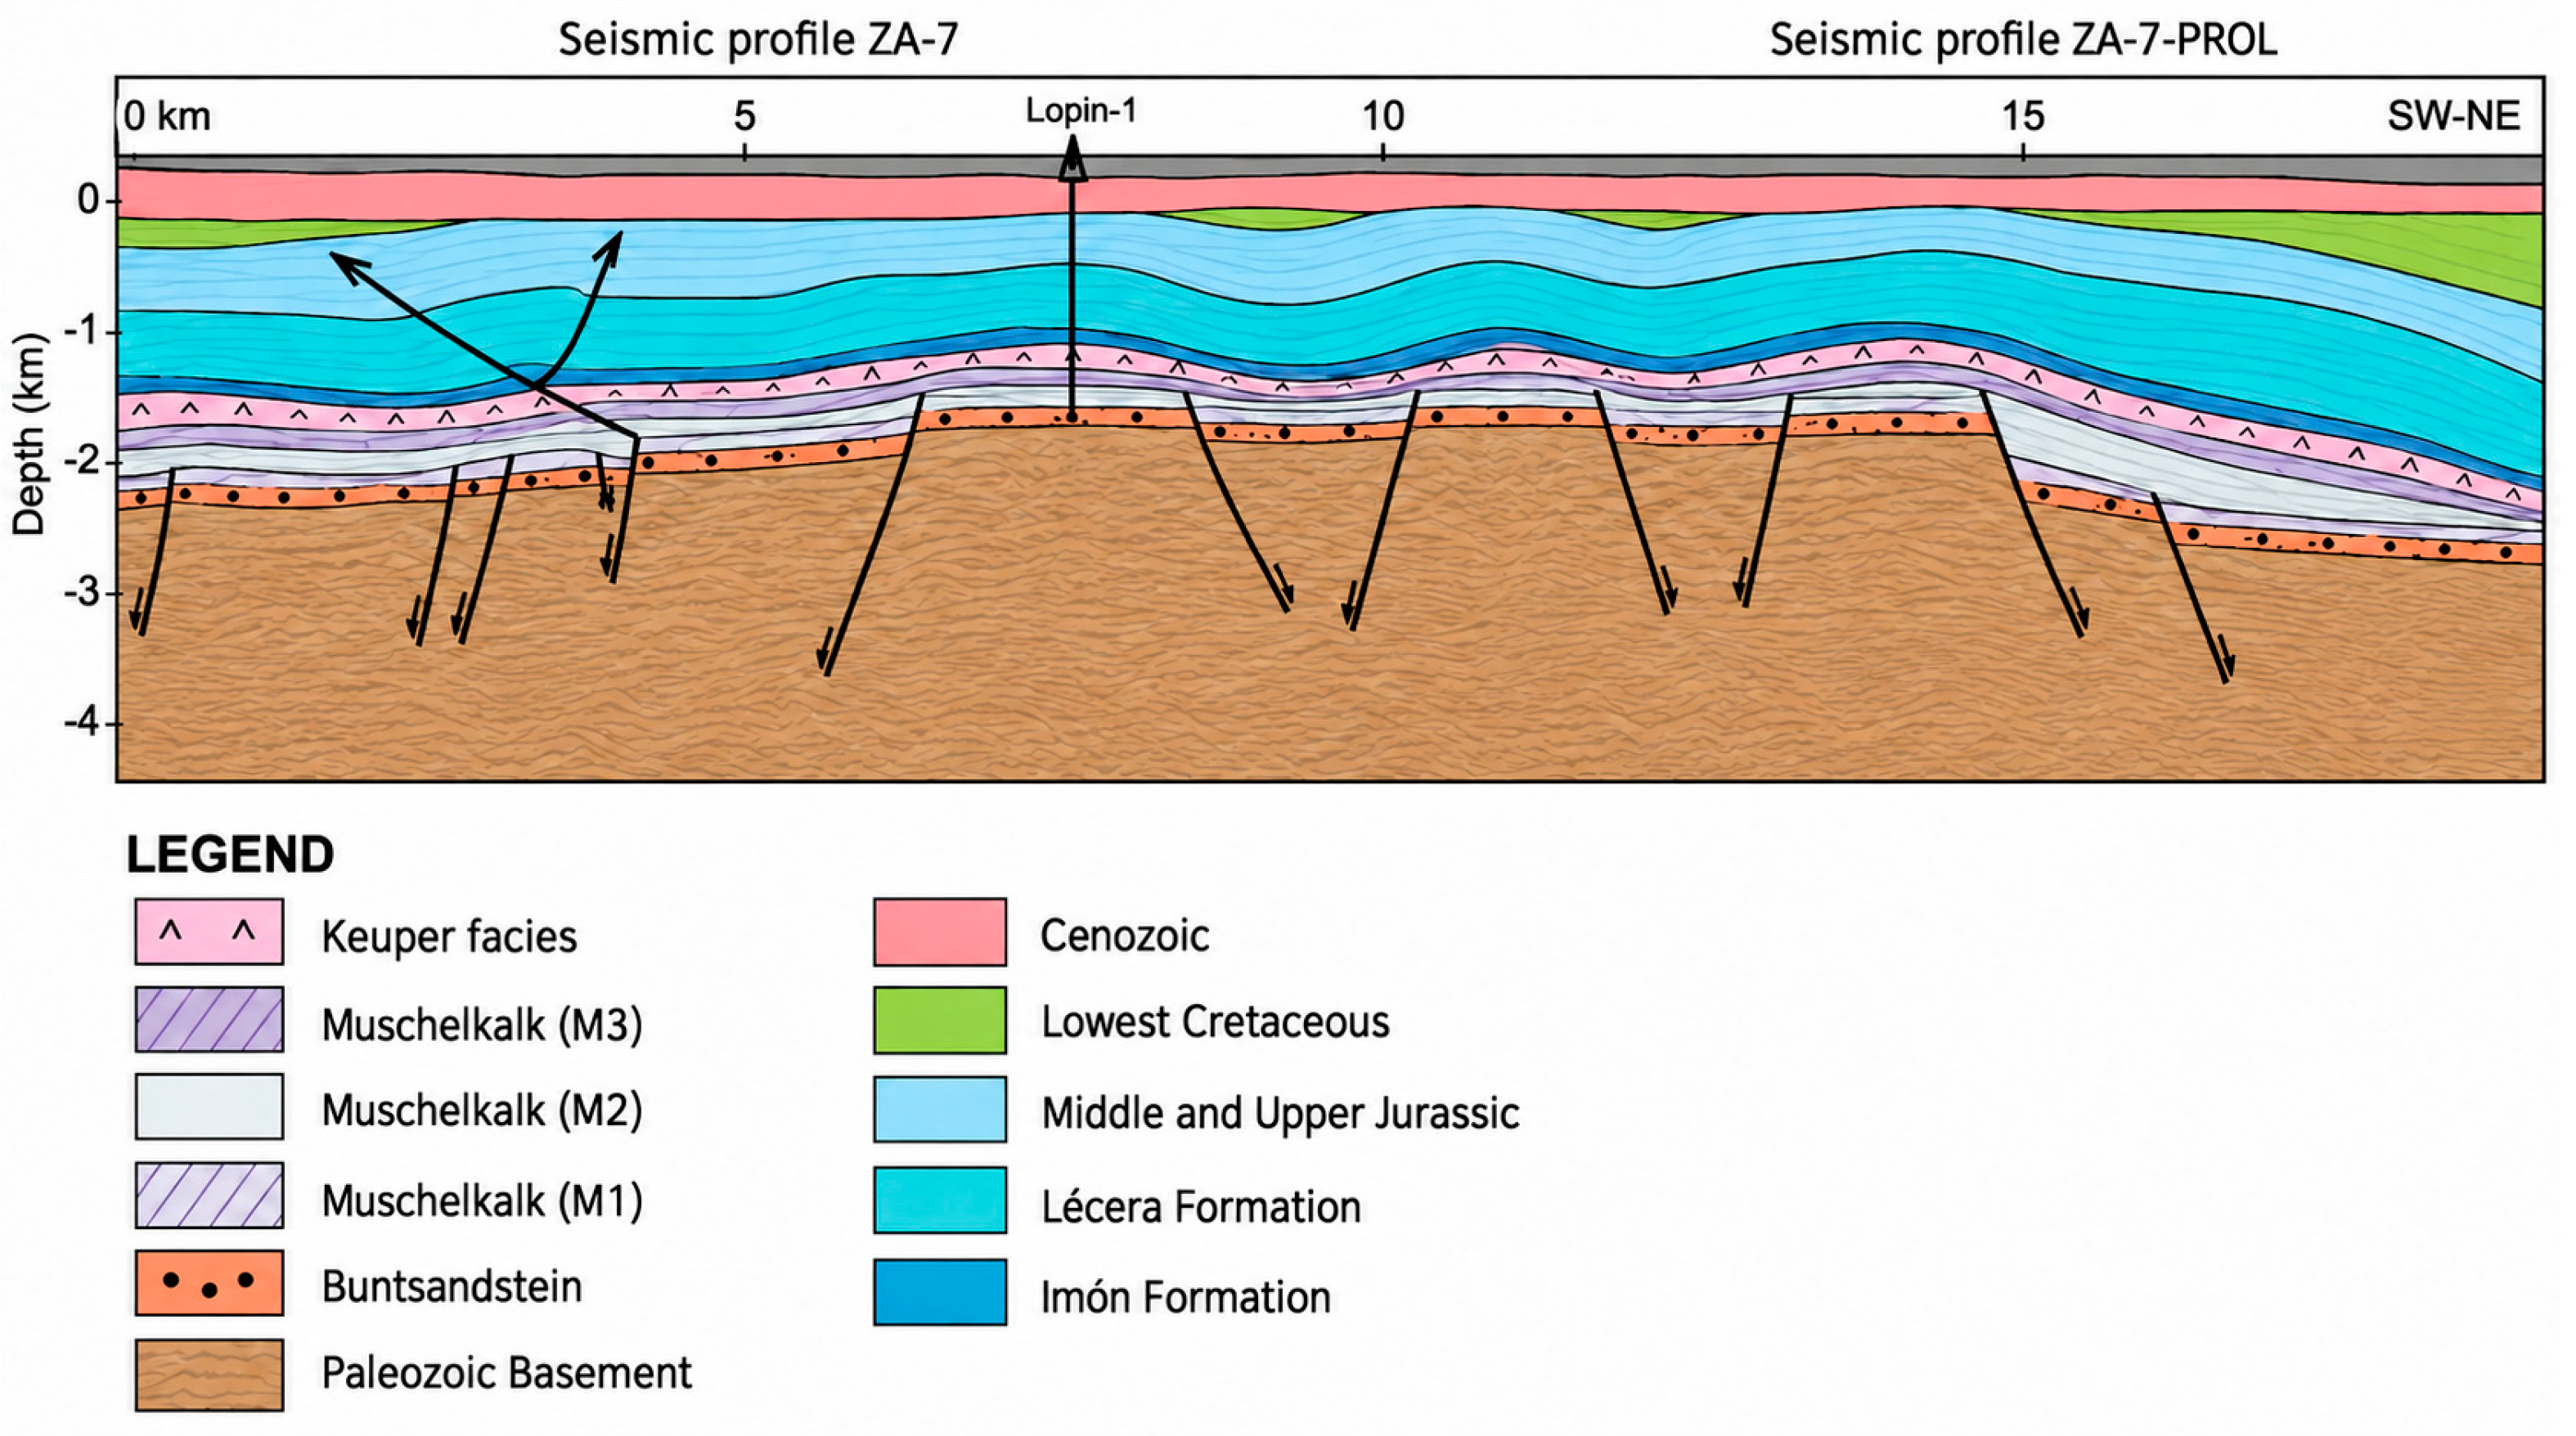
Figure 4.
Workflow used to estimate the dynamic CO₂ storage capacity of the Lopín structure. The 3D mesh shown at right represents the original P50 geocelular domain (47 × 60 × 57; 160,532 active cells) before reduction to 2808 active VE columns. The workflow then applies the VE solution, BHP-based injection control, and post-processing of plume migration, pressure, capacity, trapping inventory, and mass balance.
Figure 4.
Workflow used to estimate the dynamic CO₂ storage capacity of the Lopín structure. The 3D mesh shown at right represents the original P50 geocelular domain (47 × 60 × 57; 160,532 active cells) before reduction to 2808 active VE columns. The workflow then applies the VE solution, BHP-based injection control, and post-processing of plume migration, pressure, capacity, trapping inventory, and mass balance.
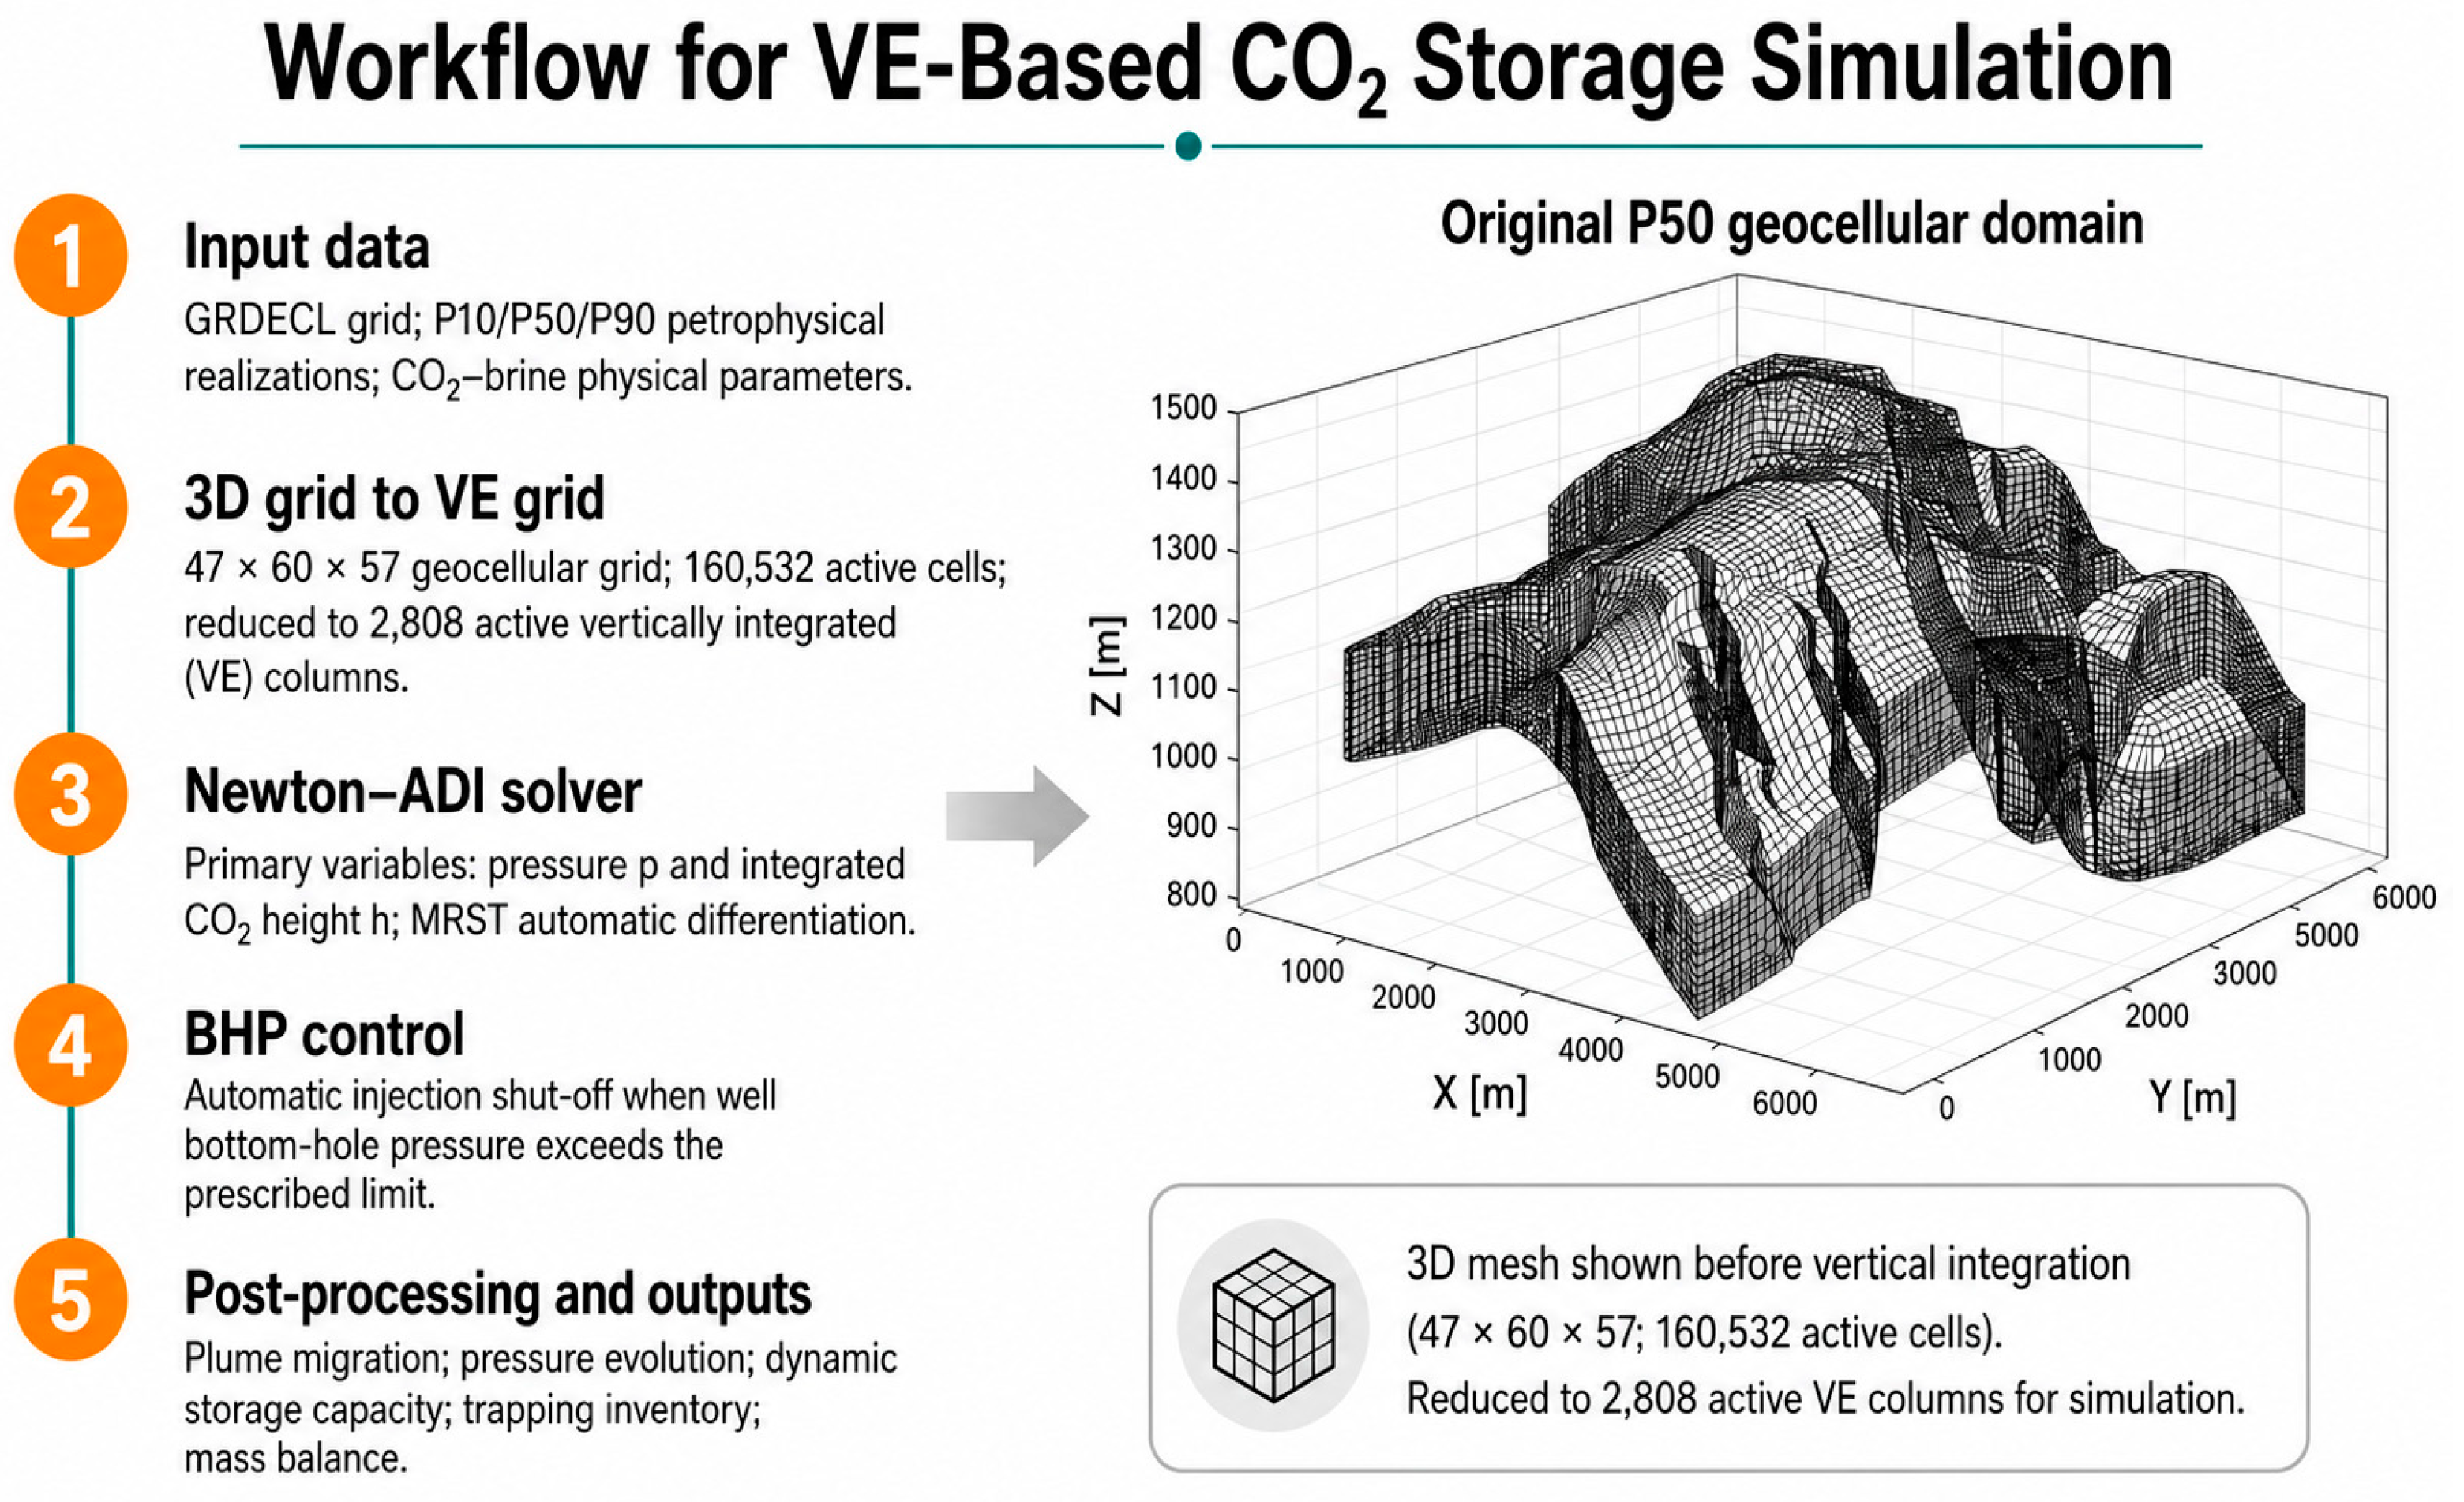
Figure 5.
Temporal evolution of maximum reservoir pressure for the P50 reference simulation with two active wells and mixed boundary conditions. The horizontal lines show the site-specific p80 = 26.31 MPa, p90 = 29.60 MPa, pAllow = 30.50 MPa, and pFrac = 32.90 MPa reference levels [28]. The operational BHP criterion used by the capacity-search algorithm is evaluated at the injection wells and is discussed separately in Section 3.3.
Figure 5.
Temporal evolution of maximum reservoir pressure for the P50 reference simulation with two active wells and mixed boundary conditions. The horizontal lines show the site-specific p80 = 26.31 MPa, p90 = 29.60 MPa, pAllow = 30.50 MPa, and pFrac = 32.90 MPa reference levels [28]. The operational BHP criterion used by the capacity-search algorithm is evaluated at the injection wells and is discussed separately in Section 3.3.
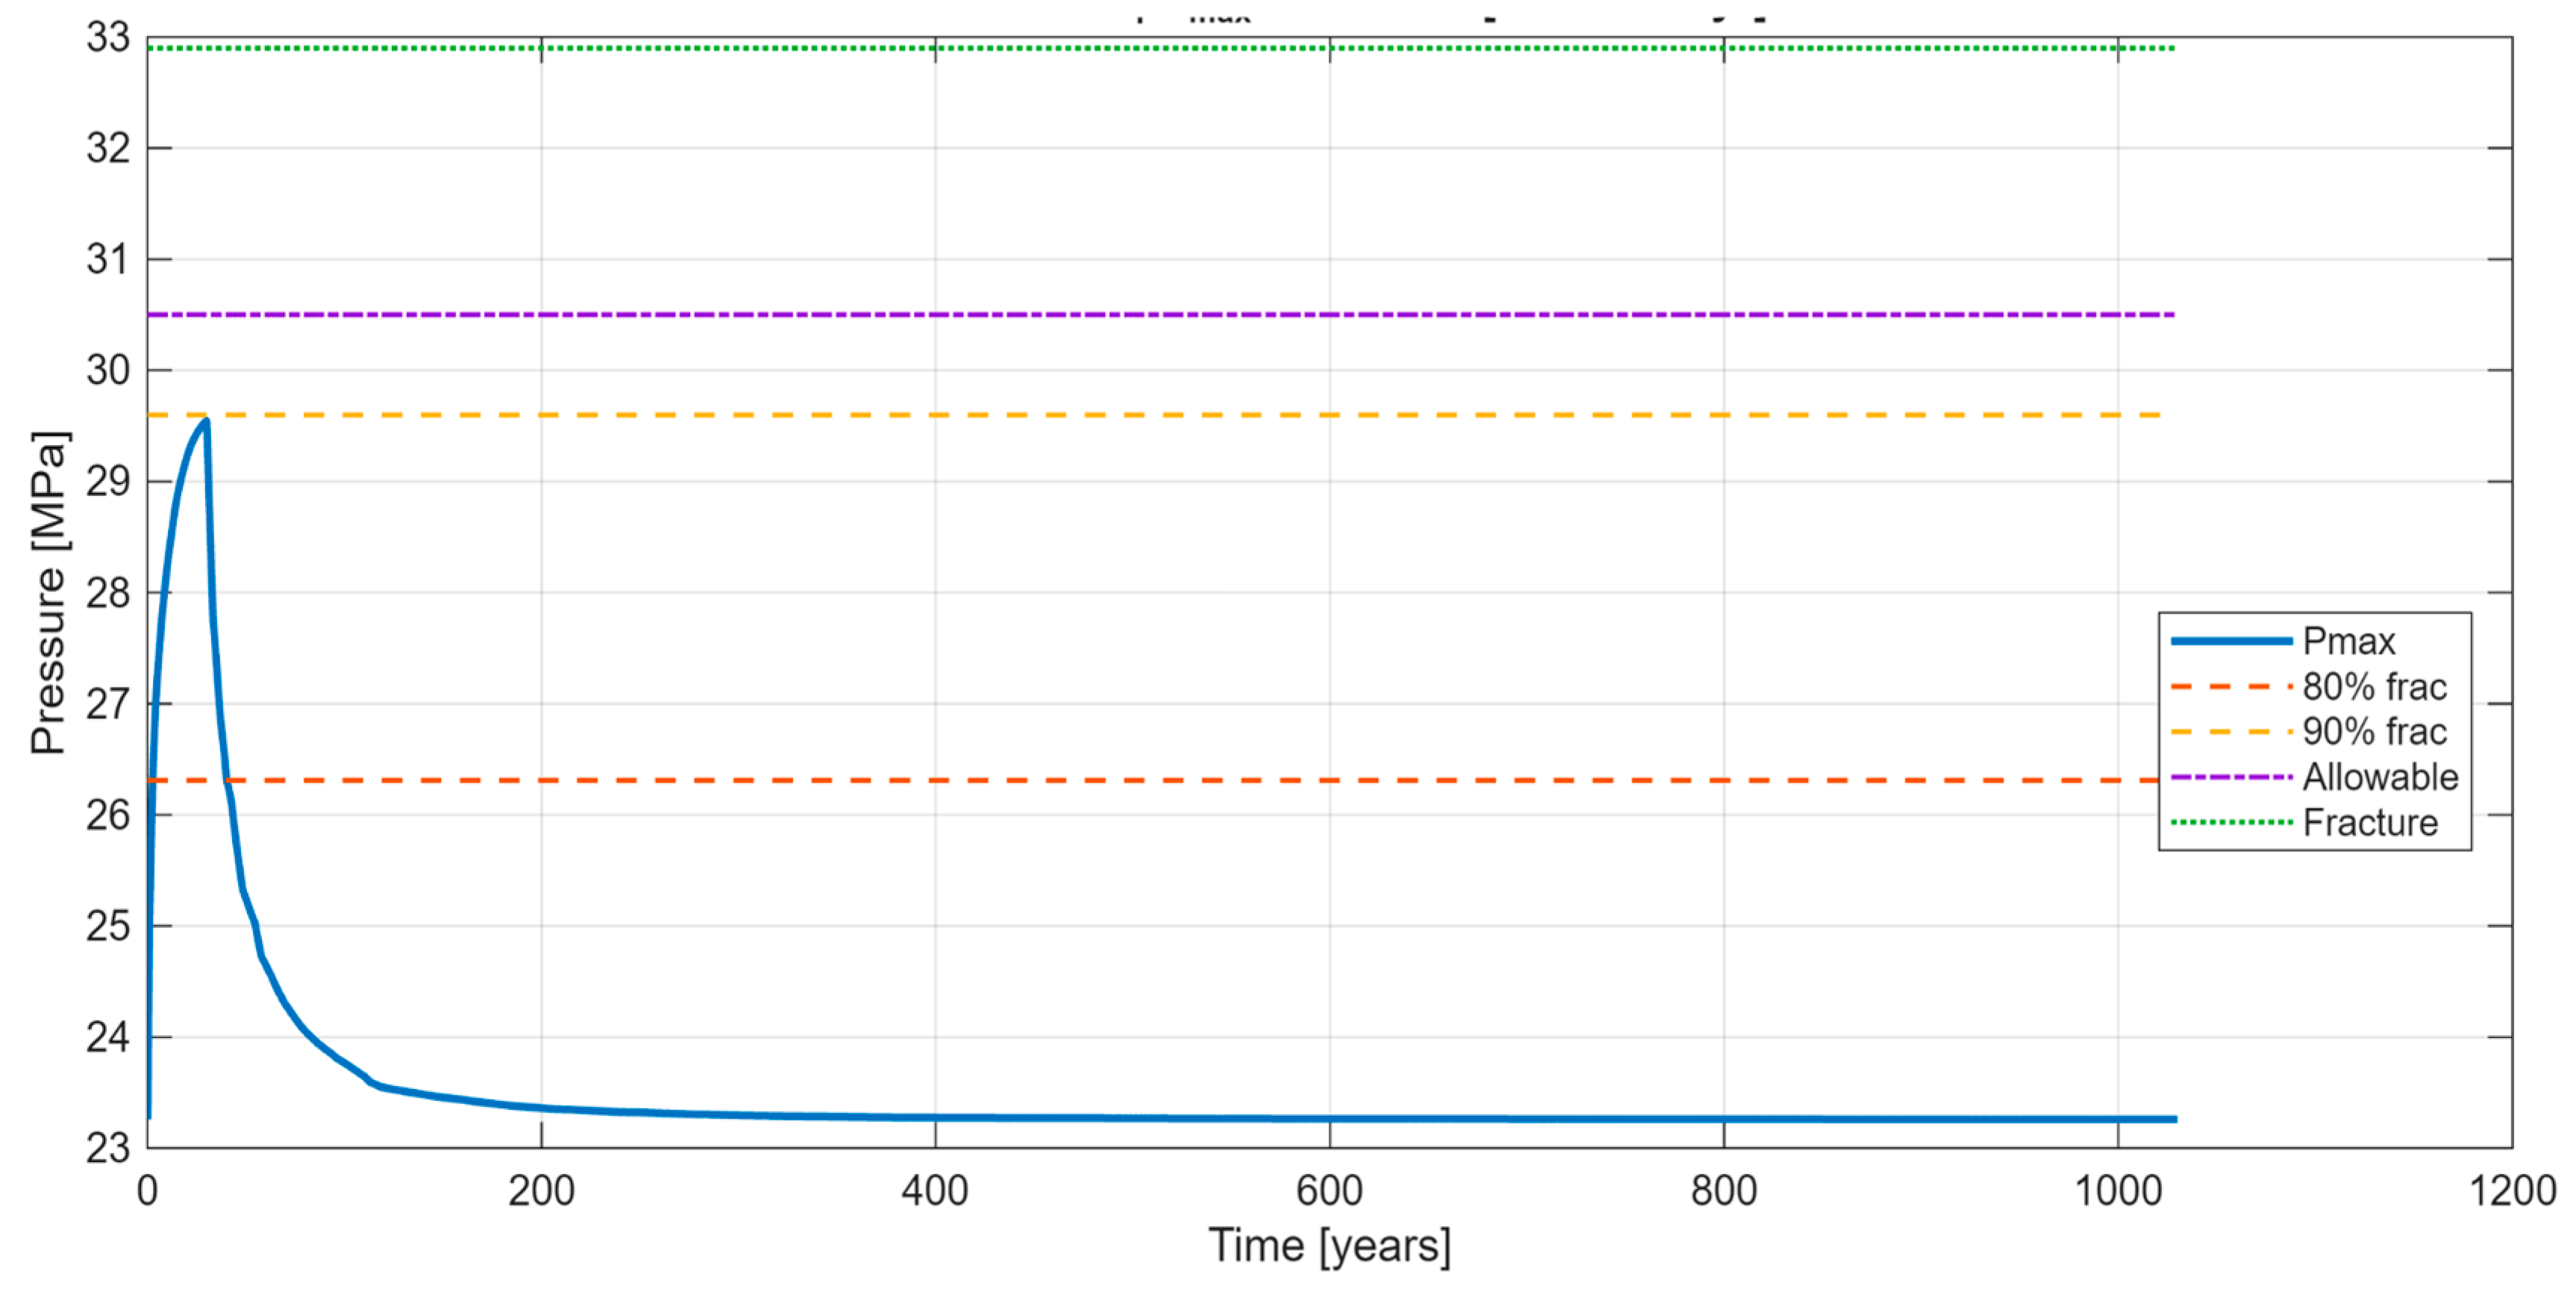
Figure 8.
Tornado chart of the OAT sensitivity analysis for the P50 scenario with two wells and mixed boundary conditions. Cap_BHP denotes the maximum injectable CO₂ mass over 30 years without exceeding the adopted BHP limit. The vertical line represents the base-case capacity (Cap_BHP = 10.760 Mt), and bar length shows the capacity range associated with each parameter. Parameters are ordered from the largest to the smallest influence.
Figure 8.
Tornado chart of the OAT sensitivity analysis for the P50 scenario with two wells and mixed boundary conditions. Cap_BHP denotes the maximum injectable CO₂ mass over 30 years without exceeding the adopted BHP limit. The vertical line represents the base-case capacity (Cap_BHP = 10.760 Mt), and bar length shows the capacity range associated with each parameter. Parameters are ordered from the largest to the smallest influence.
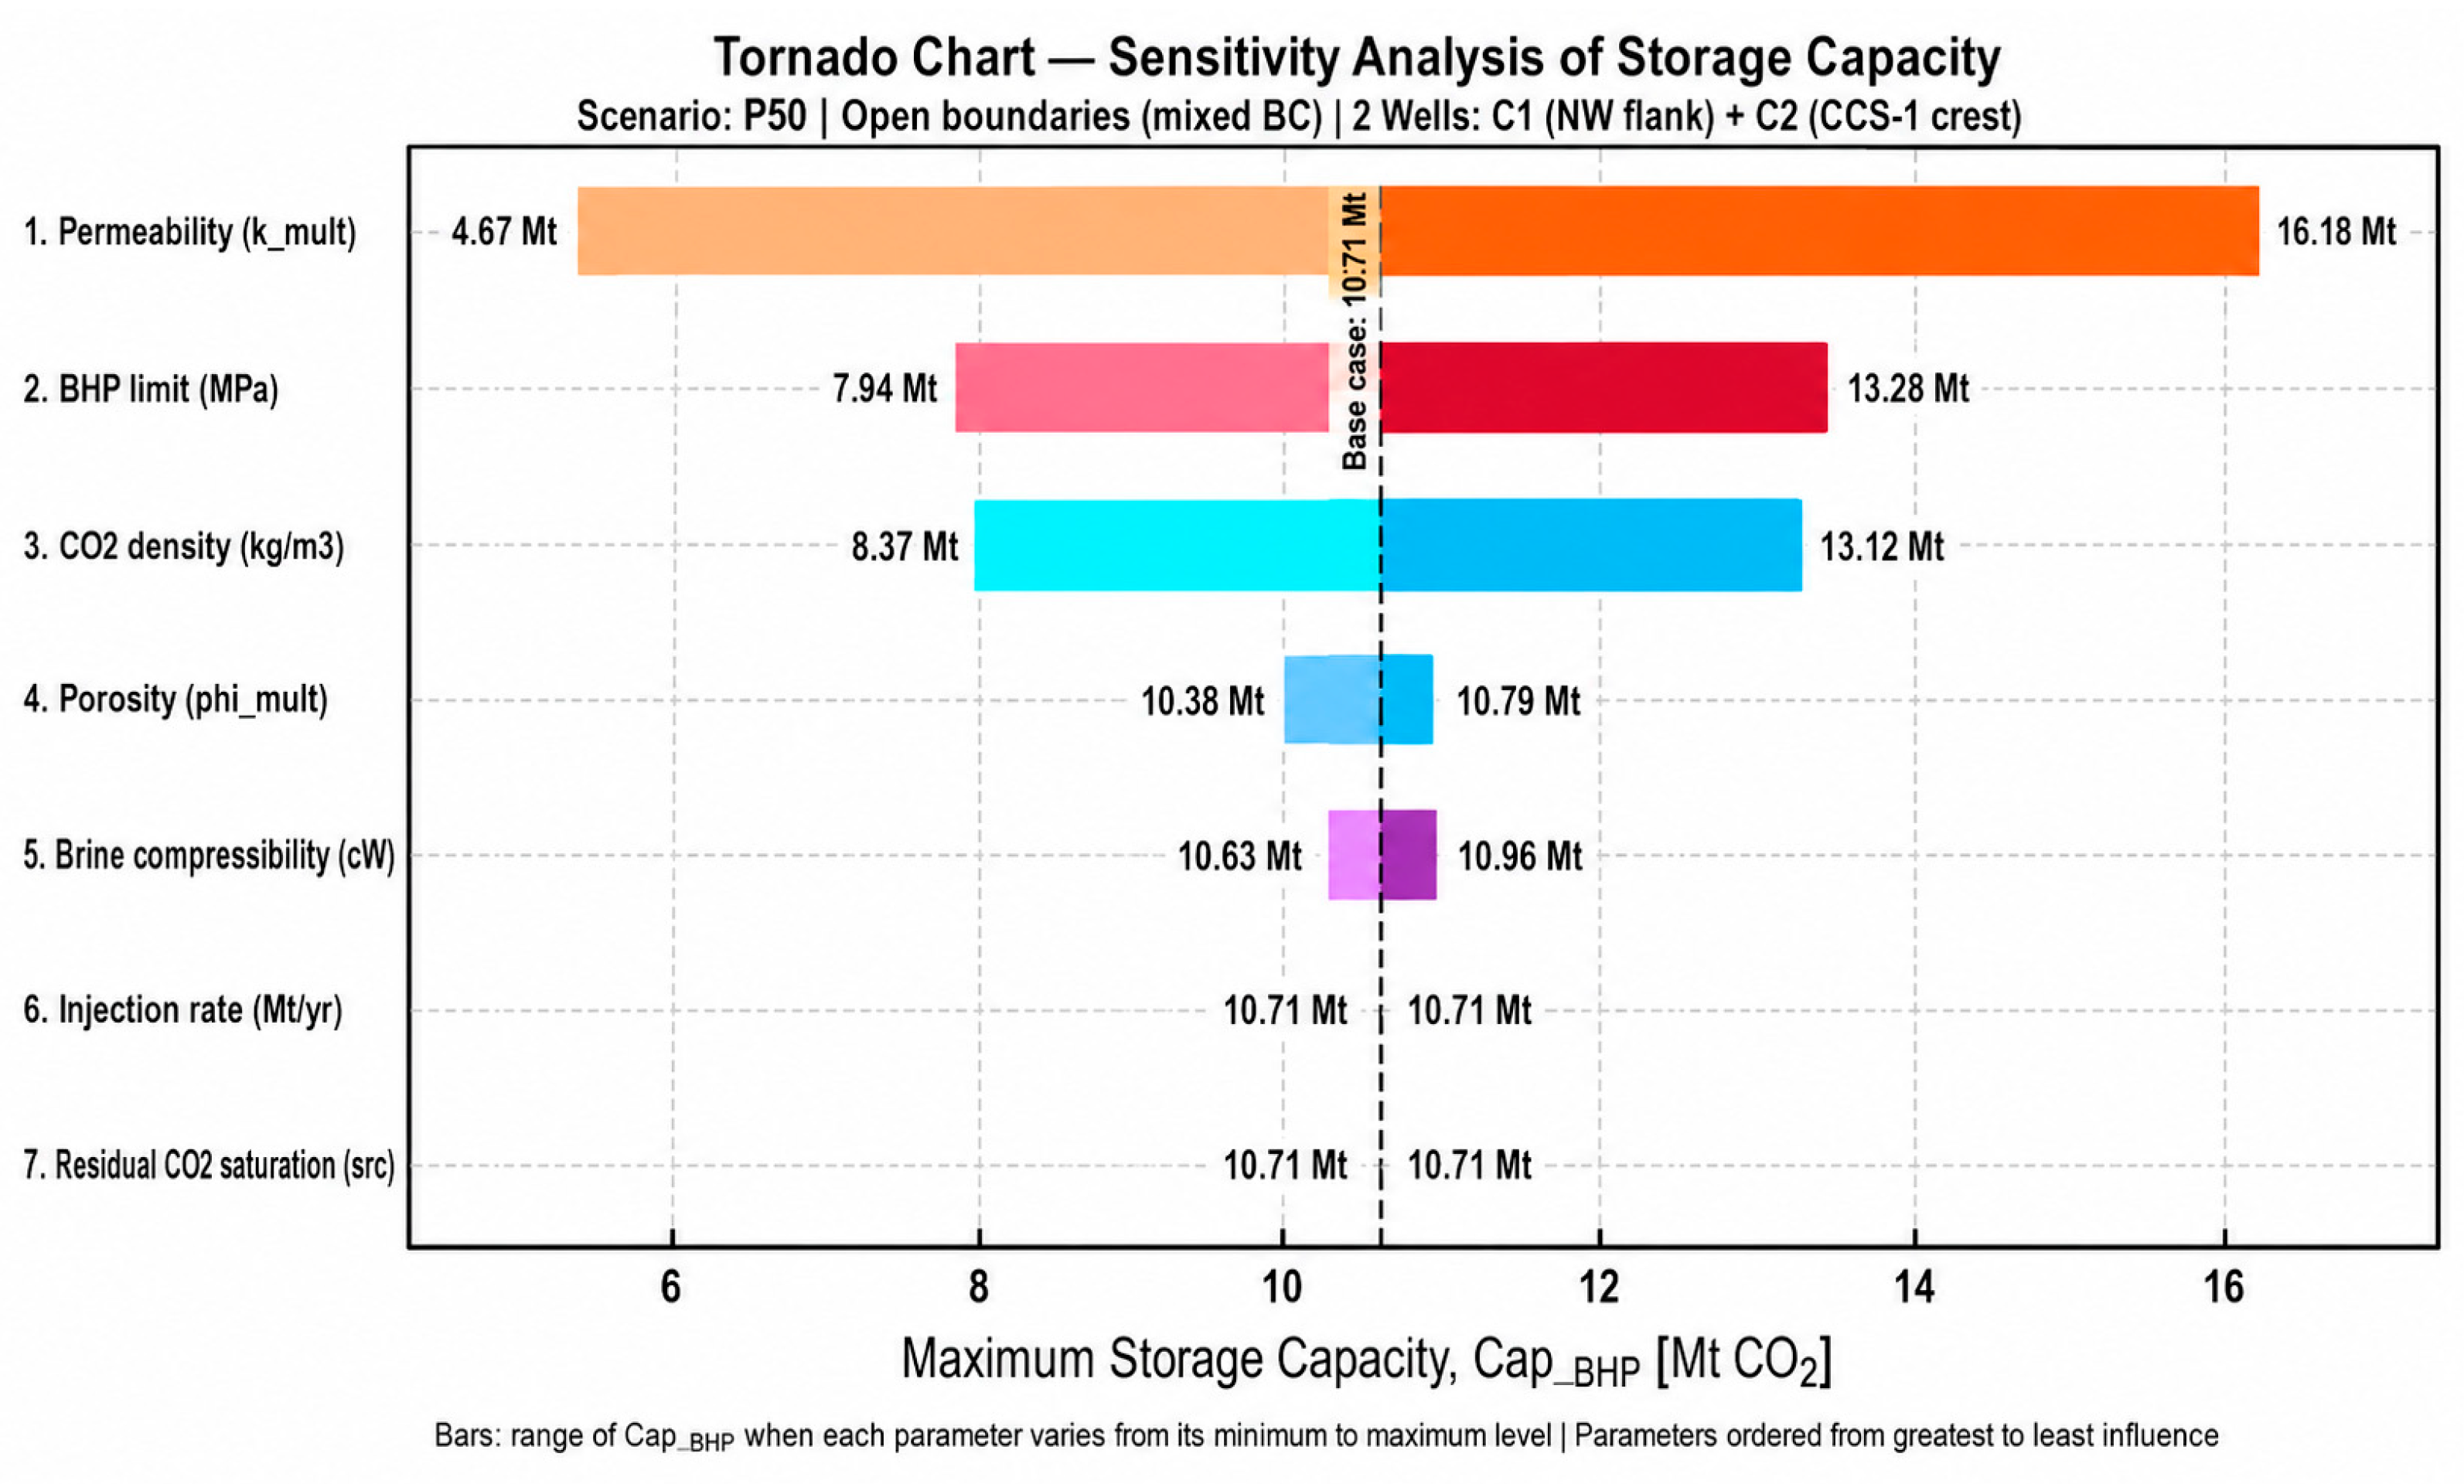
Figure 9.
Individual sensitivity curves for the seven parameter groups evaluated. The dashed horizontal line represents the base-case capacity. The permeability, BHP limit, and CO₂ density curves show the strongest variations in Cap_BHP.
Figure 9.
Individual sensitivity curves for the seven parameter groups evaluated. The dashed horizontal line represents the base-case capacity. The permeability, BHP limit, and CO₂ density curves show the strongest variations in Cap_BHP.
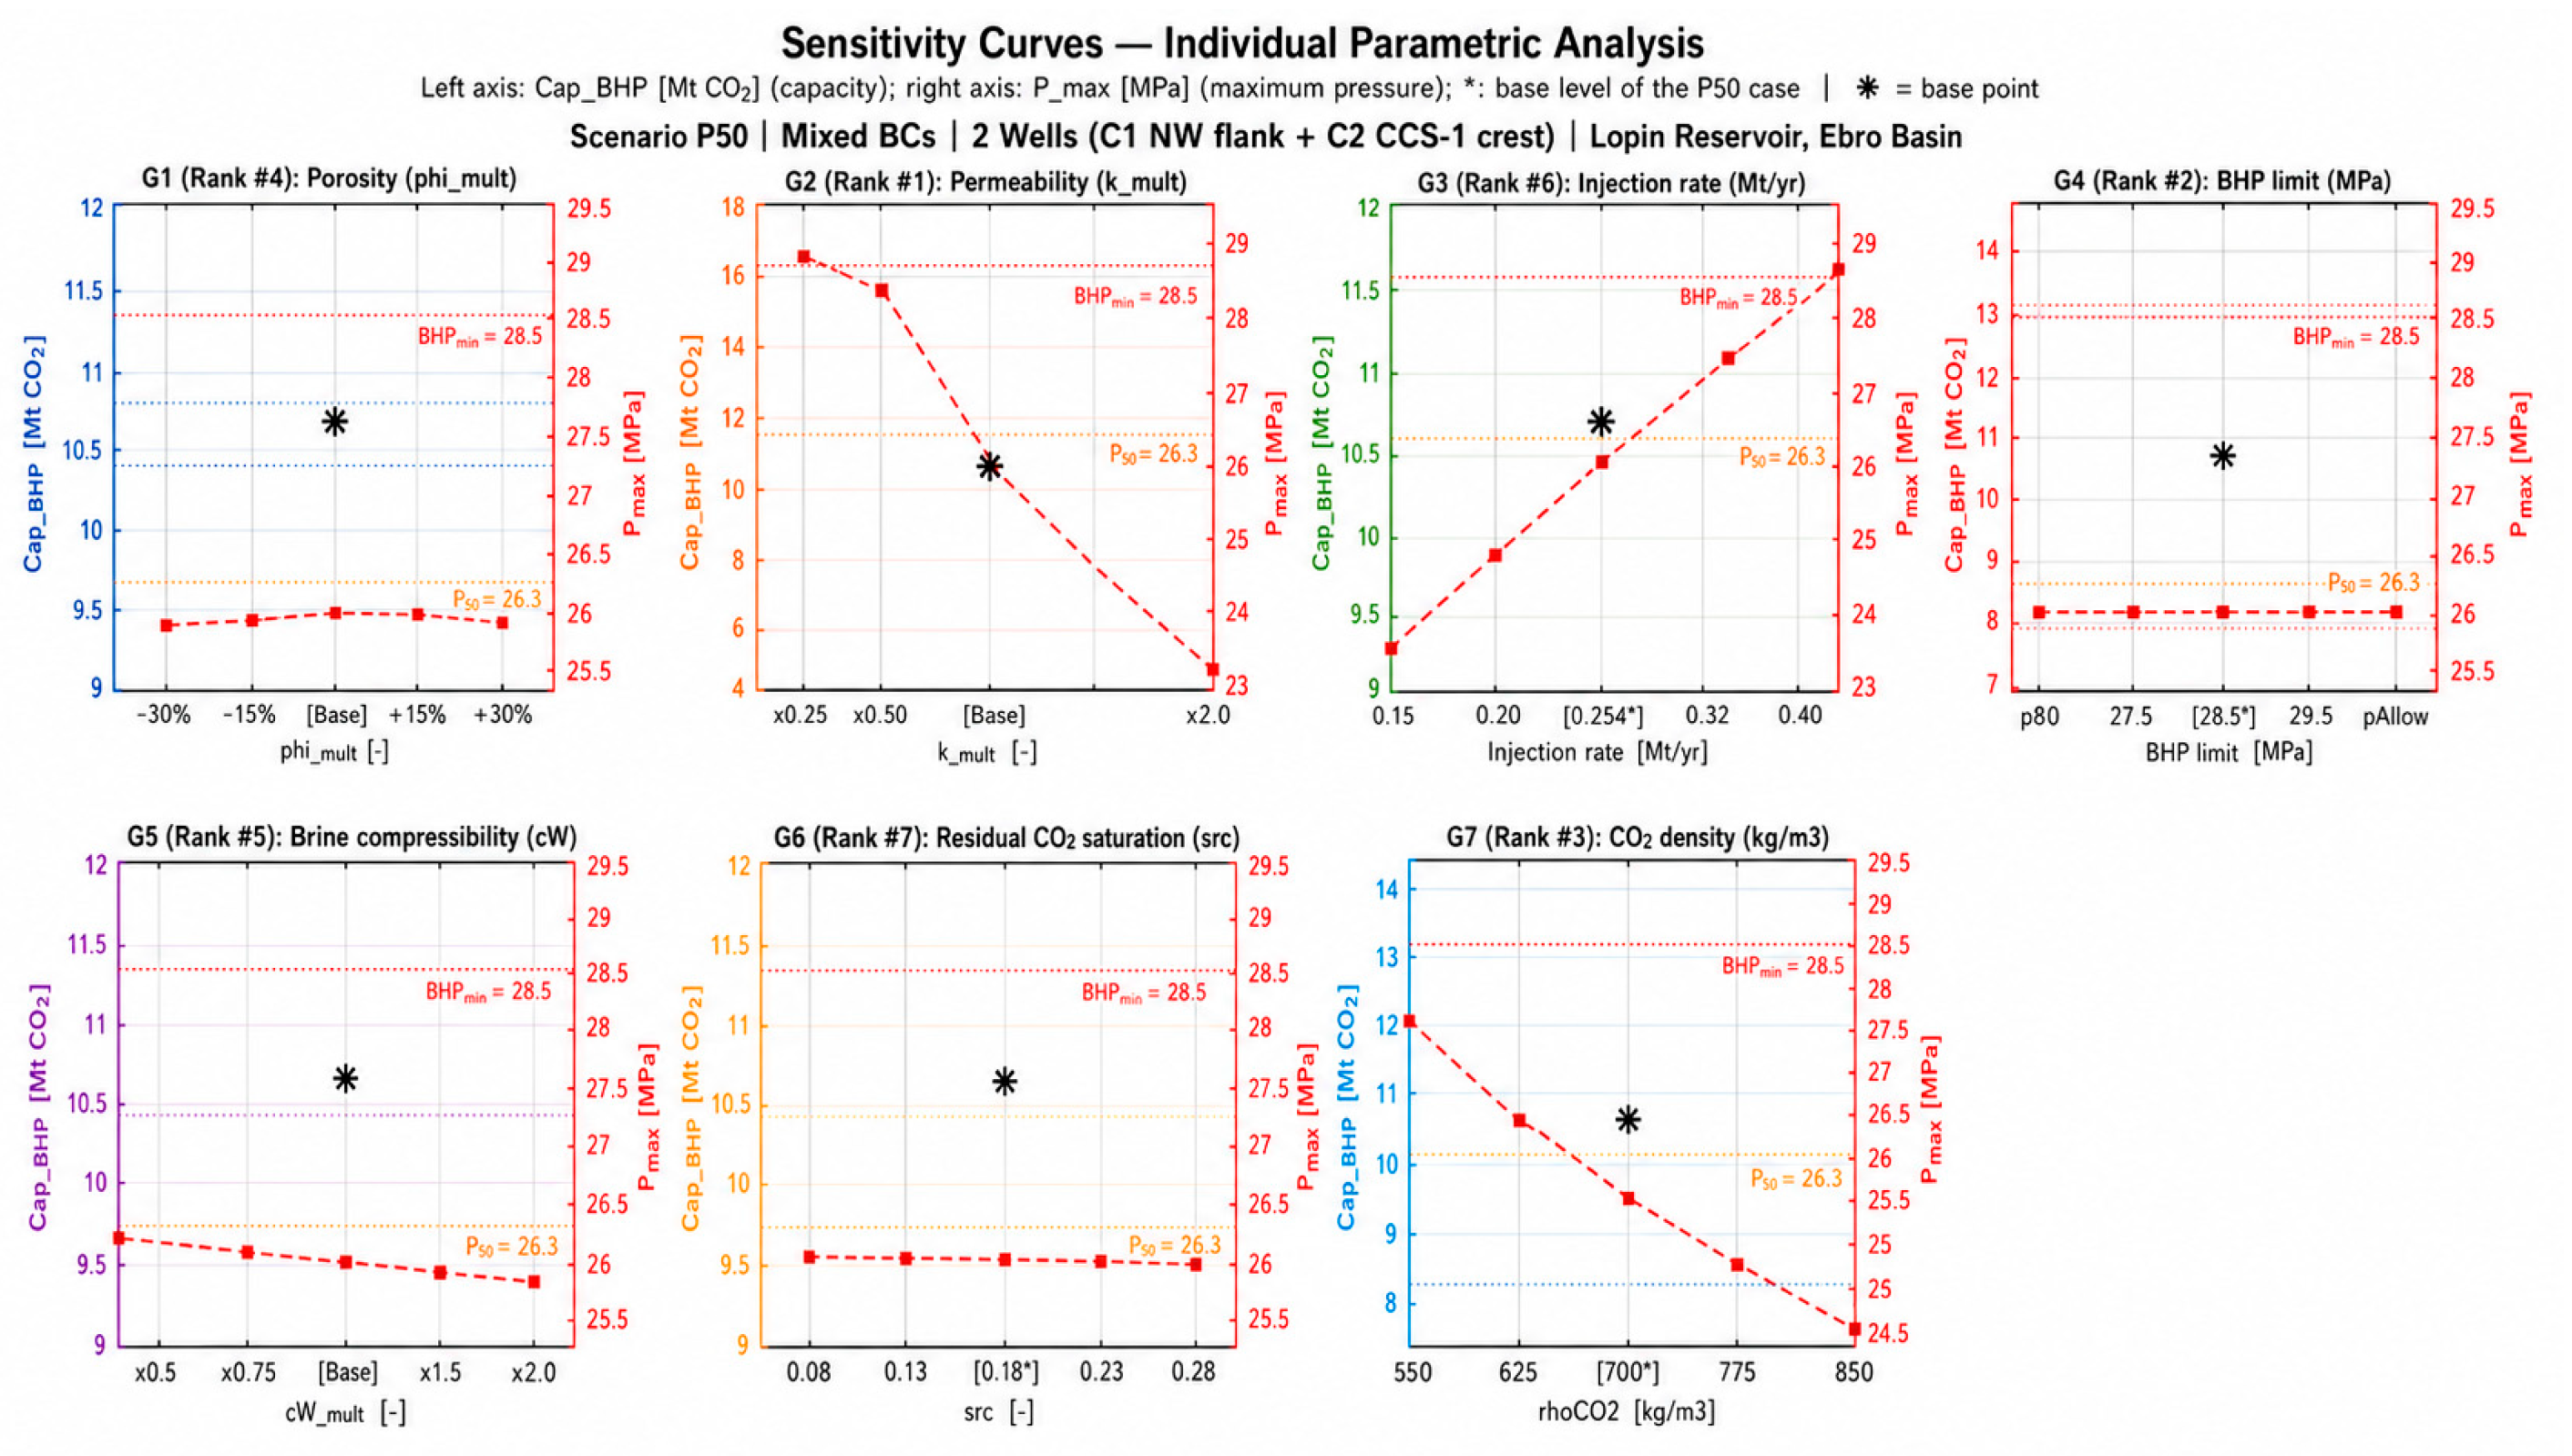
Figure 10.
Heatmap of the sensitivity analysis. Each cell shows the relative variation in Cap_BHP compared with the base case and the absolute capacity value in Mt CO₂. The strongest changes are concentrated in permeability, BHP limit, and CO₂ density.
Figure 10.
Heatmap of the sensitivity analysis. Each cell shows the relative variation in Cap_BHP compared with the base case and the absolute capacity value in Mt CO₂. The strongest changes are concentrated in permeability, BHP limit, and CO₂ density.
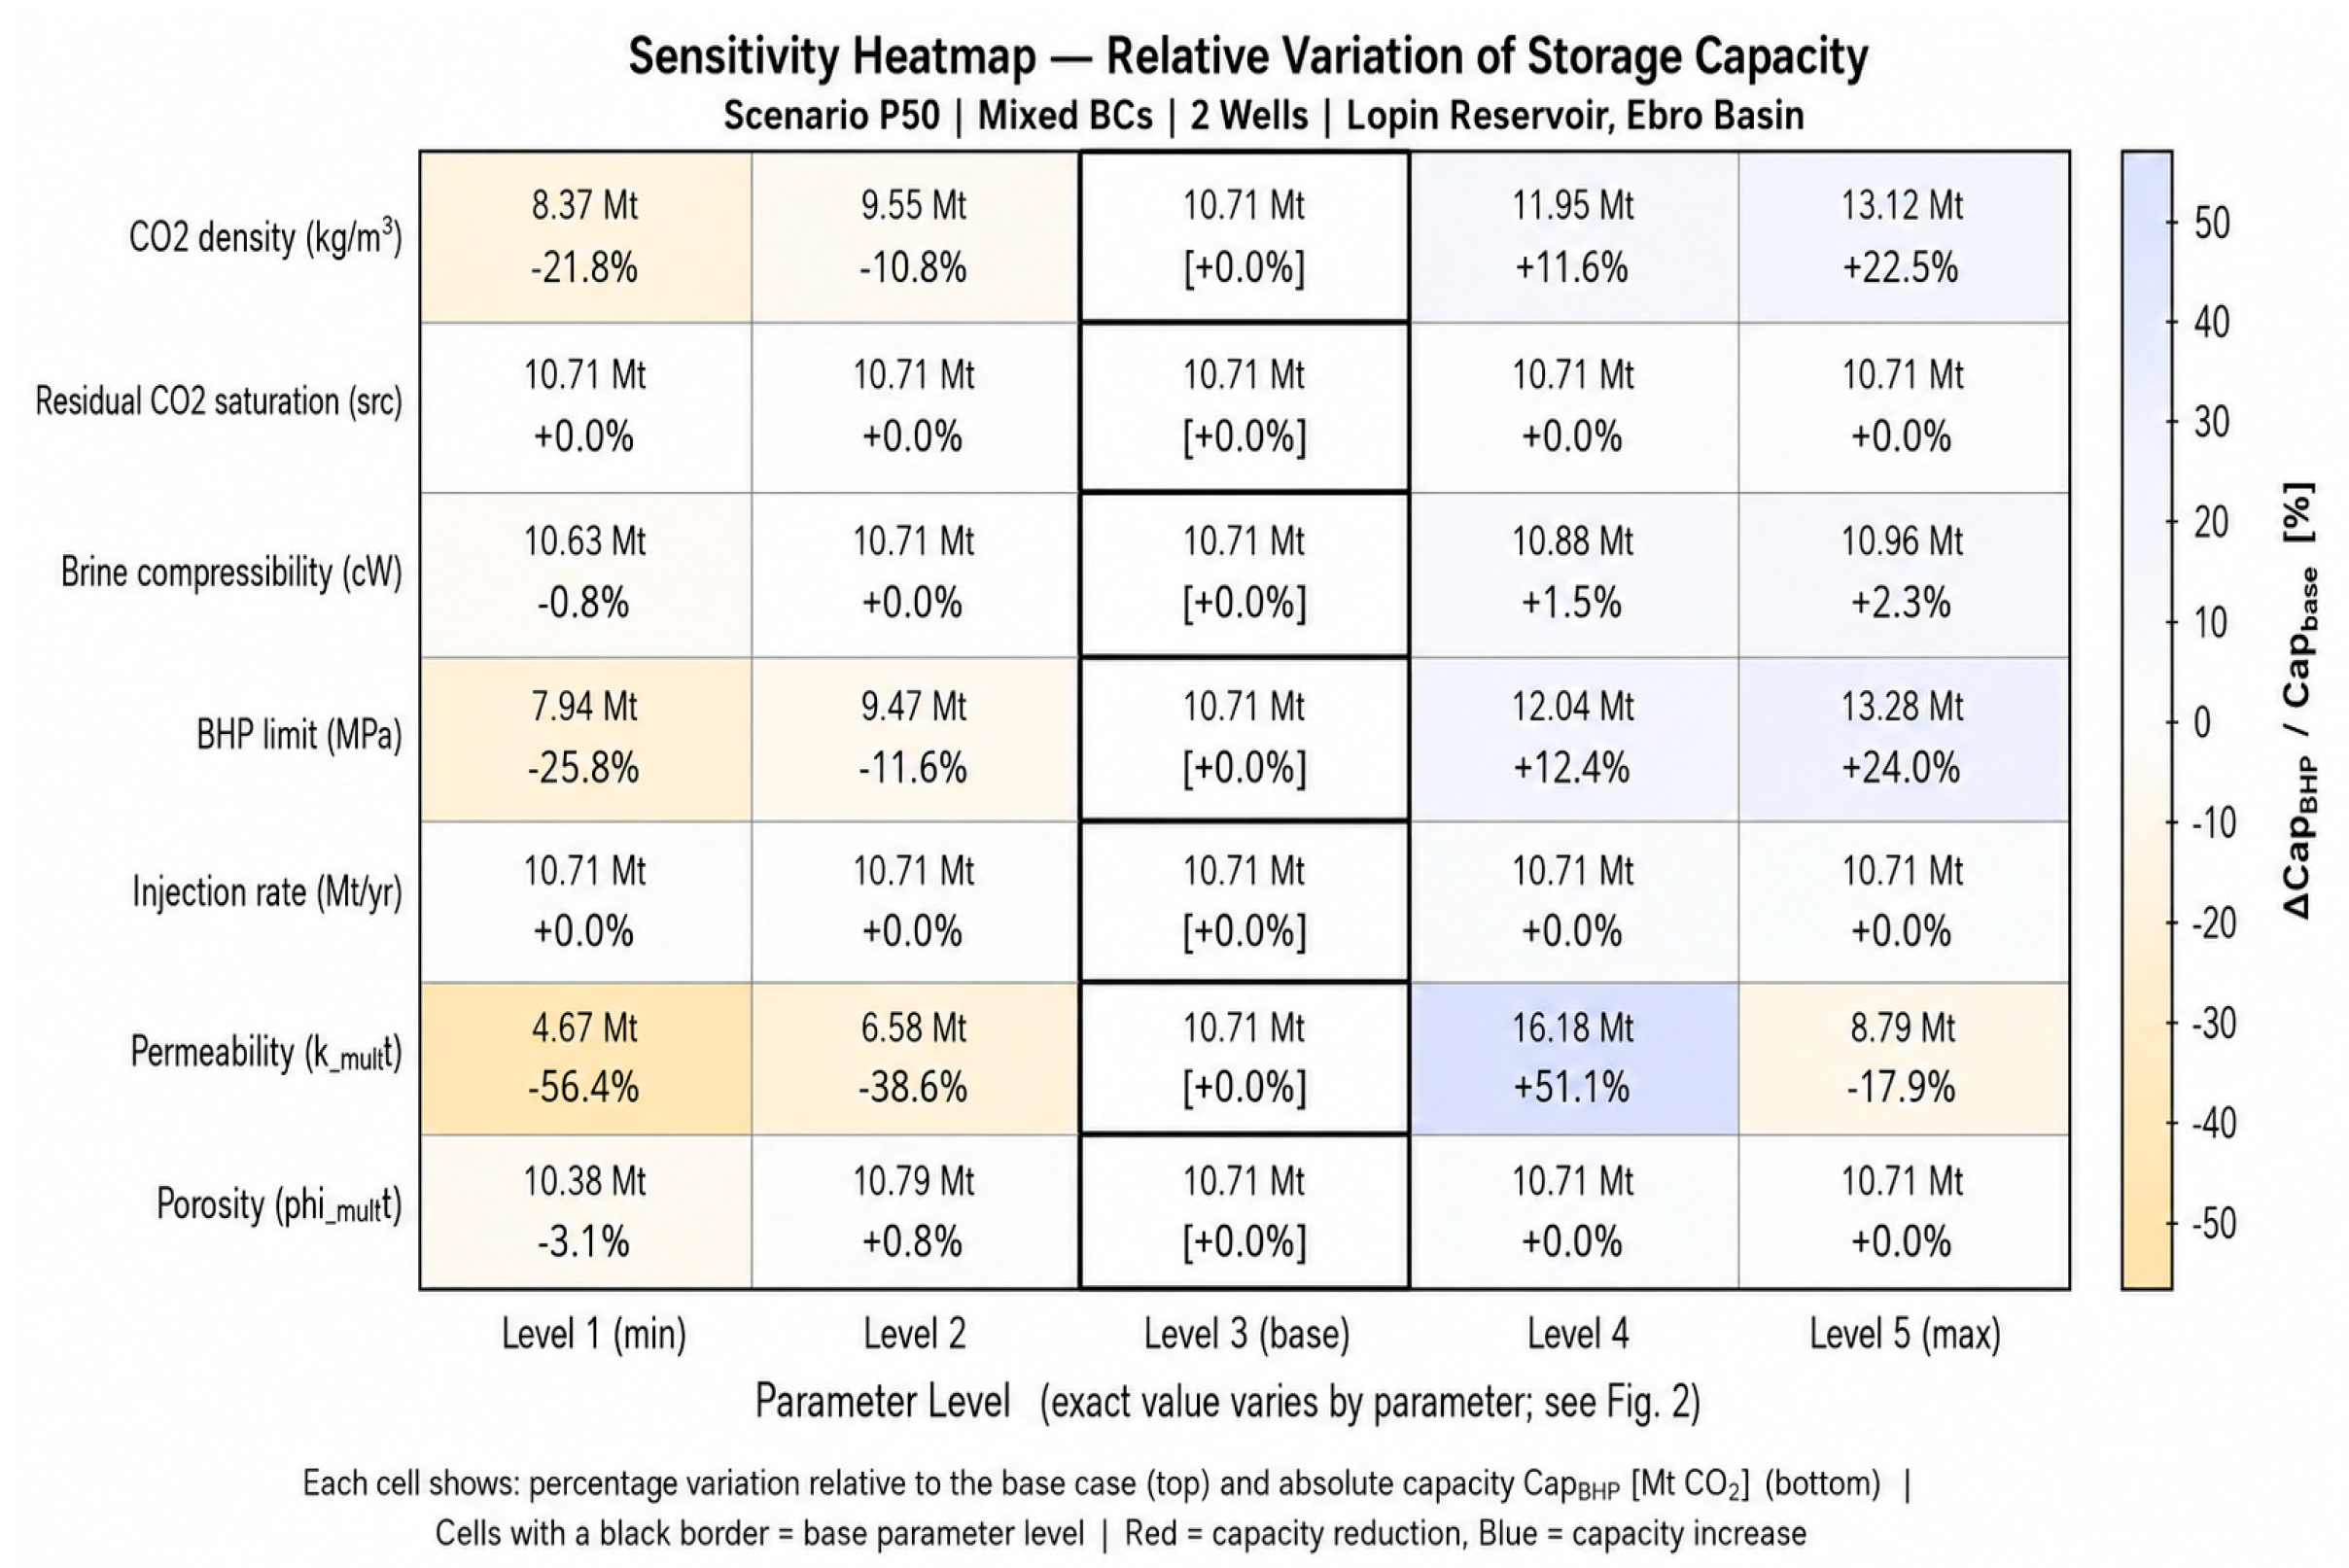

Table 1.
Main parameters of the P50 base case.
| Parameter | Base value | Unit | Function in the model | Source |
| Reference depth | 1760 | m | Defines the initial reservoir state | PilotSTRATEGY geological model [27,28] |
| Reference pressure | 21.5 | MPa | Basis of the hydrostatic pressure field | Site-specific hydrostatic reference pressure [28] |
| Brine density | 1120 | kg/m³ | Controls hydrostatic pressure and buoyancy | Site-specific fluid parameter / model assumption |
| CO₂ density | 700 | kg/m³ | Controls density contrast | Base-case constant-density assumption |
| Brine viscosity | 8 × 10⁻⁴ | Pa·s | Controls aqueous-phase mobility | Constant base-case fluid-property assumption used in the MATLAB/MRST VE model |
| CO₂ viscosity | 6 × 10⁻⁵ | Pa·s | Controls CO₂ mobility | Constant base-case fluid-property assumption used in the MATLAB/MRST VE model |
| Brine compressibility | 4.0 × 10⁻¹⁰ | Pa⁻¹ | Influences pressure propagation | Base-case compressibility value used in the pressure equation; evaluated in the sensitivity analysis |
| Irreducible water saturation | 0.20 | — | Reduces pore space available for CO₂ | Base-case saturation parameter used to define effective pore volume available for CO₂ |
| Residual CO₂ saturation | 0.18 | — | Controls residual-trapping diagnosis | Base-case residual-trapping parameter; evaluated in the sensitivity analysis |
| Mean porosity, P50 | 9.32 | % | Base petrophysical property | P50 GRDECL realization [27,28] |
| Mean permeability, P50 | 14.95 | mD | Main control on transmissibility | P50 GRDECL realization [27,28] |
| Nominal injection rate | 0.254 | Mt/year | Base injection rate for the P50 scenario | P50 reference operational rate used in the Lopín base-case simulation |
| BHP limit | 28.5 | MPa | Main capacity criterion | Conservative operational threshold below p90, pAllow, and pFrac [28] |
Table 2.
One at a time (OAT) sensitivity analysis design.
| Group | Evaluated parameter | Tested values | Base value |
| G1 | Porosity multiplier | ×0.70; ×0.85; ×1.00; ×1.15; ×1.30 | ×1.00 |
| G2 | Permeability multiplier | ×0.25; ×0.50; ×1.00; ×2.00; ×4.00 | ×1.00 |
| G3 | Injection rate | 0.15; 0.20; 0.254; 0.32; 0.40 Mt/year | 0.254 Mt/year |
| G4 | BHP limit | 26.31; 27.50; 28.50; 29.50; 30.50 MPa | 28.50 MPa |
| G5 | Brine compressibility | ×0.50; ×0.75; ×1.00; ×1.50; ×2.00 | ×1.00 |
| G6 | Residual CO₂ saturation | 0.08; 0.13; 0.18; 0.23; 0.28 | 0.18 |
| G7 | CO₂ density | 550; 625; 700; 775; 850 kg/m³ | 700 kg/m³ |
Table 3.
Sensitivity Ranking for pressure limited dynamic capacity.
| Rank | Parameter | Minimum Cap BHP [Mt] |
Maximum Cap BHP[Mt] |
Range [Mt] | Relative importance |
| 1 | Horizontal permeability | 4.66 | 16.25 | 11.58 | 107.7% |
| 2 | BHP limit | 7.93 | 13.25 | 5.32 | 49.5% |
| 3 | CO₂ density | 8.34 | 13.09 | 4.74 | 44.1% |
| 4 | Porosity | 10.34 | 10.76 | 0.41 | 3.9% |
| 5 | Brine compressibility | 10.59 | 10.92 | 0.33 | 3.1% |
| 6 | Injection rate; residual CO₂ saturation | 10.76 | 10.76 | 0.00 | 0.0% |
Disclaimer/Publisher’s Note: The statements, opinions and data contained in all publications are solely those of the individual author(s) and contributor(s) and not of MDPI and/or the editor(s). MDPI and/or the editor(s) disclaim responsibility for any injury to people or property resulting from any ideas, methods, instructions or products referred to in the content. |
© 2026 by the authors. Licensee MDPI, Basel, Switzerland. This article is an open access article distributed under the terms and conditions of the Creative Commons Attribution (CC BY) license (http://creativecommons.org/licenses/by/4.0/).
Copyright: This open access article is published under a Creative Commons CC BY 4.0 license, which permit the free download, distribution, and reuse, provided that the author and preprint are cited in any reuse.