

Submitted:
12 September 2026
Posted:
15 September 2026
You are already at the latest version
Abstract
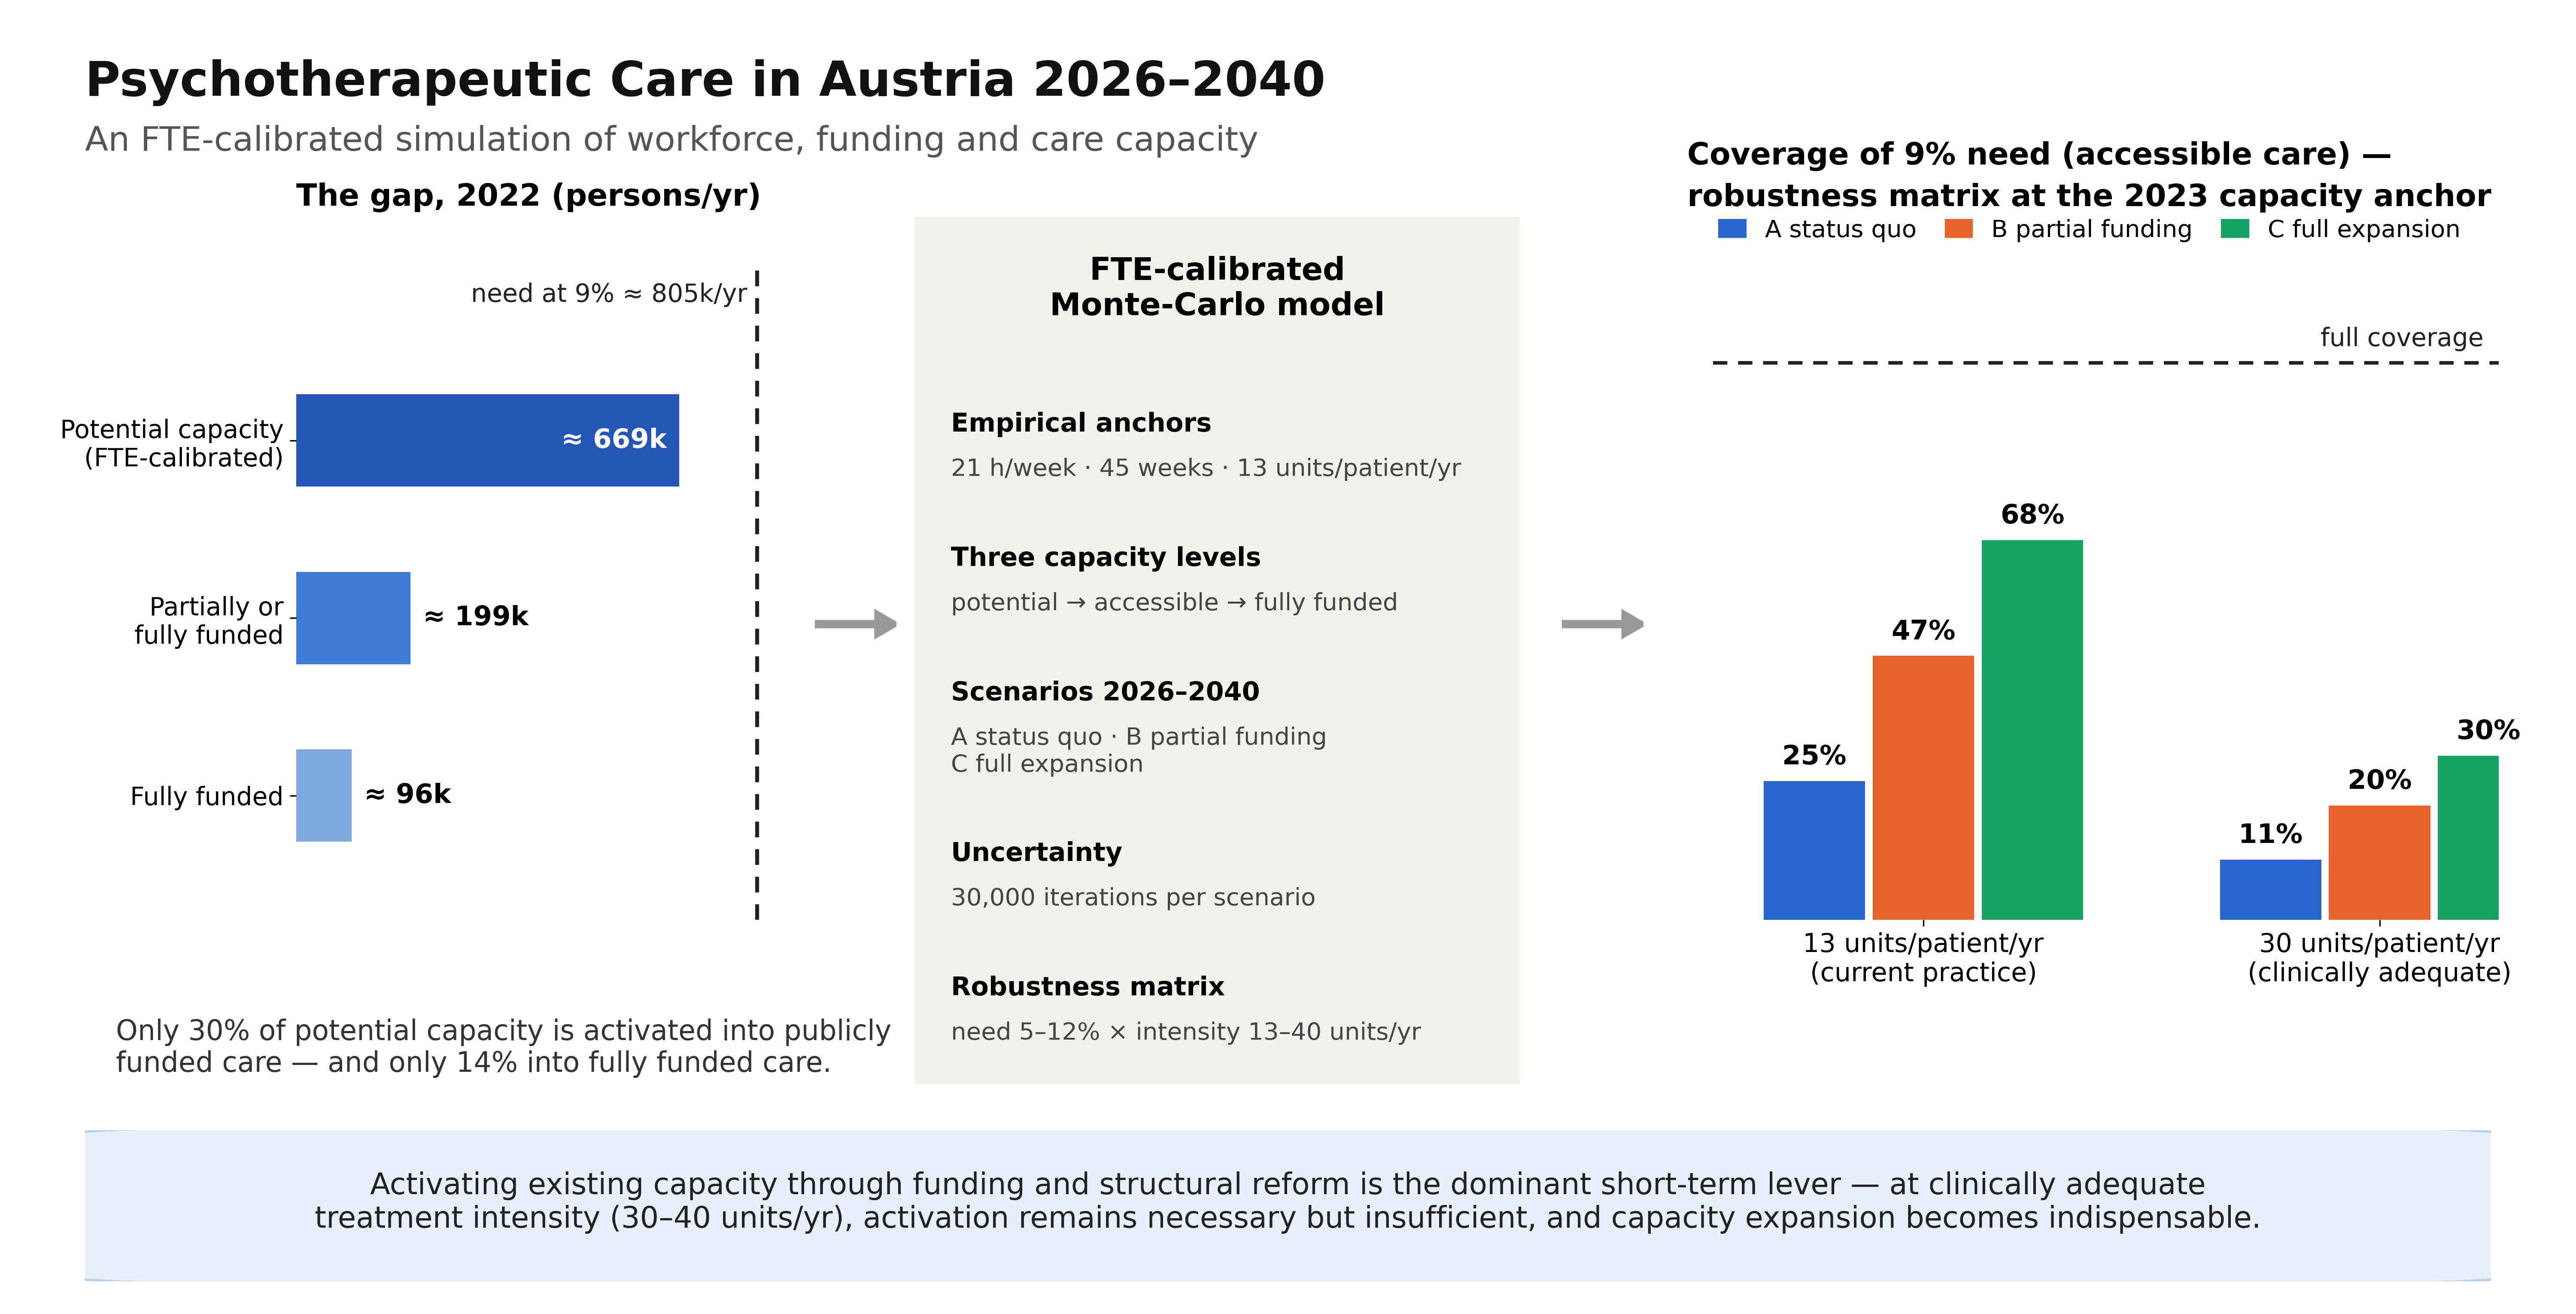
Background/Objectives: Psychotherapeutic care in Austria faces the transition introduced by the Psychotherapy Act 2024 (PThG 2024), an aging profession, and a need far exceeding publicly funded provision: potential capacity (≈ 669,000 persons/year) contrasts with ≈ 199,250 publicly (co-)funded patients in 2022. Methods: We developed an FTE-calibrated Monte-Carlo simulation (30,000 iterations per scenario, 2026–2040; anchors: 21 treatment hours/week, 13 units/patient/year) distinguishing potential, accessible and fully funded capacity, treating supervised trainees of both training systems as a separate, survey-anchored capacity line whose capacity rises with insurance funding, including the PThG 2024 transition (Master entry from 2026/27, phase-3 places with a waiting queue, end of the old pathway in 2038) and a robustness matrix across need (5–12%) and treatment intensity (13–40 units/year). Results: At 13 units/year, the expansion scenario closes the median care gap from 2028 and the partial-funding scenario from 2032, largely by funding services delivered by trainees who already treat under supervision; at 30 units/year, even full expansion covers only ≈ 30% of a 9% need. The end of the old pathway in 2038 produces a cliff in workforce growth and trainee capacity; sustaining growth requires about 1,500 Master places per year with matching phase-3 places. Within scenarios, population needs dominate cost uncertainty (Spearman ρ up to 0.79), ahead of the activation rate; exploratory cumulative follow-on costs to 2040 approximate €83/13/1 billion (A/B/C). Conclusions: Activating existing capacity—including trainees' services—is the dominant short-term lever; Master and phase-3 places decide workforce growth after 2038; at clinically adequate treatment intensity, capacity expansion becomes indispensable.
Keywords:
psychotherapy care
; workforce planning
; full-time-equivalent modelling
; Monte-Carlo simulation
; Psychotherapy Act 2024
; health economics
; access to care
; treatment intensity
; care gap
; Austria
1. Introduction
Psychotherapeutic care in Austria is at a structural turning point, where three developments overlap. First, the Psychotherapy Act 2024 (PThG 2024) fundamentally transforms professional training into a consecutive bachelor–master system, followed by a specialist training phase [1]. Second, the existing profession is aging: of the 11,676 psychotherapists registered in the professional register in 2023, 27% were already over 65 years old [2]. Third—and this has been most clearly underestimated in the debate so far—computed personnel capacity exceeds publicly funded care several times over.
Specifically, recent analyses [2,3] show that, at an empirical median of 21 treatment hours per week and 13 treatment units per patient per year, theoretical total capacity is roughly 669,000 persons per year. In 2022, however, only about 199,250 persons received partially or fully publicly funded psychotherapy—and only about 96,500 persons received fully funded psychotherapy [2,3]. Against an estimated need or treatment willingness of 9% of the population (~805,000 persons in the insured reference population used throughout this model [4]), the gap between computed capacity and socially accessible care becomes evident.
This implies a fundamental conceptual shift: the central challenge of Austrian psychotherapeutic care is not primarily a workforce or recruitment problem, but a funding, access, and structural problem. While reform-cohort models traditionally focus on the number of licensed therapists, the present FTE-calibrated model shows that even a growing profession cannot provide need-covering care without corresponding funding activation.
The health-economic relevance of this diagnosis is considerable. International evidence indicates that longer waiting times for psychotherapeutic treatment are associated with poorer treatment outcomes and with higher economic costs of care, although effect sizes vary across settings [5,6]. Chronic mental disorders in turn cause productivity losses, sick leave, and early retirement on an economically substantial scale [7,8]. Persons in training under supervision (old system: in Ausbildung unter Supervision, i.A.u.S.; new system: in Fachausbildung unter Lehrsupervision, i.F.u.L.; henceforth ‘supervised trainees’)—around 2,799 in 2023 [9] and about 3,200 in 2025 (Section 2.3)—occupy a critical dual function: they are both current care capacity and the future workforce reserve. Their services are currently not funded by statutory health insurance, so their funding, or lack thereof, acts on both dimensions simultaneously.
This paper integrates these empirical anchors for the first time into a consistent simulation model that renders the structural sensitivities of Austrian psychotherapeutic care up to 2040 transparent, differentiates three capacity levels—potential, accessible/partially funded, and fully funded—and models supervised trainees of the old and the new training system as a capacity line of their own.
2. Background: The Austrian Care Situation
2.1. The Profession and the FTE Anchor
As of 2023, 11,676 psychotherapists were registered in the Austrian professional register [2,9]. Of these, 8,523 (73%) were under 65 years of age and 3,159 (27%) over 65. The study by Dinhof et al. [2] provides the first empirically robust data on actual care activity: the median of weekly treatment hours is 21, which, at 45 working weeks per year, yields an annual treatment capacity of 945 hours per full-time-equivalent therapist. At the current value of 13 units per patient per year [2], this corresponds to a computed capacity of 72.7 persons per therapist per year; the parallel social-insurance accounting reports an average of 13.8 units across all funding channels in 2022 [3].
This FTE calibration is methodologically central because it shifts the model basis from headcount logic (‘how many therapists are registered?’) to capacity logic (‘how many persons can actually be treated?’). The underlying 13 treatment units per person per year reflect the current status quo. A systematic review of dose–response effects in routinely delivered psychological therapies reports optimal doses between 4 and 26 sessions, varying with setting, clinical population and outcome criterion, with 11 to 19 sessions typically needed for both reliable and clinically significant improvement [10]; depending on the clinical picture, 30 to 40 units per year are the volumes usually regarded as professionally adequate in Austrian practice. The model thus maps a best-case theoretical capacity at current treatment intensity; adjusting to higher treatment intensities reduces theoretical capacity correspondingly.
2.2. Care Situation and the Funding Gap
The care figures for the reference year 2022 result from the funding channels reported by Dinhof et al. [2]: about 95,100 persons received fully funded psychotherapy through care associations and institutions and about 1,400 through the ÖGK’s own psychotherapeutic facilities—together, ≈96,500 fully funded persons (≈1.1% of the total population)—while a further ≈102,750 persons received subsidized psychotherapy in private practice. Together, these three channels reach ≈199,250 persons through partially or fully funded psychotherapy in 2022, which Dinhof et al. [2] also report as a minimum figure. This quantity is not identical to the 370,389 persons counted under the broader psychosocial care definition of the social-insurance analysis [3] and must not be substituted for it. This contrasts with a treatment willingness and epidemiological need of about 9% of the population [4]. Because publicly funded psychotherapy is an insurance benefit, all model calculations refer to the 8,942,791 persons entitled to benefits in Austrian social health insurance in the 2022 annual average [11] rather than to the resident population of about 9.1 million; at 9% this corresponds to an absolute need of roughly 805,000 persons per year (≈ 820,000 if referred to the resident population).
The difference between computed capacity (669,000) and fully funded care (96,500) illustrates the scale of the funding gap: 86% of potential psychotherapeutic capacity is not translated into socially accessible, fully funded care. Even including partially funded services, care reaches only about 30% of potential capacity—and only about 24% of epidemiological need. This discrepancy is the central structural finding that the present model attempts to quantify and project.
2.3. Training Structure and the Psychotherapy Act 2024
The PThG 2024 fundamentally replaces the Psychotherapy Act of 1990. In the new system, training is structured in three consecutive phases: (1) a six-semester bachelor’s program in psychotherapy, (2) a four-semester master’s program, and (3) a subsequent phase of specialist training under teaching supervision (phase 3) [1,12]. Full licensure occurs only after completion of all three phases. Austrian regulations (PThG 2024 and PTh-AAQV 2024) fix a minimum duration for phase 3 in calendar years; both specify minimum contents and volumes instead (in total at least 2,050 training hours, of which 1,000 hours of psychotherapeutic treatment, 400 hours of theory, 200 hours of teaching supervision and 200 hours of self-experience) [1,12]. The effective duration of phase 3 is therefore not a legal constant, but a model parameter, and the simulation varies it accordingly (Table A3).
In the old system, 5,021 persons were still enrolled in the Fachspezifikum (method-specific training) in 2023 [13], and 2,799 persons were in specialist training under teaching supervision [9]; completions in the old system reached 514 in 2023 [13]. The most recent training statistics (reference date 1 June 2025) show that the old pathway is still expanding ahead of its statutory closure: 5,601 persons were enrolled in the Fachspezifikum, with 929 admissions, 624 completions and 91 drop-outs in the 2024/25 reporting year; 3,238 of the enrolled persons (57.8%) already held the status ‘in training under supervision’ (i.A.u.S.), which entitles them to treat patients under supervision, so that—as the training statistics note—they already contribute to psychotherapeutic care, although their services are not refundable by statutory health insurance [14]. The transitional provisions of the PThG 2024 fix the horizon of this pathway: admission to the old Fachspezifikum is inadmissible after 1 October 2030, and old-pathway training must be completed by 30 September 2038 (§ 60 PThG 2024) [1]. Old-system completions will therefore end in 2038. In the new system, the Master program in psychotherapy is offered from the winter semester 2026/27; persons with an equivalent bachelor’s degree enter at Master level (about 500 places per year at public universities, a planning figure of the Federal Ministry communicated to the authors, and an estimated 500 at private universities), and specified professions—psychiatrists, clinical and health psychologists, music therapists—may enter phase 3 directly (§ 10 PThG 2024) [1,14]. Two provisions make trainees a policy lever from the outset: from 1 October 2026, persons in training under supervision are listed in the professional register with the addition ‘in specialist training under teaching supervision’, which allows patients to use their services as an insurance benefit [14]; and the first licensures from the Master route are expected from about 2030–2032, several years earlier than the first graduates of the full bachelor–master route.
2.4. Demographic Development of the Profession
The profession’s age structure points to a substantial retirement wave over the next 10 to 15 years. Therapists over 65 (3,159 persons) continue to contribute to care capacity, albeit with reduced weekly hours [2]. The model assumes a retirement/exit rate of about 3.5% per year (range: 2–5.5%), yielding a modeled exit figure of about 420 persons per year in 2026, rising with the growing stock to 832 persons per year in 2040 under Scenario A and 937 under Scenario C.
3. Materials and Methods
3.1. Theoretical Framework
The model operates on five interlinked analytical levels. Level 1—training policy: decisions on training architecture, phase-3 capacities, and funding act on the future workforce with a time lag; the latency between a training decision and its licensure effect is modeled for the Master-entry route of the new system as two years of Master’s studies plus a variable phase-3 duration of two to five years (mode three), so that the first licensures arrive about four to seven years after entry; because phase 3 carries no statutory minimum length, this latency is drawn from a distribution rather than fixed (Table A3). Trainees in phase 3 already treat patients under teaching supervision, so the care effect of a training decision precedes its licensure effect. Level 2—workforce dynamics (FTE): the stock dynamics of licensed therapists, calibrated with the empirical FTE anchor of 945 treatment hours/year and the age-corrected value of 57.31 persons per registered therapist (72.69 per fully active therapist), define potential care capacity. Level 3—funding activation: the share of potential capacity translated into accessible (partially/fully funded) care depends on care structures, tariffs, statutory-insurance contracting, and the institutional integration of teaching supervision; this activation rate is the genuinely policy-sensitive lever. Level 4—waiting time and chronification: the care gap (need minus accessible capacity) determines chronification risk via waiting time; this relationship is qualitatively documented but not empirically quantified in precise risk curves by waiting duration, so the model treats it as a sensitivity parameter in three variants. Level 5—societal follow-on costs: chronification, sick leave, and productivity losses generate monetizable follow-on costs that quantify the economic value of investing in accessible care.
The model’s central theoretical thesis is that funding activation—the share of potential FTE capacity converted into socially accessible care—is the dominant health-policy lever. The number of licensed psychotherapists is a necessary but not sufficient condition for need-covering care. A policy focused exclusively on training numbers risks leaving already existing potential unactivated.
3.2. Study Design
This is a deterministic–stochastic simulation model with probabilistic uncertainty analysis (Monte-Carlo simulation, 30,000 iterations per scenario). The model is not a predictive forecasting model but a scenario model that represents structural sensitivities and ranges of possible developments under defined assumptions. The model logic follows discrete annual updates from 2026 to 2040.
3.3. FTE Calibration as the Methodological Foundation
The model’s methodological foundation is FTE (full-time-equivalent) logic rather than pure headcount logic. The capacity calculation uses the empirically validated anchor of 945 annual treatment hours per therapist [2] and 13 treatment units per patient per year [2]. Methodologically central is the distinction between a computed FTE capacity of 72.69 persons/year per fully active therapist and an age-corrected empirical capacity of 57.31 persons/year per registered therapist. The latter—derived from the ratio 669,121/11,676—is used in the model because it implicitly accounts for the reduced activity of therapists over 65. This empirical calibration avoids the overestimation trap that a pure FTE approach would create.
This yields the core formulas: annual hours = 21 h/week × 45 weeks = 945 h/year; capacity per fully active therapist = 945/13 = 72.69 persons/year; capacity per registered therapist (model value) = 669,121/11,676 = 57.31 persons/year. Potential capacity(t) = therapists(t) × capacity per registered therapist + trainee capacity(t), where trainee capacity(t) = [i.A.u.S.(t) + i.F.u.L.(t)] × 72.69 × [f₀ + (f₁ − f₀) × insurance-funding share of trainee services × ramp(t − 1)], with f₀ = 0.60 in the current unfunded state and f₁ = 0.90 under full insurance funding (modes; Section 3.8.2, Appendix A.4). Accessible capacity(t) = therapists’ capacity × activation rate(t) + trainee capacity(t) × insurance-funding share of trainee services(t). Fully funded capacity(t) = therapists’ capacity × full-funding share(t) + activated trainee capacity × (full-funding share/activation rate); the full-funding share of therapists’ capacity is defined relative to potential capacity throughout (cf. Appendix B.2). Care gap(t) = need(t) − accessible capacity(t), bounded below at zero. Two distinct quantities must not be conflated at this point. The 13 treatment units per patient and year reported by Dinhof et al. [2] are the empirically observed average of currently publicly funded psychotherapeutic care in Austria; this value estimates only the capacity the existing system realizes. The 40 sessions per year used by Riess et al. [4], by contrast, are a therapeutic reference value describing the intensity that adequate, guideline-oriented treatment of many mental disorders can require; it characterizes need, not delivered care. The model keeps the two apart: capacity is computed from the empirical 13 units, while treatment intensities of 20, 30 and 40 units enter exclusively as sensitivity parameters in the robustness analysis (Section 4.9). This allows us to show how higher clinical treatment intensity affects computed capacity and the care gap without altering the empirical input data.
3.4. The Three-Level Capacity Model
The model distinguishes three operationally separate levels of care capacity. Level 1—potential capacity: the theoretically available care capacity based on FTE calibration; it comprises the licensed profession and, as a separate capacity line, supervised trainees of the old system (i.A.u.S.) and of the new system (i.F.u.L., phase 3), whose treatment capacity counts as potential whether or not it is insurance-funded, although its level rises with funding (Section 3.8.2). Level 2—accessible capacity: the share of potential capacity translated into actually usable care via statutory-insurance contracting, outpatient-clinic structures, partial funding, or self-payment; for therapists, the activation rate varies by scenario from 33% (Scenario A) to 82% (Scenario C), and for trainees, a separate parameter—the share of trainee services funded by statutory health insurance—is phased in from 2027 (Section 3.8.2). Level 3—fully funded capacity: the share of potential capacity provided to patients without financial co-payment (statutory health insurance, ÖGK quotas, free outpatient-clinic care); this is the socially relevant core quantity for equity-oriented care planning.
3.5. Chronification as a Sensitivity Parameter
The relationship between waiting time and chronification of mental disorders is qualitatively supported by the literature, but precise, validated risk curves by waiting duration are not available [5,6]. Two qualifications matter here: van Dijk et al. [5] found no association between waiting time and the clinical course during the waiting period—the association they report concerns the treatment outcome—and Catarino et al. [6] model waiting time as a cost driver without estimating a waiting-time-dependent drop-out or persistence risk. The model therefore treats chronification as an explicit sensitivity parameter and runs three variants in parallel (Table 1); it takes the direction of the effect from the literature, and its magnitude is a scenario assumption in this study. In the results reported below, the realistic variant serves as the reference; the conservative and pessimistic variants provide robustness ranges.
3.6. Monte-Carlo Parameters and Distributions
All uncertain parameters are modeled as triangular distributions (minimum; mode; maximum), drawn once per Monte-Carlo iteration (Table A3). Common to all scenarios are: population need (5%; 7.5%; 9%; 9% corresponds to the upper need estimate [2,4]); capacity per registered therapist (50; 57.31; 68 persons/year); capacity per supervised trainee relative to a fully active therapist in the current unfunded state (f₀: 0.50; 0.60; 0.70) and under full insurance funding (f₁: 0.80; 0.90; 1.00), identical for both training systems; admissions to the old pathway until 2030 (850; 950; 1,100 per year) and its turnover time (8; 9; 10 years); Master places at private universities (250; 500; 750 per year, plus 500 fixed places at public universities); direct entrants to phase 3 (20; 50; 100 per year); phase-3 duration (2; 3; 5 years) and lead time to full trainee activity (0.5; 1; 2 years); retirement base rate (2.0%; 3.5%; 5.5%) and its growth; other exits; and the three cost components. Scenario-specific are: activation rate; full-funding share; completion rate of the new system; phase-3 training places; the target share of insurance-funded trainee services; chronification rate; and waiting-time cost factor.
3.7. Scenarios
Scenario A—status quo/underfunding: continuation of current structures; low activation rate (mean 33%), high self-payment share, limited outpatient-clinic capacity, insurance funding of trainee services rising only to 15–50% (mode 30%), 350–800 phase-3 training places per year. Scenario B—transition/partial funding: stepwise expansion of outpatient structures, partial funding of trainee services (40–85%, mode 65%), 800–1,600 phase-3 places per year, partial expansion of statutory-insurance contracting; the activation rate rises to a mean of 58% and the full-funding share to 39% of potential capacity. Scenario C—expansion/full funding: near-complete insurance funding of trainee services (75–100%, mode 90%), 1,300–2,500 phase-3 places at universities, outpatient clinics and teaching practices, substantial expansion of psychotherapeutic outpatient clinics, and a marked increase in publicly funded quotas; activation rate mean 82%, full-funding share 76% of potential capacity (equivalent to 93% of accessible capacity). Master’s places (about 1,000 per year) and admissions to the old pathway are held at their current levels in all three scenarios; the effect of additional Master’s places is examined separately (Section 4.8).

Table 2.
Empirical model anchors for the FTE calibration.
| Parameter | Value | Source |
|---|---|---|
| Psychotherapists in the professional register (2023) | 11,676 | [2,9] |
| of whom under 65 years | 8,523 (73%) | [2] |
| of whom over 65 years | 3,159 (27%) | [2] |
| Median treatment activity | 21 h/week | [2] |
| Working weeks per year | 45 | model assumption |
| Annual treatment hours per therapist (FTE) | 945 h | 21 × 45 |
| Current units per patient per year | 13 | [2] |
| Theoretical capacity per therapist under 65 | 72.7 persons/year | 945/13 |
| Theoretical total capacity, Austria | ≈ 669,121 | [2] |
| Persons reached with partial/full funding (2022) | ≈ 199,250 | [3] |
| Persons reached with full funding (2022) | ≈ 96,500 | [3] |
| Need / treatment willingness | ≈ 9% of the population | [4] |
| Psychotherapy education completions (Fachspezifikum; 2024/25) | 624 | [14] |
| Persons in psychotherapy education (Fachspezifikum; 1 June 2025) | 5,601 | [14] |
| Persons in training under supervision (i.A.u.S.; 1 June 2025) | 3,238 (57.8%) | [14] |
| Master places per year, new system (from 2026/27) | ≈ 1,000 (500 public + ≈ 500 private) | planning figure (BMBWF) / authors’ estimate |
| Capacity per supervised trainee (share of a fully active therapist; both systems) | 0.60 unfunded (today) → 0.90 fully insurance-funded | survey re-analysis (Table S7) [9] / expert assumption (authors) |
| Monte-Carlo iterations | 30,000 | model parameter |
Note: FTE = full-time equivalent. i.A.u.S. = in training under supervision (old system); i.F.u.L. = in specialist training under teaching supervision (new system); together ‘supervised trainees’. Need is operationalized as treatment willingness × population.
3.8. Workforce and Capacity Model
3.8.1. Stock Dynamics
The annual change in the stock of licensed psychotherapists follows the classical stock equation: PT(t+1) = PT(t) + completions(t) − retirements(t) − exits(t). Completions come from the old pathway (until 2038) and, from 2029/2031 onward, from phase 3 of the new system. The scenario-dependent result in the final year 2040 (median) is: Scenario A = 15,333 persons (+31% versus the 2023 baseline of 11,676), Scenario B = 16,743 persons (+43%), Scenario C = 17,439 persons (+49%); in all scenarios the stock peaks in 2038 (16,195/17,341/17,921) and declines thereafter, because the old pathway ends and the new system’s output does not yet cover retirements (Section 4.5).
3.8.2. Three-Level Capacity Dynamics
Potential FTE capacity results from the stock multiplied by the age-corrected capacity per registered therapist (57.31 persons/year; Section 3.3), a value that already embeds the reduced activity of therapists over 65 relative to the 72.69 persons/year of a fully active therapist, plus the capacity of supervised trainees. Capacity per trainee is the same for both training systems and depends on funding for trainee services. In the current, unfunded state, it is set at 60% (range 50–70%) of a fully active therapist. This value is anchored on a stratified re-analysis of the authors’ member survey of December 2024 [9] (Supplementary Material S2, Table S7): trainees under supervision (n = 638) reported 0.61 of the mean weekly free-practice hours (including administration), 0.70 of the mean total weekly hours (free practice plus institution) and 0.50 of the mean annual patients of listed psychotherapists (n = 2,139); 40% practised psychotherapy as their sole occupation (listed: 67%) and 82% planned to expand their hours by 2030 (mean +12.6 h/week), i.e. the unfunded trainee is a part-time provider with unused capacity. Under full insurance funding, the capacity per trainee is assumed to rise to 90% (range 80–100%)—an expert assumption of the authors, because the obligation to attend supervision remains while theory training is completed—and, because a practice has to be built up, it follows the funding ramp with a lag of one year: capacity per trainee(t) = 72.69 × [f₀ + (f₁ − f₀) × funding share × ramp(t − 1)], applied to the whole treating trainee stock. With the scenario-specific funding shares, the effective factor therefore rises from 0.60 in 2026–2027 to about 0.70 (A), 0.79 (B), and 0.86 (C) from 2031 (medians); both f₀ and f₁ are part of the sensitivity analysis, and fixed, funding-independent factors are examined in Section 4.9.5. Accessible capacity is the sum of therapists’ capacity multiplied by the scenario-dependent activation rate and trainee capacity multiplied by the share of trainee services funded by statutory health insurance. Trainee services are currently paid privately; because persons in training under supervision are listed in the professional register from 1 October 2026 and their services can then be used as an insurance benefit [14], the funding share is phased in linearly from zero in 2026 to its scenario value in 2030 (25% of the target in 2027, 50% in 2028, 75% in 2029). In Scenario A, the activation rate is only 33% (corresponding to today’s reality of roughly 30% of all therapists holding an insurance quota or an outpatient-clinic position). In Scenario C it rises to 82%, implying a comprehensive restructuring of the care landscape with substantial insurance expansion and outpatient-clinic development.
3.8.3. Care Gap
The care gap is operationalized as the positive difference between need (treatment willingness × population) and accessible capacity: care gap(t) = max(0, need(t) − accessible capacity(t)). In Scenario A, the care gap reaches a median of 321,000 persons/year by 2040; in Scenario B, 37,000 (after a closed gap from 2032 to 2036); and in Scenario C, 0 (accessible capacity exceeds the median need from 2028 onward).
3.9. Reform-Cohort Model
The reform-cohort model distinguishes three groups simulated in parallel (Table 3): (1) persons in the old training system (Fachspezifikum), anchored on the training statistics 2025 (5,601 enrolled, 3,238 of them i.A.u.S.) [14], with admissions of about 950 per year until the statutory admission deadline of 1 October 2030, completions following the observed turnover of the pool (about nine years) until 2030 and accelerating thereafter so that all remaining candidates complete by the statutory deadline of 30 September 2038 (§ 60 PThG 2024); the i.A.u.S. share of the pool is 57.8% until 2030 and rises to 100% by 2033 as the remaining candidates advance into the supervised-treatment phase; (2) Master-entry cohorts of the new system from the winter semester 2026/27—about 1,000 per year (500 fixed places at public universities, 250–750 at private universities), two years of Master studies, then phase 3 (i.F.u.L.) with a duration of two to five years and a lead time of 0.5–2 years before full treatment activity—supplemented by a small number of direct entrants to phase 3 under § 10 PThG 2024 (20–100 per year); the completion rate of the new system (Table A3) is applied at the end of the Master programme; (3) bachelor programmes of the new system, currently offered only at private universities, whose graduates fill the same Master places and are therefore not counted separately. Propaedeutic candidates who can no longer enter the old Fachspezifikum in time (about 30% switch to the Master program, according to the authors’ assessment) compete for the existing Master places and do not add throughput. Phase-3 training places (Table A3, places per year) multiplied by the phase-3 duration give the number of simultaneously available places; candidates without a place wait in a first-in-first-out queue and are treated at 50% of the i.F.u.L. capacity while waiting (500 of the 1,000 required treatment hours can be completed outside a formal training place). Waiting time prolongs their training. The queue logic is adapted from the authors’ phase-3 decision model; all candidates who begin phase 3 complete it.
This structure implies two transition phenomena. The first is the familiar ‘reform dip’ in licensures between the end of the old pathway and the ramp-up of the new one; in the model it is short and shallow, because Master entrants are licensed from 2031 and the old pathway continues to produce about 714 completions per year until 2038. The second—more consequential—is a ‘transition cliff’ in 2038: when the old pathway ends, its 714 completions per year and the roughly 4,000 supervised trainees of the old system disappear within one to two years, while the new system supplies 576/744/838 licensures per year (Scenarios A/B/C) and 1,800–2,700 phase-3 trainees. From 2039, the licensed stock therefore shrinks in all three scenarios, and trainee capacity falls to roughly a fifth to a third of its 2032–2033 peak (Section 4.5 and Section 5.3).
3.10. Health-Economic Model
Societal follow-on costs comprise three additive components: follow-on costs(t) = waiting-time costs(t) + chronification costs(t) + productivity losses(t). This structure is conservative because it does not fully capture interaction effects between components (e.g., chronification increasing sick leave).
Waiting-time costs cover the excess utilization of general practice, psychiatric emergency care, and psychotropic medication between care indication and treatment start. Based on the international evidence on excess costs and productivity effects of untreated and more severe mental disorders [7,8], base costs of €2,500/€5,000/€9,000 per untreated person and year are modeled (triangular; mode €5,000) and multiplied by the scenario-specific waiting-time cost factor (Table A3), which corresponds to effective waiting-time costs of about €440–€710 per untreated person and month across scenarios. Chronification costs: chronic mental disorders entail substantially higher lifetime costs; the model computes them as the product of the care gap, the chronification rate (variant-dependent), and an excess-cost factor (mean €8,400/year per chronified person). For orientation: König et al. [8] report six-month excess costs of €6,123 (severity level 1) to €31,883 (level 4) in 2019 euros, i.e. roughly €12,000 to €64,000 annualized; the value used here is deliberately set below the lower end of that range. Productivity losses follow the human-capital approach: an employment rate of 58%, 24 sick-leave days/year and a GDP contribution of €490 per working day imply about €6,800 per affected employed person and year. Because only some people in the care gap incur losses of that magnitude, this value enters the model as an upper anchor. In contrast, the modeled productivity cost per person in the care gap is drawn from a triangular distribution of €1,000/€3,000/€7,000 (Table A3). For context, in 2025 dependent employees in Austria recorded an average of 14.7 absence days per insured person, corresponding to about 4.0% of total working time [15]; the 24 days assumed here refer to persons with untreated mental disorders, whose absence durations exceed the population average.
3.11. Empirical Anchoring of Secondary Costs: Austrian Cost Data
To anchor the per-person cost parameters in Austrian empirical data, we cross-checked the model’s cost assumptions against the secondary-cost compilation by Seitz et al. [16], who assembled per-patient primary and secondary annual costs for chronic pain patients with somatic symptom disorder in Austria (n = 106; 1-year follow-up after an 8-week integrated inpatient intervention) from Austrian statistical and tariff sources: €186 per sick-leave day, derived from an average of 35 million workdays lost per year at a total cost of €6.5 billion over 2006–2010 [16,17]; €3,168 per hospital day in a public hospital (range: €2,923–3,401); €24 per medical examination and €10.1 per physician consultation billed to the social-insurance carriers; and average medication costs per patient [16].
In that high-utilizer population, total annual secondary costs per patient amounted to €147,689 before the intervention and €67,943 in the year after it—a reduction of €79,746 per patient per year, driven mainly by 24.3 fewer hospitalization days (−€76,919) and 64.5 fewer sick-leave days (−€11,980), while expenditure on psychotherapy sessions increased (+€237) [16]. Table 4 sets these empirical anchors against the model’s per-person cost parameters.
4. Results
4.1. Scenario Analysis
Scenario A—status quo/underfunding continues current structures. The activation rate remains at about 33%; only about 16% of potential capacity is provided fully funded. The care gap falls from about 418,000 persons/year in 2026 to about 287,000 in 2033—because even the modest insurance funding of trainee services (30%) activates up to 84,000 persons/year of trainee capacity—and then widens again to about 321,000 by 2040 as the old-system trainees complete and disappear (§ 60 PThG 2024). The new system delivers only about 580 licensures per year. Cumulative follow-on costs by 2040: €83 billion (95% PI: 37–143).
Scenario B—transition/partial funding assumes a stepwise expansion of outpatient structures and partial funding of trainee services (65%). The activation rate rises to 58%, the full-funding share to 39% of potential capacity. The care gap falls from 249,000 (2026) to zero between 2032 and 2036—activated trainee capacity peaks at about 197,000 persons/year in 2032—and reopens to about 37,000 persons/year in 2040 after the old pathway ends (41% of runs show no gap in 2040); relative to Scenario A this is an 88% reduction. Cumulative follow-on costs: €13 billion (95% PI: 1–51).
Scenario C—expansion/full funding models near-complete insurance funding of trainee services (90%), sufficient phase-3 training places, and a substantial expansion of psychotherapeutic outpatient clinics. The activation rate reaches about 82%, the full-funding share 76% of potential capacity (equivalent to 93% of accessible capacity). Accessible capacity exceeds the median modeled need from 2028; the care gap remains at a median of 0 until 2040 (99% of runs show no gap in 2040). Cumulative follow-on costs fall to €1.3 billion (95% PI: 0–8), corresponding to savings of roughly €82 billion versus Scenario A.
Timing the levers is decisive. Insurance funding of trainee services acts within one to four years, because the trainees already exist and already treat; the phase-3 and Master pipeline acts on licensures after four to seven years; and the statutory end of the old pathway in 2038 removes both its completions and its trainees regardless of policy. Measures that expand phase-3 places and Master places must therefore be in place well before 2038 if the workforce is to keep growing after the transition (Section 4.8).
4.2. Main Results of the Monte-Carlo Simulation
Table 5 summarizes the main results of the FTE-calibrated Monte-Carlo simulation for the final year 2040.
4.3. Capacity and Need in the Final Year 2040
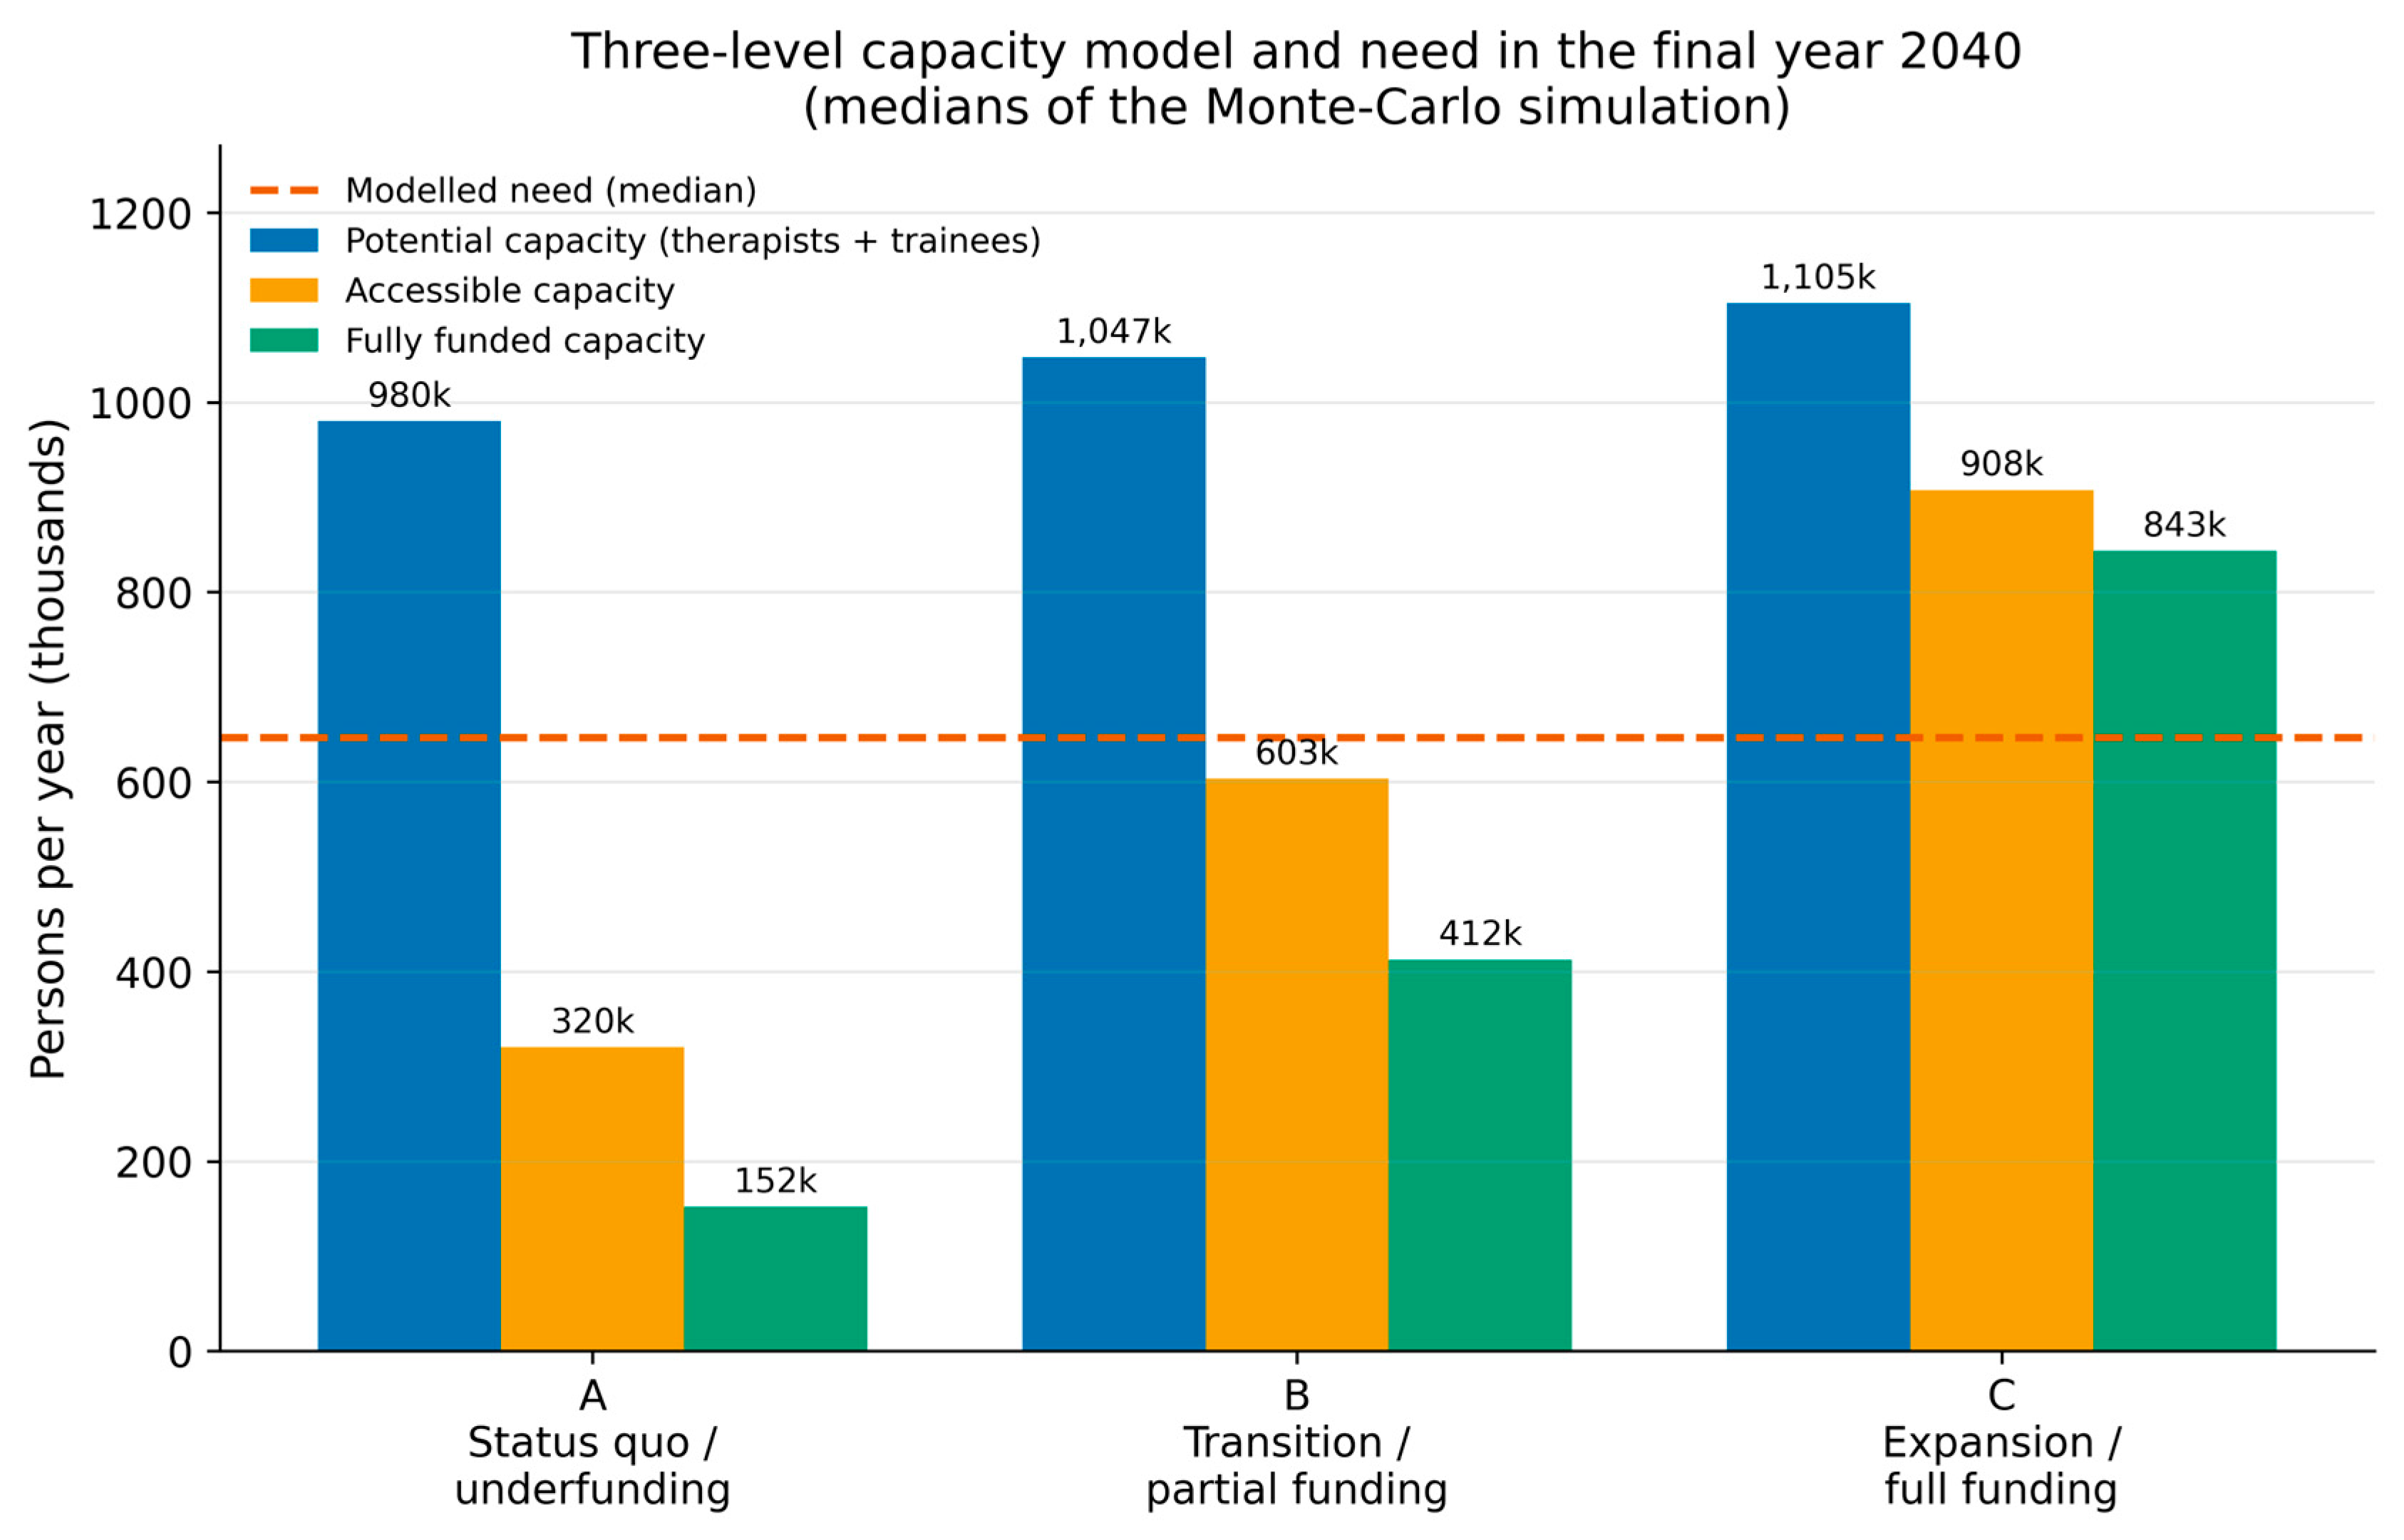
Figure 1 presents the central three-level capacity model in the final year 2040. The bars show, for each scenario, potential capacity, accessible/partially funded capacity, fully funded capacity, and modeled need.
The figure visualizes the central structural finding of this study: potential capacity exceeds need in every scenario in 2040 (Scenario A: 980,000 persons/year against a median need of about 647,000, i.e. 152%)—because the licensed profession grows until 2038 and because the treatment capacity of supervised trainees counts as potential—yet in Scenario A accessible capacity (320,000) covers only 50% of need and fully funded capacity (152,000) only 23%. In Scenario B, accessible capacity (603,000) reaches 93% of need, and fully funded capacity (412,000) reaches 64%. In Scenario C, accessible capacity (908,000) exceeds need (140%) and fully funded capacity (843,000) alone covers 130%.
This illustrates why a pure workforce policy remains insufficient: with the same profession and the same trainees, the three scenarios differ in 2040 by a factor of almost three in accessible care. The difference between potential and accessible capacity is the policy-relevant activation margin, and in 2040 between 6.5% and 9% of potential capacity (88,000/69,000/84,000 persons/year in A/B/C) is trainee capacity that depends on a single lever—the insurance funding of trainee services, which in the model raises both the activated share and the capacity per trainee.
Figure 1.
Three-level capacity model and need in the final year 2040 by scenario (medians of the Monte-Carlo simulation); potential capacity includes the treatment capacity of supervised trainees—source: authors’ FTE-calibrated Monte-Carlo simulation.
Figure 1.
Three-level capacity model and need in the final year 2040 by scenario (medians of the Monte-Carlo simulation); potential capacity includes the treatment capacity of supervised trainees—source: authors’ FTE-calibrated Monte-Carlo simulation.
4.4. Cumulative Societal Follow-On Costs
Figure 2 shows cumulative follow-on costs from 2026–2040 with 80% and 95% uncertainty intervals per scenario.
The follow-on cost curves diverge strongly with increasing projection horizon. In Scenario A, cumulative follow-on costs rise continuously to a median of €83 billion by 2040, with a 95% interval of €37 to €143 billion. In Scenario B, the median reaches €13 billion; in Scenario C, only €1.3 billion.
Notable is the saturation dynamic in Scenarios B and C: because accessible capacity covers the median need from 2028 (C) and 2032 (B), annual follow-on costs fall to zero from that point, and the cumulative cost curve flattens into a plateau; in Scenario B the curve resumes a slight rise from 2037, when the old-system trainees have completed, and the gap reopens. This shows the qualitatively different effect of full need coverage versus merely partial reduction: once the care gap is closed, no new waiting-time costs and chronification losses arise.
Even accounting for the uncertainty intervals, the scenario ranking remains robust: the upper 95% bound of Scenario C (€8 billion) lies clearly below the lower 95% bound of Scenario A (€37 billion), and Scenario C is cheaper than Scenario A in 100% and cheaper than Scenario B in 94% of simulation runs (Scenario B cheaper than A in 99%). Investment in activation and full funding proves substantially more cost-saving in the model than maintaining the status quo—under every plausible parameter constellation.
4.5. Reform-Cohort Dynamics: Completions and Retirements
Figure 3 visualizes the interplay of completions from the old system, completions from the new system, and retirements/exits (top row), and the stocks of supervised trainees in the old system, in phase-3 training places and in the waiting queue (bottom row) across the three scenarios.
The graph shows that the old pathway, fed by about 950 admissions per year until 2030, delivers about 640 completions in 2026 and about 714 per year from 2030 to 2038—slightly above the 624 observed in 2024/25—before it ends under the transitional law (§ 60 PThG 2024). Completions from the new system begin with a few direct entrants in 2029, reach about 470–620 in 2031 and plateau at about 580/year in A, 740/year in B and 840/year in C from 2033; the differences between scenarios stem from the completion rate and, in Scenario A, from the phase-3 places, which bind from 2031: about 1,050 candidates are waiting for a place in 2040 (mean waiting time 0.7 years), whereas in B and C the places suffice. The bottom row shows the trainee stocks: the old-system stock rises from about 3,400 (2026) to a peak of about 4,200 in 2032 and falls to zero by 2039, while the new-system phase-3 stock builds up from 2028 to about 1,800/2,400/2,700 trainees (A/B/C) by 2031–2032—a level limited in A by the places and in B and C by the Master intake.
The retirement line rises in all scenarios from about 420 (2026) to 830–940 per year (2040) as the stock grows; until 2038, completions exceed retirements everywhere, so that the licensed stock grows to 16,200–17,900 in 2038. From 2039 the picture reverses: without the old pathway, the new system’s 580–840 licensures per year fall short of retirements, and the stock declines by roughly 240–430 per year (C/A). The ‘retirement wave’ is therefore not the binding constraint of the transition decade; the binding constraint is the new system’s throughput after 2038.
4.6. Care Gap with Uncertainty Intervals
Figure 4 shows the development of the annual care gap—operationalized as need minus accessible capacity—over 2026–2040 with 95% uncertainty intervals per scenario.
The three scenario curves show marked qualitative differences. Scenario A starts at about 418,000 insufficiently treated persons per year in 2026, falls to about 287,000 by 2033 as trainee services are partly funded, and widens again to about 321,000 by 2040 once the old-system trainees have completed. Scenario B falls from about 249,000 (2026) to zero in 2032, stays closed until 2036, and reopens to about 37,000 in 2040. Scenario C closes the gap from 2028 (median 0) and keeps it closed; in 2040, 99% of runs show no gap (Scenario B: 41%).
The most important clinical-structural result is the speed at which trainee funding acts: both B and C close the median gap within six years, without a single additional licensure, because they activate capacity that already exists. The second result is the fragility of that closure in B: when the old-system trainees disappear in 2038, the gap reopens unless the new system’s phase-3 stock is larger. The wide uncertainty bands reflect the dependence of this result on need level, activation rate, and the assumed trainee capacity—but they are, tellingly, asymmetric in favor of need coverage: bounded below at zero.
4.7. Sensitivity Analysis
Figure 5 quantifies the influence of the 17 uncertain model parameters on two endpoints—cumulative follow-on costs in 2040 and accessible capacity in 2040. Shown are Spearman rank correlations computed within each scenario across its 30,000 Monte-Carlo iterations: positive values indicate increasing effects of higher parameter values, negative values indicate decreasing effects (Table 6). We compute correlations within scenarios because the scenario-specific parameter distributions barely overlap; a correlation pooled across scenarios would measure scenario membership rather than parameter influence and is therefore not reported. We report two endpoints because the training-pipeline parameters affect the workforce and capacity with a lag and are therefore invisible in the cost endpoint, which is dominated by the years before 2032.
The sensitivity analysis yields five central insights. First, the choice of policy package dominates: the scenarios differ in activation, full funding, the insurance funding of trainee services and phase-3 places, and their cumulative costs differ by more than an order of magnitude; this between-scenario finding is carried by the scenario comparison (Section 4.1): in 100% of simulation runs, Scenario C is cheaper than Scenario A, in 94% also cheaper than Scenario B, and Scenario B is cheaper than A in 99%. Second, within every scenario, the assumed population need is the largest single source of cost uncertainty (ρ = +0.70/+0.74/+0.79), and its weight increases with the activation level: closing the gap does not buffer the system against need; it makes need the binding uncertainty—which is why the robustness analysis across need levels (Section 4.9) is integral to the model rather than an appendix to it. Third, for costs the activation rate is the strongest steerable parameter (ρ = −0.26/−0.47/−0.40), followed by the FTE anchor (ρ up to −0.37), the retirement rate (ρ up to +0.15) and the insurance funding of trainee services (ρ = −0.11/−0.14/−0.01); the clinical risk factors—waiting-time factor (+0.21) and chronification (+0.12)—matter only in the underfunded Scenario A. Fourth, for accessible capacity in 2040 the ranking changes: after the activation rate (ρ = +0.66/+0.66/+0.48), the retirement rate (−0.47/−0.45/−0.52) and the FTE anchor (+0.39 to +0.46), the pipeline parameters become visible—Master places (+0.18/+0.23/+0.31), the completion rate (+0.17 to +0.20), the insurance funding of trainee services (+0.14 in A), the lead time to full trainee activity (−0.06 to −0.15) and the phase-3 duration (+0.04 to +0.13); for the licensed stock in 2040 the retirement rate dominates (ρ ≈ −0.8), followed by Master places and the completion rate (+0.24 to +0.36 in B and C) and, in Scenario A alone, by the phase-3 places (+0.33), which bind there. Fifth, the full-funding share does not influence costs or the care gap by construction: it defines the equity level of care (level 3) and must be read as a distributional, not an efficiency, parameter; likewise, the two trainee-capacity parameters—the unfunded level f₀ (0.5–0.7 of a fully active therapist) and the fully funded level f₁ (0.8–1.0)—have only small within-scenario correlations with costs and accessible capacity (|ρ| ≤ 0.03) although they set the level of the trainee effect, because their uncertainty ranges are narrow relative to the need range—their influence lies in the level of the results, not in their dispersion, which is why the trainee-capacity assumption is examined separately with fixed factors in Section 4.9.5.
4.8. How Many Master Places Does the New System Need?
The new system’s Master intake is currently limited to about 1,000 places per year (Section 3.9). To determine the intake at which the new system sustains the workforce after the old pathway ends, the Master intake was varied from 1,000 to 2,500 places per year in all three scenarios, with all other draws unchanged (Table 7). Because phase-3 places are the second bottleneck, we ran each intake level twice: with the phase-3 places in the respective scenario (Table A3) and with phase-3 places scaled in proportion to the intake.
Three results follow. First, with proportionally growing phase-3 places, Scenario B closes the care gap durably from about 1,500 Master places per year, and Scenario C from the current intake; Scenario A—with today’s activation and trainee funding—does not close it at any intake examined (168,000 persons/year at 2,500 places). Second, Master places alone are not enough: with the phase-3 places of Scenario A held constant, an intake of 2,500 produces a waiting queue of about 12,000 candidates in 2040 (mean waiting time 3.5 years), a licensed stock of only 15,800 and a gap of 231,000; the same intake with proportional phase-3 places yields a stock of 21,500 and a gap of 168,000. Third, every additional 500 Master places raise the licensed stock in 2040 by about 2,000–3,000 persons (A/B/C), i.e., the throughput needed to replace the old pathway’s 714 completions per year and to keep the stock growing after 2038 lies at roughly 1,500 places per year—provided the phase-3 places grow with it.
4.9. Robustness Analysis: Need, Treatment Intensity and Trainee Capacity
The results in Section 4.1, Section 4.2, Section 4.3, Section 4.4, Section 4.5, Section 4.6, Section 4.7 and Section 4.8 rest on the assumption of a population need of 9% (mode 7.5%; range 5–9%) and a treatment intensity of 13 units per patient per year—the latter matching the value on which the capacity anchor of Dinhof et al. is based [2]. Both assumptions are open to challenge: published Austrian estimates span a clinical need of about 13.8% of the population and a realistic treatment need of about 9% [4]—the four need levels examined here (5%, 7.5%, 9%, 12%) are therefore an explicit modelling choice spanning a conservative lower bound and an upper bound that includes subclinical burden, not a range taken from a single source—and dose–response findings from routine care place optimal doses between 4 and 26 sessions depending on setting and outcome criterion [10], while 30 to 40 units per year are the volumes usually regarded as adequate for moderate to severe disorders.
To test the stability of the model results against these two central parameter assumptions, a systematic robustness matrix was computed: 4 need levels (5%; 7.5%; 9%; 12%) × 4 treatment intensities (13; 20; 30; 40 units) × 3 scenarios = 48 constellations, each both deterministic and with additional Monte-Carlo uncertainty (20,000 iterations) around the activation and funding parameters.
The capacity scaling follows a simple, transparent logic. Since theoretical total capacity (669,121 persons/year) is based on 13 units per patient per year, it scales inversely proportionally to treatment intensity: capacity(E) = 669,121 × (13/E). At E = 20 units, theoretical capacity falls to 435,000 persons/year; at E = 30, to 290,000; and at E = 40, to ~217,000. This deterministic reduction is mathematically necessary and cannot be compensated by activation.
4.9.1. Coverage Heatmaps by Scenario
Figure 6, Figure 7 and Figure 8 show the percentage coverage (accessible capacity/need) for each scenario across all 16 need-by-intensity constellations. Values ≥ 100% indicate full need coverage; values clearly below indicate a substantial care gap.
Scenario A shows no constellation in which need would even come close to being covered. Even at the most favorable corner (5% need, 13 units), accessible capacity reaches only 45% of need. At clinically realistic 30 units and 9% need, coverage falls to 11%.
Figure 7.
Coverage of need by accessible care in Scenario B (transition/partial funding). Source: authors’ simulation.
Figure 7.
Coverage of need by accessible care in Scenario B (transition/partial funding). Source: authors’ simulation.
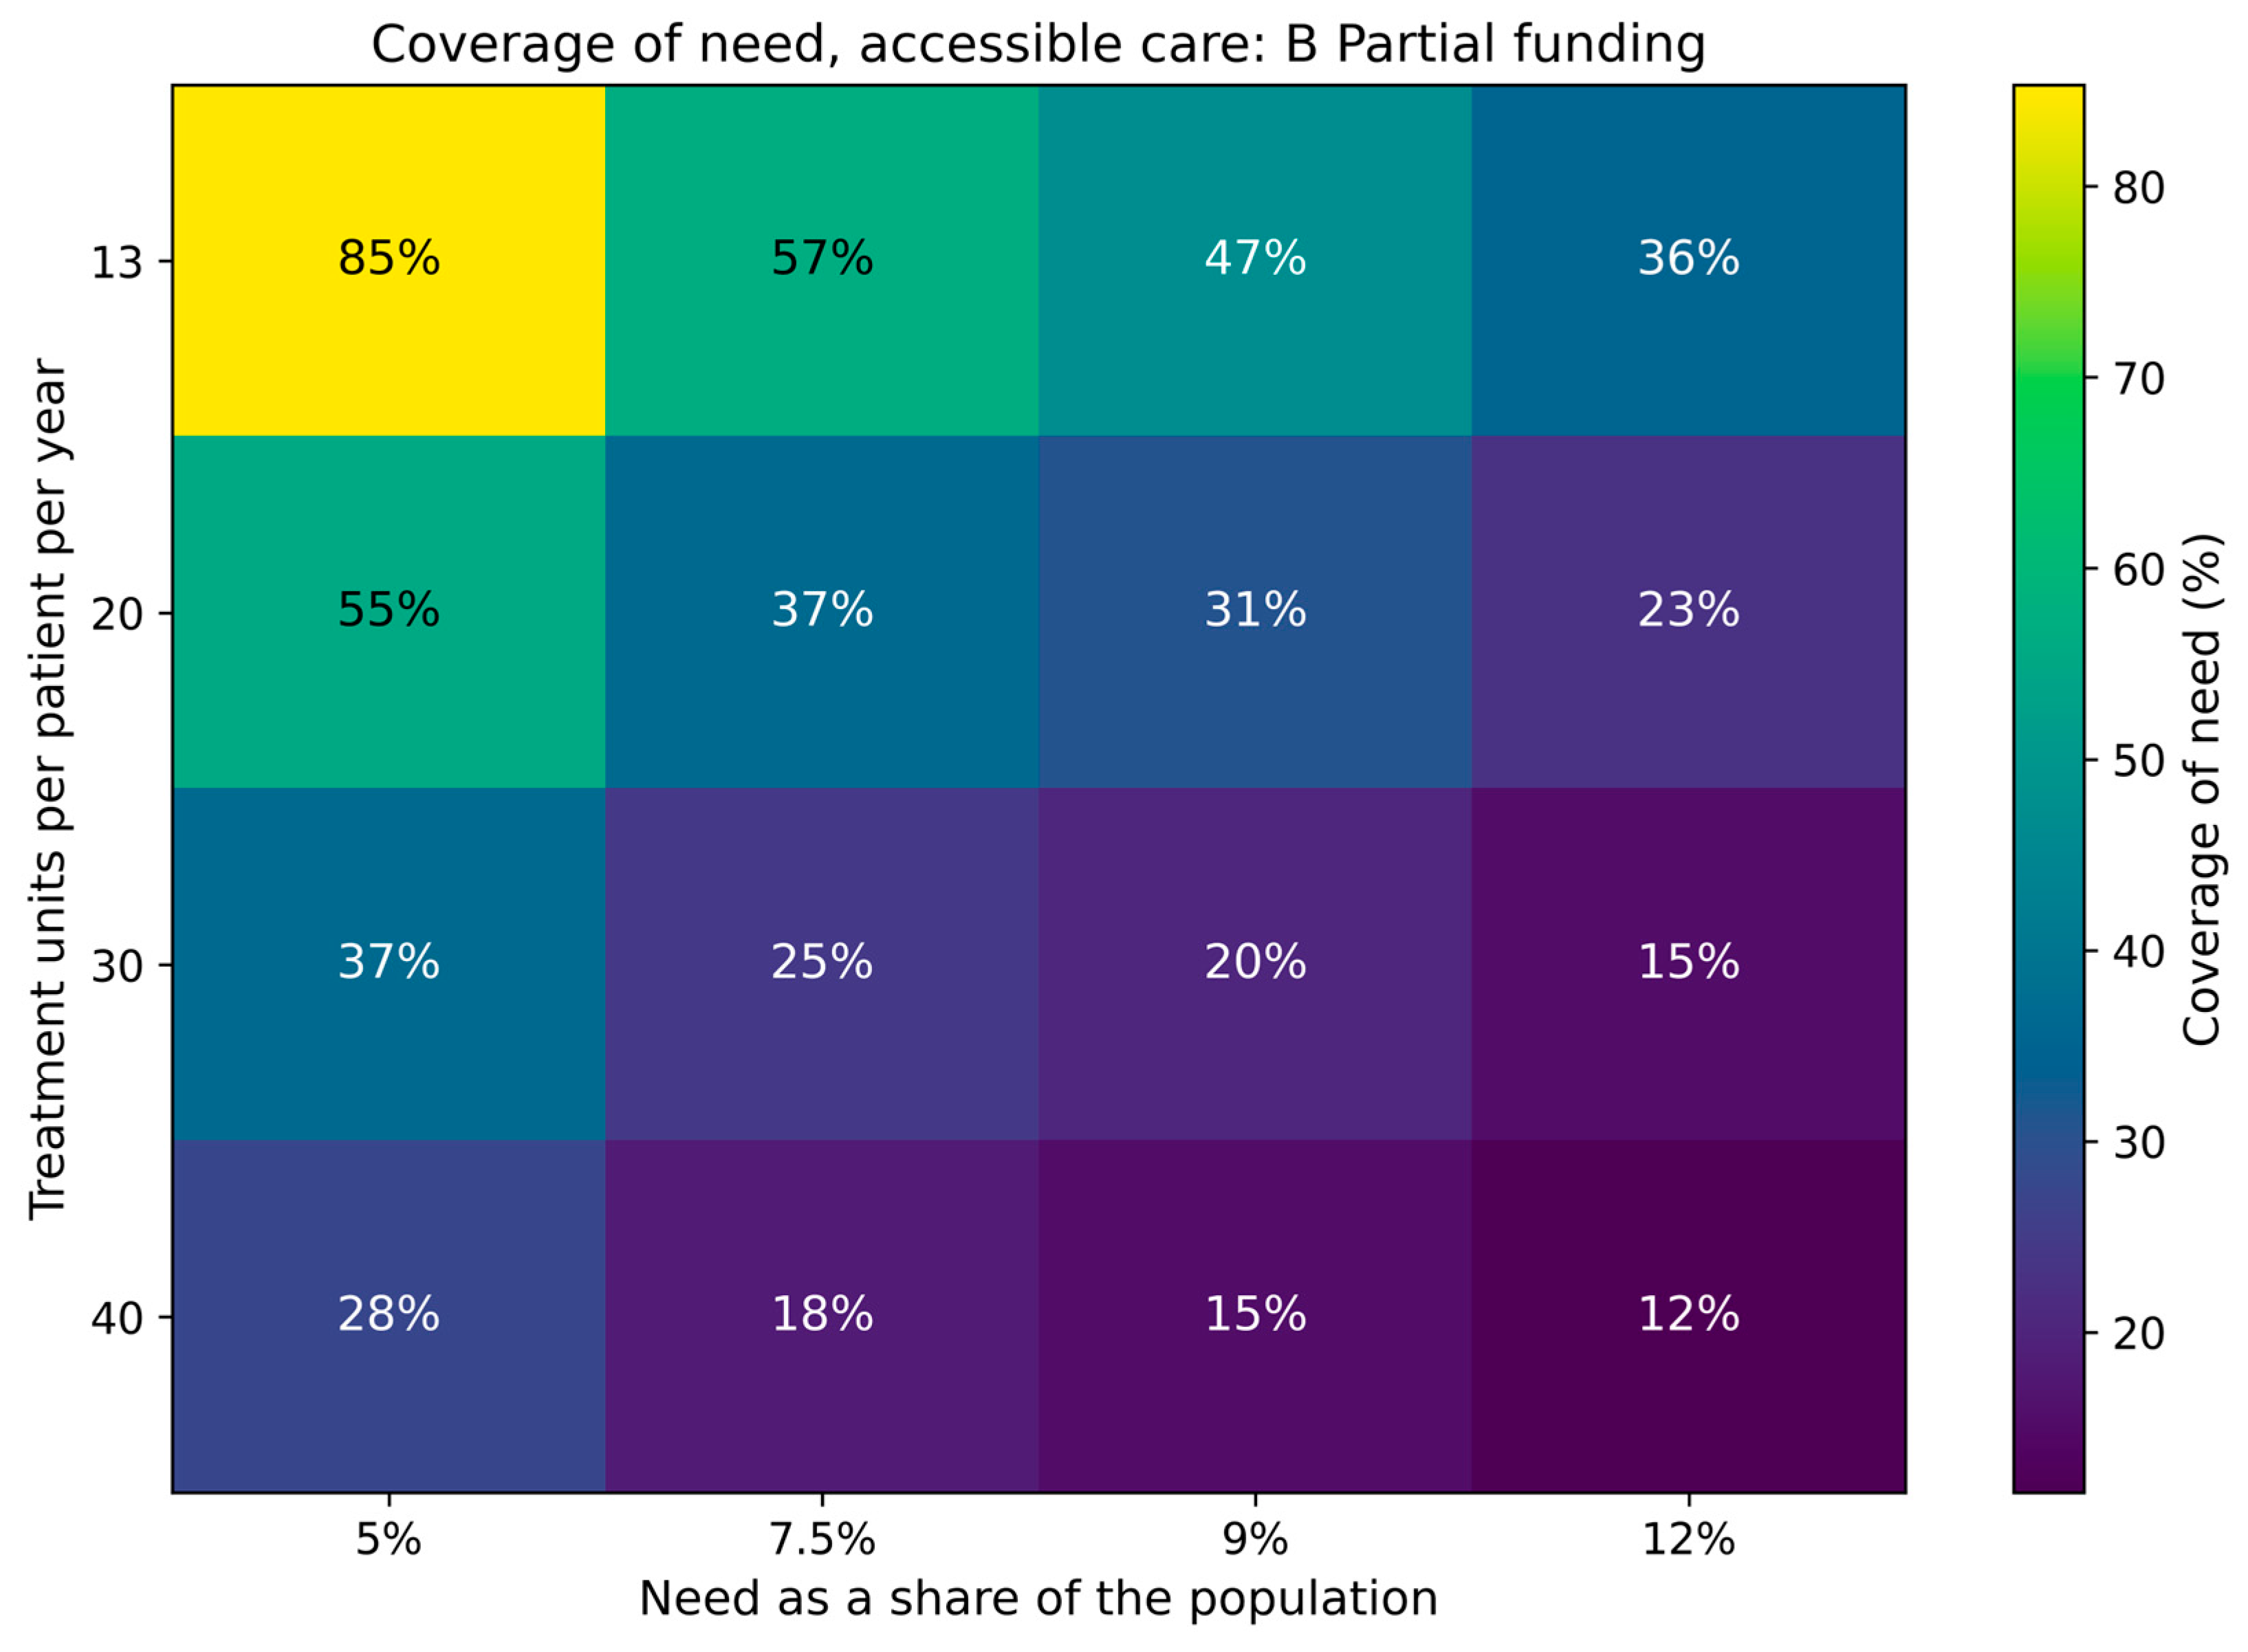
Scenario B improves the picture markedly but also reaches only 21% coverage in the professionally realistic range (30 units, 9% need). The heatmap shows that near-complete coverage (85%) is achievable only under a very conservative need assumption (5%) at current treatment intensity (13 units)—not under realistic parameters.
Figure 8.
Coverage of need by accessible care in Scenario C (expansion/full funding). Source: authors’ simulation.
Figure 8.
Coverage of need by accessible care in Scenario C (expansion/full funding). Source: authors’ simulation.
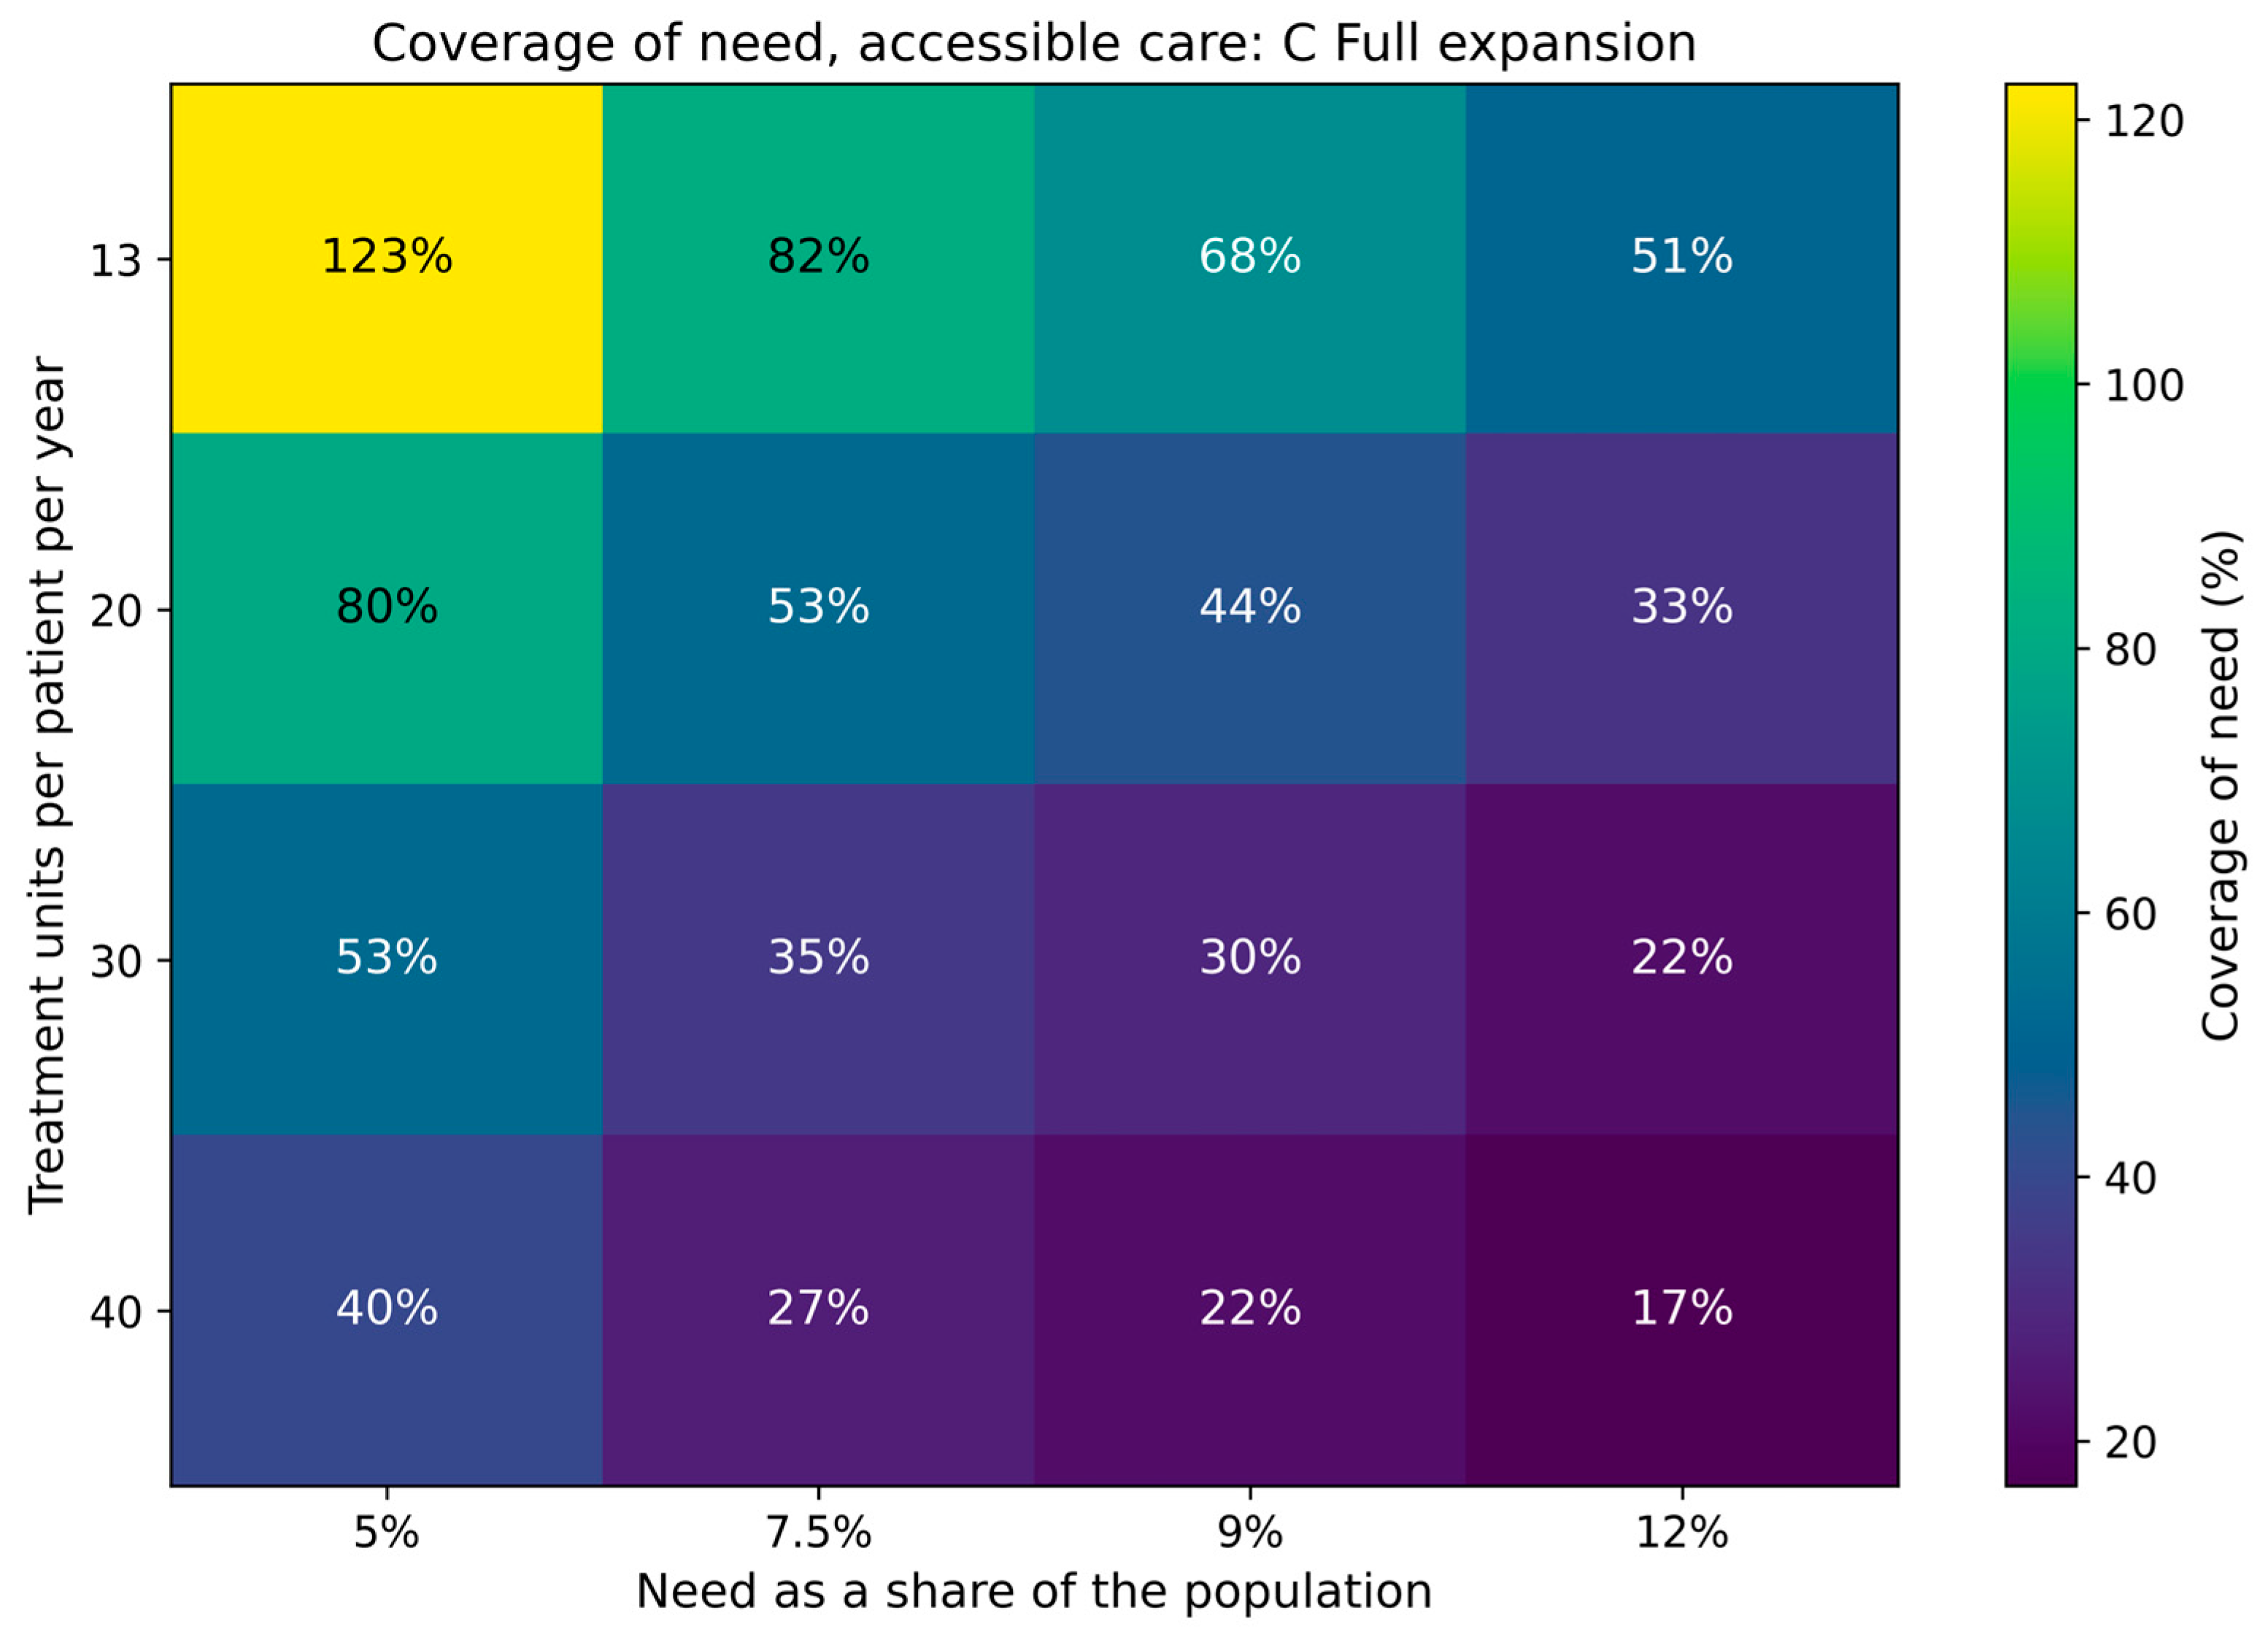
Scenario C is the only one in which coverage rises above 100% (123%) at the current intensity of 13 units and 5% need. However, at 30 units and 9% need, even Scenario C reaches only 30% coverage. At 40 units and 12% need—a pessimistic constellation—coverage remains at 17%.
4.9.2. Coverage at Realistic Need (9%) by Treatment Intensity
Figure 9 focuses on the policy-central need level of 9% and shows coverage as a function of treatment intensity.
The graph makes the central robustness finding tangible: all three scenario curves fall markedly as treatment intensity rises. While Scenario C still achieves 68% coverage at 13 units, this value falls to 30% at 30 units and 22% at 40 units. The scenario difference (C–A) persists in absolute terms but shrinks relatively—at high treatment intensity, activation alone becomes an insufficient lever.
Figure 10.
Absolute care gap (insufficiently treated persons per year) at 9% need by treatment intensity. Source: authors’ simulation.
Figure 10.
Absolute care gap (insufficiently treated persons per year) at 9% need by treatment intensity. Source: authors’ simulation.
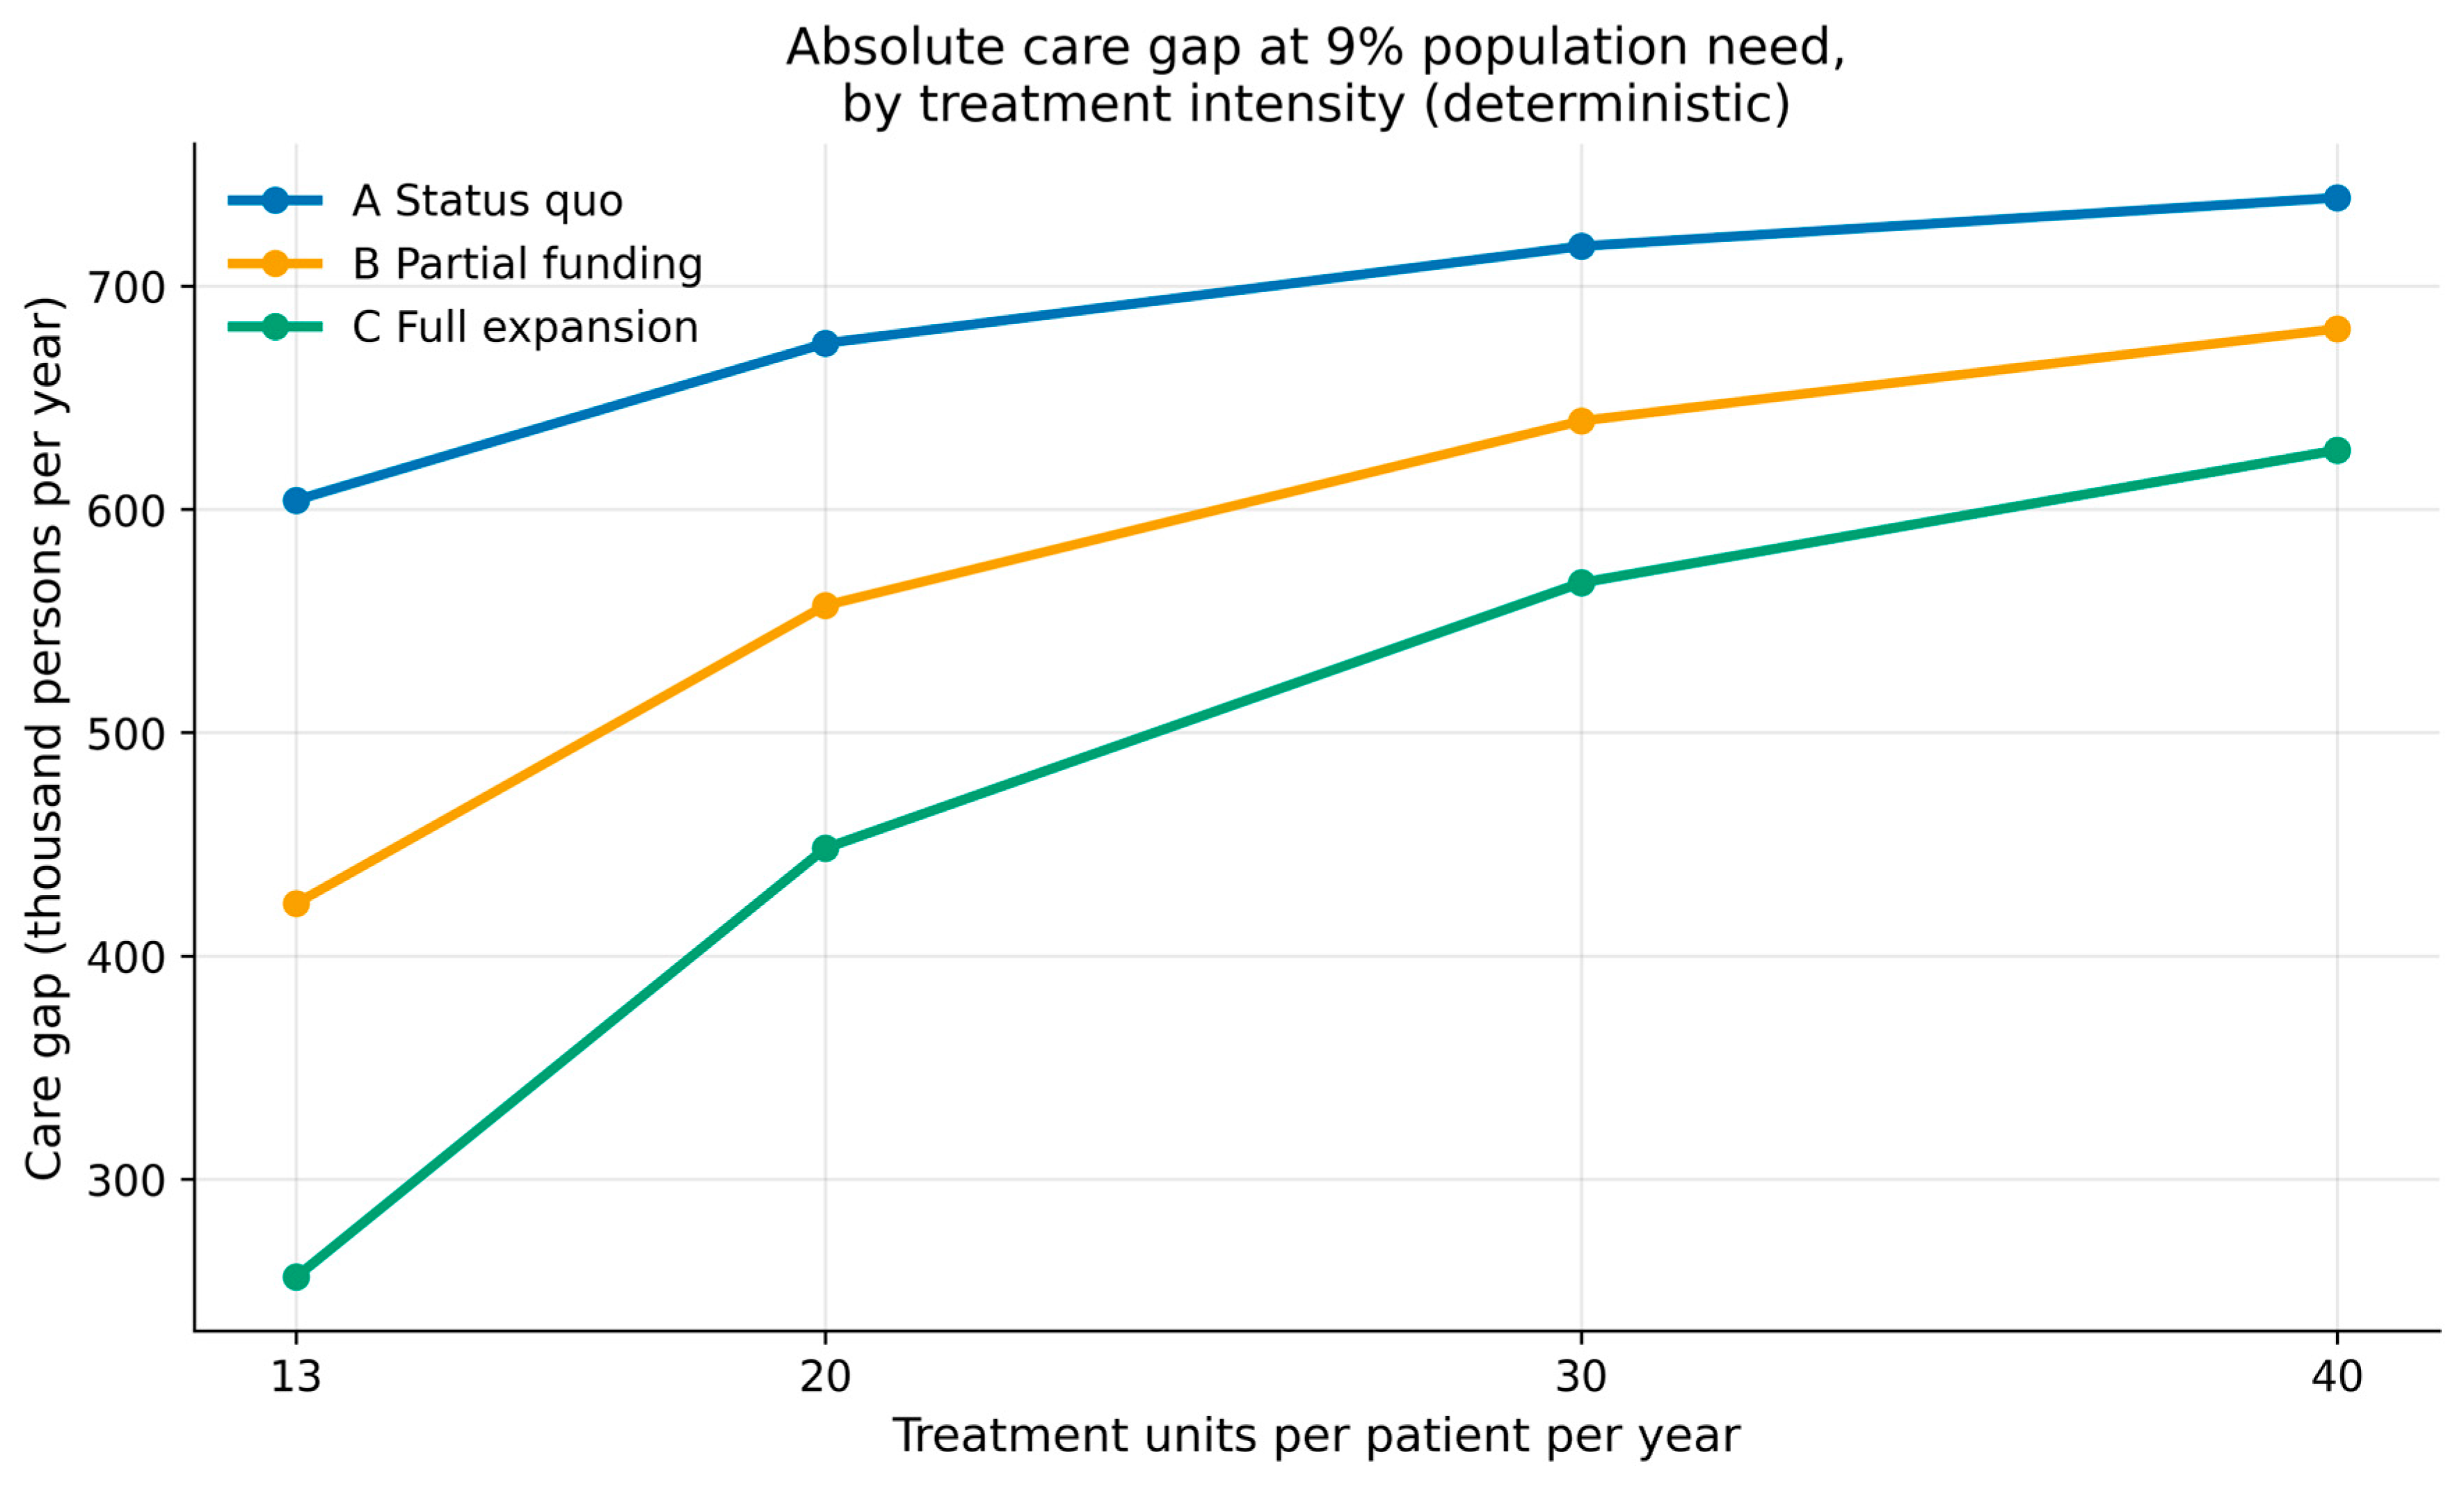
The absolute gap (Figure 10) grows monotonically with treatment intensity: in Scenario C it rises from 257,000 persons (13 units) to 565,000 (30 units) and ~625,000 (40 units). In absolute numbers, this gap is comparable to that of Scenario A at low intensity—highlighting treatment intensity as an underestimated model parameter.
4.9.3. Monte-Carlo Uncertainty of the Robustness Analysis
The deterministic robustness matrix was complemented by a Monte-Carlo component in which the scenario-specific activation and full-funding shares vary as triangular distributions (20,000 iterations per cell). Figure 11 presents the resulting medians and 95% confidence bands for coverage at 9% need.
The confidence bands clarify three findings: (1) the scenario ranking is robust under all treatment intensities—the 95% bands do not overlap; (2) with rising treatment intensity the absolute bands narrow, reflecting the approach to a structural care shortage that parameter fluctuations can barely alter; (3) even the upper 95% band of Scenario C at 30 units does not reach the 100% line.
4.9.4. Direct Comparison: 13 vs. 30 Units per Year
Figure 12 presents coverage at two contrasting treatment intensities (13 units = current value; 30 units = professionally adequate value) across all need levels.
Figure 11.
Monte-Carlo robustness of coverage at 9% need by treatment intensity, with 95% confidence bands. Source: authors’ simulation (n = 20,000 per cell).
Figure 11.
Monte-Carlo robustness of coverage at 9% need by treatment intensity, with 95% confidence bands. Source: authors’ simulation (n = 20,000 per cell).
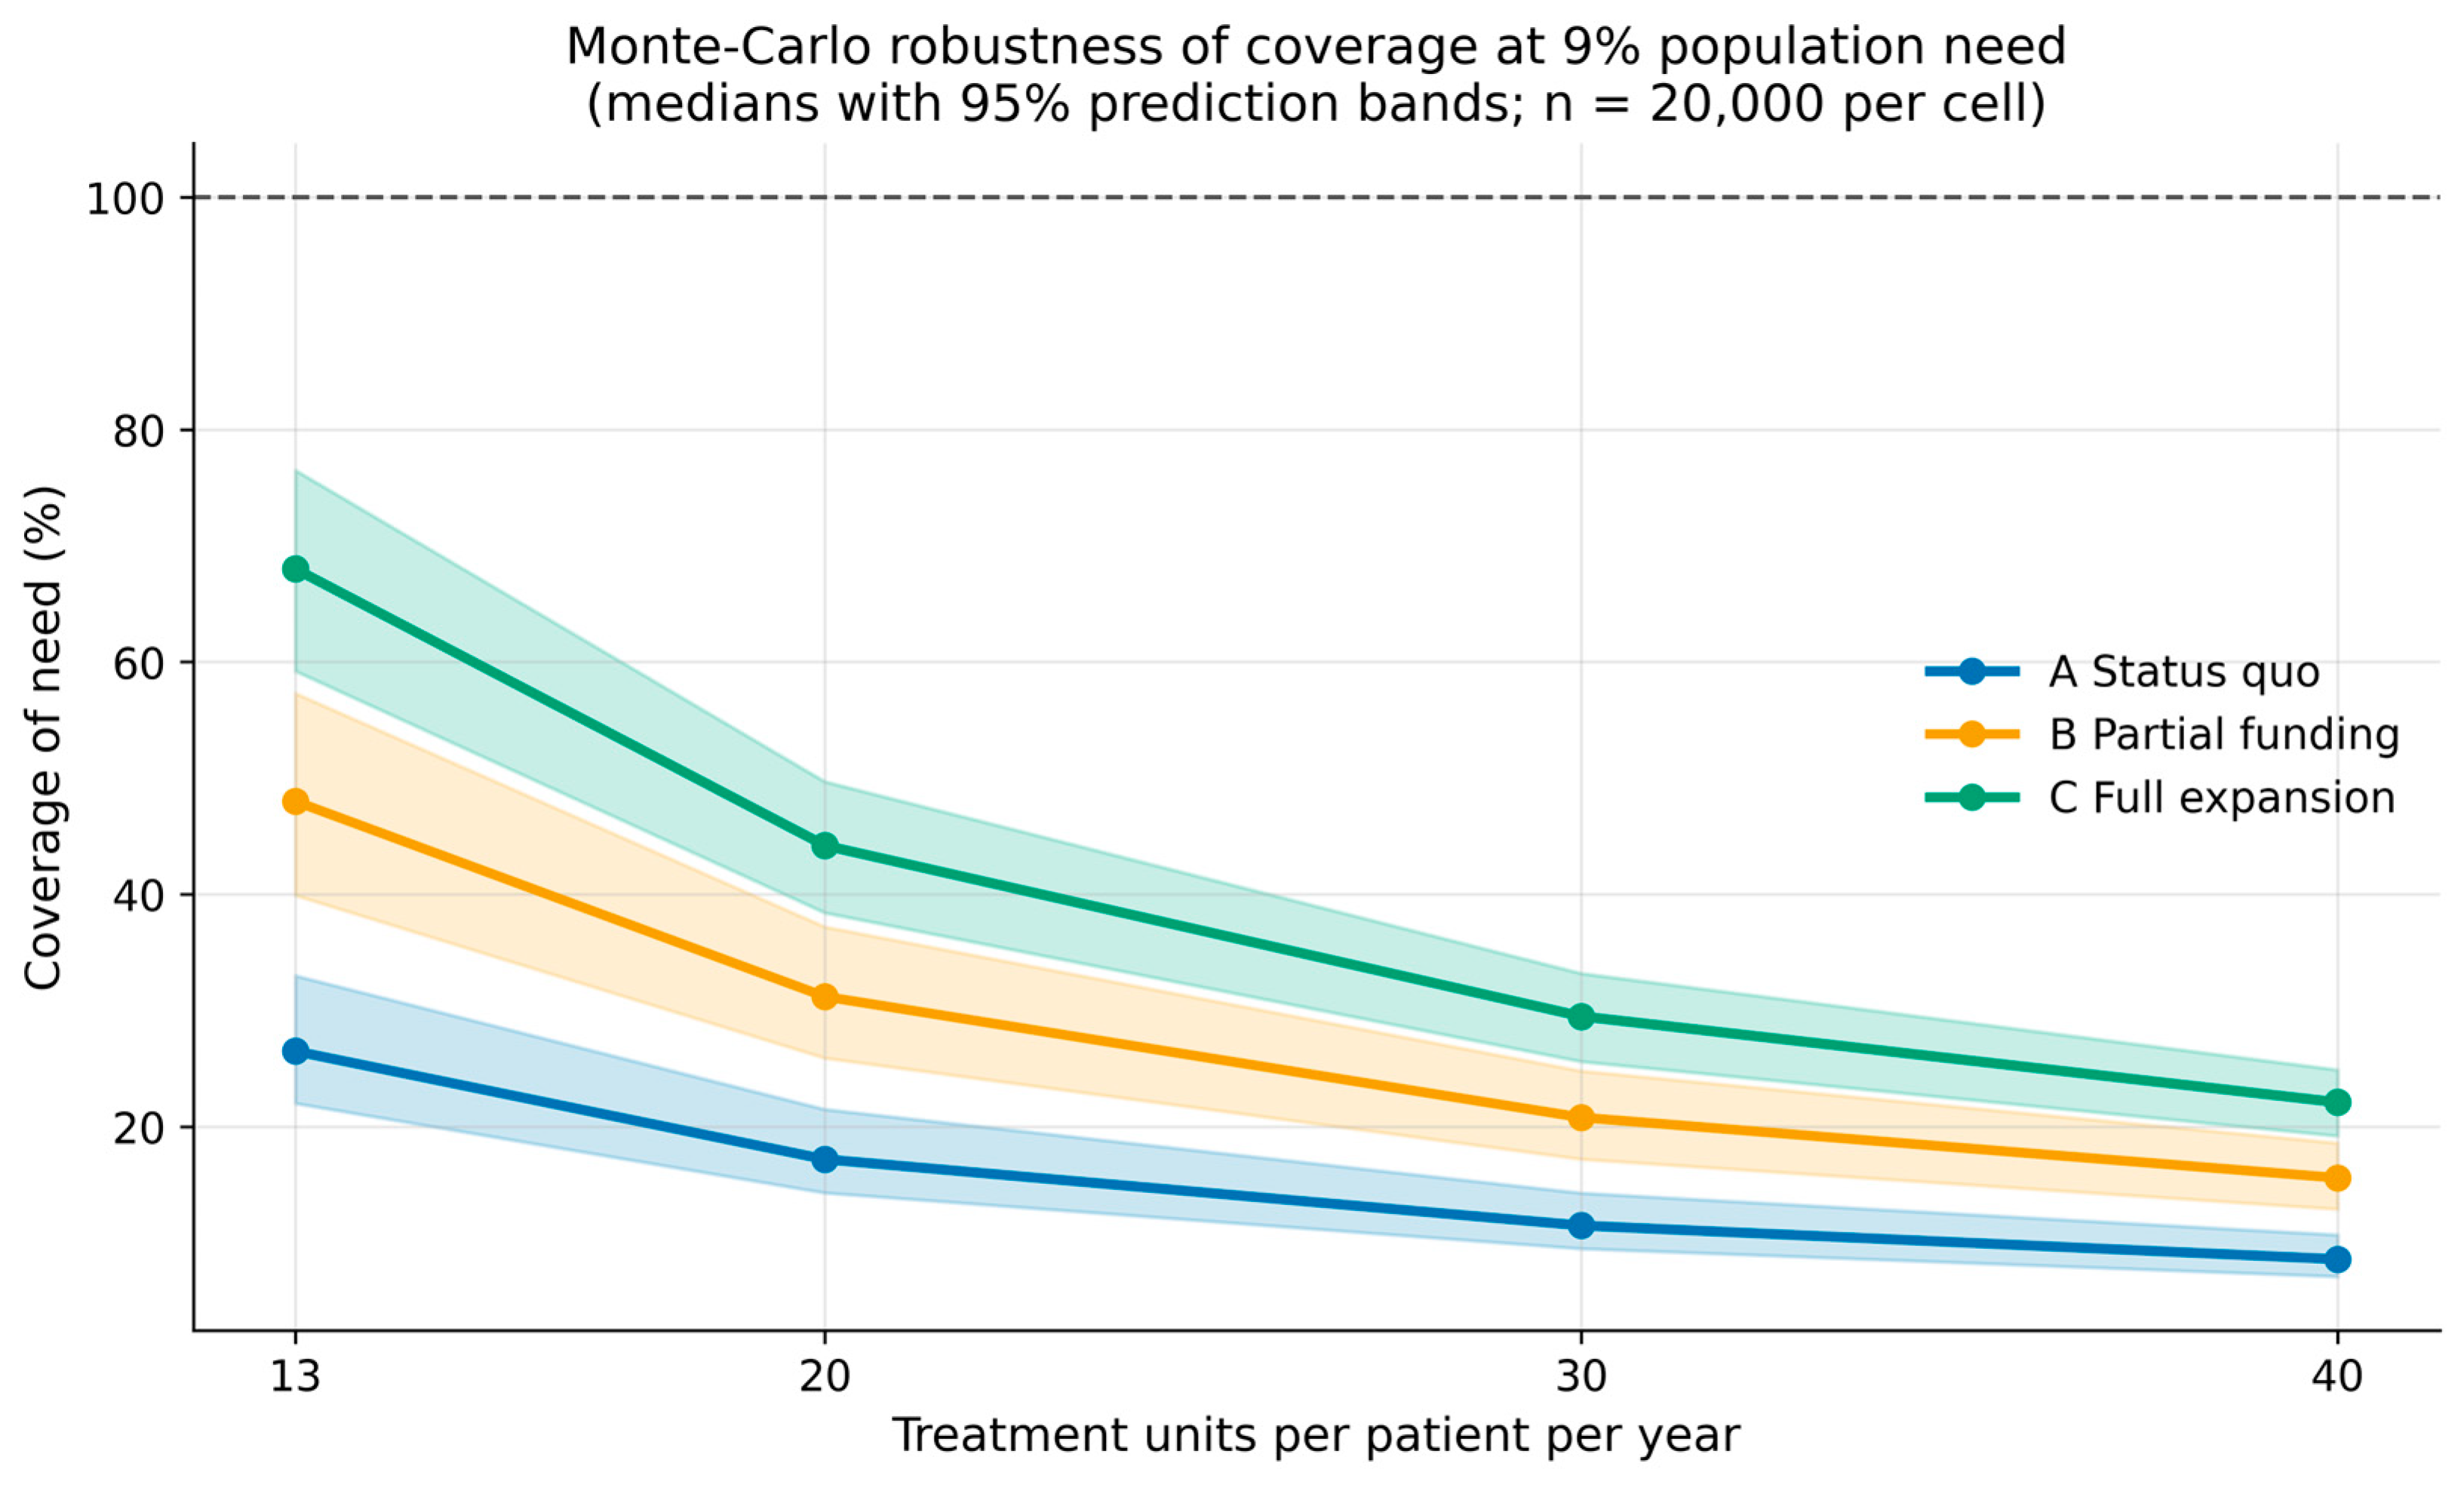
Figure 12.
Direct comparison of coverage at 13 vs. 30 units per patient per year across need levels of 5–12%. Source: authors’ simulation.
Figure 12.
Direct comparison of coverage at 13 vs. 30 units per patient per year across need levels of 5–12%. Source: authors’ simulation.
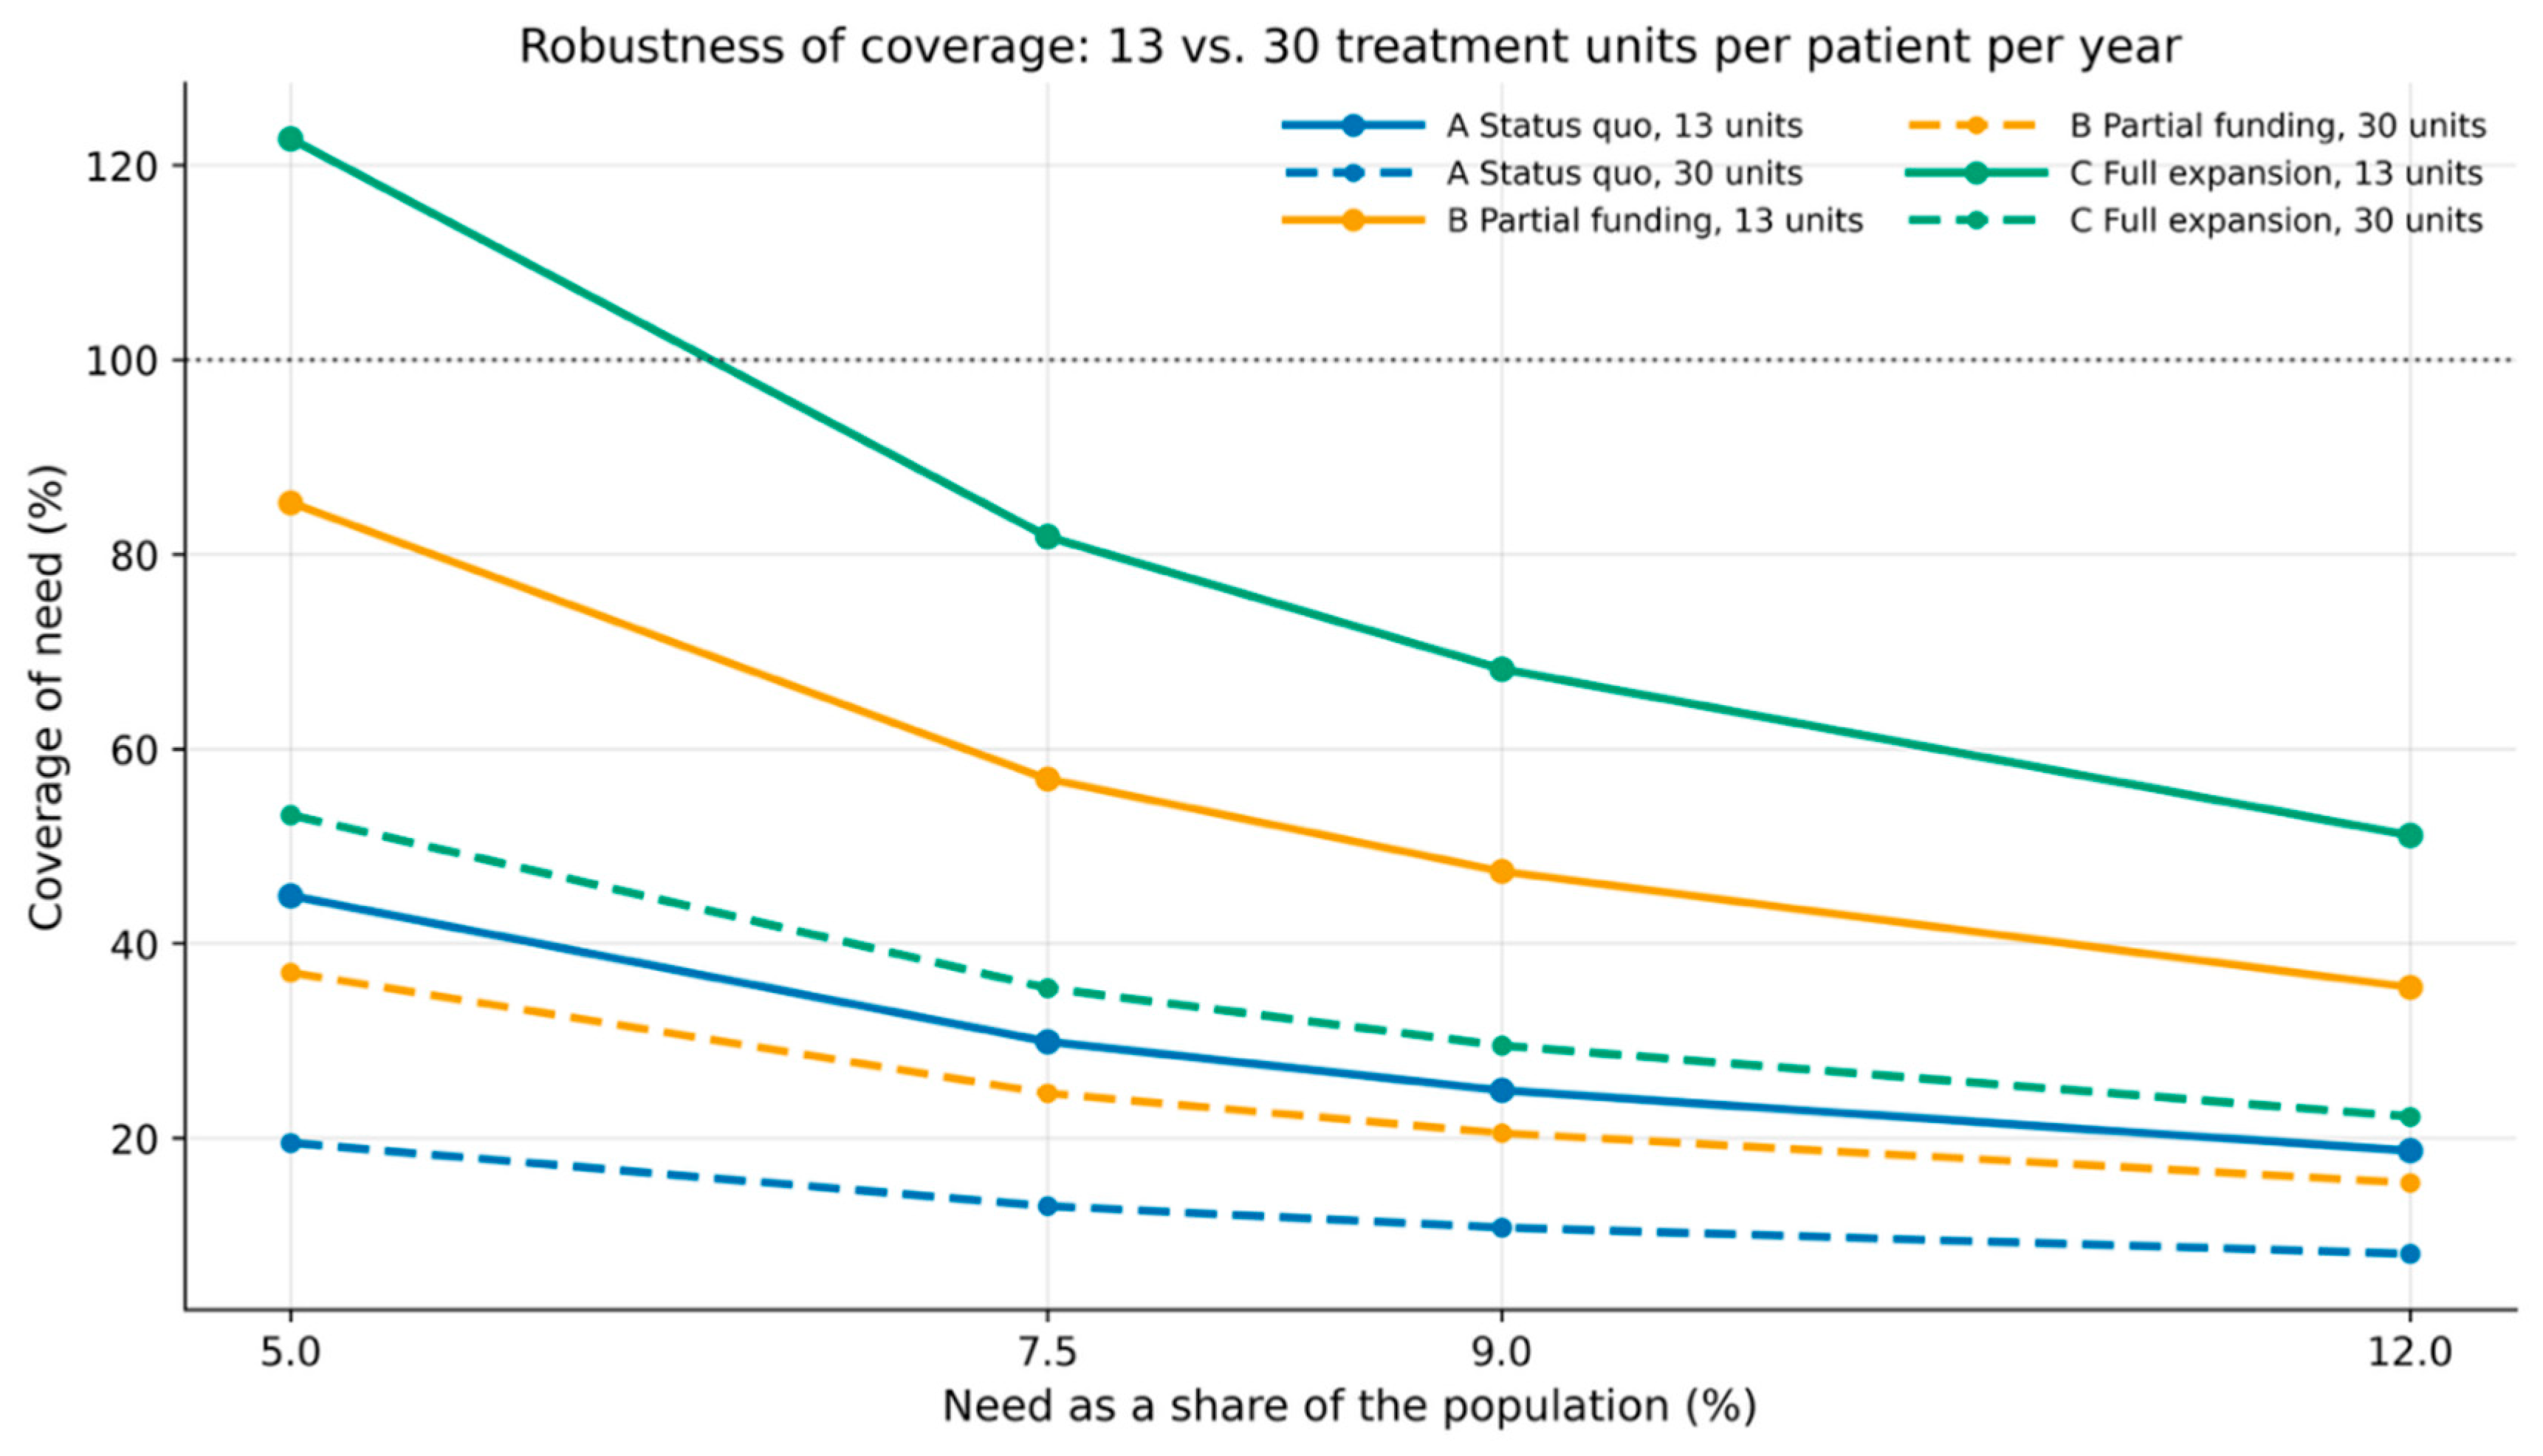
The graph shows the model’s most important methodological asymmetry: at 13 units, Scenario C can computationally cover even high need levels (123% at 5% need; 51% at 12% need). At 30 units, all three scenario curves remain permanently below the 60% line. The difference between the two treatment intensities is larger in every scenario than the difference between the scenarios themselves—a central finding for interpretation.
4.9.5. Robustness to the Trainee-Capacity Assumption
The capacity per supervised trainee is the least documented quantity of the model (Section 3.8.2). To test how far the results depend on it, the main model—in which the capacity factor rises with the insurance funding of trainee services from f₀ ≈ 0.60 to at most f₁ ≈ 0.90—was compared with four variants in which the factor is fixed at 0.3, 0.5, 0.7 or 0.9 of a fully active therapist, for both training systems and irrespective of funding, and with a counterfactual lower bound in which trainee services are never insurance-funded in any scenario (funding share zero; capacity per trainee stays at f₀), with all other draws unchanged (Table 8). The fixed factors bracket the survey-based unfunded level (0.50–0.70) from below (0.3) and reach the mode of the fully funded level (0.9), which lies above the effective factor of every scenario in the main model (at most 0.86); 0.3 represents a trainee treating about one day per week.
Four results follow. First, the scenario ranking and the qualitative conclusions do not depend on the trainee capacity: Scenario C closes the median care gap in every variant (from 2030 at a factor of 0.3, from 2028 at 0.7 and above), and Scenario A closes it in none (minimum gap 262,000 persons/year even at 0.9). Second, the timing of the closure in Scenario B is sensitive to the assumption: at a fixed factor of 0.3 or 0.5 the median gap in Scenario B does not close at all (minimum 46,000 and 29,000 persons/year), at 0.7 it closes in 2033, at 0.9 in 2031, and in the funding-dependent main model in 2032; the closure in the partial-funding scenario therefore hinges on the capacity per trainee rising above today’s part-time level once trainee services are funded—which is precisely the mechanism the survey data suggest (82% of trainees plan to expand their hours). Third, the effect on cumulative costs is moderate relative to the scenario differences: across the fixed factors 0.3–0.9, costs in Scenario A range from €80 to €90 billion, in Scenario B from €11 to €23 billion and in Scenario C from €1.1 to €1.9 billion (main model: €83/13/1.3 billion). In 2040, the fixed-factor variants differ little, because the old-system trainees have completed and only the phase-3 stock of the new system remains. Fourth, the counterfactual without any insurance funding of trainee services marks the lower bound of the lever: cumulative costs rise to €96/31/3.9 billion (A/B/C), the gap in Scenario B never closes (minimum 63,000 persons/year in 2038; 82,000 in 2040), and Scenario C closes it only from 2032 instead of 2028; in Scenario A the gap stays above 333,000 persons/year throughout. The window of need coverage in the partial-funding scenario therefore exists only because trainee services become insurance-funded.
Table 8.
Robustness of the main results to the capacity per supervised trainee: no insurance funding of trainee services, fixed funding-independent factors, and the funding-dependent main model (medians; A / B / C).
Table 8.
Robustness of the main results to the capacity per supervised trainee: no insurance funding of trainee services, fixed funding-independent factors, and the funding-dependent main model (medians; A / B / C).
| Capacity per trainee (share of a fully active therapist) and funding variant | Cumulative follow-on costs 2040 (€ billion) | Care gap 2040 (persons/year) | Gap closure: A minimum median gap (year); B and C first year with a closed median gap |
|---|---|---|---|
| No insurance funding of trainee services (factor 0.60, never activated) | 95.8 / 31.0 / 3.9 | 349,176 / 82,490 / 0 | 332,766 (2038); not closed; 2032 |
| Fixed 0.3 | 90.5 / 23.3 / 1.9 | 336,826 / 65,117 / 0 | 321,747 (2038); not closed; 2030 |
| Fixed 0.5 | 86.9 / 18.1 / 1.5 | 328,875 / 53,727 / 0 | 310,265 (2035); not closed; 2029 |
| Fixed 0.7 | 83.3 / 13.8 / 1.3 | 320,699 / 42,231 / 0 | 286,845 (2033); 2033; 2028 |
| Fixed 0.9 | 79.6 / 11.4 / 1.1 | 312,868 / 30,896 / 0 | 262,028 (2033); 2031; 2028 |
| Funding-dependent 0.60 → 0.90 (main model) | 83.4 / 13.1 / 1.3 | 320,736 / 36,951 / 0 | 286,736 (2033); 2032; 2028 |
Note: ‘Never activated’ = the insurance-funding share of trainee services is set to zero in all three scenarios (trainees continue to treat privately at the unfunded capacity f₀ and count as potential, but not as accessible, capacity). Fixed factors apply to trainees in both training systems each year and do not respond to insurance funding of trainee services; the main model uses f₀ ~ Δ(0.50; 0.60; 0.70) rising to f₁ ~ Δ(0.80; 0.90; 1.00) with phased-in funding (Section 3.8.2). All other draws are identical to the main run. ‘Not closed’ = the median care gap remains above zero in every year 2026–2040. Peak potential trainee capacity (persons/year, A/B/C): No insurance funding of trainee services (factor 0.60, never activated) 231,239/235,782/242,380; Fixed 0.3 115,955/118,031/121,412; Fixed 0.5 193,259/196,719/202,354; Fixed 0.7 270,562/275,407/283,296; Fixed 0.9 347,866/354,094/364,237; Funding-dependent 0.60 → 0.90 (main model) 268,415/310,708/349,358. Data source: MC_FTE_Kalibriert_Traineekapazitaet (n = 30,000 per cell).
4.9.6. Key Conclusions of the Robustness Analysis
The robustness analysis sharpens the model’s main message in an important respect. At the current treatment intensity of 13 units per patient per year, activation is the dominant lever for closing the care gap. At clinically adequate treatment intensity (30–40 units), the finding changes substantially: at 13 units/year, Scenario C can computationally cover about 68% of a 9% need; at 20 units/year, the maximum achievable coverage falls to about 44%; at 30 units/year, even Scenario C reaches only about 30%, making additional capacity expansion indispensable; at 40 units/year, structural undersupply prevails, and even Scenario C covers only about 22%. The trainee-capacity assumption, by contrast, changes the timing of the gap closure in Scenario B but not the scenario ranking (Section 4.9.5).
The policy consequence: activation and funding policy remains the most important short-term lever—particularly because it can take effect immediately, without training latency. In the medium to long term, however, it must be complemented by substantial capacity expansion (more Master places, more phase-3 places, more outpatient clinics) as treatment intensity moves from 13 units towards the professionally recommended 30+ units.
5. Discussion
5.1. The Central Conceptual Shift: Activation as a Necessary but Not Sufficient Lever
The most fundamental result of this study is conceptual in nature and is further differentiated by the robustness analysis: the FTE calibration with the empirical anchors of Dinhof et al. [2] and Gruber et al. [3] suggests that Austrian psychotherapeutic care—at the current treatment intensity of 13 units per patient per year—suffers primarily from insufficient activation of existing capacity, less from a shortage of psychotherapists in the narrow sense. This diagnosis changes, however, at a professionally adequate treatment intensity: at 30–40 units/year, activation becomes necessary but not sufficient; additional capacity expansion is then structurally required.
The computed total capacity of 669,000 persons/year (at 13 units per patient per year) contrasts with partially or fully funded care of only 199,250 persons (2022). Even accounting for currently realized treatment intensity (often professionally too low) and a moderate reduction through part-time work, private practice, and self-pay priorities, the model suggests a substantial activation gap. The simulation indicates that even with a stagnating profession, doubling the activation rate—from about 30% to about 60%—could markedly reduce the care gap, provided treatment intensity remains constant.
One policy implication of the model results—under the stated assumptions—is that a strategy relying exclusively on expanding training places, without addressing the funding and structural side in parallel, could end in an activation trap: growing therapist numbers without correspondingly growing socially accessible care. Conversely, the robustness analysis shows that a pure activation strategy without capacity expansion would likewise be insufficient at professionally adequate treatment intensity. Both levers are complementary and necessary.
5.2. The Dual Role of Supervised Trainees (i.A.u.S./i.F.u.L.)
Persons in training under supervision (2,799 in 2023 [9]; 3,238 in 2025 [14]) occupy a system-critical dual function: they are simultaneously current care capacity and future workforce. In Austria, their services are currently paid privately; from 1 October 2026 they will be listed in the professional register, and their services can be used as an insurance benefit [14]. A lack of funding for their services therefore acts as a damage multiplier on three levels: it withholds current care (unfunded trainees cannot deliver insurance-funded services in outpatient clinics), slows training (through self-funding pressure), and erodes the institutional base (outpatient clinics without trainee funding are not economically viable).
The model quantifies this lever for the first time. At the survey-anchored treatment capacity of 60% of a fully active therapist in the current unfunded state (Table S7), the roughly 3,400 trainees of 2026 represent about 147,000 persons/year of potential capacity, 18% of the national total, rising to about 270,000–350,000 persons/year (25–30%) in 2032 when the old-system stock peaks, the phase-3 stock of the new system has built up and the capacity per trainee has risen with the phased-in funding. Funding their services activates this capacity within one to four years, without a single additional licensure: in Scenario B the activated trainee capacity reaches about 197,000 persons/year in 2032 and closes the care gap; in Scenario A even the 30% funding share activates up to 84,000 persons/year. The survey data add a second mechanism to this lever: trainees today work part-time in psychotherapy (median 7.5 free-practice hours per week; 40% with psychotherapy as their sole occupation; 82% planning to expand), so insurance funding not only activates existing services but raises the services per trainee—in the model from 0.60 to up to 0.90 of a fully active therapist—and the robustness analysis shows that the closure of the gap in Scenario B depends on this rise (Section 4.9.5). If trainee services were never insurance-funded, cumulative costs would rise by about €12/18/2.6 billion (A/B/C) by 2040, the gap in Scenario B would not close in any year, and Scenario C would close it four years later (Table 8). Within scenarios, the insurance funding of trainee services ranks among the six strongest cost parameters (ρ = −0.11/−0.14 in A and B) and, for accessible capacity in 2040, lies in the same range as Master places and the completion rate (ρ = +0.14 in Scenario A; Section 4.7). Sectoral statutory-insurance contracting with outpatient clinics that includes and remunerates trainee services is accordingly the most immediately available lever in the model, because it acts on both sides of the dual role at once. Its effect is, however, time-limited by the transitional law: the old-system trainees complete by 2038, and the lever then depends entirely on the size of the new system’s phase-3 stock.
5.3. The Reform Dip and the Transition Cliff of 2038
Two transition effects need to be separated. The classical ‘reform dip’—a temporary shortfall of licensures between the end of the old pathway and the ramp-up of the new—is, in the model, short and shallow: Master entrants are licensed from 2031, the old pathway continues to deliver about 714 completions per year until 2038, and the licensed stock grows in all scenarios until then. The consequential effect is the transition cliff of 2038 created by § 60 PThG 2024: within two years the old pathway’s completions (714 per year) and its supervised trainees (about 4,000 at the 2032 peak) disappear, while the new system delivers 580–840 licensures per year and holds 1,800–2,700 phase-3 trainees. From 2039, the licensed stock shrinks by roughly 240–430 per year, trainee capacity falls to about a fifth to a third of its peak, and in Scenario B the closed care gap reopens. The FTE calibration nevertheless shows that the care effect of this cliff is far smaller than its workforce effect wherever activation is high: in Scenario C the gap stays closed with a 99% probability in 2040, in Scenario A it widens by about 34,000 persons/year—not primarily because of the cliff, but because activation remains low.
This is an important finding for health-policy prioritization: the reform dip of the early 2030s has been overestimated in the debate so far. At the same time, two other quantities have been underestimated—the short-term activation and funding question, and the throughput of the new system (Master places, phase-3 places) needed after 2038 in the long term (Section 4.8).
5.4. Psychotherapeutic Outpatient Clinics as the Central Structural Component
In the FTE model, psychotherapeutic outpatient clinics are the central structural answer to the activation question. They combine phase-3 training capacity with care provision in one integrated institution and enable trainee services to be publicly funded—thus simultaneously care-effective and training-supportive. The model makes the phase-3 place a binding constraint in the status-quo scenario: with 350–800 places per year, about 1,050 candidates are waiting for a place in 2040 at the current Master intake, and any expansion of the Master intake without additional places lengthens the queue rather than the workforce (Section 4.8); in Scenarios B and C the places suffice for the current Master intake but not for an expanded one. Compared with physician-led psychosocial centers—which primarily offer psychiatric care with subordinate psychotherapy—psychotherapeutic outpatient clinics address the specific structural gap between the training and care systems.
5.5. The Sensitivity of the Retirement Rate: A Model-Based Clarification
Within the scenario, the retirement rate correlates moderately with cumulative follow-on costs (ρ = +0.11/+0.15/+0.06), but strongly with the licensed stock in 2040 (ρ ≈ −0.8) and with accessible capacity (ρ ≈ −0.5). In the health-policy debate, the retirement wave is often portrayed as the central risk factor. The FTE-calibrated simulation shows a more differentiated picture: retirements act via the stock → potential capacity → accessible capacity → care gap → costs, and each retired therapist removes more accessible capacity the higher the activation rate is; in the underfunded Scenario A, most potential capacity is not activated in the first place, so retirements hardly show in the cost balance. Until 2038, moreover, completions exceed retirements in every scenario, so the stock grows despite the aging profession; the retirement rate becomes decisive only after the transition cliff, when the new system’s throughput has to cover it alone.
This does not mean retirements are unimportant. Their significance lies in the capacity base, in the post-2038 dynamics and in demographic time-criticality, more than in the absolute level of follow-on costs. Methodologically, this teaches us not to confuse sensitivity analyses with importance analyses: a parameter can be structurally time-critical without appearing dominant in the sensitivity correlation.
5.6. Long-Term Economic Effects and the Secondary-Cost Anchor
The modeled cumulative saving of roughly €82 billion (Scenario A minus Scenario C, 2026–2040) corresponds to an average annual saving of about €5.5 billion—about 1.1% of Austrian GDP (€480 billion in 2024). This order of magnitude is consistent with European estimates: the OECD and the European Commission put the total cost of mental ill-health at more than 4% of GDP across the 28 EU countries—over €600 billion in 2015—of which about 1.6% of GDP are indirect labor-market costs and 1.3% direct health expenditure [18]. The order of magnitude seems plausible, though it is not a precise empirical forecast. These figures primarily structure the problem, estimate magnitudes, and identify the investment case.
The cross-check against Austrian secondary-cost data (Section 3.11, Table 4) supports the conservative character of the model’s cost parameters: in the high-utilizer population studied by Seitz et al. [16], per-patient annual secondary costs of €147,689 were reduced by €79,746 within one year of an integrated interprofessional intervention, i.e. to 46% of the baseline value—dominated by avoided hospitalization days (−€76,919) and avoided sick-leave days (−€11,980), while psychotherapy expenditure itself rose only marginally (+€237). Observed per-patient costs in such populations thus exceed the model’s per-person cost assumptions (€5,000–18,000 in total) by one to two orders of magnitude. The model’s exploratory follow-on cost estimates should therefore be read as a lower bound of the plausible range, and the finding replicates, at the micro level, the macro-level thesis of this study: expenditure on psychotherapeutic treatment is small relative to the secondary costs it avoids.
5.7. International Contextualization of the Activation Gap
International benchmarking of the Austrian activation gap is methodologically difficult because few countries systematically publish comparable data on computed care capacity (FTE) and socially accessible care. Nevertheless, the literature offers structural indications. Germany: in the German statutory system with needs-based planning by the regional associations of statutory health insurance physicians, care is steered via practice seats. The 2017 structural reform was intended to shorten waiting times. Still, a practice-based cohort study found the average wait for a first consultation unchanged at about three weeks, and the interval between first contact and the start of treatment increased from about 18 to about 20 weeks [19]; this indicates a likewise relevant activation gap, though differently structured: the bottleneck is less the activation of existing capacity than the cap on insurance-funded seats. Switzerland: with the change to the prescription model on 1 July 2022, psychological psychotherapy is publicly funded on medical prescription rather than under delegation. Official monitoring shows how quickly a structural reform propagates: expenditure on psychological psychotherapy rose from CHF 528 million (2021) to an estimated CHF 922 million (2024), i.e., by about 20% per year, while the supplied full-time equivalents grew by roughly 35% between mid-2022 and mid-2023 [20]. The Swiss case thus supports the central thesis of this study—structural reform takes effect faster than workforce expansion—but also shows that activation and capacity respond jointly and with a substantial increase in expenditure. The Netherlands: the Dutch system combines mandatory health insurance with stepped care levels (basis-GGZ, specialist GGZ). It achieves comparatively broad access, albeit under strict indication rules and capped session numbers [21]. United Kingdom (IAPT/NHS Talking Therapies): the Improving Access to Psychological Therapies program (since 2007; NHS Talking Therapies from 2023) trained more than 10,500 new therapists and by 2018 was treating over 560,000 patients per year, with routine outcome data obtained for 98.5% of them [22]; methodologically interesting is its combination of workforce expansion (tiered therapist qualifications) with high activation—yet the typical treatment duration is short, which in the terms of our model corresponds to a low treatment intensity.
The international comparison suggests that Austria’s activation gap falls within a range typical of mixed systems but is structurally unfavorable. Structural reforms such as the Swiss prescription model or the British IAPT show that a substantial increase in the activation rate is possible within a few years—each with specific trade-offs: in Switzerland, a strong cost increase; in the UK, a reduction in treatment intensity. An Austrian reform would have to address these trade-offs explicitly.
5.8. On the Operationalization of Need
Using 9% of the population as the upper need estimate (mode 7.5% in the triangular distribution) follows the treatment-willingness operationalization in Dinhof et al. [2]. This quantity differs conceptually from epidemiological need (12-month prevalence of mental disorders requiring treatment, typically estimated at 15–20% in Austria) and from actual care demand (clinical indication × treatment motivation × availability).
The robustness analysis across 5%, 7.5%, 9%, and 12% need (Section 4.9) shows that the qualitative scenario ranking is stable across all need levels. The absolute care gap and coverage, however, are highly sensitive: at 5% need, Scenario C could computationally exceed 100% coverage at current intensity; at 12%, only about 51%. The choice of need operationalization is therefore a politically and scientifically important prior decision that must be made transparent.
5.9. Policy Implications
The simulation results support the following health-policy recommendations. They are model-based hypotheses that require empirical validation. (1) Activation as the time-critical lever: at current treatment intensity, activating existing capacity has the strongest short-term effect; at professionally adequate treatment intensity, parallel capacity expansion is required. This calls for fair insurance tariffs (raised to professionally justified fee levels), statutory-insurance contracting with outpatient clinics, including trainee services, regional care planning, and reduced bureaucratic access barriers. (2) Insurance funding of supervised trainees’ services: trainee services should be recognized and funded as care services from the moment the register listing takes effect (1 October 2026); a sectoral insurance contract with psychotherapeutic outpatient clinics that includes trainee services is the immediately available measure that acts on both sides of the trainees’ dual role—current care and future workforce—at once, and in the model it is the lever that closes the care gap in the partial-funding scenario by 2032. (3) Expansion of psychotherapeutic outpatient clinics with phase-3 capacity: outpatient clinics—as hybrid structures of care and training—are the central structural answer; they should be expanded within spatial-regional care planning, endowed with publicly funded quotas, and certified as core institutions of phase-3 training. (4) A monitoring system for FTE availability: Austria so far lacks systematic reporting of treatment hours, age structure, and activation rates in psychotherapeutic care; we therefore recommend annual monitoring of psychotherapeutic care capacity by BMSGPK and/or GÖG that records not only the number of registered psychotherapists but also full-time equivalents, age structure, retirements, training capacity, the number of trainees in specialist training under teaching supervision, care sector and funding status, as a precondition for evidence-based workforce planning. This recommendation follows from the simulation results presented here. (5) Master and phase-3 capacity of the new system: the current Master intake of about 1,000 per year does not replace the old pathway’s 714 completions per year after 2038 in any scenario; about 1,500 Master places per year with proportionally growing phase-3 places at universities, outpatient clinics and teaching practices are, in the model, the intake at which the workforce keeps growing after the transition cliff (Section 4.8); phase-3 places without Master places are as ineffective as Master places without phase-3 places, whose absence lengthens training through waiting and reduces long-term output. (6) Periodic workforce and care projections: the present model should serve as the basis for periodic (e.g., biennial) updated projections as further primary data become available. (7) Insurance expansion as a demand-side measure: a substantial increase in publicly funded psychotherapy quotas is the most direct form of activation increase and simultaneously reduces social inequality in access to care.
5.10. Limitations
The model has several substantial limitations that must be discussed explicitly. The FTE anchor is an empirical median: the 21 treatment hours/week [2] are an empirical median, not a legally defined full-time equivalent; actual variability in the profession is considerable (part-time work, multiple employment, private practice); the model maps the median assumption, not the distribution. Treatment intensity of 13 units/patient: this figure reflects the current value [3] and presumably underestimates professionally necessary treatment intensity; assuming 30 units/patient, theoretical capacity falls to about 290,000 persons/year—a different and more realistic magnitude of the activation gap. Chronification modeling: despite the three-variant approach, quantitative chronification dynamics by waiting duration remain a central uncertainty; empirically validated risk curves are urgently needed. No regional differentiation: the model operates at national level; considerable regional differences (Vienna versus rural federal states; care density, transport links, outpatient-clinic density) are not represented. Quality dimensions: the model maps capacities quantitatively, not qualitatively; it does not consider modality-specific fit, treatment quality, differential effectiveness, or indication decisions. No system-adaptation dynamics: the model assumes that actors (patients, therapists, institutions) do not react to the evolving care gap; in reality, price, substitution, and political adjustment effects would occur. Sensitivity analysis as a correlation measure: the within-scenario rank correlations in Figure 5 capture monotonic relationships but no interaction effects, and they describe parameter uncertainty within a policy package, not the effect of choosing between packages; extended variance-based sensitivity analyses (Sobol indices, EFAST) would be useful in follow-up work. Trainee capacity: the treatment capacity of supervised trainees in the current unfunded state (60%, range 50–70% of a fully active therapist) is anchored on a stratified re-analysis of a single, unweighted member survey with a 43.5% response rate, categorical answers converted to category midpoints and respondents who are younger and more active than the profession as a whole [9] (Table S7); its rise to 90% (range 80–100%) under full insurance funding, the one-year lag and the equal treatment of old-system and phase-3 trainees are expert assumptions of the authors. Because the trainee line contributes 18% of potential capacity in 2026 and up to 30% in 2032, this assumption sets the trainee effect level and the timing of gap closure in Scenario B (Section 4.9.5). A longitudinal measurement of trainees’ treatment hours before and after the register listing of 1 October 2026 is the single most important calibration task (Section 5.11). Training pipeline: the Master intake (500 public places as a ministerial planning figure, 500 private places as an estimate), the direct entrants under § 10, the phase-3 duration and the lead time to full trainee activity are planning assumptions rather than observed values; the accelerated completion of all old-system candidates by 2038 follows the law, not observed behavior; the queue model assumes no drop-out while waiting; and the propaedeutic candidates who switch to the Master program are assumed to compete for the existing places. Need operationalization: the 9% treatment-willingness value is based on [4] and is a model assumption; actual clinical need, epidemiological need, and treatment willingness can diverge considerably. Secondary-cost anchoring: the cross-check against Austrian secondary-cost data (Table 4) relies on a clinically selected high-utilizer population [16] and on aggregate statistics with reference years 2006–2016; it supports the conservative character of the cost parameters but is not a formal cost-of-illness validation for the average person in the care gap.
5.11. Future Research
The present simulation identifies several priority research needs: an empirical FTE survey with full coverage and distribution analysis (not only the median) of weekly treatment hours in the Austrian profession and of persons in training under supervision, extending the cross-sectional survey re-analysis of Table S7 into a panel that observes trainees before and after the register listing of 1 October 2026; differentiated measurement of activation rates by sector (insurance quota, self-payment, outpatient clinic, teaching practice); validation of the chronification–waiting-time relationship in Austrian data (longitudinal study); measurement of actual waiting times by care sector and region; a cost analysis of specialist training under teaching supervision (cost per training place, funding requirements, economic viability of outpatient-clinic structures); an evaluation study of existing psychotherapeutic outpatient clinics in Austria (care quality, cost efficiency, training integration); system-dynamics modelling with explicit feedback loops (price–quantity effects, substitution dynamics); extended variance-based sensitivity analyses (Sobol indices); a comparative study of activation rates and funding models in Germany, Switzerland, and the Netherlands; and an analysis of regional care density and its FTE activation rates.
6. Conclusions
The present FTE-calibrated simulation model suggests a differentiated finding: at the current treatment intensity of 13 units per patient per year, psychotherapeutic care in Austria is limited primarily by the insufficient activation of existing capacity into socially accessible, publicly funded care—less by a shortage of psychotherapists in the narrow sense. The computed personnel capacity of about 669,000 persons/year contrasts with fully funded care of only about 96,500 persons (2022). The robustness analysis sharpens this finding for higher treatment intensities: at a professionally adequate 30–40 units per patient per year (the indication for moderate to severe disorders), activation becomes necessary but not sufficient; additional capacity expansion is then structurally required.
The central health-policy thesis of the model can be stated as follows: investments in public funding, in psychotherapeutic outpatient clinics, in the insurance funding of supervised trainees’ services, and in Master and phase-3 capacities are, in the scenario comparison, not primarily cost factors but structural measures with high leverage—with the activation dimension dominant in the short term and parallel capacity expansion becoming necessary in the medium to long term as treatment intensity rises. The modeled follow-on costs are exploratory order-of-magnitude estimates, not precise forecasts.
In the most favorable scenario (expansion/full funding), the care gap can be closed from 2028, with cumulative savings of roughly €82 billion versus the status quo by 2040. Even in the moderate scenario (partial funding), the gap is closed from 2032 to 2036 and reduced by about 88% in 2040, with cumulative savings of about €70 billion—in both cases largely by funding the services of trainees who already treat under supervision—today mostly part-time, with capacity to spare. Within each policy package, the assumed population need remains the dominant uncertainty, which is why the robustness analysis across need levels and treatment intensities is central to the model. The reform dip of the early 2030s is shallow in the FTE model; the decisive transition effect is the cliff of 2038, when the old pathway’s completions and trainees disappear and the new system’s throughput—about 1,000 Master places per year today, about 1,500 needed with matching phase-3 places—decides whether the workforce keeps growing. The methodological lesson of this study is that workforce models without FTE calibration and without three-level capacity differentiation miss the actual health-policy lever.
Beyond care provision, these findings also inform national research and training policy. The Austrian University Development Plans (GUEP 2025–2030 and GUEP 2028–2033) [23,24] do not address psychotherapy specifically, but they set the framework objectives—interdisciplinary competence, lifelong learning and international collaboration—within which the new university-based psychotherapy training will have to be situated; this perspective should also inform the reading of OECD indicators that portray Austrian outpatient care as capable of improvement.
Methodologically, the reported figures are scenario simulations under explicit assumptions, not empirical forecasts. Their main function is to structure the problem, identify critical decision points, and estimate orders of magnitude. The most urgent next research step is to deepen the calibration—particularly regarding activation dynamics, the chronification–waiting-time relationship, and regional care. Austrian psychotherapeutic care stands at a reform-driven crossroads; decisions in the coming years—especially the funding structure—will determine the care situation up to 2040 and beyond.
Supplementary Materials
The following supporting information can be downloaded at the website of this paper posted on Preprints.org. Supplementary Material S1: Robustness re-calculation of need and treatment intensity (methods note); Table S1: Robustheitsmatrix_Bedarf_Einheiten_Szenarien.csv (deterministic robustness matrix, 48 constellations); Table S2: MC_Robustheit_Bedarf_Einheiten.csv (Monte-Carlo robustness summary with 80%/95% prediction intervals); Table S3: MC_FTE_Kalibriert_AllYears_ANNOTATED.csv (annual medians and prediction intervals of the main simulation, 2026–2040); Table S4: MC_FTE_Kalibriert_Sensitivitaet_within_ANNOTATED.csv (within-scenario Spearman correlations with cumulative costs); Table S5: MC_FTE_Kalibriert_Sensitivitaet_Zielgroessen_ANNOTATED.csv (within-scenario correlations with costs, accessible capacity and licensed stock, Table 6); Table S6: MC_FTE_Kalibriert_Masterplaetze_ANNOTATED.csv (Master-intake analysis, Table 7); Supplementary Material S2 and Table S7: Table_S7_survey_reanalysis.csv (stratified re-analysis of the ÖBVP member survey of December 2024 [9]—treatment hours, patients, occupation, expansion plans and fees of trainees under supervision versus listed psychotherapists—with methods note); Table S8: MC_FTE_Kalibriert_Traineekapazitaet_ANNOTATED.csv (robustness to the trainee-capacity assumption, Table 8); Code S1: montecarlo_psychotherapie_fte_annotiert_mit_quellen.py (annotated source code of the main Monte-Carlo model; key excerpts in Appendix B); Code S2: robustness re-calculation script (need × treatment intensity).
Author Contributions
Conceptualization and model architecture, M.B. and B.H.; methodology, M.B.; software, M.B.; formal analysis, M.B. and F.P.; data curation, M.B. and F.P.; visualization, M.B.; validation, H.L.-S.; writing—original draft preparation, M.B. and F.P.; writing—review and editing, M.B., B.H., F.P. and H.L.-S.; supervision, H.L.-S. All authors have read and agreed to the published version of the manuscript.
Funding
This research received no external funding.
Institutional Review Board Statement
Ethical review and approval were waived for the member survey re-analyzed in Table S7, which the ÖBVP conducted in anonymized form in December 2024, because no sensitive personal data were collected and no vulnerable groups were included (guidelines of the Austrian Agency for Research Integrity) [9]; the simulation itself uses published aggregate data and involves no human participants.
Informed Consent Statement
Survey respondents provided informed consent by opening the personalized invitation link [9]; the simulation involves no human participants.
Data Availability Statement
The original data presented in this study are openly available in the Open Science Framework (OSF) at https://doi.org/10.17605/OSF.IO/FZXRT. The deposit contains the annotated simulation source code (Codes S1 and S2), the result files (Table S1–S6 and S8), and the aggregate survey re-analysis (Table S7); all random draws are reproducible via the fixed seed 20260622. We also include key result files as Supplementary Materials, and Appendix B documents the annotated source code. All empirical model inputs are published aggregate statistics cited in the manuscript, except the unfunded trainee-capacity anchor, which is derived from a stratified re-analysis of the authors’ own anonymous member survey (partly reported in [9]); the aggregate results of that re-analysis are provided in Table S7, while the individual-level responses are not deposited. No third-party raw data were used.
Conflicts of Interest
M.B., B.H. and F.P. work in the Austrian Federal Association for Psychotherapy (ÖBVP, Department of Science and Research); M.B. is also involved in the master’s program in psychotherapy at Karl Landsteiner University of Health Sciences. H.L.-S. heads the Postgraduate Unit of the Medical University of Vienna and is involved in psychotherapy-related research and teaching programs. These institutional affiliations could, in principle, influence model design and interpretation; we address this through methodological transparency (fully documented code, open parameter tables, explicit limitations).
Abbreviations
The following abbreviations are used in this manuscript:
| Abbreviation | Meaning |
| FTE | Full-time equivalent |
| i.F.u.L. | In specialist training under teaching supervision (in Fachausbildung unter Lehrsupervision); phase-3 trainees of the new system (PThG 2024); together with i.A.u.S. ‘supervised trainees’ |
| i.A.u.S. | In training under supervision (in Ausbildung unter Supervision); trainees of the old system (PThG 1990) entitled to treat under supervision |
| PThG 2024 | Austrian Psychotherapy Act 2024 (Psychotherapiegesetz 2024) |
| PT | Psychotherapist |
| ÖBVP | Austrian Federal Association for Psychotherapy |
| GÖG | Gesundheit Österreich GmbH (Austrian National Public Health Institute) |
| BMSGPK | Federal Ministry of Social Affairs, Health, Care and Consumer Protection |
| ÖGK | Austrian Health Insurance Fund |
| PI | Prediction interval |
| MC | Monte Carlo |
| IAPT | Improving Access to Psychological Therapies (UK) |
| BMBWF / BMFWF | Federal Ministry of Education, Science and Research / Federal Ministry of Women, Science and Research (Austria) |
| GGZ | Geestelijke gezondheidszorg (Dutch mental health care) |
| NHS | National Health Service (UK) |
| OECD | Organisation for Economic Co-operation and Development |
Appendix A. Annotated Calculation Foundations, Empirical Data Anchors, and Code Documentation
This appendix documents the mathematical architecture, empirical data anchors, and sensitivity assumptions of the Monte-Carlo model at the depth required for reproduction and critical review. It follows the annotated Python implementation of the simulation (NumPy, Pandas, Matplotlib).
Appendix A.1. Overview of the Model Architecture
The model is implemented as a discrete annual update from 2026 to 2040 (T = 15 years), with 30,000 Monte Carlo iterations per scenario. Each simulation run draws all stochastic parameters from their triangular distributions during initialization; the annual loop then updates stock, pipeline, capacities, care gap, and costs consistently over the whole projection horizon. The calculation sequence in each year is fixed: (1) update of the old Fachspezifikum pool with admissions (until 2030), completions and drop-outs, accelerated completion 2031–2038 and derivation of the i.A.u.S. stock; (2) phase-3 completions (licensures) of the new system; (3) new phase-3 entrants from the Master cohorts (two years after entry) and direct entrants, first-in-first-out allocation of free phase-3 places; (4) treating trainee stock (after the lead time; waiting candidates at 50%) and trainee capacity with the funding-dependent capacity factor (f₀ → f₁, one year behind the funding ramp); (5) computation of retirements and other exits and workforce update PT(t+1); (6) potential capacity from therapists and trainees; (7) accessible capacity from the activation rate (therapists) and the phased-in insurance funding of trainee services; (8) computation of the care gap; (9) computation of annual and cumulative follow-on costs.
Appendix A.2. Empirical Data Anchors with Source Attribution (Q1–Q5)
The code header documents the model parameters via five source groups (Q1–Q5), enabling direct tracing of each model anchor to its primary source (Table A1).
Table A1.
Empirical data anchors with source attribution.
| Q | Data anchor | Source |
|---|---|---|
| Q1 | 11,676 psychotherapists (31 December 2023); of whom 8,523 < 65 years, 3,159 ≥ 65 years; median 21 h/week plus 3 h documentation; 45 weeks/year; 13 units/patient/year; theoretical total capacity ≈ 669,121 persons/year; 199,250 partially/fully funded and 96,500 fully funded persons reached in 2022; need/treatment willingness ≈ 9%. | [2] |
| Q2 | Social-insurance expenditure 2022: ~€135 million; 370,389 persons in a broad psychosocial count; 96,500 fully funded psychotherapy in the narrow sense; expansion by a factor of 3–4 required for need coverage. | [3] |
| Q3 | Training statistics 2025 (reference date 1 June 2025; model anchor): 5,601 in the Fachspezifikum, of whom 3,238 (57.8%) with the status ‘in training under supervision’; 929 admissions; 624 completions; 91 drop-outs (drop-out share of throughput ≈ 12.7%); Master programme in psychotherapy offered from the winter semester 2026/27; register listing of trainees from 1 October 2026 with insurance-benefit eligibility. For reference, training statistics 2023: 5,021 in the Fachspezifikum; 875 admissions; 514 completions; 85 drop-outs. | [13,14] |
| Q4 | 3.5% care target: 13,125 therapists; 5% care target: 18,750 therapists; personnel supply 2040 between 10,660 and 14,329 depending on retirement assumption. | [4] |
| Q5 | Average age of the registered profession 57.8 years; 3,719 persons (31.9%) aged 50–65 and 3,156 (27.0%) aged 66 or older (Table 2 therein, based on BMSGPK data for 2023); 2,799 persons in specialist training under teaching supervision in 2023 (Table 1 therein); 27–40% age-related exits/reductions by 2040; 83% of therapists without a benefits-in-kind contract and 96% of supervised trainees express interest in insurance-funded places (tariff-dependent). Survey population: 6,388 ÖBVP members invited, 2,777 responses (43.5%), of whom 2,139 listed psychotherapists and 638 trainees under supervision (37.6% of the 1,699 ÖBVP trainees; 22.8% of all 2,799 trainees in 2023); the trainee-specific treatment hours, patients, occupation and fees are not reported in [9] and are re-analysed from the authors’ survey data in Table S7. | [9] |
Note: Persons entitled to benefits in Austrian social health insurance, 2022 annual average: 8,942,791 (operational reference quantity for need modeling) [11]. The denominator is held constant over the projection horizon; the 2023 and 2024 annual averages (9,020,191 and 9,063,328) are about 0.9% and 1.4% higher, so a dynamic denominator would raise modeled need—and hence the care gap—by roughly one percentage point without altering the scenario ranking.
Appendix A.3. Core Formulas with Calculation Examples
Table A2.
Model formulas with calculation examples.
| Quantity | Formula | Example value |
|---|---|---|
| Capacity per fully active therapist | h/week × weeks/year ÷ units per patient/year | (21 × 45)/13 = 72.69 |
| Capacity per registered therapist (age-corrected) | theoretical total capacity ÷ registered therapists | 669,121/11,676 = 57.31 |
| Funding activation (actual, 2022) | partially/fully funded reached ÷ theoretical capacity | 199,250/669,121 = 0.298 |
| Full-funding share (actual, 2022) | fully funded reached ÷ theoretical capacity | 96,500/669,121 = 0.144 |
| Need modelling | population × Δ(0.05; 0.075; 0.09) | median ≈ 647,000 |
| Workforce update | PT(t+1) = PT(t) + completions old + completions new − retirements − exits | see Figure 3 |
| Potential capacity | PT(t) × K_reg + [i.A.u.S.(t) + i.F.u.L.(t)] × K_trainee(t) | scenario-dependent; trainee share ≈ 18% (2026), ≈ 25–30% (2032) |
| Trainee capacity per person | K_trainee(t) = 72.69 × [f₀ + (f₁ − f₀) × f_fund × ramp(t − 1)] | unfunded: 0.60 × 72.69 = 43.6; fully funded: 0.90 × 72.69 = 65.4 (modes); 2040: 0.70 (A) · 0.79 (B) · 0.86 (C) × 72.69 |
| Simultaneous phase-3 places | places per year × phase-3 duration | A: 550 × 3 = 1,650 (modes) |
| Accessible capacity | PT(t) × K_reg × activation rate + trainee capacity × f_fund × ramp(t) | activation A: 33% · B: 58% · C: 82%; f_fund A: 30% · B: 65% · C: 90% |
| Care gap | max(need − accessible capacity, 0) | see Figure 4 |
| Follow-on costs (annual) | gap × (base cost × waiting-time factor + chronification rate × excess cost + productivity cost) | Σ → see Table 5 |
Note: K_reg = age-corrected capacity per registered therapist; K_trainee(t) = funding-dependent capacity per supervised trainee (identical for both systems); f₀/f₁ = capacity factor in the unfunded/fully insurance-funded state; f_fund = insurance-funded share of trainee services; ramp(t) = 0 (2026), 0.25 (2027), 0.5 (2028), 0.75 (2029), 1 (from 2030); Δ(a, m, b) = triangular distribution with minimum a, mode m, maximum b.
Appendix A.4. Scenario Parametrization (Triangular Distributions)
Table A3 documents the triangular distributions used per scenario in the form (minimum; mode; maximum). These values sit at the interface between model assumptions and simulation results and should be the focus of any critical review.
Table A3.
scenario-specific triangular distributions of the model parameters.
| Parameter | A: status quo | B: transition | C: expansion |
|---|---|---|---|
| Funding activation | (0.25; 0.32; 0.42) | (0.42; 0.58; 0.72) | (0.68; 0.82; 0.95) |
| Full-funding share | (0.10; 0.15; 0.22) | (0.25; 0.38; 0.55) | (0.60; 0.78; 0.90) |
| Completion rate, new system | (0.45; 0.60; 0.75) | (0.55; 0.70; 0.82) | (0.65; 0.80; 0.90) |
| Phase-3 training places (per year) | (350; 550; 800) | (800; 1,200; 1,600) | (1,300; 1,800; 2,500) |
| Insurance-funded share of trainee services (target; phased in 2027–2030) | (0.15; 0.30; 0.50) | (0.40; 0.65; 0.85) | (0.75; 0.90; 1.00) |
| Chronification rate | (0.22; 0.35; 0.50) | (0.13; 0.23; 0.34) | (0.06; 0.13; 0.22) |
| Waiting-time cost factor | (1.25; 1.70; 2.40) | (1.05; 1.25; 1.60) | (0.95; 1.05; 1.20) |
Note: Values are (minimum; mode; maximum) of the respective triangular distribution. The following common distributions and constants apply across scenarios (model version 2.1): need rate (0.05; 0.075; 0.09); capacity per registered therapist (50; 57.31; 68); capacity per supervised trainee relative to a fully active therapist (72.69 persons/year), identical for both training systems—unfunded state f₀ (0.50; 0.60; 0.70), anchored on the survey re-analysis in Table S7, and fully insurance-funded state f₁ (0.80; 0.90; 1.00), expert assumption of the authors, with the capacity per trainee following the phased-in funding of trainee services with a one-year lag; admissions to the old pathway until 2030 (850; 950; 1,100 per year) and turnover time of the old pool (8; 9; 10 years); drop-out share of throughput 12.7%; Master places per year: 500 (public universities, planning figure) + (250; 500; 750) (private universities); direct entrants to phase 3 (20; 50; 100 per year); phase-3 duration (2; 3; 5 years); lead time to full trainee activity (0.5; 1; 2 years); waiting candidates treat at 50%; base retirement rate (0.020; 0.035; 0.055); retirement growth (0; 0.015; 0.035); other exits (0.003; 0.007; 0.014); base cost per untreated person (€2,500; €5,000; €9,000); chronification excess costs (€4,000; €10,000; €20,000); productivity costs (€1,000; €3,000; €7,000). The parameters ‘new entries/training duration/phase-out of the old system’, ‘first-year students’ and ‘delay of the new system’ of model version 1 are replaced by these quantities.
Appendix A.5. Reproducibility and Implementation
The simulation is implemented in Python 3 and uses NumPy for random number generation and vectorization, Pandas for result aggregation, SciPy for rank correlations, and Matplotlib for graphics. All random draws are reproducible through a fixed seed (np.random.seed(20260622); n_sim = 30,000; years 2026–2040). Results are exported as CSV files: (1) MC_FTE_Kalibriert_AllYears_ANNOTATED.csv with annual medians and percentile intervals per scenario, including the trainee stocks and the waiting queue; (2) MC_FTE_Kalibriert_Summary_2040_ANNOTATED.csv with final-year results; (3) MC_FTE_Kalibriert_ParamsSample_ANNOTATED.csv with a sample of drawn parameters and final-year results (n = 10,000 rows); (4) MC_FTE_Kalibriert_Sensitivitaet_within_ANNOTATED.csv with the within-scenario Spearman correlations with costs; (5) MC_FTE_Kalibriert_Sensitivitaet_Zielgroessen_ANNOTATED.csv with the correlations for costs, accessible capacity and licensed stock (Table 6); (6) MC_FTE_Kalibriert_Masterplaetze_ANNOTATED.csv with the Master-intake analysis (Table 7); (7) MC_FTE_Kalibriert_Traineekapazitaet_ANNOTATED.csv with the trainee-capacity robustness analysis (Table 8). All graphics are exported at 600 dpi. The code file (montecarlo_psychotherapie_fte_annotiert_mit_quellen.py, about 880 lines) is available as a supplement and contains complete documentation of the empirical anchors with explicit source attribution (Q1–Q5) and a version note in its header. The deposited code is model version 2.1, which adds the trainee capacity line, the Master-entry cohorts, the phase-3 queue, and the 2025 training anchors (version 2) and the funding-dependent capacity per trainee (version 2.1) to the first version; the first version—which treated trainees as a small, phase-out-driven side channel—is retained in the repository as a versioned record.
Appendix A.6. Methodological Limits in Detail
Beyond the general limitations in Section 5.10, the following specific limits are relevant for interpreting the numerical results. Chronification curve: despite consistent qualitative evidence, an empirically robust Austrian risk curve for chronification after 1, 3, 6, or 12 months of waiting is lacking; the waiting-time–chronification relationship is therefore carried as a sensitivity parameter with three variants (Table 1); empirical calibration is urgently needed once longitudinal data become available. Cost parameters as scenario assumptions: the cost components (base cost €5,000, chronification excess €10,000, productivity cost €3,000/year; modes) are scenario assumptions whose absolute values remain to be validated with Austrian data on sick leave, earnings losses, invalidity pensions, and healthcare costs; the qualitative validity of the scenario ranking is robust, while absolute euro amounts are order-of-magnitude indicators, not precise forecasts. Trainee capacity: the number of persons in training under supervision is published (3,238 on 1 June 2025 [14]), but their caseload and weekly treatment hours are not published; the unfunded level (0.50; 0.60; 0.70 of a fully active therapist) is anchored on a stratified re-analysis of the authors’ member survey (Table S7: ratio of mean weekly hours 0.61–0.70, of patients 0.50), while the fully funded level (0.80; 0.90; 1.00) is an expert assumption; their small within-scenario correlations with costs (|ρ| ≤ 0.03) do not mean a small effect—the trainee line supplies 18% of potential capacity in 2026 and up to 30% in 2032, and its level determines the year in which Scenario B closes the gap (Table 8); the assumption therefore belongs to the first calibration priorities. Retirement dynamics: the age structure of the profession is empirically known (Q5: 27% ≥ 66 years), but individual exit ages and the reduction of weekly hours by age group are not; the modeling with a 3.5% base rate growing linearly to up to 5.5% spans the plausible range; the moderate cost sensitivity of this parameter (ρ = +0.06 to +0.15) and its dominant role for the licensed stock (ρ ≈ −0.8) are discussed in Section 5.5.
Appendix A.7. Model Validation Against 2022/2023 Workforce Data and 2025 Training Data
A validation section is methodologically central for care-economic simulation models. Four validation steps are documented here: (a) face validity, (b) historical validation against the 2022/2023 workforce and funding data and the 2025 training statistics, (c) extreme-scenario testing, and (d) reproducibility checking.
Table A4.
Historical validation against empirical values 2022–2025.
| Quantity | Empirical value 2022–2025 | Model (starting value) | Status |
|---|---|---|---|
| Licensed therapists (31 December 2023) | 11,676 | 11,676 | exact |
| Theoretical capacity at 13 units | 669,121 | 669,121 | exact |
| Partially/fully funded reached, 2022 | 199,250 | 199,250 (activation 0.298) | exact |
| Fully funded reached, 2022 | 96,500 | 96,500 (full funding 0.144) | exact |
| Supervised trainees, old system (1 June 2025) | 3,238 | 3,238 (initial value) | exact |
| Persons in the Fachspezifikum (2023 → 2025 → model 2026) | 5,021 → 5,601 | 5,835 (2026, median) | trend consistent (+4–6%/year) |
| Admissions, Fachspezifikum (2024/25) | 929 | 950 (mode; 850–1,100) | plausible (2023/24: 1,058) |
| Completions, Fachspezifikum (2024/25) | 624 | 637 (2026, median) | +2%, plausible |
| Persons in the Fachspezifikum (1 June 2025) | 5,601 | 5,601 (initial value) | exact |
| Drop-out share of annual throughput (2024/25) | ≈ 12.7% (91/715) | 12.7% (model value) | exact |
Note: The exact matches are not validation results in the narrow sense but calibration commitments—the model was constructed to reproduce the empirical starting values. Two consistency checks go beyond calibration. First, the 2023 training statistics [13] and the 2025 statistics [14] bracket a two-year interval in which the Fachspezifikum stock grew from 5,021 to 5,601 (+5.6% per year), admissions from 875 to 929 (with a peak of 1,058 in 2023/24) and completions from 514 to 624; the model’s admission range (850–1,100), turnover time (8–10 years) and first-year completions (637) reproduce this trend. Second, the 2040 licensed stock of Scenario A (15,333) lies above the 10,660–14,329 range of the GÖG projection [4], which did not contain the accelerated completion of the old pathway required by § 60 PThG 2024 nor the Master-entry route of the new system. Validation in the narrow sense would require testing predicted 2026/2027 values against incoming empirical data; this can only be done as data become available.
We checked face validity by discussing the model architecture with representatives from care research, training statistics, and professional policy. Key plausibility findings: (a) the three-level capacity logic (potential/accessible/fully funded) matches the actual care structure in Austria; (b) the four-to-seven-year latency of the Master route (two years of Master studies plus two to five years of phase 3) is consistent with the legally defined training structure; (c) the 3.5% retirement assumption matches the demographic structure (27% over 65). Extreme-scenario testing: at an activation rate of 0.00, the care gap equals full need (~805,000 persons/year)—confirmed; at 1.00, the gap equals need minus potential capacity—confirmed (negative gaps correctly bounded at 0 at 13 units; a substantial gap remains at 30 units, i.e., capacity shortage); at a retirement rate of 0.00, the workforce grows only through completions—confirmed; at 0.10, a substantial workforce loss occurs (in Scenario A the stock falls below 5,000 by 2040)—confirmed. Limits of validation: the validation shows that the model reproduces the empirical starting data and behaves plausibly under extreme conditions; genuinely predictive validation is possible only from 2026/2027 onward when the first reform data become available. Until then, the model counts as a scenario model, not a forecasting instrument.
Appendix A.8. Activation-Rate Transparency: Operationalization of the Scenarios
The activation rate—the share of potential capacity translated into accessible care—is the dominant model parameter. Table A5 makes the activation assumptions behind the scenarios transparent and assigns each a political-structural realization scenario.
Table A5.
Activation rates and their political-structural interpretation.
| Activation rate | Model assignment | Empirical reference | Political-structural realization condition |
|---|---|---|---|
| 0% | theoretical lower bound | — | No publicly funded or outpatient-accessible psychotherapy; purely private market. |
| 30% | Scenario A (actual, 2022) | 199,250/669,121 = 0.298 | Current Austrian care structure: limited insurance quotas, regionally unequal clinic density, high self-payment share. |
| 50–60% | Scenario B | model estimate | Stepwise clinic expansion, partial trainee funding, moderate insurance expansion; comparable to the German needs-planning level. |
| 80–85% | Scenario C | model estimate; ~Switzerland | Substantial insurance expansion, nationwide clinic structure, full trainee funding; comparable to the Swiss prescription model. |
| 100% | theoretical upper bound | — | Hypothetical maximum: every practising therapist fully integrated into the public/partially funded system; not reached in any real system to date. |
Note: The assignment is heuristic and serves transparency. The exact activation rate achievable by a given policy measure is an empirical question that can only be evaluated ex post.
Appendix A.9. Robustness Matrix: Numerical Summary
Table A6 summarizes coverage (median, %) across selected constellations of the robustness analysis. Values ≥ 100% indicate full need coverage; values ≥ 80% are considered the threshold for adequate care in care research.
Table A6.
Coverage (%) across robustness constellations—Scenarios A/B/C (selection).
| Need | Intensity | A: status quo | B: partial funding | C: full expansion | Mean difference C−A |
|---|---|---|---|---|---|
| 5% | 13 units | 45% | 85% | 123% | 78 pp |
| 7.5% | 13 units | 30% | 57% | 82% | 52 pp |
| 9% | 13 units | 25% | 47% | 68% | 43 pp |
| 12% | 13 units | 19% | 36% | 51% | 32 pp |
| 5% | 20 units | 29% | 55% | 80% | 51 pp |
| 9% | 20 units | 16% | 31% | 44% | 28 pp |
| 5% | 30 units | 19% | 37% | 53% | 34 pp |
| 9% | 30 units | 11% | 21% | 30% | 19 pp |
| 12% | 30 units | 8% | 15% | 22% | 14 pp |
| 9% | 40 units | 8% | 15% | 22% | 14 pp |
Note: Selection of 10 of the 48 robustness constellations. The complete matrix is available as a CSV supplement (Table S1). pp = percentage points. Bold rows mark the constellations central to care policy.
The robustness matrix shows three structural findings. First, the absolute effectiveness of the scenario difference (column ‘mean difference C−A’) declines with rising treatment intensity—at 30 units/year it is only 14–19 percentage points versus 32–78 percentage points at 13 units. Second, even Scenario C falls clearly below the 80% care threshold at 30 or 40 units and 9% need (30% and 22%, respectively). Third, the qualitative scenario ranking (A < B < C) remains stable across all constellations—that is, the model’s central health-policy message remains robust while its quantitative dimension shifts substantially.
Appendix B. Annotated Code Excerpts
The following excerpts reproduce the methodologically central sections of the annotated simulation source code (Code S1: montecarlo_psychotherapie_fte_annotiert_mit_quellen.py, model version 2.1; original German comments retained; in Appendix B.2 the splitting of phase-3 batches into integer durations and the result bookkeeping are omitted for readability). The complete scripts for the main model (Code S1) and the robustness re-calculation (Code S2) are provided as supplementary materials; all random draws are reproducible via the fixed seed 20260622.
Appendix B.1. Reproducibility Settings and FTE/Capacity Anchors (Code S1)
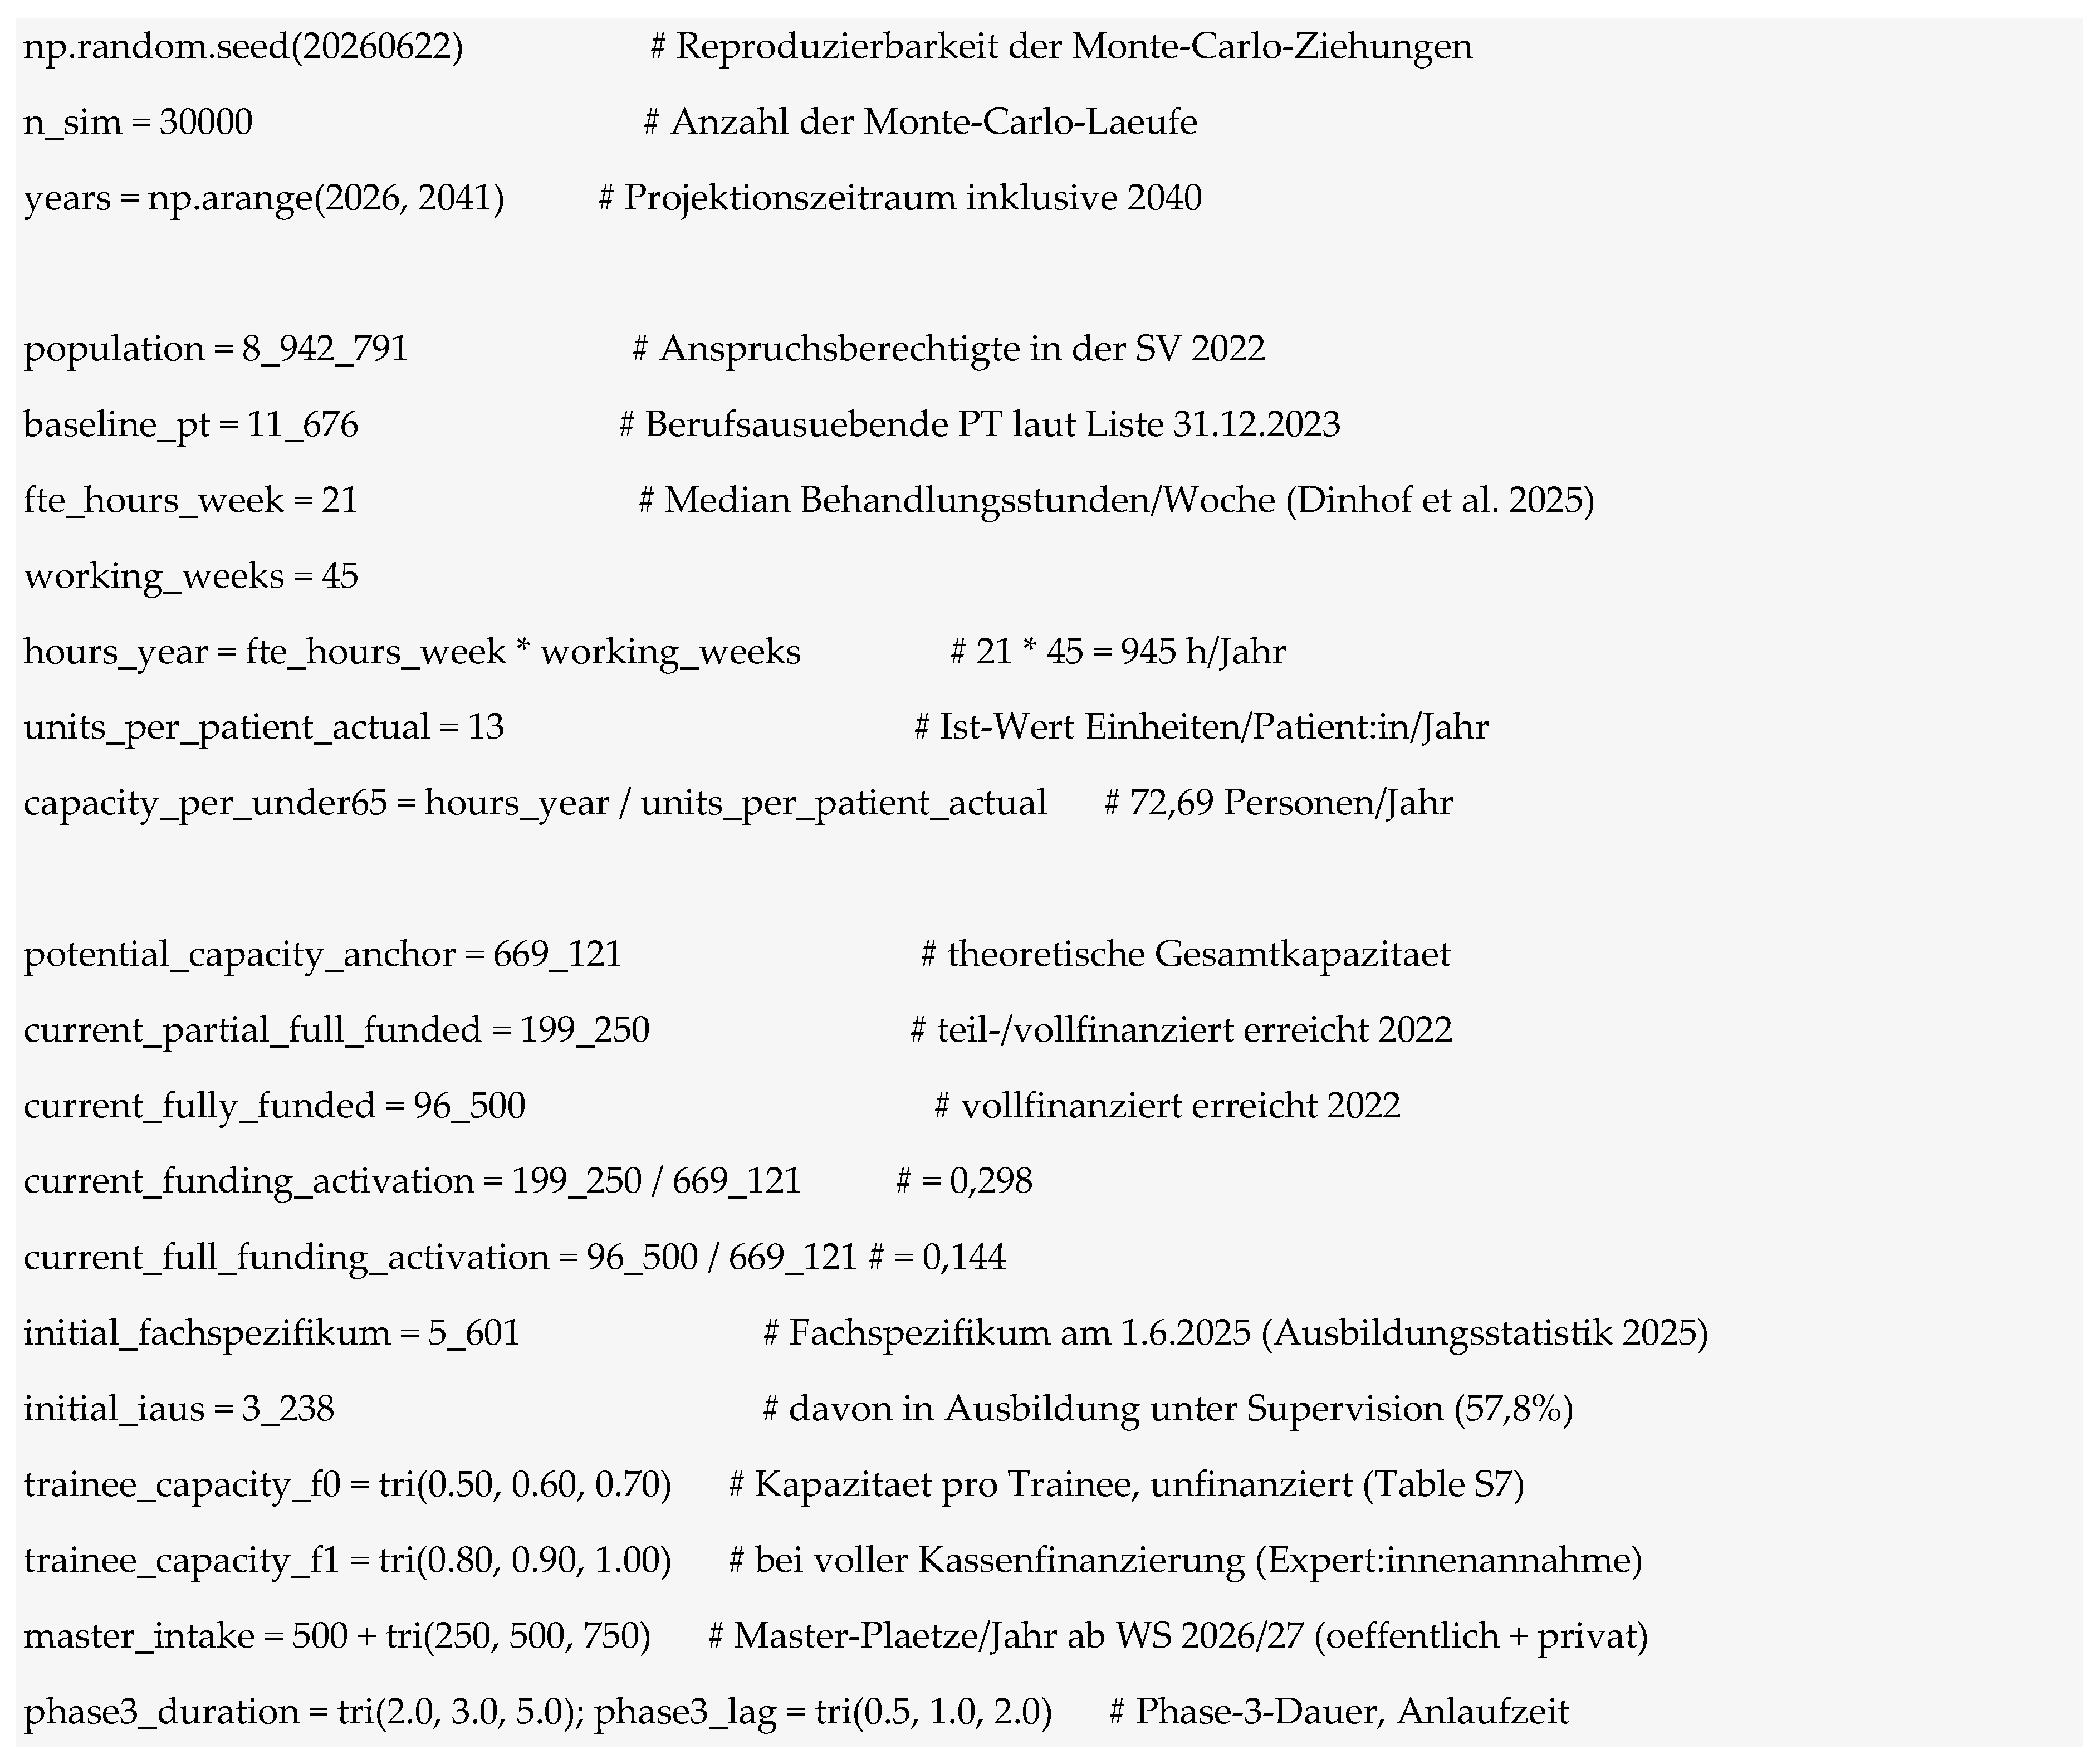
Appendix B.2. Annual Workforce, Trainee and Capacity Loop (Code S1, Simplified Excerpt)
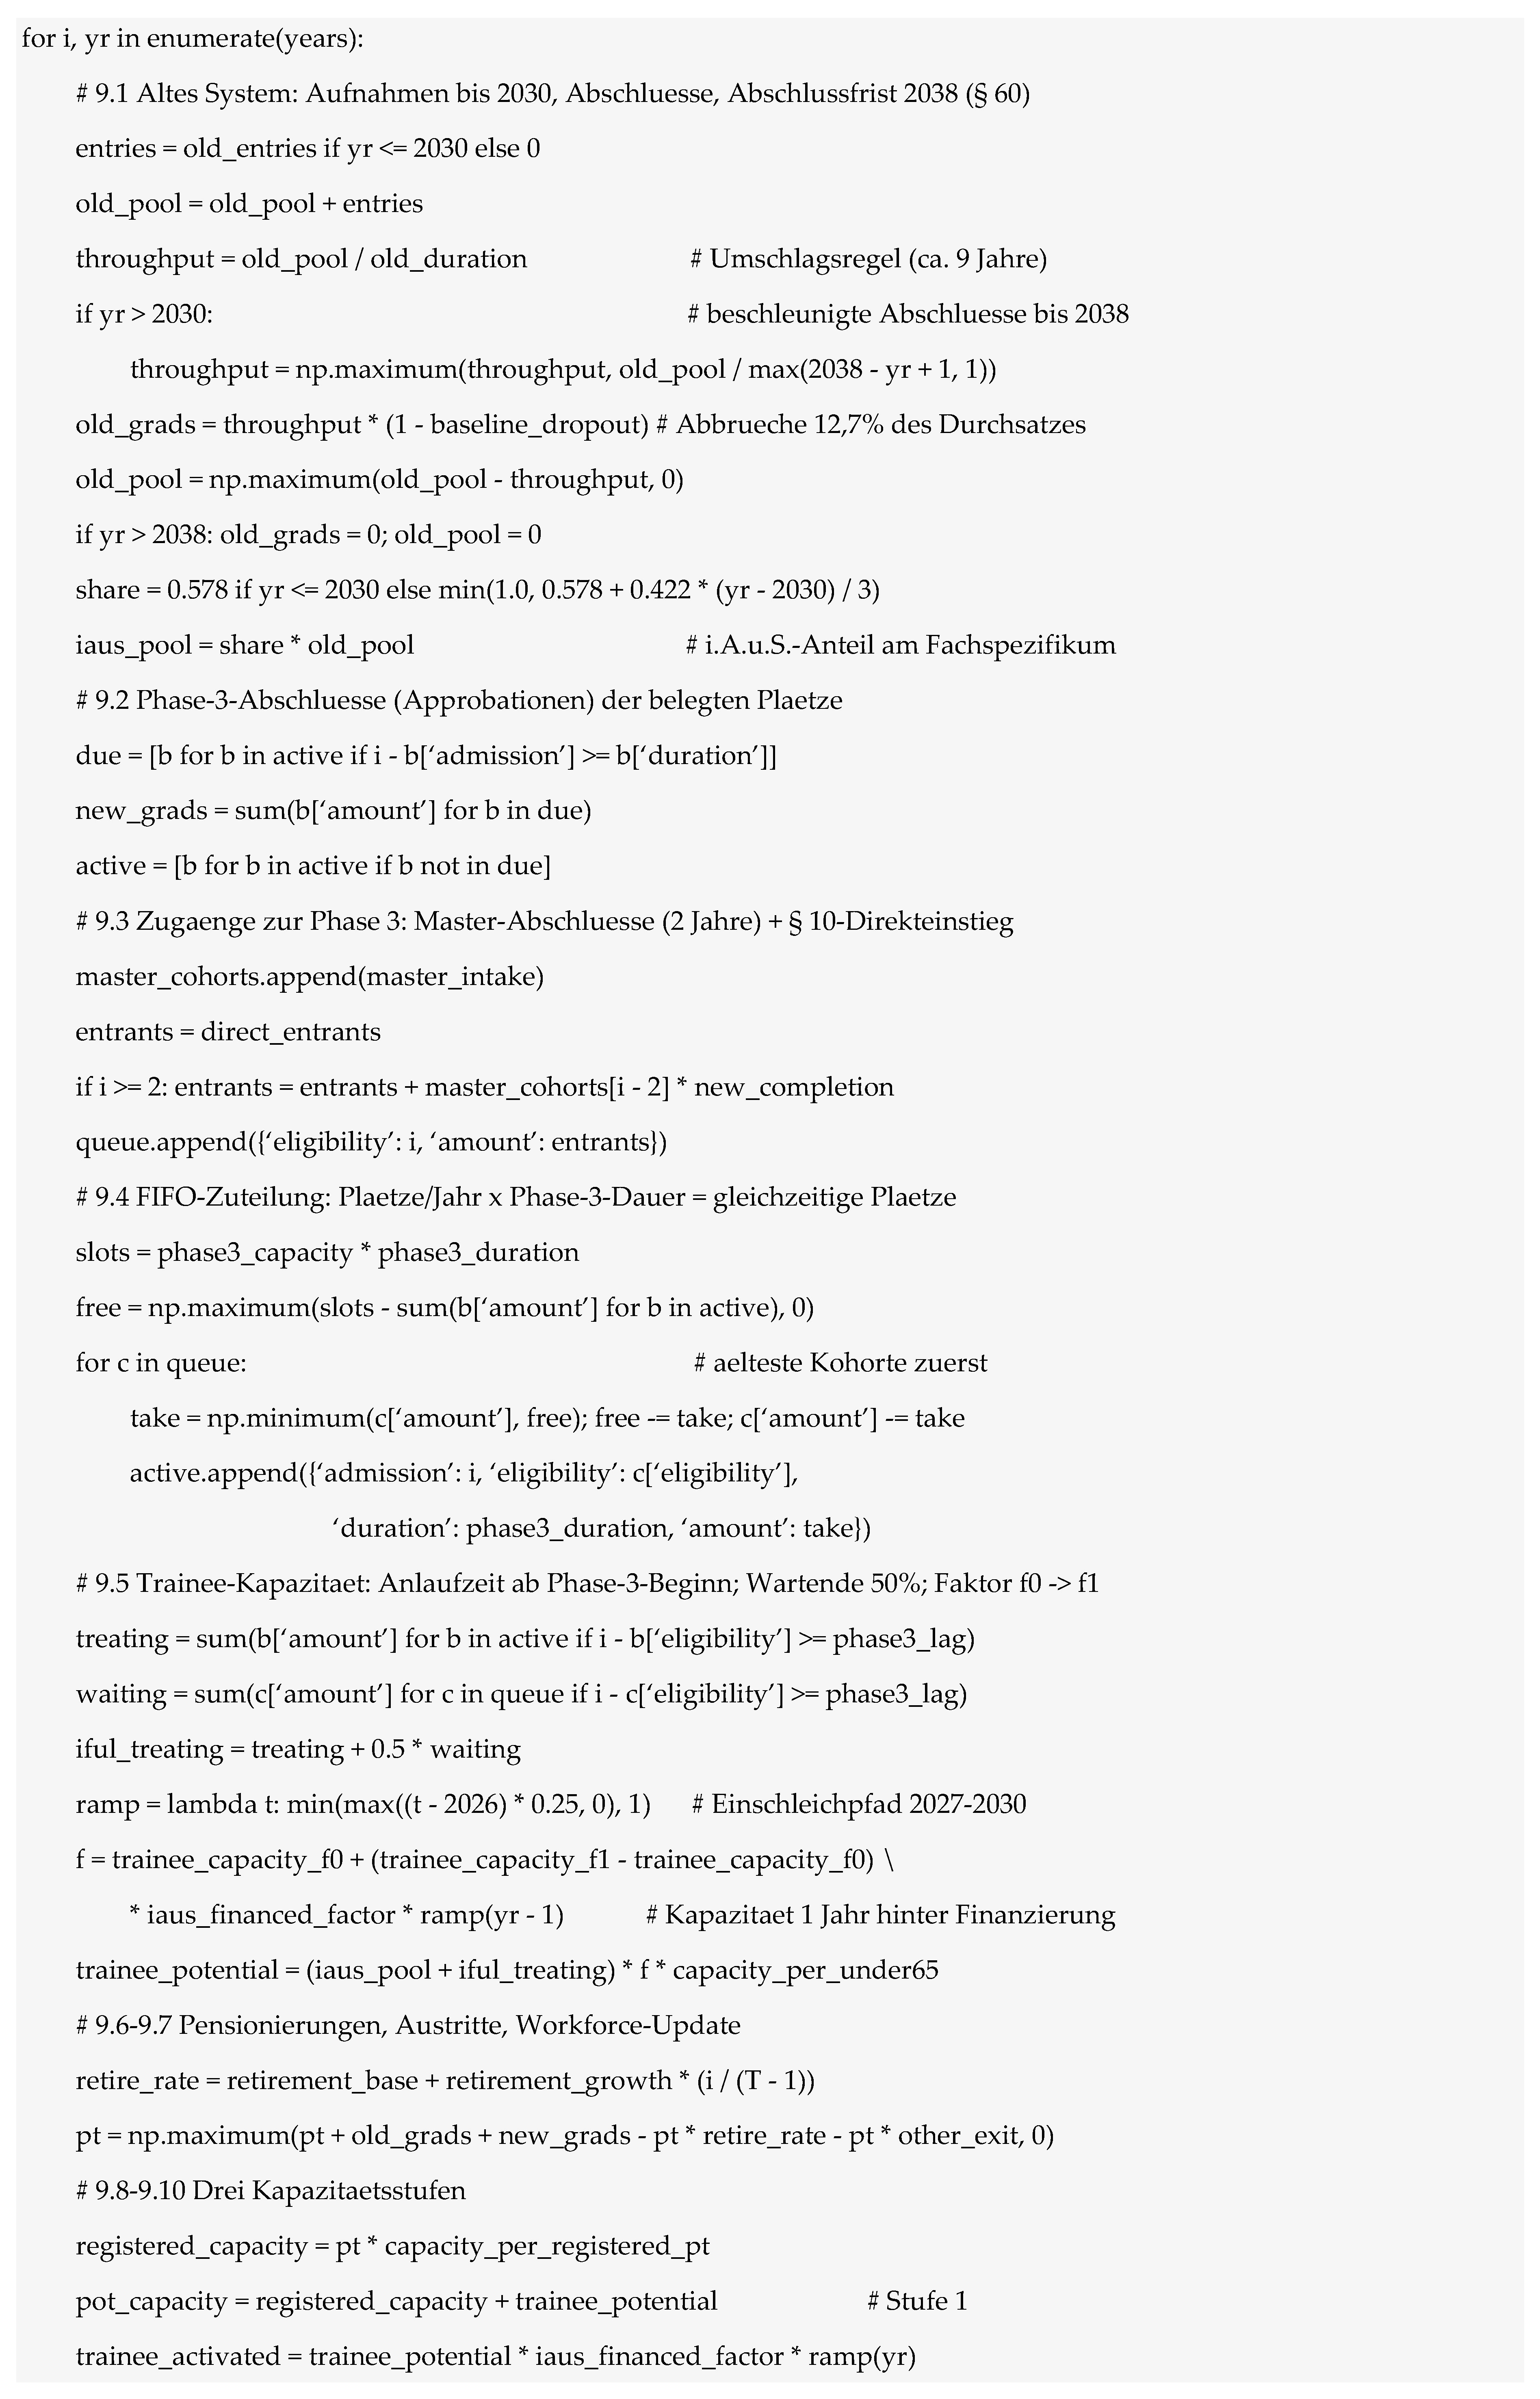
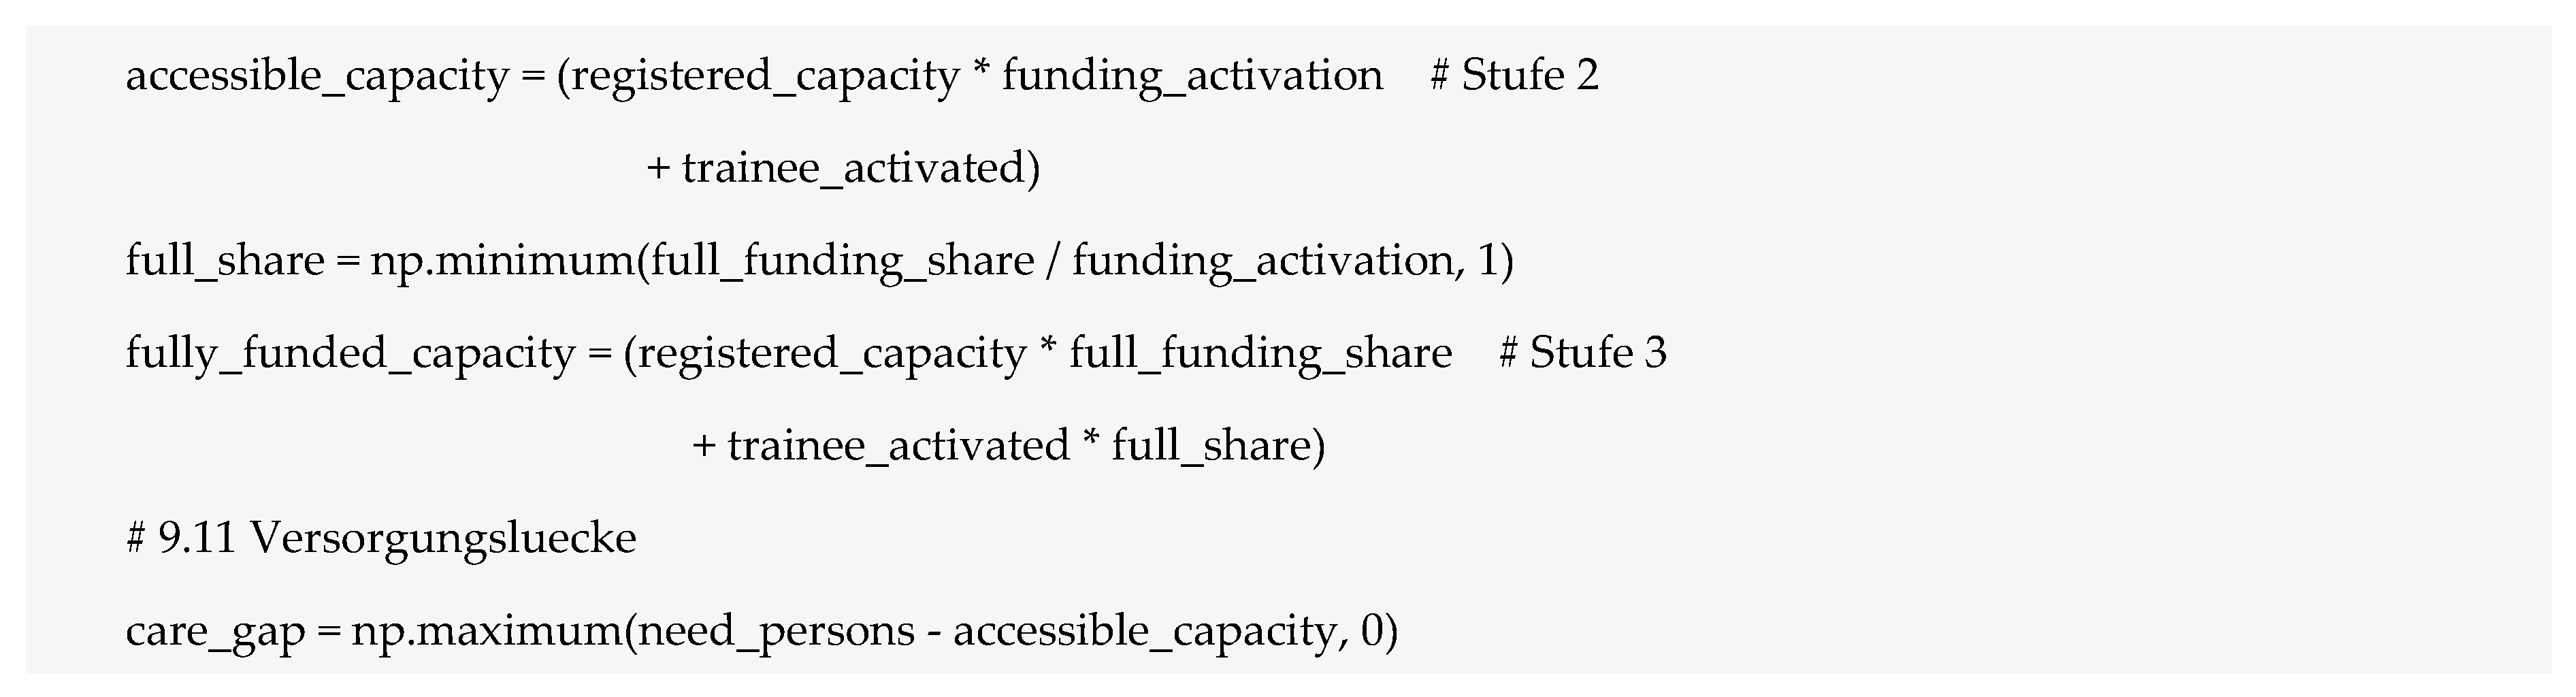
Appendix B.3. Follow-On Cost Calculation (Code S1)
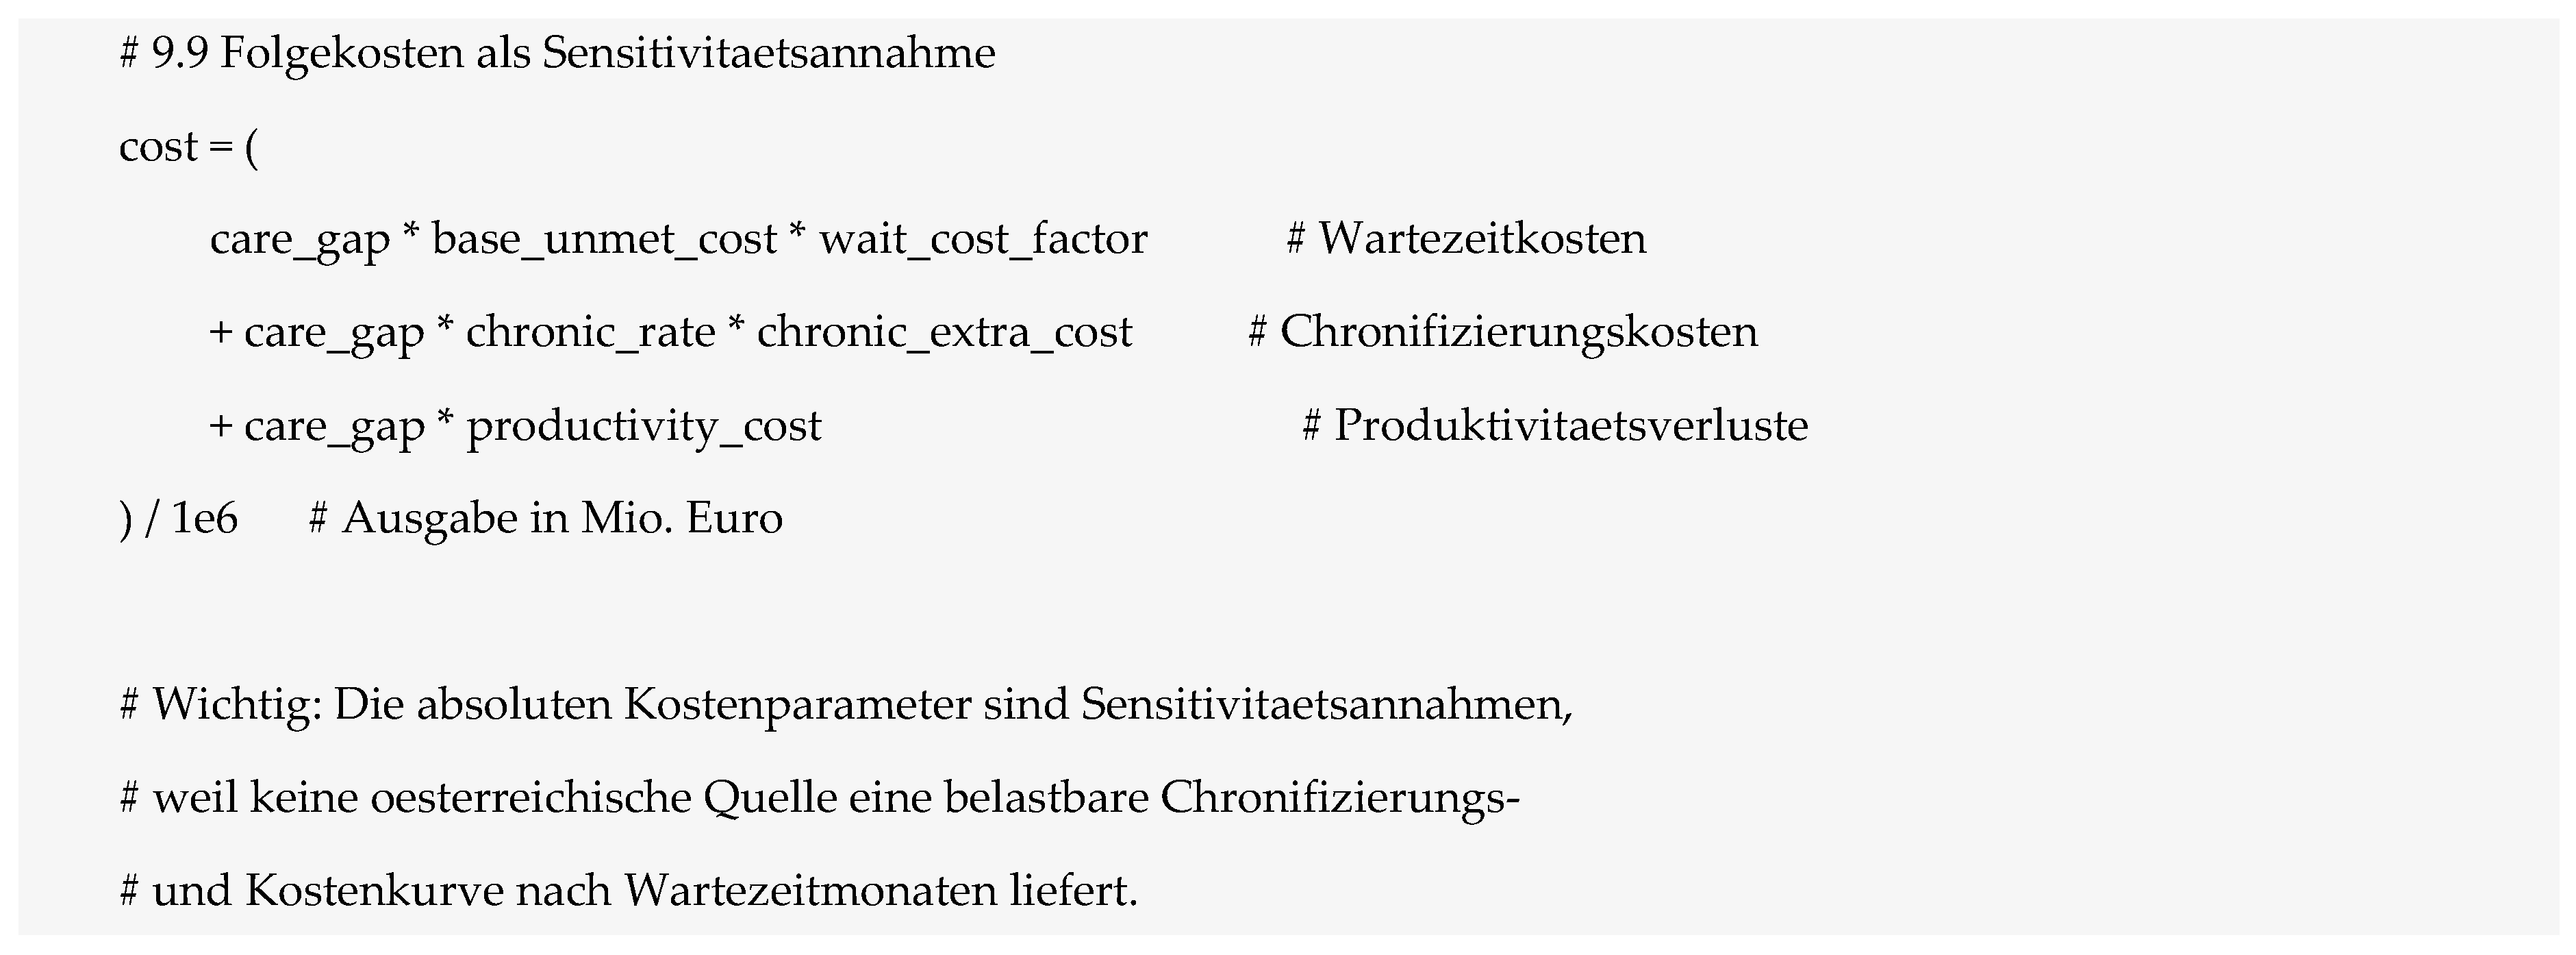
Appendix B.4. Capacity Scaling of the Robustness Analysis (Code S2)
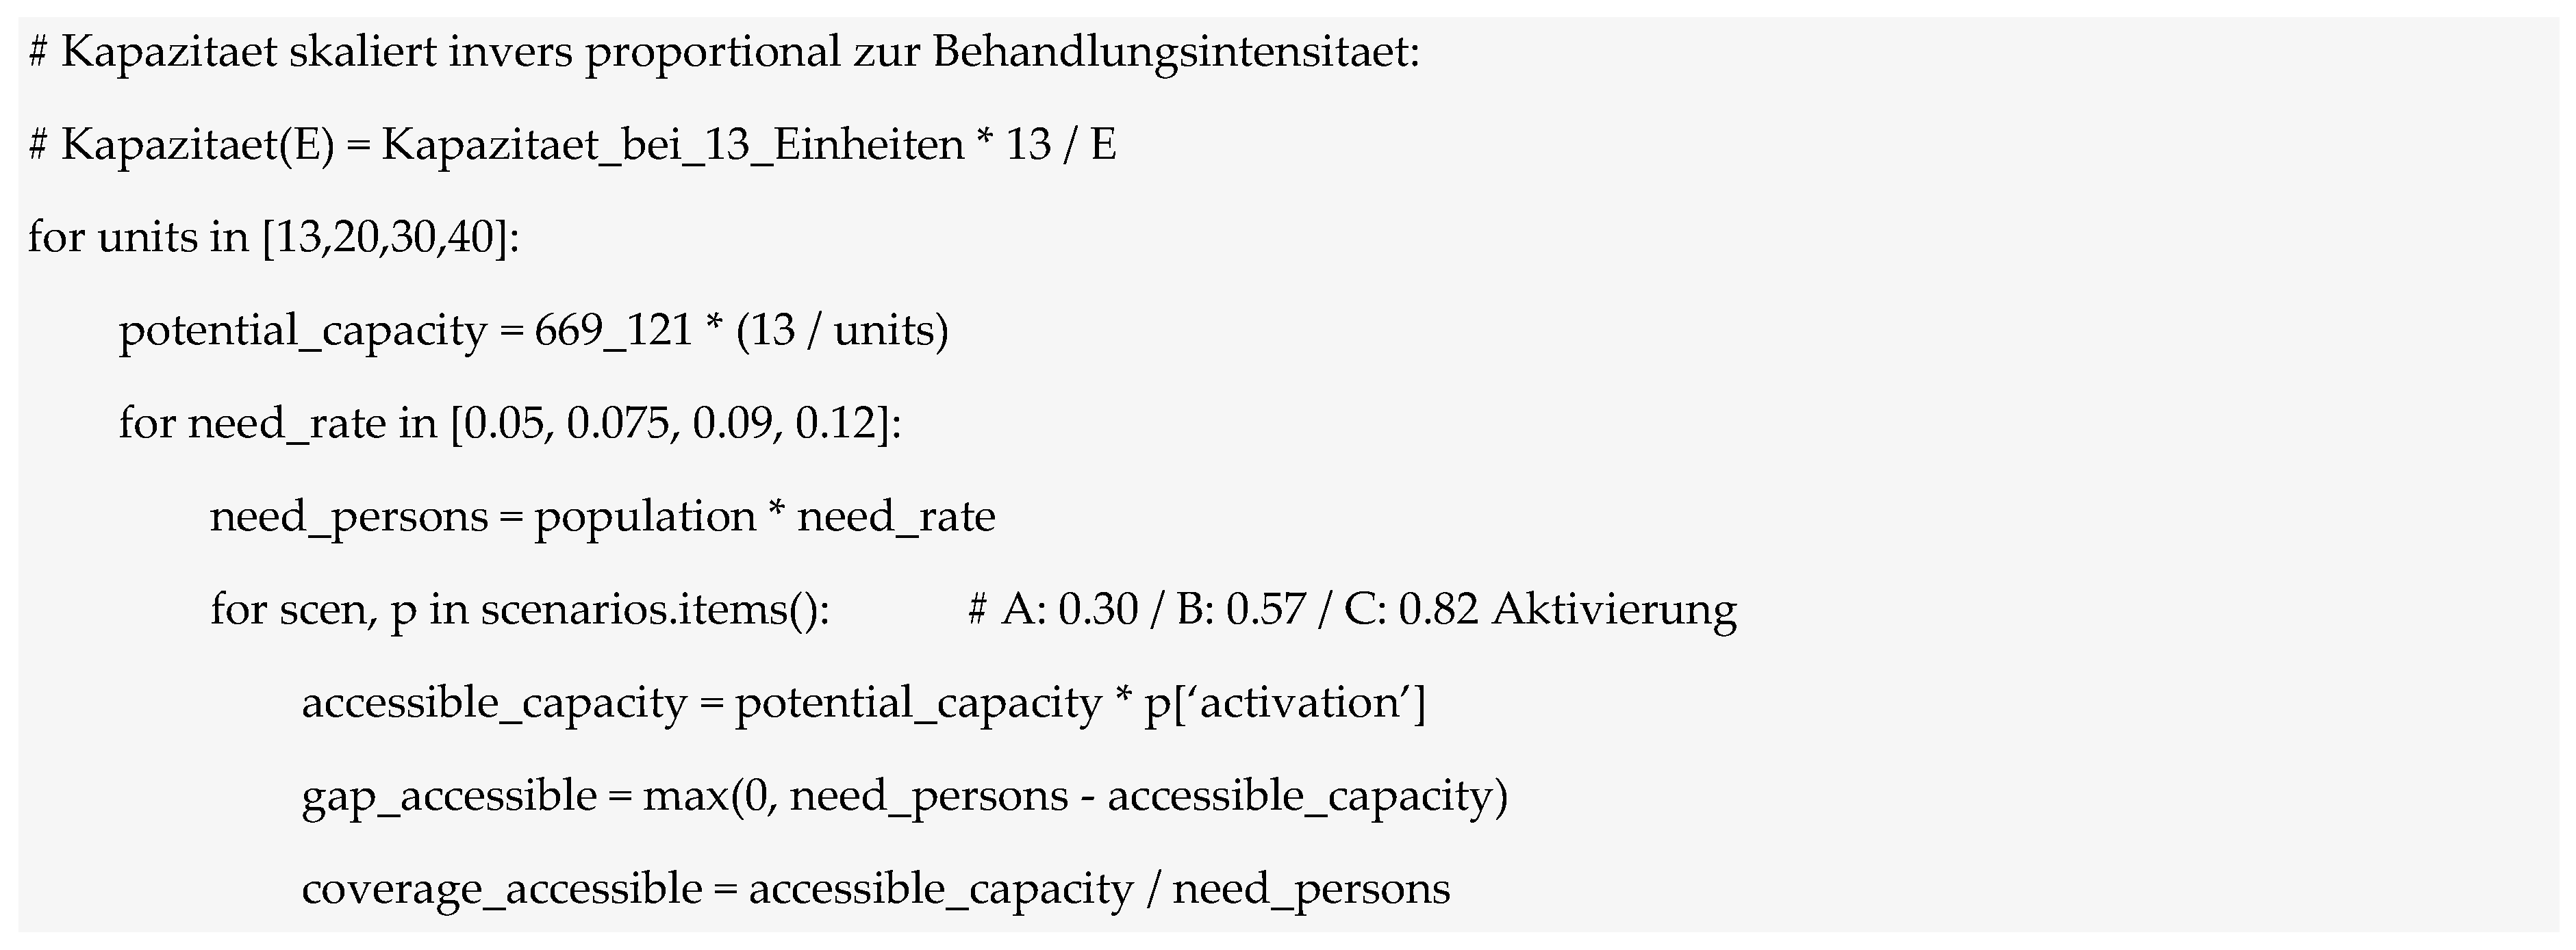
The Monte-Carlo component of the robustness analysis (20,000 iterations per cell) varies the activation and full-funding shares as triangular distributions around the scenario modes (A: 0.25/0.30/0.42; B: 0.45/0.57/0.72; C: 0.68/0.82/0.95) and reports medians with 80% and 95% prediction intervals (Figure 11). The robustness re-calculation anchors the activation modes on the empirically observed 2022 value (0.30 = 199,250/669,121) and on rounded scenario means of the main simulation (0.57; 0.82; Table 5 reports 33%/58%/82% as ratios of the 2040 medians), whereas the main model draws from the modes documented in Table A3 (0.32; 0.58; 0.82); the resulting differences in coverage are on the order of one to two percentage points and do not affect the scenario ranking.
References
- Psychotherapiegesetz 2024 (PThG 2024): Bundesgesetz über die Ausübung der Psychotherapie. BGBl. I Nr. 49/2024; Republic of Austria: Vienna, Austria, 2024.
- Dinhof, K.; Sagerschnig, S.; Sitz, Y.; Gruber, B.; Grabenhofer-Eggerth, A.; Mikulcik, I. Psychotherapeutische Versorgungssituation in Österreich: Aktuelle Daten zur Inanspruchnahme von Psychotherapie und personellen Verfügbarkeit von Psychotherapeut:innen. Psychother. Forum 2025, 29, 98–103. [CrossRef]
- Gruber, B.; Dinhof, K.; Grabenhofer-Eggerth, A. Psychotherapie als Sozialversicherungsleistung—Inanspruchnahme und Finanzierung (Datenbasis 2022); Gesundheit Österreich GmbH: Vienna, Austria, 2024.
- Riess, G.; Kern, D.; Sagerschnig, S. Versorgungslage und zukünftiger Bedarf im Bereich Psychotherapie. Grobkalkulation; Gesundheit Österreich GmbH: Vienna, Austria, 2023.
- van Dijk, D. A.; Meijer, R. M.; van den Boogaard, Th. M.; Spijker, J.; Ruhé, H. G.; Peeters, F. P. M. L. Worse off by waiting for treatment? The impact of waiting time on clinical course and treatment outcome for depression in routine care. J. Affect. Disord. 2023, 322, 205–211. [CrossRef]
- Catarino, A.; Harper, S.; Malcolm, R.; Stainthorpe, A.; Warren, G.; Margoum, M.; Hooper, J.; Blackwell, A. D.; Welchman, A. E. Economic evaluation of 27,540 patients with mood and anxiety disorders and the importance of waiting time and clinical effectiveness in mental healthcare. Nat. Ment. Health 2023, 1, 667–678. [CrossRef]
- Evans-Lacko, S.; Knapp, M. Global patterns of workplace productivity for people with depression: Absenteeism and presenteeism costs across eight diverse countries. Soc. Psychiatry Psychiatr. Epidemiol. 2016, 51, 1525–1537. [CrossRef]
- König, H.; König, H.-H.; Gallinat, J.; Lambert, M.; Karow, A.; Peth, J.; Schulz, H.; Konnopka, A. Excess costs of mental disorders by level of severity. Soc. Psychiatry Psychiatr. Epidemiol. 2023, 58, 973–985. [CrossRef]
- Boeckle, M.; Haid, B.; Schimböck, W.; Gstrein, I.; Pall, B.; Pokorny, C.; Zimmermann, D.; Birkner, A.; Löffler-Stastka, H. Psychotherapeutische Versorgung in Österreich—Herausforderungen, Chancen und Zukunftsperspektiven. Psychother. Forum 2025, 29, 104–110. [CrossRef]
- Robinson, L.; Delgadillo, J.; Kellett, S. The dose-response effect in routinely delivered psychological therapies: A systematic review. Psychother. Res. 2020, 30, 79–96. [CrossRef]
- Dachverband der Sozialversicherungsträger. Statistisches Handbuch der österreichischen Sozialversicherung 2023, Chapter 2.1: Anspruchsberechtigte bzw. Versicherte in der Krankenversicherung; Dachverband der Sozialversicherungsträger: Vienna, Austria, 2023.
- Psychotherapie-Ausbildungs-, Approbationsprüfungs- und Qualitätssicherungs-Verordnung (PTh-AAQV 2024). BGBl. II Nr. 292/2024; Republic of Austria: Vienna, Austria, 2024.
- Sagerschnig, S.; Mikulcik, I. Ausbildungsstatistik 2023. Daten zum Ausbildungsgeschehen in Psychotherapie, Klinischer Psychologie und Gesundheitspsychologie in Österreich; Gesundheit Österreich: Vienna, Austria, 2024.
- Sagerschnig, S.; Mikulcik, I.; Sitz, Y. Ausbildungsstatistik 2025. Daten zum Ausbildungsgeschehen in Psychotherapie, Klinischer Psychologie, Gesundheitspsychologie und Musiktherapie in Österreich; Gesundheit Österreich: Vienna, Austria, 2025.
- Mayrhuber, C.; Bittschi, B. Fehlzeitenreport 2026: Krankheits- und unfallbedingte Fehlzeiten in Österreich. Struktur der Krankenstände des Muskel-Skelett-Systems und des Bindegewebes; Österreichisches Institut für Wirtschaftsforschung (WIFO): Vienna, Austria, 2026. Available online: https://www.wifo.ac.at/publication/pid/70527382 (accessed on 22 August 2026).
- Seitz, T.; Stastka, K.; Schiffinger, M.; Turk, B.R.; Löffler-Stastka, H. Interprofessional care improves health-related well-being and reduces medical costs for chronic pain patients. Bull. Menn. Clin. 2019, 83, 105–127. [CrossRef]
- Leoni, T.; Biffl, G.; Guger, A. Fehlzeitenreport 2007: Krankheits- und unfallbedingte Fehlzeiten in Österreich; Österreichisches Institut für Wirtschaftsforschung (WIFO): Vienna, Austria, 2008.
- OECD; European Commission. Health at a Glance: Europe 2018—State of Health in the EU Cycle; OECD Publishing: Paris, France, 2018. [CrossRef]
- Singer, S.; Maier, L.; Paserat, A.; Lang, K.; Wirp, B.; Kobes, J.; Porsch, U.; Mittag, M.; Toenges, G.; Engesser, D. Wartezeiten auf einen Psychotherapieplatz vor und nach der Psychotherapiestrukturreform. Psychotherapeut 2022, 67, 176–184. [CrossRef]
- Tuch, A.; Fischer, F. B.; Jörg, R. Monitoring zur Neuregelung der psychologischen Psychotherapie. Zweiter Bericht im Auftrag des Bundesamtes für Gesundheit (BAG); Obsan Bericht 07/2025; Schweizerisches Gesundheitsobservatorium: Neuchâtel, Switzerland, 2025.
- OECD; European Observatory on Health Systems and Policies. Netherlands: Country Health Profile 2023, State of Health in the EU; OECD Publishing: Paris, France, 2023.
- Clark, D. M. Realizing the mass public benefit of evidence-based psychological therapies: The IAPT program. Annu. Rev. Clin. Psychol. 2018, 14, 159–183. [CrossRef]
- Bundesministerium für Bildung, Wissenschaft und Forschung (BMBWF). Der Gesamtösterreichische Universitätsentwicklungsplan 2025–2030; BMBWF: Vienna, Austria, 2022 (updated October 2023).
- Bundesministerium für Frauen, Wissenschaft und Forschung (BMFWF). Der Gesamtösterreichische Universitätsentwicklungsplan 2028–2033; BMFWF: Vienna, Austria, 2025.
Figure 2.
Cumulative societal follow-on costs 2026–2040 with 80% and 95% uncertainty intervals, calibrated to the FTE model. Source: authors’ Monte-Carlo simulation (n = 30,000).
Figure 2.
Cumulative societal follow-on costs 2026–2040 with 80% and 95% uncertainty intervals, calibrated to the FTE model. Source: authors’ Monte-Carlo simulation (n = 30,000).
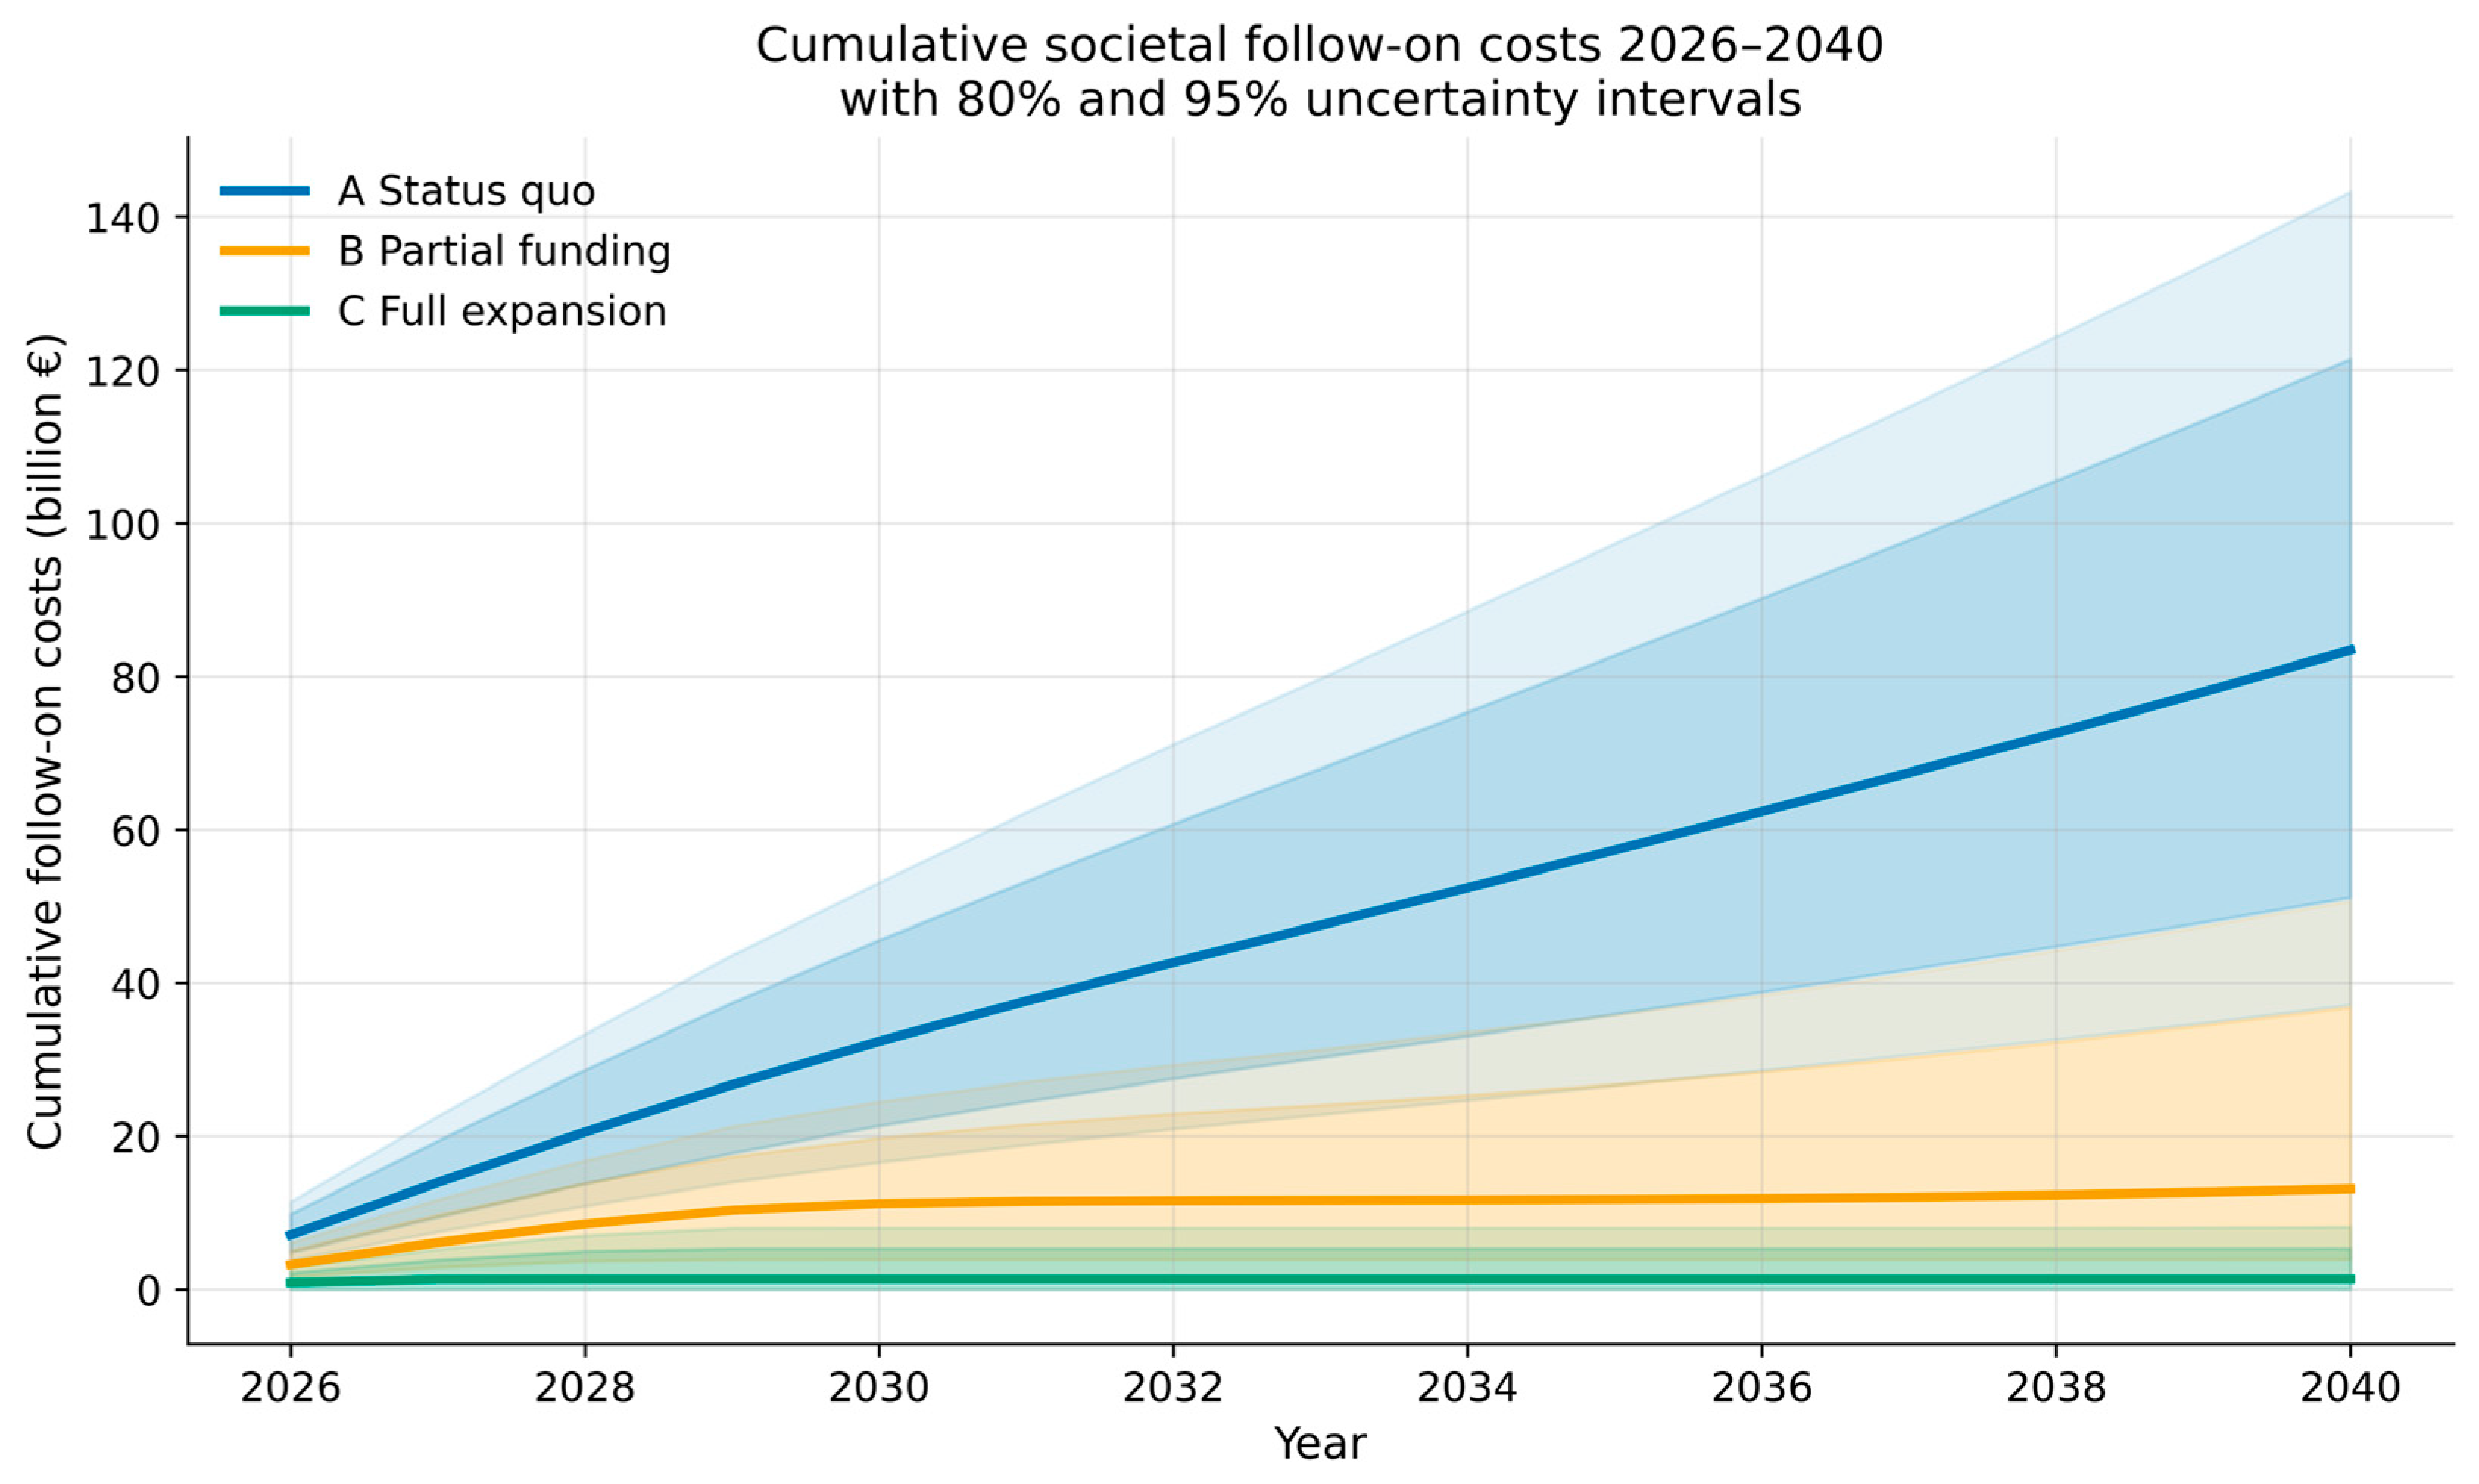
Figure 3.
Reform-cohort dynamics 2026–2040 by scenario (medians): completions of the old and new system and retirements/exits (top row); stocks of supervised trainees in the old system, in phase-3 training places and waiting for a place (bottom row). Dotted line: end of the old pathway (30 September 2038). Source: authors’ simulation.
Figure 3.
Reform-cohort dynamics 2026–2040 by scenario (medians): completions of the old and new system and retirements/exits (top row); stocks of supervised trainees in the old system, in phase-3 training places and waiting for a place (bottom row). Dotted line: end of the old pathway (30 September 2038). Source: authors’ simulation.
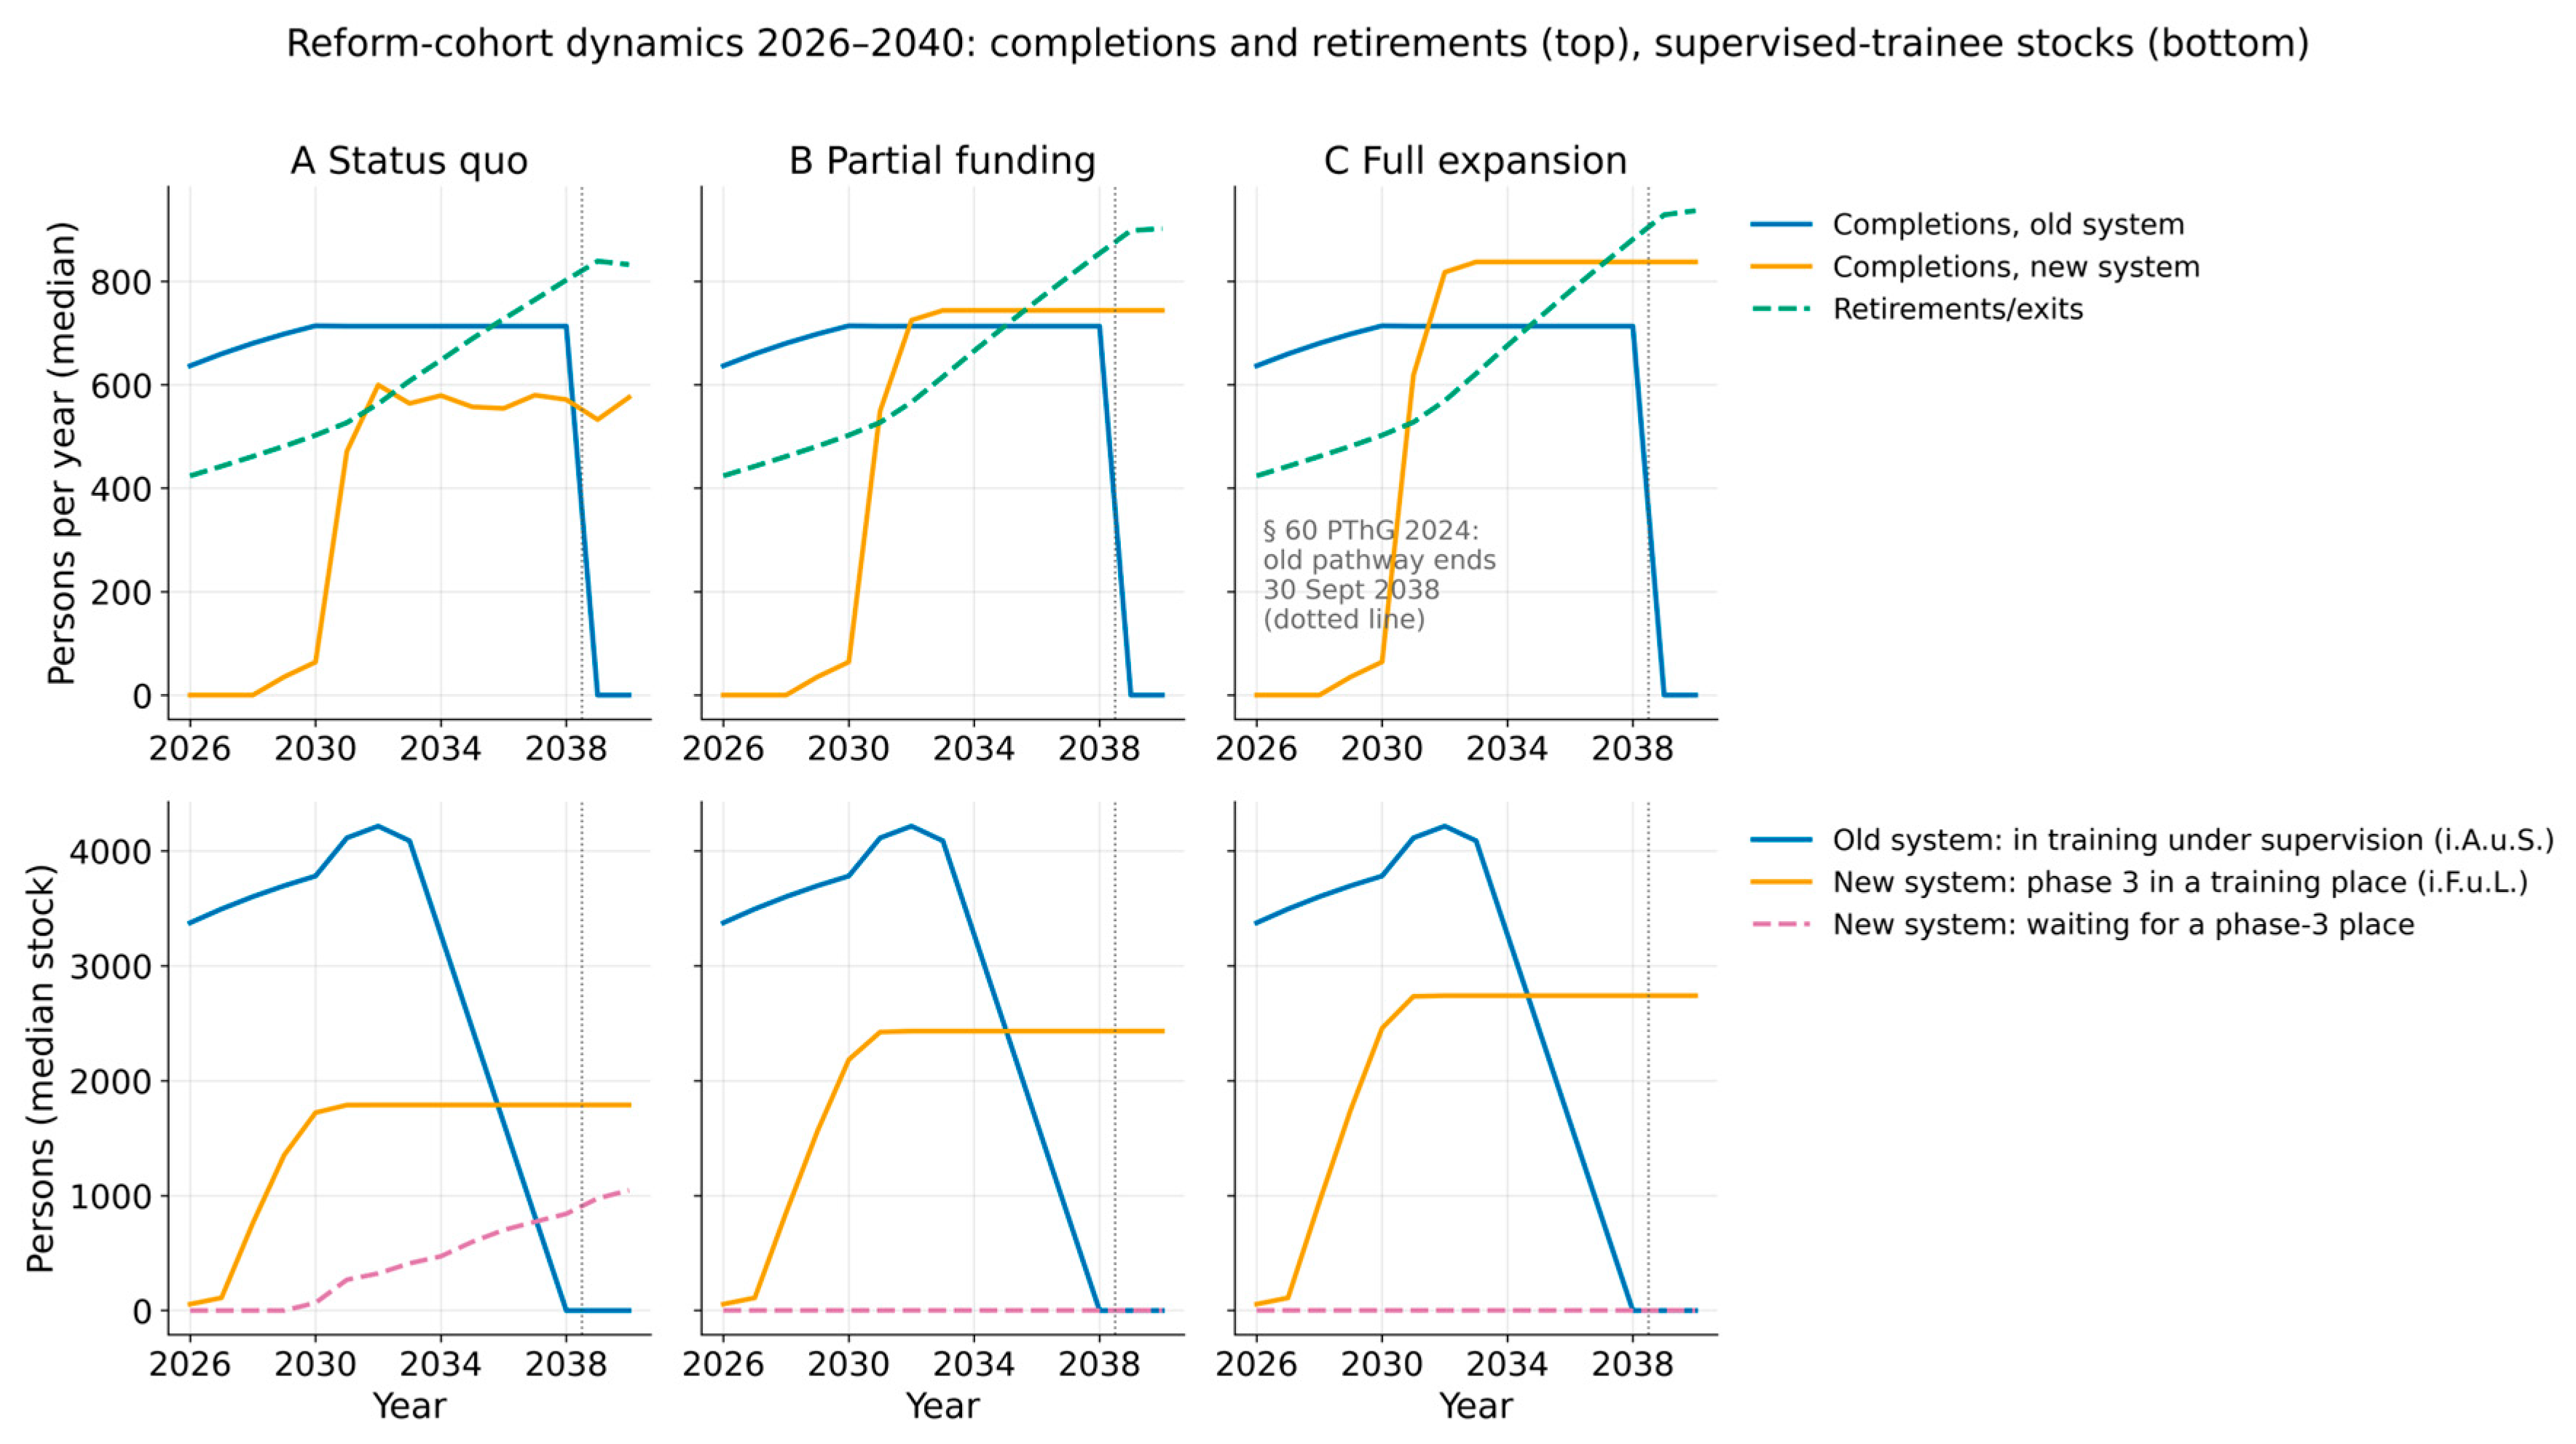
Figure 4.
Annual care gap 2026–2040: need minus accessible capacity, with 95% uncertainty intervals. Source: authors’ simulation.
Figure 4.
Annual care gap 2026–2040: need minus accessible capacity, with 95% uncertainty intervals. Source: authors’ simulation.
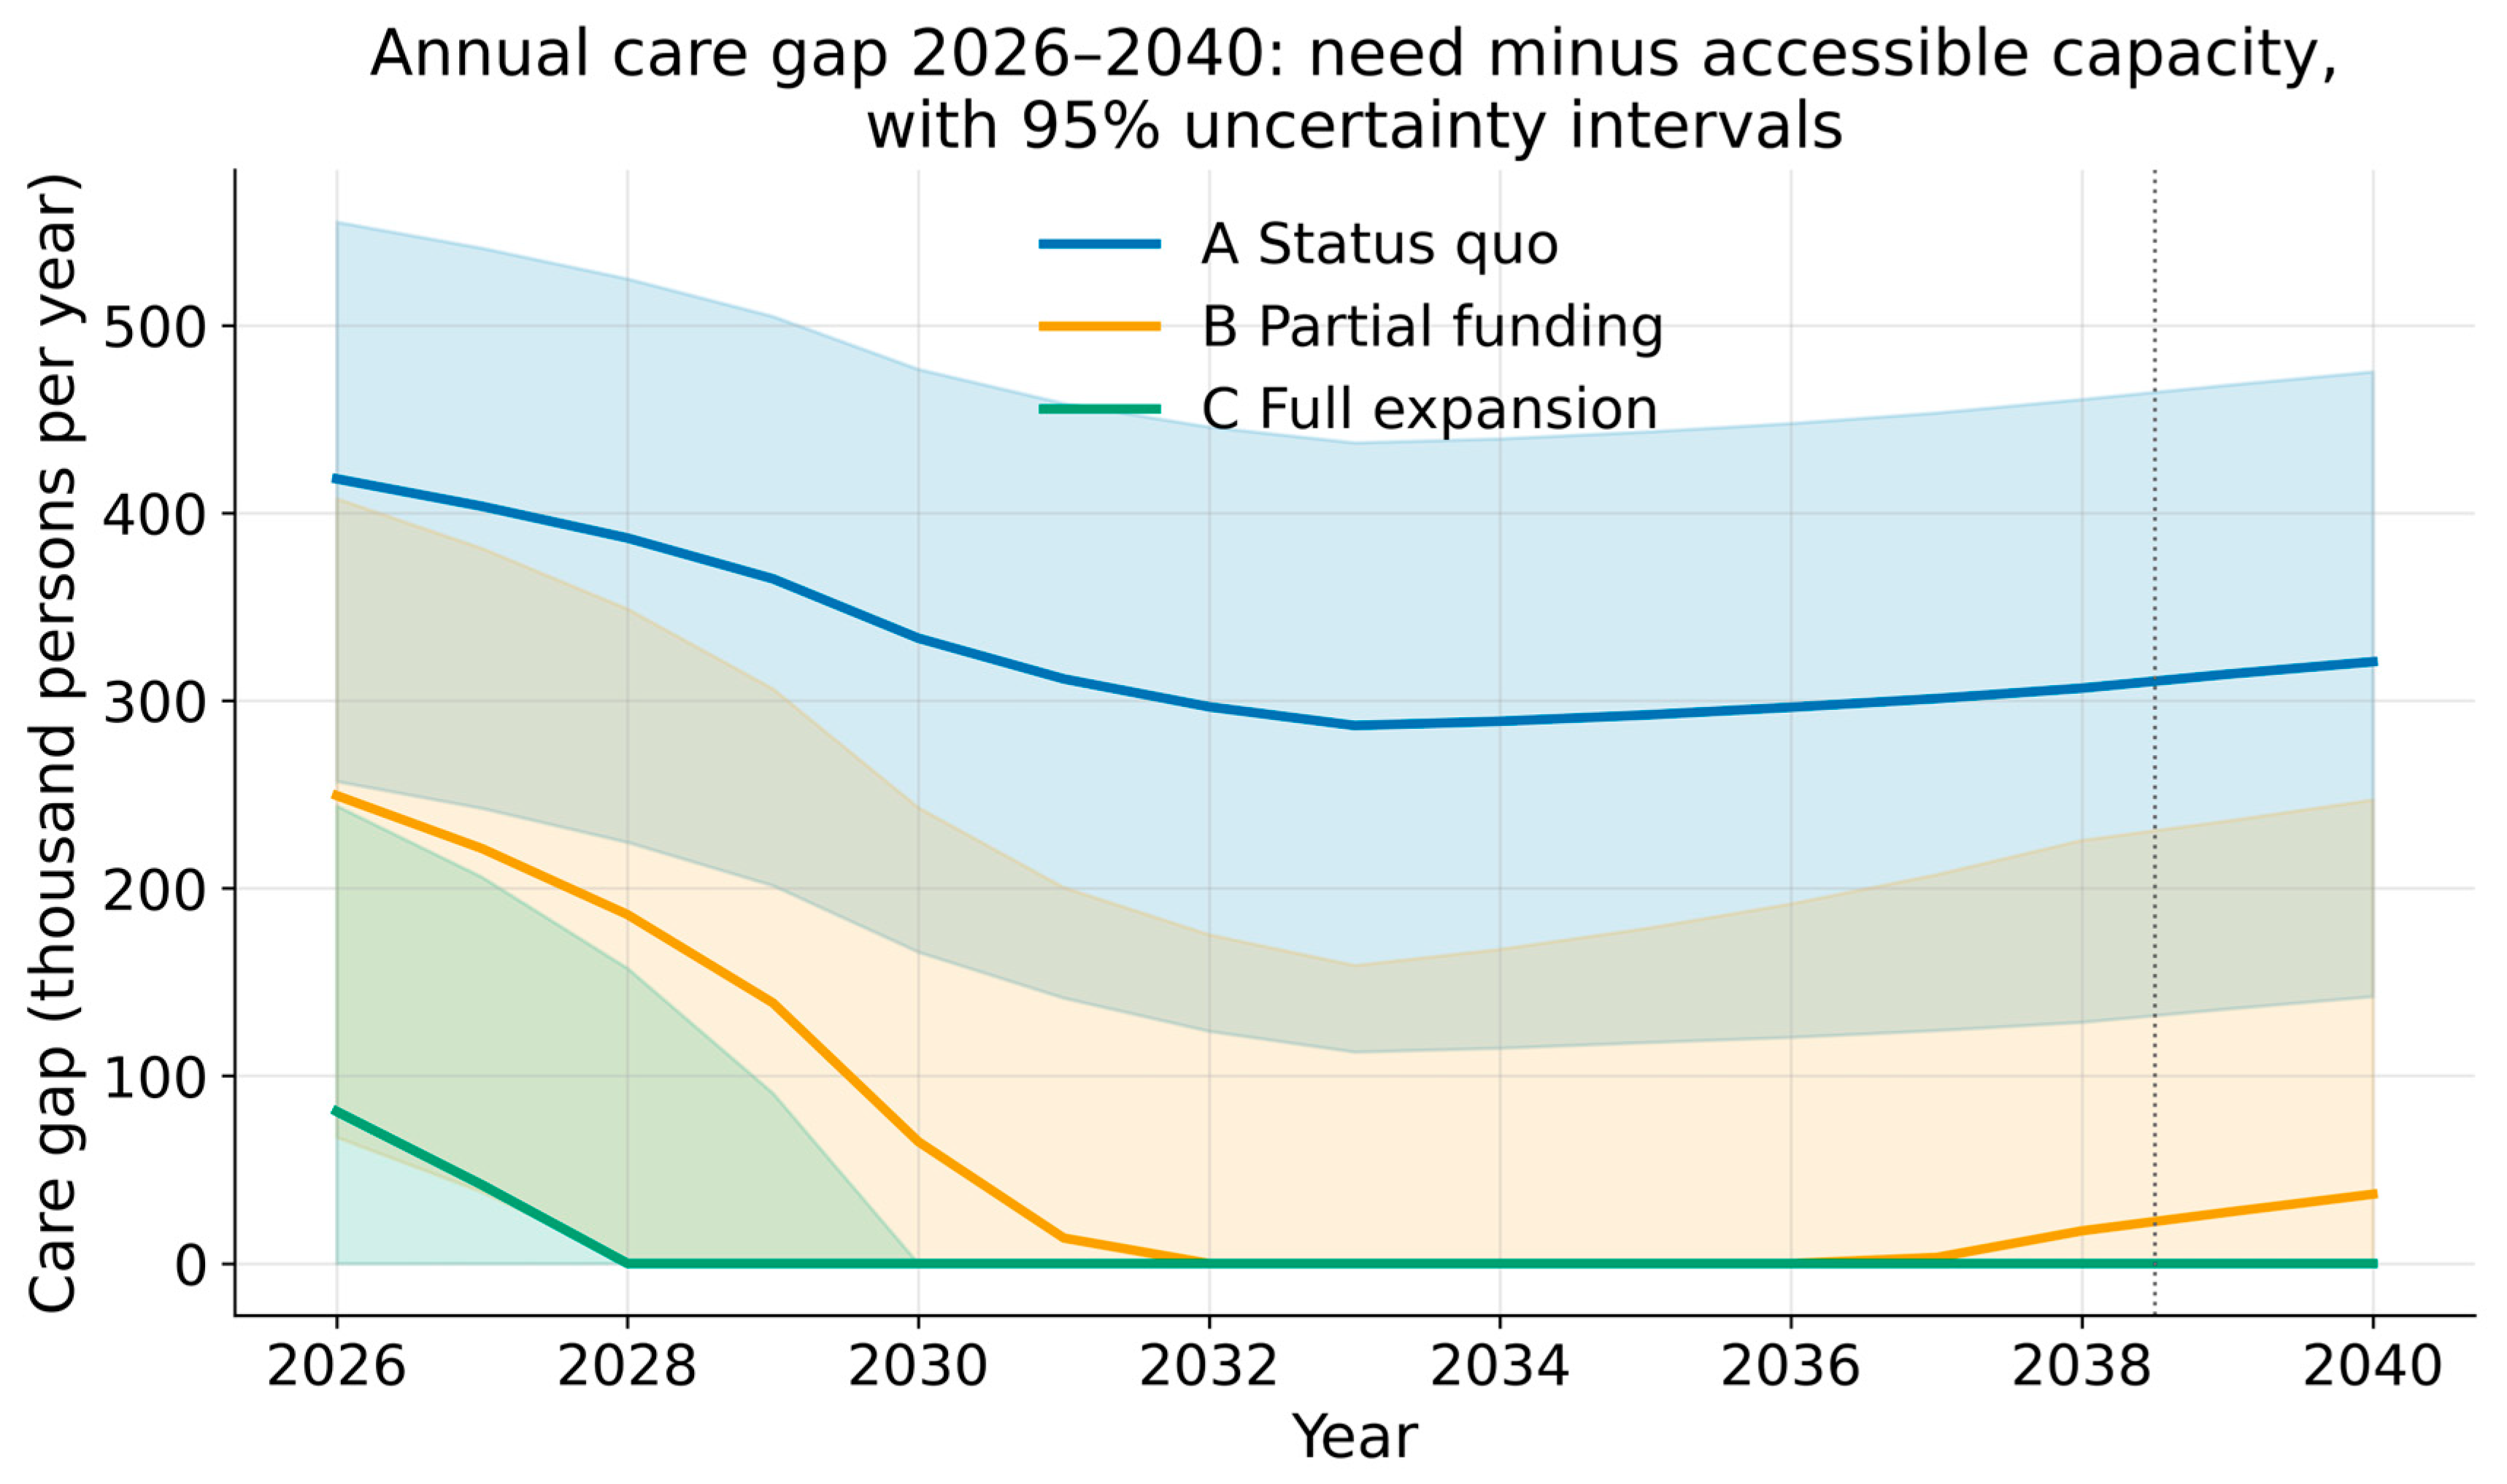
Figure 5.
Sensitivity analysis: within-scenario Spearman rank correlations of the 17 model parameters with cumulative follow-on costs by 2040 (left) and with accessible capacity in 2040 (right); n = 30,000 per scenario. Source: authors’ simulation.
Figure 5.
Sensitivity analysis: within-scenario Spearman rank correlations of the 17 model parameters with cumulative follow-on costs by 2040 (left) and with accessible capacity in 2040 (right); n = 30,000 per scenario. Source: authors’ simulation.
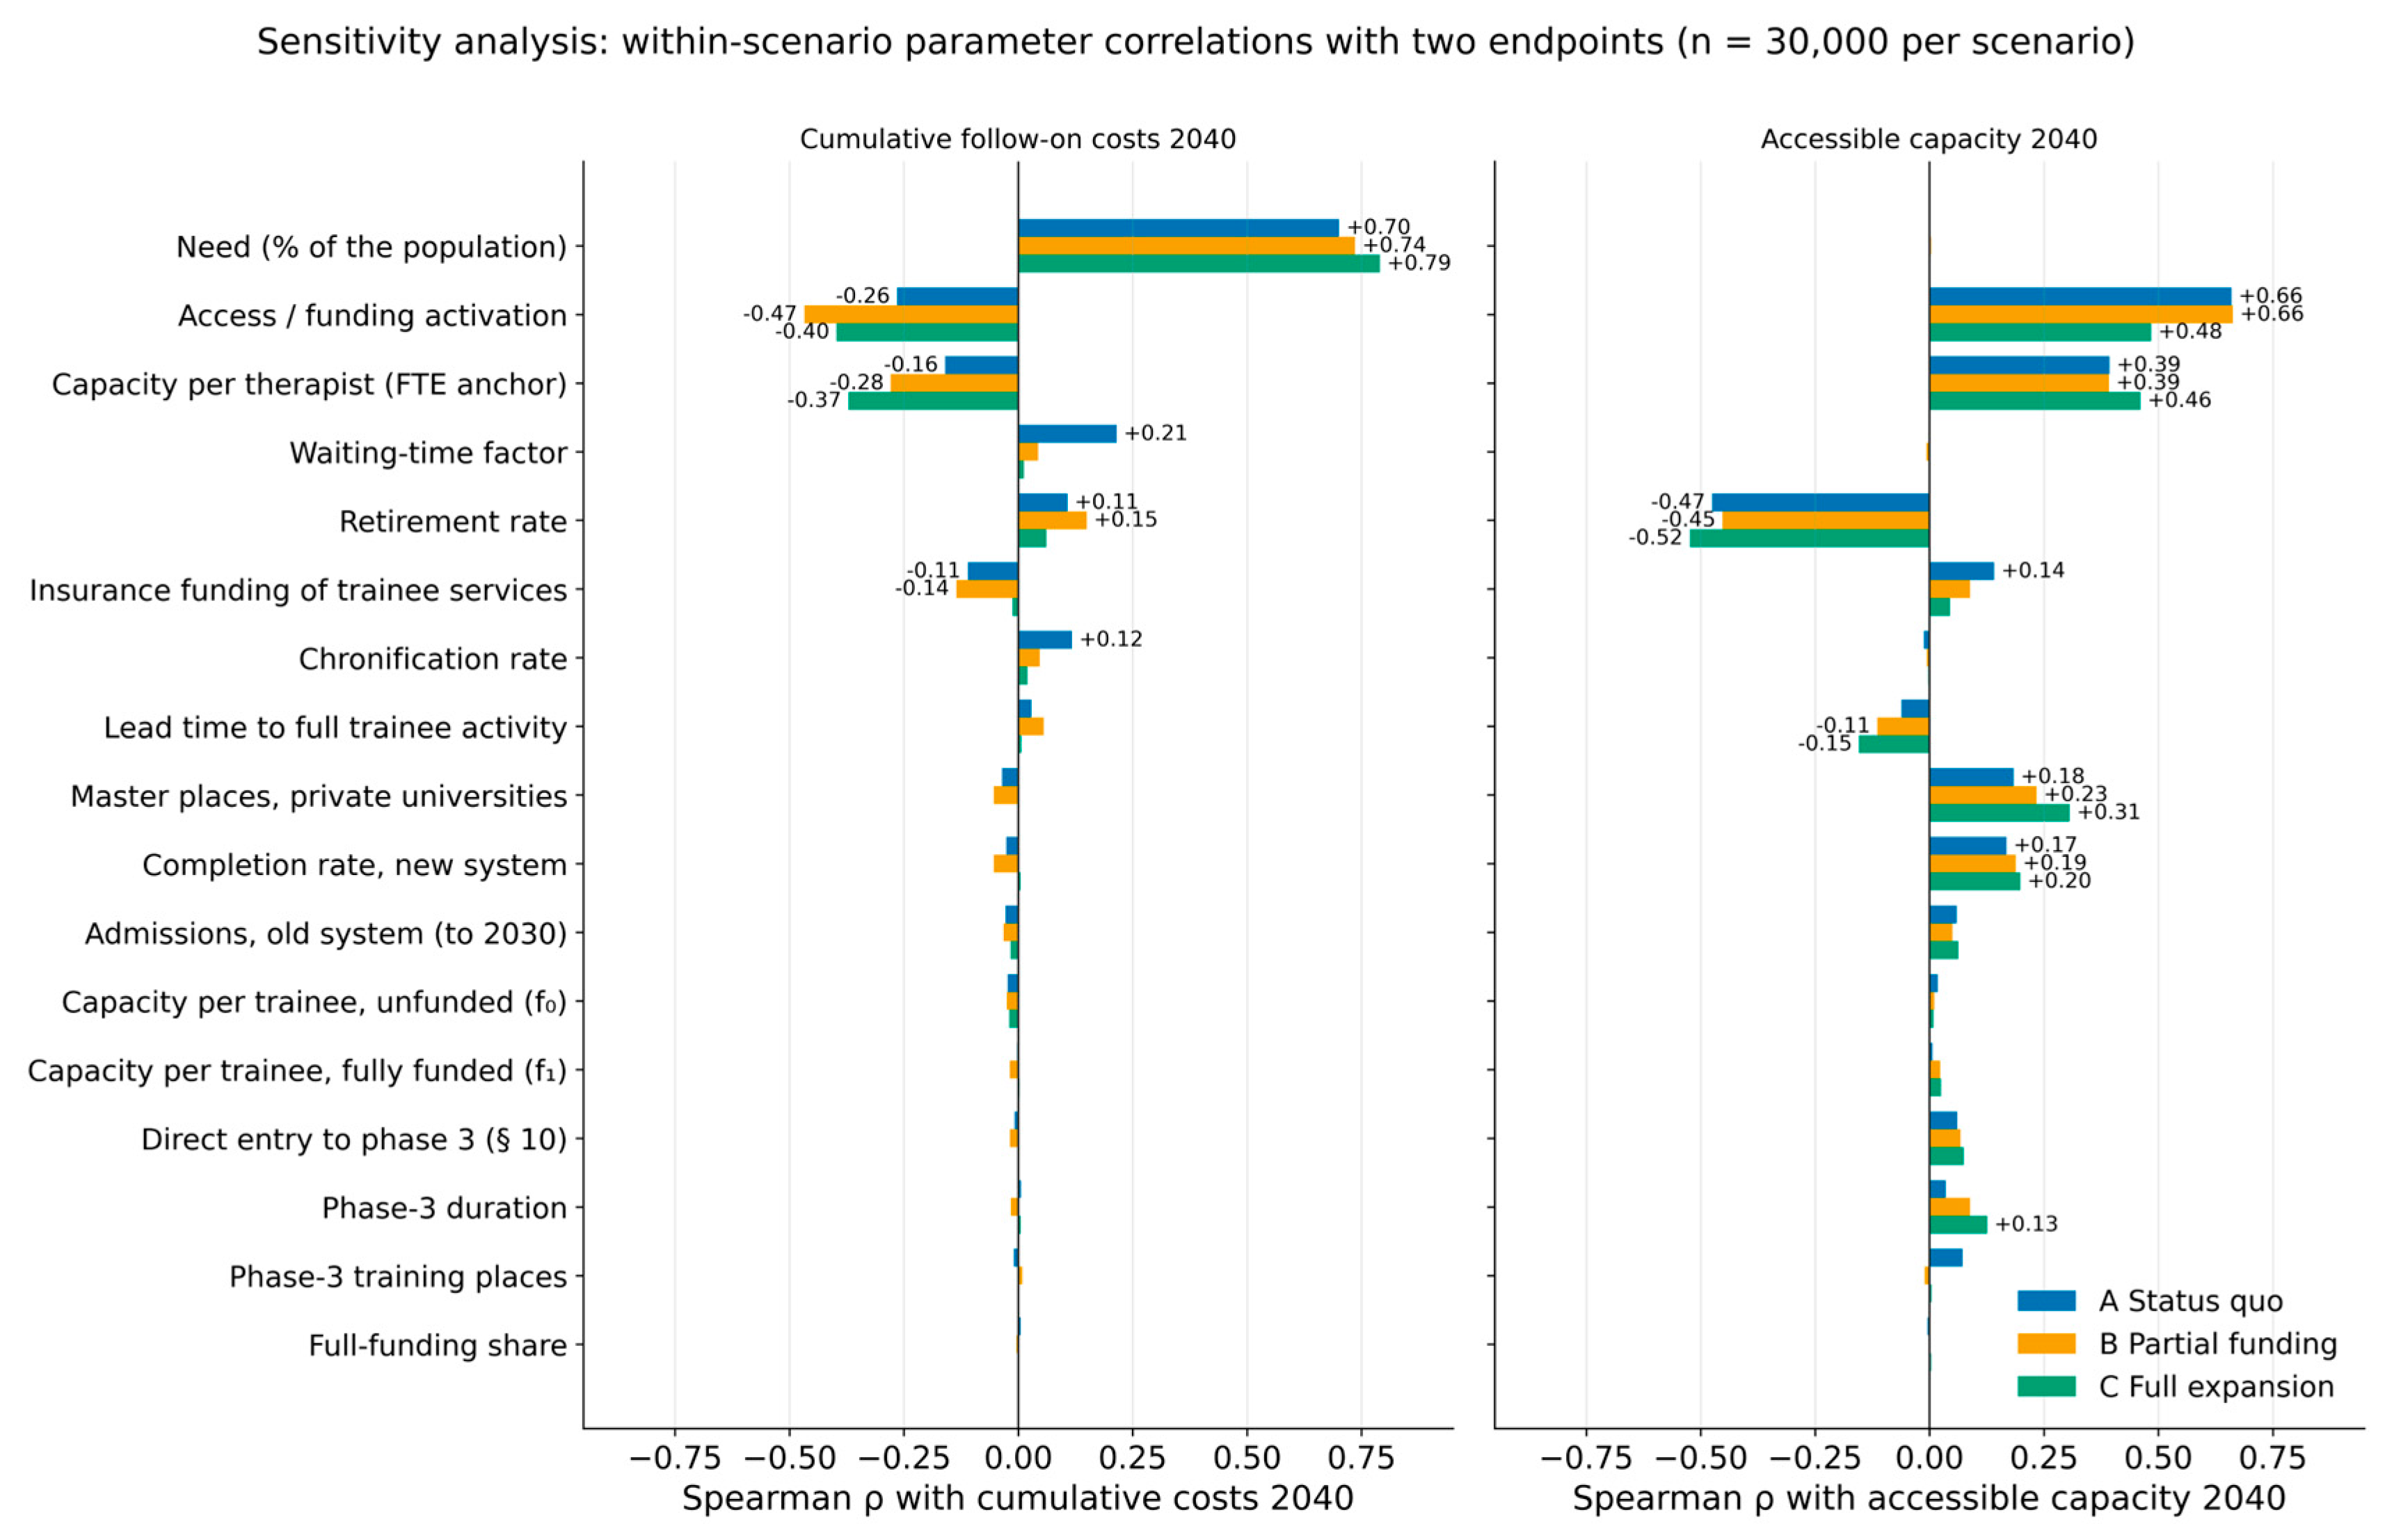
Figure 6.
Coverage of need by accessible care in Scenario A (status quo/underfunding) across the robustness matrix. Source: authors’ simulation.
Figure 6.
Coverage of need by accessible care in Scenario A (status quo/underfunding) across the robustness matrix. Source: authors’ simulation.
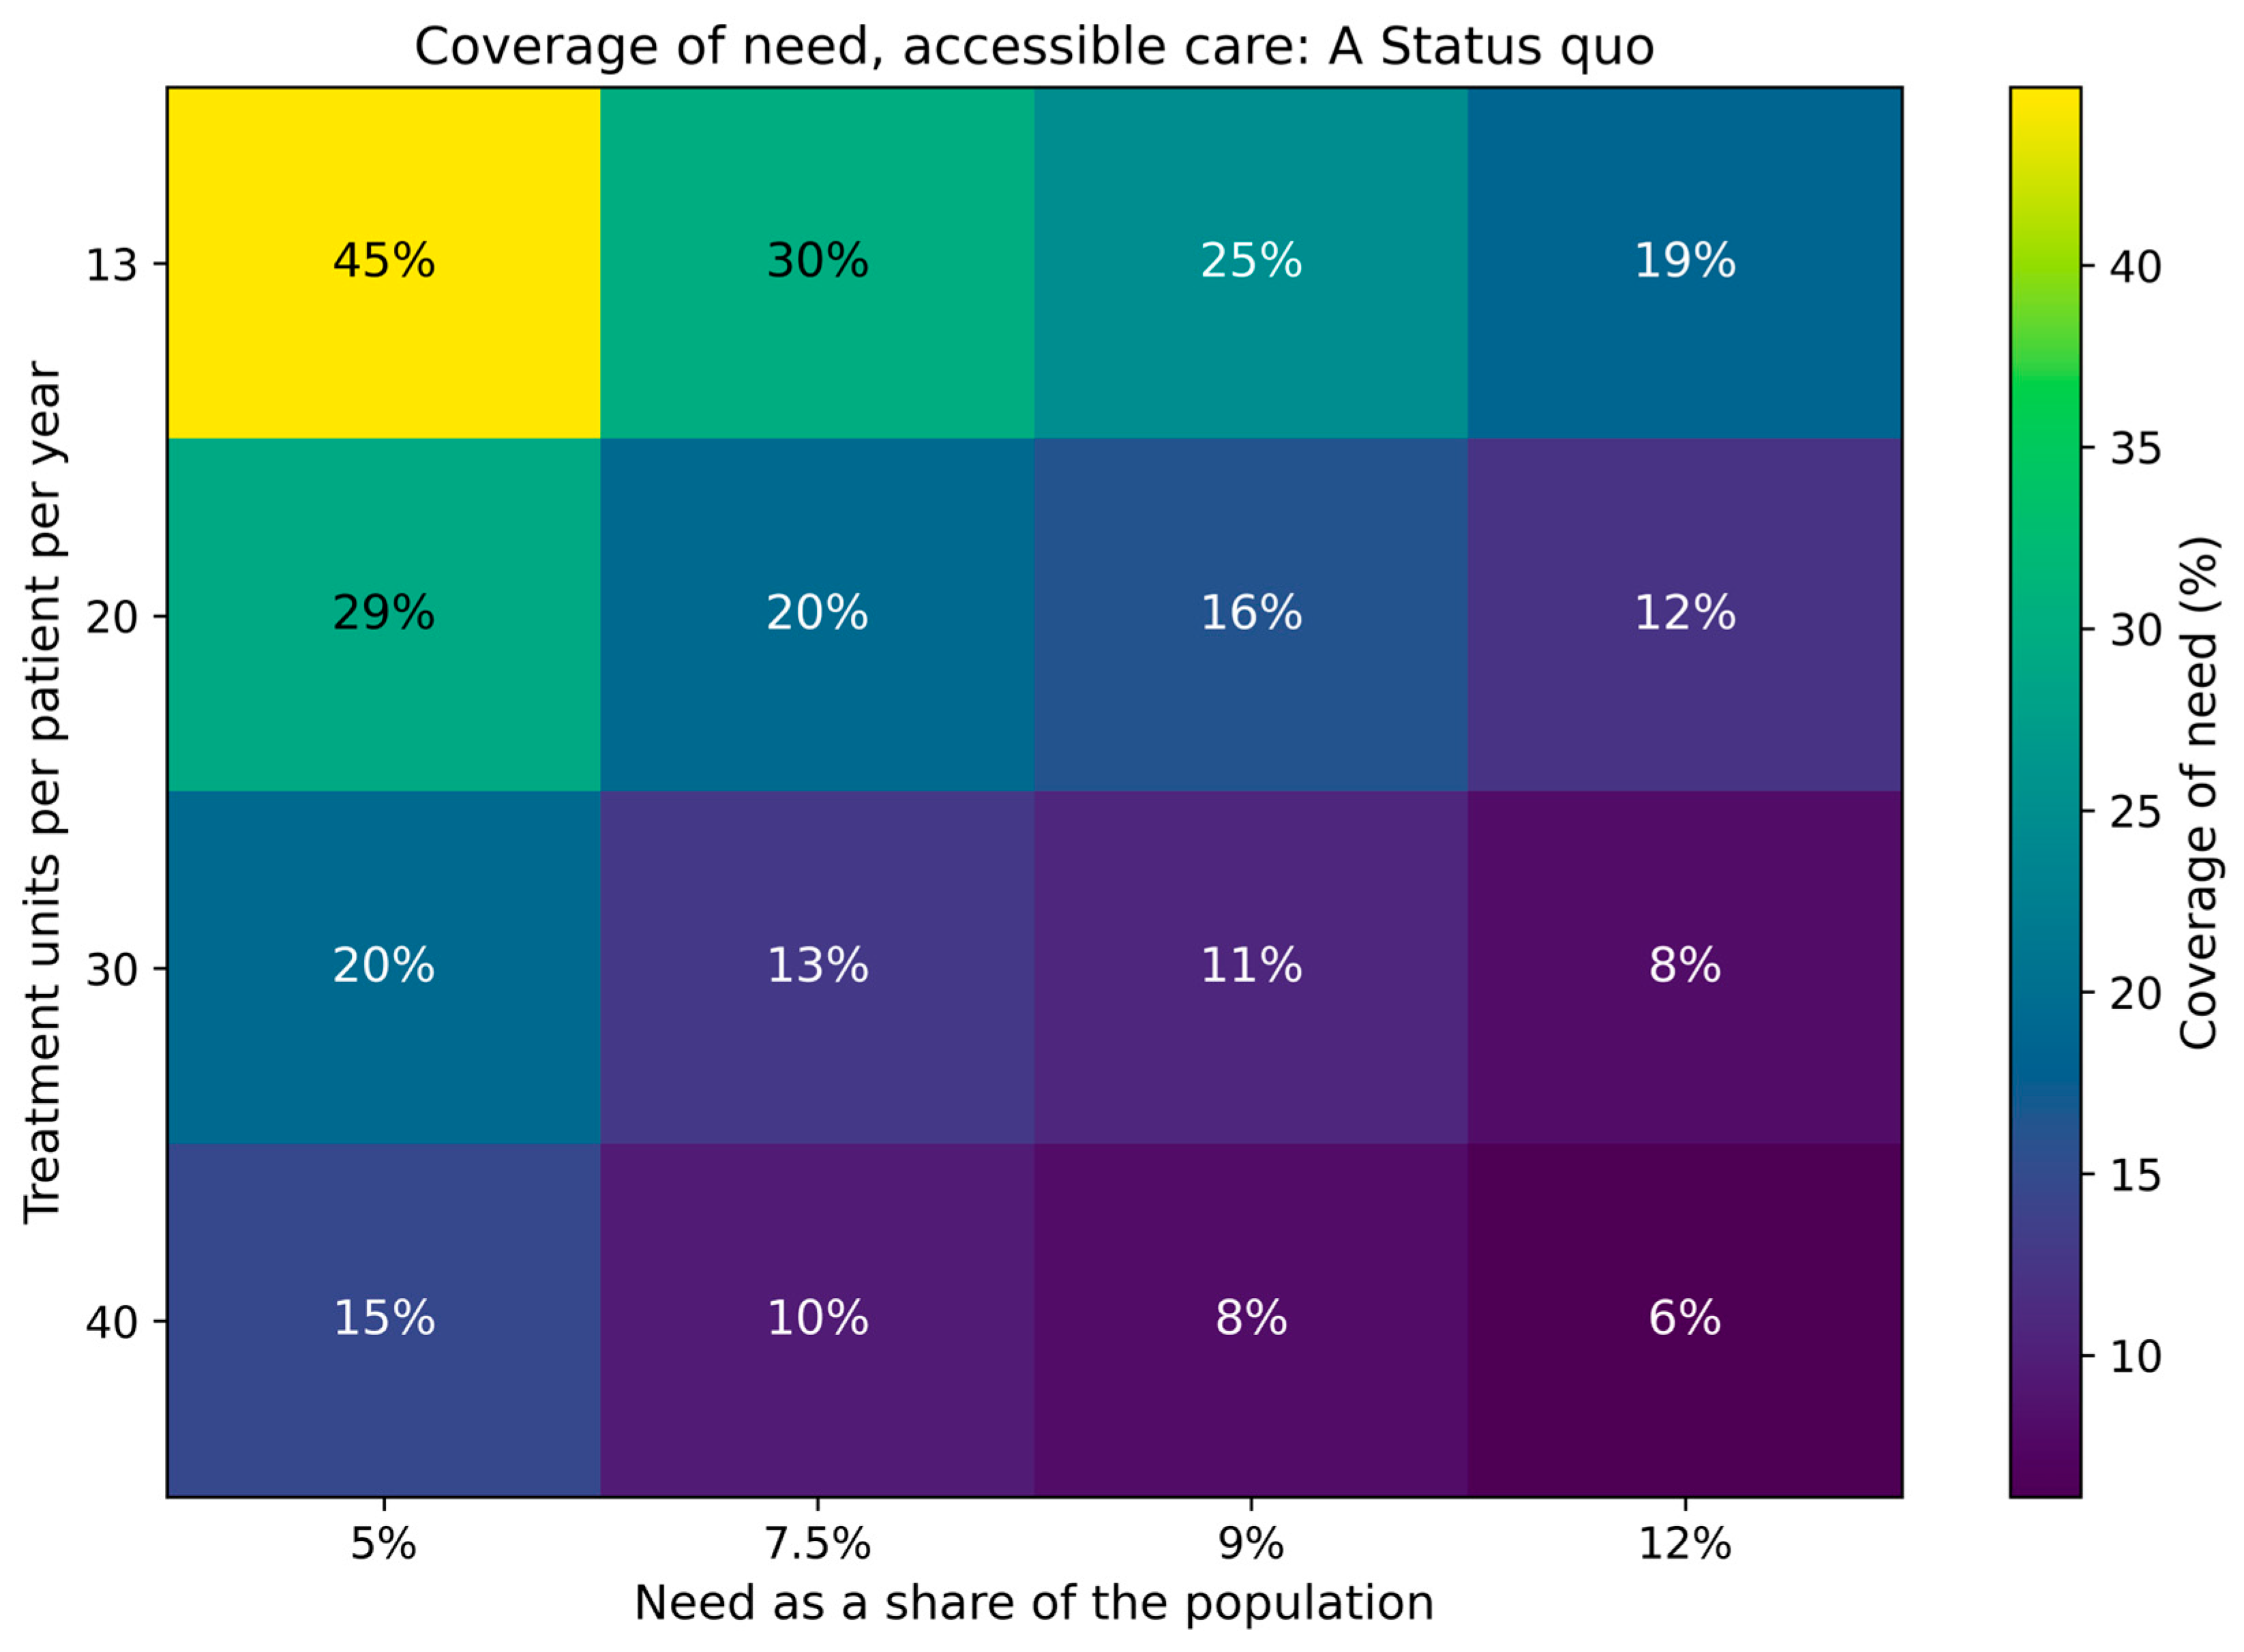
Figure 9.
Coverage of accessible care at 9% need as a function of treatment intensity (deterministic calculation). Source: authors’ simulation.
Figure 9.
Coverage of accessible care at 9% need as a function of treatment intensity (deterministic calculation). Source: authors’ simulation.
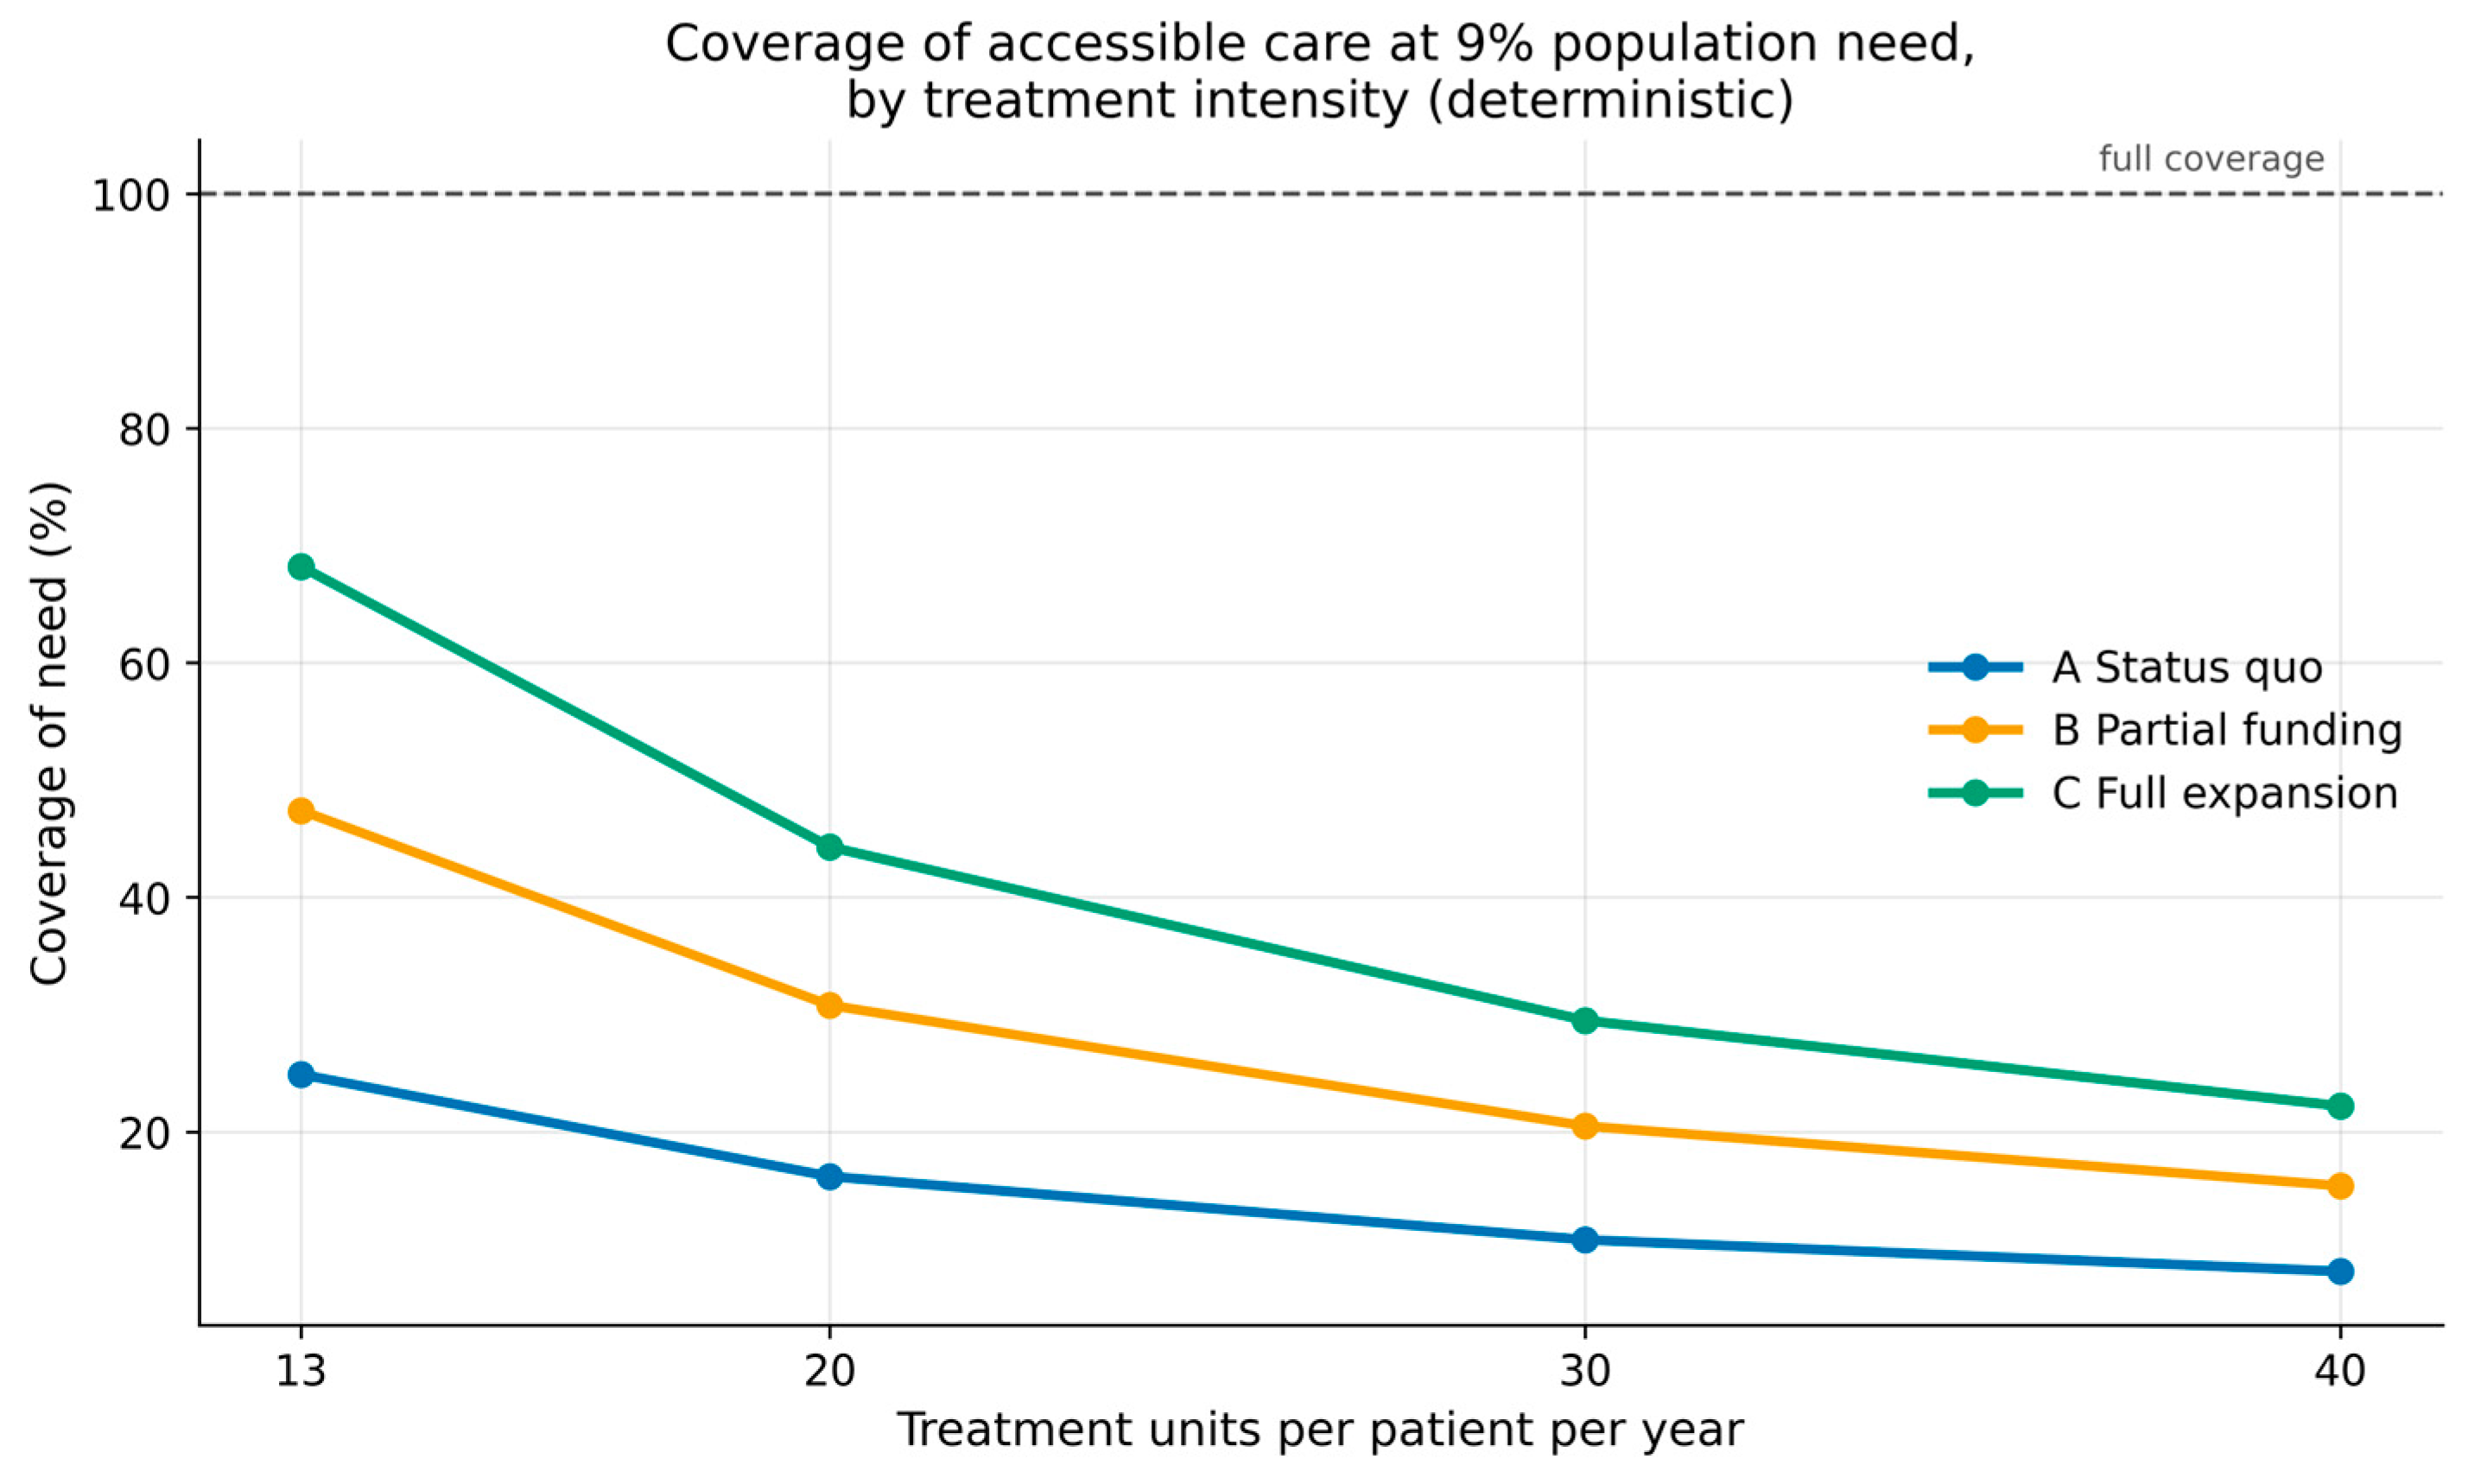
Table 1.
Three-variant modeling of the waiting-time–chronification relationship.
| Variant | Assumption on the waiting-time–chronification link | Model parametrization |
|---|---|---|
| Conservative | Small risk increase; linear rise after a threshold | Waiting-time factor: 1.0–1.3; base risk: 10% |
| Realistic | Moderate risk increase; own scenario assumption, direction motivated by [5] | Waiting-time factor: 1.0–1.8; base risk: 18% |
| Pessimistic | Strong risk increase; own scenario assumption, direction motivated by [6] | Waiting-time factor: 1.0–2.5; base risk: 28% |
Note: In the results reported below, the realistic variant serves as the reference. The conservative and pessimistic variants provide robustness ranges.
Table 3.
Comparison of the reform cohorts by key characteristics.
| Characteristic | Old system (PThG 1990) | Master-entry cohorts (PThG 2024, from 2026/27) | Bachelor–master route (PThG 2024) |
|---|---|---|---|
| Age at entry | mean 32–38 years | variable (prior bachelor-equivalent studies) | mean 22–26 years |
| Training duration | turnover of the pool ≈ 9 years; completion by 30 Sept 2038 | 2 years Master + 2–5 years phase 3 (+ waiting time for a place) | 5 years BSc/MSc + 2–5 years phase 3 |
| Training path | Propaedeutic + Fachspezifikum | credit transfer → MSc + specialist training under teaching supervision | BSc + MSc + specialist training under teaching supervision |
| Age at professional entry | mean 40–45 years | variable | mean 29–33 years |
| Expected professional years | 15–25 years | variable | 30–40 years |
| Output by 2040 | ≈ 714/year until 2038 → 0 from 2039 | 576 (A) – 838 (C) per year from 2033 | bachelor graduates fill the same Master places (no separate output) |
Note: Output figures are Monte-Carlo medians; the range for the Master-entry cohorts spans Scenarios A and C. In Scenario A, the output is limited by phase-3 training places (about 1,050 candidates waiting in 2040).
Table 4.
Cross-check of model cost parameters against Austrian secondary-cost data (compilation by Seitz et al. [16] for a high-utilizer population with somatic symptom disorder; reference years 2006–2016).
Table 4.
Cross-check of model cost parameters against Austrian secondary-cost data (compilation by Seitz et al. [16] for a high-utilizer population with somatic symptom disorder; reference years 2006–2016).
| Cost component | Model assumption (mode) | Austrian empirical anchor | Source |
|---|---|---|---|
| Base cost per untreated person/year (excess GP, emergency, medication use) | €5,000 | €1,093/patient/year for examinations, consultations, GP changes and medications alone (t1: €412 + €274 + €29 + €378) | [16] |
| Chronification excess cost/year | €10,000 | Hospitalization costs €115,252/patient/year (t1) at €3,168/hospital day; six-month excess costs of €6,123–€31,883 by severity level (2019 euros) | [8,16] |
| Productivity loss per person/year | €3,000 | Sick-leave costs €31,094/patient/year (t1) at €186/sick-leave day (≈35 million workdays lost/year, ≈€6.5 billion in total) | [7,16,17] |
| Sick-leave days (model: 24 days/year) | 24 days/year | 64.5 sick-leave days/patient/year avoided after integrated treatment | [16] |
| Total secondary costs, high-utilizer population | — | €147,689 → €67,943/patient/year; reduction €79,746, i.e. to 46% of baseline, one year after integrated care | [16] |
Note: t1 = year before the intervention; t2 = year after. For the hospitalization and sick-leave components, the model’s per-person cost parameters (€10,000/€3,000; modes) are conservative by one to two orders of magnitude relative to observed per-patient secondary costs in high-utilizer populations [16]. For the base-cost component, the direction is reversed: the empirical anchor of €1,093 covers examinations, consultations, and medication only and is therefore narrower than the ambulatory excess utilization represented by the model’s €5,000. The empirical anchors refer to a clinically selected population and are not directly transferable to the average untreated person in the care gap; they serve as an upper-bound plausibility check.
Table 5.
Main results of the FTE-calibrated Monte-Carlo simulation (final year 2040).
| Indicator (median, 2040) | Scenario A (status quo/underfunding) | Scenario B (transition/partial funding) | Scenario C (expansion/full funding) |
|---|---|---|---|
| Cumulative follow-on costs (€ million) | 83,437 | 13,136 | 1,339 |
| 95% PI, follow-on costs (€ million) | 37,095–143,252 | 1,433–50,720 | 0–8,123 |
| Care gap (persons/year) | 320,736 | 36,951 | 0 |
| 95% PI, care gap (persons/year) | 142,273–475,350 | 0–247,225 | 0–0 |
| Potential capacity (persons/year) | 980,339 | 1,047,308 | 1,104,651 |
| Accessible capacity (persons/year) | 320,417 | 603,274 | 907,552 |
| Fully funded capacity (persons/year) | 151,919 | 412,487 | 843,408 |
| Activation rate (accessible/potential) | 33% | 58% | 82% |
| Licensed psychotherapists | 15,333 | 16,743 | 17,439 |
| Supervised trainees, old system (i.A.u.S.; peak 2032) | 0 (4,214) | 0 (4,214) | 0 (4,214) |
| Phase-3 trainees, new system, in a training place (i.F.u.L.) | 1,788 | 2,431 | 2,739 |
| Phase-3 candidates waiting for a training place | 1,046 | 0 | 0 |
| Trainee capacity, potential (persons/year; peak 2032/33) | 88,224 (268,415) | 68,523 (310,708) | 84,249 (349,358) |
| Trainee capacity, insurance-funded (persons/year; peak) | 26,352 (84,338) | 42,384 (197,135) | 74,210 (308,193) |
| Capacity factor per supervised trainee (share of a fully active therapist; 2026 → 2040) | 0.60 → 0.70 | 0.60 → 0.79 | 0.60 → 0.86 |
| Completions, old system | 0 | 0 | 0 |
| Completions, new system | 576 | 744 | 838 |
| Retirements/exits | 832 | 902 | 937 |
| Mean waiting time for a phase-3 place (years, admitted candidates) | 0.7 | 0.0 | 0.0 |
Note: All cost values in € million (2024 price basis), cumulative 2026–2040. PI = prediction interval. Activation rate = accessible capacity/potential capacity (ratio of the medians shown; the modes of the scenario-specific activation parameter for therapists are 32%/58%/82%, Table A3). The full-funding share is defined relative to potential capacity (A 16%, B 39%, C 76%). Potential capacity includes the full treatment capacity of supervised trainees. The old-system trainee stock (i.A.u.S.) is zero in 2040 in all scenarios because the statutory completion deadline (30 September 2038) has passed; its peak (2032) is given in parentheses. Trainee capacity peaks in 2032/33 (parentheses) and falls thereafter because the old-system trainees complete. The capacity factor per trainee rises as insurance funding for trainee services is phased in (Section 3.8.2). Phase-3 trainees in Scenario A are limited by the training places (350–800 per year, Table A3). Data source: MC_FTE_Kalibriert_Summary_2040 (n = 30,000 iterations).
Table 6.
Sensitivity analysis: numerical correlation values and interpretation.
| Parameter | ρ with cumulative costs 2040 (A / B / C) | ρ with accessible capacity 2040 (A / B / C) | Interpretation |
|---|---|---|---|
| Need (% of the population). | +0.70 / +0.74 / +0.79 | 0.00 / 0.00 / 0.00 | Dominant within-scenario cost uncertainty; weight increases with the activation level; no effect on capacity |
| Access/funding activation (therapists) | −0.26 / −0.47 / −0.40 | +0.66 / +0.66 / +0.48 | Strongest steerable parameter for both endpoints |
| Capacity per therapist (FTE anchor) | −0.16 / −0.28 / −0.37 | +0.39 / +0.39 / +0.46 | Gains weight as activation rises: every FTE hour counts more once it is funded |
| Waiting-time factor | +0.21 / +0.04 / +0.01 | 0.00 / −0.01 / 0.00 | Cost driver only in the underfunded scenario |
| Retirement rate | +0.11 / +0.15 / +0.06 | −0.47 / −0.45 / −0.52 | Moderate for costs, strong for capacity and dominant for the licensed stock (ρ ≈ −0.8) |
| Insurance funding of trainee services | −0.11 / −0.14 / −0.01 | +0.14 / +0.09 / +0.04 | Immediate lever; its level effect (gap closure in B and C) exceeds its dispersion effect |
| Chronification rate | +0.12 / +0.05 / +0.02 | −0.01 / −0.01 / 0.00 | Cost multiplier while a gap persists |
| Lead time to full trainee activity | +0.03 / +0.06 / +0.01 | −0.06 / −0.11 / −0.15 | Delays the phase-3 contribution |
| Master places, private universities | −0.04 / −0.05 / 0.00 | +0.18 / +0.23 / +0.31 | Pipeline parameter; visible in capacity and stock, not in costs |
| Completion rate, new system | −0.03 / −0.05 / 0.00 | +0.17 / +0.19 / +0.20 | Pipeline parameter; acts with a lag |
| Admissions, old system (until 2030) | −0.03 / −0.03 / −0.02 | +0.06 / +0.05 / +0.06 | Small; all admitted candidates complete by 2038 |
| Capacity per trainee, unfunded (f₀) | −0.02 / −0.02 / −0.02 | +0.02 / +0.01 / +0.01 | Small dispersion effect; sets the level of trainee capacity before funding takes effect (survey anchor, Table S7) |
| Capacity per trainee, fully insurance-funded (f₁) | 0.00 / −0.02 / 0.00 | +0.01 / +0.02 / +0.02 | Small dispersion effect; acts only with the phased-in funding (expert assumption) |
| Direct entry to phase 3 (§ 10) | −0.01 / −0.02 / 0.00 | +0.06 / +0.07 / +0.07 | Small numbers (20–100 per year) |
| Phase-3 duration | +0.01 / −0.02 / +0.01 | +0.04 / +0.09 / +0.13 | Longer phase 3 = larger treating trainee stock, later licensure |
| Phase-3 training places | −0.01 / +0.01 / 0.00 | +0.07 / −0.01 / 0.00 | Binding in Scenario A only (stock 2040: ρ = +0.33 in A) |
| Full-funding share | +0.01 / 0.00 / 0.00 | 0.00 / 0.00 / 0.00 | No effect on costs, gap or accessible capacity by construction (equity indicator, level 3); deviations from zero are sampling noise |
Note: Spearman rank correlations between parameter values and two endpoints—cumulative follow-on costs by 2040 and accessible capacity in 2040—computed within each scenario (n = 30,000 per scenario); the largest absolute cost correlation across scenarios orders rows. Table S5 reports correlations with licensed stock in 2040. f₀/f₁ = capacity per supervised trainee (both systems) in the unfunded/fully insurance-funded state (Section 3.8.2). Source: authors’ simulation.
Table 7.
Care gap, licensed stock and waiting queue in 2040 as a function of the annual Master intake (phase-3 training places scaled in proportion to the intake).
Table 7.
Care gap, licensed stock and waiting queue in 2040 as a function of the annual Master intake (phase-3 training places scaled in proportion to the intake).
| Master places per year (medians, 2040) | Scenario A (status quo/underfunding) | Scenario B (transition/partial funding) | Scenario C (expansion/full funding) |
|---|---|---|---|
| 1,000 (current intake): care gap (persons/year) | 320,254 | 37,043 | 0 |
| 1,000: licensed psychotherapists | 15,369 | 16,759 | 17,456 |
| 1,000: waiting for a phase-3 place (persons) | 1,060 | 0 | 0 |
| 1,500: care gap (persons/year) | 269,460 | 0 | 0 |
| 1,500: licensed psychotherapists | 17,431 | 19,356 | 20,405 |
| 1,500: waiting for a phase-3 place (persons) | 1,250 | 0 | 0 |
| 2,000: care gap (persons/year) | 218,436 | 0 | 0 |
| 2,000: licensed psychotherapists | 19,480 | 21,954 | 23,356 |
| 2,000: waiting for a phase-3 place (persons) | 1,446 | 0 | 0 |
| 2,500: care gap (persons/year) | 167,664 | 0 | 0 |
| 2,500: licensed psychotherapists | 21,525 | 24,553 | 26,307 |
| 2,500: waiting for a phase-3 place (persons) | 1,647 | 0 | 0 |
Note: Master intake fixed at the stated value in all runs (the main run draws 500 + 250–750); all other draws identical to the main run. With the phase-3 places of Table A3 held constant instead of scaled, the results at 2,500 Master places are: Scenario A care gap 231,073, licensed stock 15,776, waiting queue 12,249 (mean waiting time 3.5 years); Scenario B stock 20,525, queue 6,947; Scenario C stock 24,927, queue 1,818. Data source: MC_FTE_Kalibriert_Masterplaetze (n = 30,000 per cell).
Disclaimer/Publisher’s Note: The statements, opinions and data contained in all publications are solely those of the individual author(s) and contributor(s) and not of MDPI and/or the editor(s). MDPI and/or the editor(s) disclaim responsibility for any injury to people or property resulting from any ideas, methods, instructions or products referred to in the content. |
© 2026 by the authors. Licensee MDPI, Basel, Switzerland. This article is an open access article distributed under the terms and conditions of the Creative Commons Attribution (CC BY) license (http://creativecommons.org/licenses/by/4.0/).
Copyright: This open access article is published under a Creative Commons CC BY 4.0 license, which permit the free download, distribution, and reuse, provided that the author and preprint are cited in any reuse.