

Submitted:
14 September 2026
Posted:
15 September 2026
You are already at the latest version
Abstract
Tumor budding is a prognostic marker associated with epithelial-mesenchymal transition and tumor microenvironment in various tumors. The programmed cell death protein 1 (PD-1) pathway functions as a crucial immune checkpoint that regulates lymphocyte activity within the tumor microenvironment. The expression patterns of PD-1 ligands may significantly influence the potential success of therapeutic blockade of this pathway. This study aims to compare the expression of programmed cell death ligand 1 (PD-L1) with clinical-pathological features using different scoring systems and to evaluate its prognostic value in patients with non-small cell lung cancer (NSCLC) treated with immune checkpoint inhibitors. A total of 361 cases of NSCLC were included in the study. A statistically significant association was found between patients with a negative combined positive score (CPS) or immune cell score (ICS) and those with an advanced clinical stage and poor tumor differentiation. A high tumor budding score correlated with positive PD-L1 expression across all three scoring systems. Overall survey (OS) revealed that PD-L1 positivity with ICS is a significant independent factor associated with a favorable prognosis. Kaplan-Meier analysis showed that CPS+ or ICS+ cases had significantly longer OS compared to CPS- or ICS- patients. In the immune checkpoint inhibitor group, no significant OS difference was found between positive and negative cases in TPS, CPS, and ICS. In conclusion, our study demonstrated a significant correlation between high tumor budding in NSCLC and PD-L1 expression in tumor and immune cells. We showed that CPS or ICS is a better predictor of prognosis in NSCLC.
Keywords:
PD-L1
; non-small cell lung cancer
; combined positive score
; tumor budding
1. Introduction
One potential therapeutic approach aimed at activating immunity against tumors is the blockade of immune checkpoint pathways. It is known that tumors select specific immune checkpoint pathways to develop immune resistance, primarily against tumor antigen-specific T cells [1]. Extensive studies have been conducted on immune checkpoint proteins, particularly programmed cell death protein 1 (PD-1) and its ligand, programmed cell death ligand 1 (PD-L1). PD-1 serves as the target for immunotherapeutic agents, including nivolumab and pembrolizumab, whereas numerous other agents specifically target PD-L1. Nivolumab is a fully human IgG4 monoclonal antibody that potentiates the immune response against neoplastic cells. Treatment with nivolumab has been linked to a significant increase in antitumor activity, leading to improved response rates and prolonged survival outcomes in metastatic cancer patients who have not responded adequately to standard therapeutic interventions [2]. PD-L1, also known as B7-H1 or CD274, is structurally expressed in myeloid, lymphoid, and normal epithelial cells, as well as in cancer [3]. PD-L1 has been detected in tumor cells and associated immune cells in all stages of non-small cell lung cancer (NSCLC) [4]. Immunohistochemistry is used to demonstrate PD-L1 expression at appropriate levels and in suitable cell populations, identifying patients with metastatic NSCLC who are more likely to benefit from anti-PD-1 or anti-PD-L1 therapy. Currently, in routine clinical practice for patients with NSCLC, PD-L1 expression on tumor cells is reported as the tumor proportion score (TPS). Tumors with a TPS of 50% or higher are more likely to respond to immune checkpoint inhibitor therapy as monotherapy, whereas those with lower TPS percentages may benefit from a combination of immune checkpoint inhibitors and chemotherapy [5]. In contrast to NSCLC, other cancer types (such as gastric cancer and head and neck squamous cell carcinoma) utilize a combined positive score (CPS) that indicates PD-L1 expression in both tumor cells and immune cells in the tumor microenvironment. This scoring evaluates PD-L1 expression on tumor cells and immune cells within the tumor microenvironment. It remains uncertain whether CPS may serve as a better predictive biomarker than TPS in NSCLC, as the current literature on this topic is quite limited [6]. Furthermore, the emerging role of immune cell expression of PD-L1 in predicting responses to immune checkpoint inhibitors has garnered considerable interest in the field of cancer immunotherapy [7].
Tumor budding is a novel prognostic biomarker observed in solid tumors, primarily colorectal cancer [8]. Some studies highlight the relationship between tumor budding in solid cancers and epithelial-mesenchymal transition and tumor microenvironment characteristics [9,10,11]. There are a few studies in the literature showing the relationship between tumor budding and cliniopathologic features and prognosis in lung cancers [12]. In our literature review, we did not find any studies investigating the relationship between PD-L1 and tumor budding in lung cancer.
This study aims to determine the correlation of TPS and CPS, and immune cell score (ICS) with clinicopathological findings in NSCLC, and to evaluate their relationship with prognosis in patients treated with an immune checkpoint inhibitor.
2. Materials and Methods
2.1. Study Population and Clinicopathologic Data
The study included 361 cases of NSCLC diagnosed at the Pathology Department of Osmangazi University Faculty of Medicine. The following parameters were recorded: age, gender, biopsy type, smoking status, and clinical stage. Microscopically, the histological type, histological grade, number of tumor buds, and tumor budding score were evaluated. Tumor budding assessments were conducted according to established guidelines and protocols for reporting colorectal cancer. After examining all tumor slides, the total number of buds was counted in a selected “hotspot” area using a 20x objective lens. In cases where tumor budding could not be assessed using hematoxylin and eosin (H&E) staining, the specimens were examined using appropriate immunohistochemical stains (p63 and TTF-1) for diagnostic purposes. The number of tumor buds was normalized by dividing by a predetermined normalization factor. The total bud count was categorized into three groups: low (0-4 buds), medium (5-9 buds), and high (10 or more buds). Areas that were poorly or undifferentiated were not evaluated [8]. Overall survival (OS) was defined as the time from diagnosis to death.
2.2. Analysis of PD-L1 Expression
Blocks containing at least 100 tumor cells were identified in hematoxylin-eosin sections prepared from formalin-fixed, paraffin-embedded blocks. Using an automated staining machine (Dako Omnis, Mannedorf, Switzerland), the PD-L1 22C3 pharmDx kit (Dako North America, Carpinteria, CA, USA) was applied to 4-micrometer-thick tissue sections. For TPS, any intensity of complete circumferential or partial linear plasma membrane staining of tumor cells was considered PD-L1 positive. Cytoplasmic staining in tumor cells was excluded from scoring. TPS was evaluated as <1% negative, 1-49% low, and >50% strong staining [13]. For the interpretation of the CPS, partial or complete membrane staining of tumor cells, as well as any staining in immune cells, was accepted. CPS was calculated using the formula CPS = (PD-L1-positive tumor cells + PD-L1-positive mononuclear inflammatory cells) / (total tumor cells) × 100. The CPS could have exceeded 100 according to this formula, but the highest score recorded was 100. CPS of 1% and above was considered positive [7]. CPS was rated as <1, 1-19, and ≥20 [14]. Additionally, an ICS was calculated by determining the ratio of immune cells expressing PD-L1 to the total number of tumor cells. Those with a value ≥1 were designated as positive [7]. The immunohistochemical evaluation was performed by two pathologists.
2.3. Statistical Analysis
Categorical variables were analyzed using frequencies and percentages, while continuous variables were analyzed using medians and ranges. The Mann-Whitney U test was utilized to compare groups that did not conform to a normal distribution. We used a 2 × 2 cross-tabulation (with continuity correction, Fisher’s exact test, and Pearson’s χ² test) to evaluate the statistical relationship between clinicopathological parameters. Survival curves were generated using the Kaplan-Meier method, and differences were assessed with the log-rank test. Univariate/multivariate analyses in the Cox regression model were used to show the effect of independent variables on survival. All biostatistical analyses were conducted using SPSS (version 23.0).
3. Results
3.1. Clinicopathologic Features and PD-L1 Expression
Of the total cohort of 359 patients, 170 (47.4%) were diagnosed with adenocarcinoma (AC), 170 (47.4%) with squamous cell carcinoma (SCC), and 2 (0.6%) with adenosquamous carcinoma (ASC). Additionally, 17 patients (4.7%) were categorized as NSCLC, not otherwise specified (NOS). The median age of the patients was 66.6 years (range, 40-91 years), with a predominance of male patients (88.3%). Tumor budding score was predominantly low (59.1%), followed by medium (26.5%) and high (11.4%), respectively. In 11 cases, tumor budding could not be assessed in the biopsy specimens due to the tumors being composed entirely of poorly differentiated areas. In most cases, PD-L1 was positive in both tumor and immune cells (34.8%, 125/359). Notably, PD-L1 was observed to be positive exclusively in tumor cells (TC) in 46 out of 359 cases (12.8%), whereas it was found solely in immune cells (IC) in 106 out of 359 cases (29.5%) (Figure 1a–c). Furthermore, staining was not observed in either tumor or immune cells in 82/359 (22.8%) cases. The clinical and pathological characteristics are presented in Table 1 and Table 2. PD-L1 immunohistochemical staining results and scores are given in Table 3.
3.2. Comparison of PD-L1 Expression Scoring with Clinical-Pathological Characteristics
When comparing TPS rates by gender, significant statistical differences were found, especially among those with TPS ≥ 50%, where it was 95.6% for males and 4.4% for females (p < 0.05). No statistical significance was found between gender and the positivity of TPS, CPS, ICS, and the rates of CPS. Data regarding smoking status and clinical stage were missing for 80 patients, and data on the treatment protocol were missing for 83 patients. Although TPS, CPS, and ICS positivity were more common in active smokers, no statistically significant difference was found (p>0.05). The study investigated the relationship between CPS and ICS in both positive and negative conditions across different clinical stages. It was found that the negativity of CPS and ICS increased significantly with disease progression (p < 0.05). There was no statistical significance between clinical stage and TPS (positive and negative cases) and TPS rates. The investigation of the relationship between CPS and ICS positivity according to tumor differentiation revealed that CPS and ICS positivity were associated with moderately differentiated tumors (52%, 56.3%), whereas CPS and ICS negativity were statistically significantly higher in poorly differentiated tumors (53.7%, 57.8%) (p<0.05). No relationship was found between TPS positivity and TPS rates and tumor differentiation (p>0.05). TBS comparisons were performed using TPS, CPS, and ICS in both positive and negative cases. Individuals with low TBS predominantly exhibited negative across all scores (68.6%, 76.3%, and 71.7%), while individuals with moderate and high TBS predominantly exhibited positive scores (34.4% and 31% for moderate TBS, and 31.6%, 13.5%, 12.7%, and 13.2% for high TBS) (p < 0.05) (Figure 2a–f). TBS was frequently low in cases with TPS <1, CPS<1 (68.6%, 76.3%), while it was more often moderate in cases with TPS ≥50%, CPS>20 (39.1%, 31.2%), respectively (p<0.05). No significant relationship was found between age, gender, and tumor type with positivity of TPS, CPS, ICS, and rates of CPS (Table 4, Table 5 and Table 6).
3.3. Overall Survival
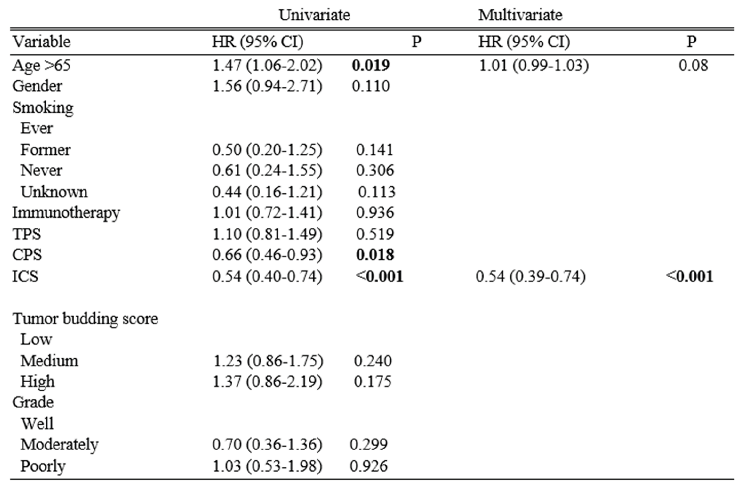
A total of 276 patients were included in the prognosis data. The mean OS was 19 months (95% CI: 14-23) in the TPS-negative group and 12 months (95% CI: 10-19) in the TPS-positive group (p=0.511). The median OS was the longest (19 months, 95% CI: 14-23) in the group with TPS <1, followed by the groups with >50 (17 months, 95% CI:6-17) and 1-49 (12 months, 95% CI:10-23) (p=0.584). In CPS and ICS negative cases, the median OS was 11 months (95% CI: 5-16) and 10 months (95% CI: 6-13), respectively, while in positive cases, a significantly longer OS was observed (19 months, 95% CI: 12-15) and 26 months (95% CI: 17-34) (p=0.015, p=0.000). The median OS was 11 months (%95 CI: 5-16) in the group with CPS<1, 20 months (%95 CI: 11-28) in those with CPS 1-19, and 19 months (%95 CI: 9-28) in those with CPS>20 (p=0.021) (Figure 3a–c and Figure 4a,b). In our study, the median OS for a cohort of 67 patients receiving immunotherapy was 217 days (95% CI:93-340) for TPS-negative patients and 173 days (95% CI:0.6-345) for TPS-positive patients (p=0.595). In this group, the median OS was shorter in CPS (160 days, 95% CI:1.5-318) and ICS negative (160 days, 95% CI:105-328) cases compared to CPS (217 days, %95 CI:105-328) and ICS positive cases (255 days, %95 CI:129-380), but this was not statistically significant (p=0.942, p=0.810, respectively). Furthermore, multivariate and univariate Cox regression analysis for OS demonstrated that PD-L1 positivity with ICS is an important independent factor for favorable prognosis (HR 0.54, 95% CI 0.39-0.74, p < 0.001; HR 0.54, 95% 0.40-0.74, P < 0.001). Additionally, in univariate analysis, age ≥65 years (HR 1.47, 95% 1.06-2.02, p=0.019) was associated with statistically significant worse OS. In the univariate analysis, the CPS was identified as an important independent factor for a favorable prognosis (HR 0.66, 95% CI 0.46-0.93, p=0.018) (Table 7).
4. Discussion
Lung cancer is the second most common cancer in both genders, with an estimated 226,650 cases in 2025. Despite a decline in recent years, lung cancer still surpasses other cancers, causing more deaths than colorectal, breast, and prostate cancers by 2025 [15]. Primary lung cancer arises from the epithelial cells of the lungs, with NSCLC accounting for about 85% of cases. Among NSCLCs, the most common histological types are adenocarcinoma and squamous cell carcinoma [16]. Treatment for advanced NSCLC has shifted from platinum-based chemotherapy to molecular targeted therapy and immunotherapy. For this purpose, immune checkpoint inhibitors targeting the programmed death-ligand 1 (PD-L1)/PD-1 axis are employed [17]. Chen et al. [18] observed PD-L1 expression in 57.5% of NSCLC cases (SCC 68%, AC 52%, large cell carcinoma 45%). In approximately 20-30% of NSCLC cases, PD-L1 expression has been observed to exceed 50% in both tumor cells and infiltrating immune cells [3]. Scheel et al. [4] examined PD-L1 expression in 436 genetically annotated early-stage NSCLC samples using the PD-L1 antibody 5H1. Their findings indicated that 34.4% of AC cases (88 out of 256) and 33.9% of SCC cases (61 out of 180) tested positive for PD-L1 in tumor cells. In our study, PD-L1 was positive in tumor cells in 171 of 359 NSCLC patients (47. 6%). Specifically, the positivity rate was 47. 4% in AC, 47. 4% in SCC, 0. 6% in ASC, and 4. 7% in NSCLC, NOS cases. Scheel et al. [4] determined PD-L1 to be negative in 102 (39.8%) of 250 adenocarcinoma cases and in 68 (37.8%) of 180 SCC cases. In this study, PD-L1 positivity was detected only in tumor cells in 33 cases (12.9%) of AC and 20 cases (11.1%) of SCC, and only in immune cells in 66 (25.8%) and 51 (28.3%) cases, and in both tumor and immune cells in 55 (21.5%) and 41 (22.8%) cases, respectively. In our study, similar to the literature, SCC and AC cases were negative in 38/170 (22.3%) cases, while NSCLC, NOS cases were negative in 6/17 (35.2%) cases. In AC and SCC cases, PD-L1 positivity was observed only in tumor cells, at 18/170 (10.5%) and 24/170 (14.1%), respectively. Immune cells were similar at 51/170 (30%), while tumor and immune cells were 63/170 (37.0%) and 57/170 (33.5%), respectively. Pann et al. [19] demonstrated that combined odds ratios (OR) in 1550 NSCLC cases showed that high PD-L1 expression was associated with poor tumor differentiation [OR = 0.53, 95% confidence interval (CI): 0.39-0.72, P<0.0001]. In contrast, none of the other clinical-pathological characteristics [gender, smoking status, histological type, tumor invasive depth, lymph node metastasis status, and tumor node metastasis (TNM) stage] showed any correlation with PD-L1 expression in the current analysis.
In this study, the combined hazard ratio (HR) suggested that high PD-L1 expression is associated with poor OS in NSCLC. Chen et al. [18] found that poor tumor cell differentiation and advanced TNM stage were associated with higher PD-L1 expression (n:120). In this study, PD-L1-negative NSCLC patients had longer 5-year overall survival than PD-L1-positive patients (P<0.0001). PD-L1 status has been indicated as an important independent prognostic factor for NSCLC (P<0.001). Velcheti et al. [20] evaluated two NSCLC case cohorts in TMA slides, comprising 340 cases from hospitals in Greece and 204 cases from Yale University. They observed PD-L1 protein expression in the tumor in 36% of cases (Greece) and 25% of cases (Yale). PD-L1 expression was significantly associated with tumor-infiltrating lymphocytes in both cohorts. It has been found that PD-L1 protein expression in tumor cells is not associated with age, gender, race, or smoking status. Patients with PD-L1 expression (both protein and mRNA) above the cutoff threshold showed statistically significantly better outcomes in both series (log-rank P=0.036 and P=0.027). Multivariate analysis showed that PD-L1 expression was significantly associated with better outcomes independently of histology. There are limited studies that compare TPS, CPS, and ICS in NSCLC patients. In a study involving 187 patients with advanced NSCLC undergoing immunotherapy, PD-L1 positivity was identified in 112 patients (59.9%) using the TPS and in 135 patients (72.2%) utilizing the CPS. In this study, no significant difference was found in OS between TPS- and TPS+ patients (p=0.20). However, CPS+ patients were found to have longer OS than CPS- patients (p=0.006) [6]. In our study, all cases were assessed using a 3-point scoring system, with the highest positivity observed in CPS (77.2%), followed by ICS (64.3%) and TPS (47.6%). In our study, CPS and ICS negativity were statistically significantly higher in poorly differentiated tumors (53.7%, 57.8%) (p<0.05). No relationship was found between TPS positivity and TPS rates and tumor differentiation (p>0.005). When comparing TPS rates by gender, TPS was found to be >=50% in males (95.6%) and 4.4% in females (p<0.05). No significant relationship was found between age, gender, and tumor type with TPS+/-, CPS+/-, CPS rate, and ICS+/-. In our study, In CPS- and ICS - cases, the median OS was 11 months (95% CI: 5-16) and 10 months (95% CI: 6-13), respectively, while in CPS+, and ICS+ cases, a significantly longer OS was observed 19 months (95% CI: 12-15) and 26 months (95% CI: 17-34) (p=0.015, p=0.000). There was no significant difference in OS between TPS- and TPS+ patients (p=0.511). Multivariate and univariate Cox regression analysis for OS demonstrated that PD-L1 positivity with ICS is an important independent factor for favorable prognosis (HR 0.54, 95% CI 0.39-0.74, P < 0.001; HR 0.54, 95% 0.40-0.74, P < 0.001). Additionally, in univariate analysis, age ≥65 years (HR 1.47, 95% 1.06-2.02, P=0.019) was associated with statistically significant worse OS. In the univariate analysis, the CPS was identified as an important independent factor for a favorable prognosis (HR 0.66, 95% CI 0.46-0.93, P=0.018). Additionally, in our study, univariate and multivariate analyses were performed in patients receiving immunotherapy. Immunotherapy was not a prognostic factor in univariate and multivariate analyses. In this group, median OS was shorter in CPS- and ICS- cases than in CPS+ and ICS+ cases. However, this difference was not statistically significant (p = 0.942 and p = 0.810, respectively).
Imai first described tumor budding (or “sprouting”) and its association with advanced disease stage and poor prognosis in various solid cancers in the 1950s [21]. Recently, tumor buds have been defined as single cancer cells or clusters of no more than four cells, typically found around invasive tumors. Although numerous studies support the prognostic value of tumor budding, the utility of this phenotype as a predictive biomarker remains under investigation. Tumor budding is strongly associated with epithelial-mesenchymal transition and various factors in the tumor microenvironment. In this context, individual tumor buds interact with the tumor stroma and different components of the immune system [22]. In the exhausted immune system subtype of pancreatic cancer, high PD-L1 expression, an immunogenic tumor microenvironment rich in T cells (including Tregs), and loss of DNA mismatch repair proteins are observed. Consequently, poor outcome for PD-L1 upregulated tumours and frequently high-grade EMT-like tumor budding are observed in tumors [10]. The characteristics of the exhausted phenotype of the immune system demonstrate that immunosuppressive mechanisms transform a tumor microenvironment (TME) that typically does not allow tumor budding into a TME that allows tumor budding. This situation provides a potential therapeutic opportunity for PD-1 or PD-L1 inhibitors. These findings, explained by the aggressive-defensive model of tumor budding and demonstrated in CRC, suggest that composite tumor budding and immune cell scores may have added prognostic value [22,23,24]. Safaa et al. [25] demonstrated that PD-L1 expression was correlated with low tumor budding in a series of 102 gastric adenocarcinomas and that high tumor budding and positive PD-L1 were independent predictors of short overall survival. They indicated that anti-PD-L1 immunotherapy may be effective in GAC with lymph node metastasis, particularly in cases with high TIL and low tumor budding. Qian et al. [12] demonstrated in their series of 532 NSCLC cases using multivariate Cox regression analysis that tumor budding, pleural and vascular invasion, spread via air spaces, tumor size, lymph node metastasis, and tumor node metastasis are independent risk factors for prognosis. Peksa et al. [26] determined that in 107 cases of pancreatic adenocarcinoma with high-grade budding, there was higher PD-L1 expression in tumor cells (p = 0.008). In our study, predominantly negative results were observed in all scores in cases with low TBS (68.6%, 76.3%, and 71.7%), while predominantly positive results were observed in cases with moderate and high TBS (34.4% and 31% for moderate TBS; 31.6%, 13.5%, 12.7%, and 13.2% for high TBS) (p < 0.05). TBS was not identified as a predictive factor in univariate and multivariate Cox analyses.
5. Conclusions
In our study cohort of NSCLC patients, we established a significant correlation between an increase in TBS and PD-L1 positivity. Our study is the first to identify a relationship between tumor budding and PD-L1 expression in lung cancer, highlighting the need for more comprehensive studies in this area. CPS and ICS negativity are associated with advanced disease and poor tumor differentiation. Kaplan-Meier survival analyses indicated that OS was significantly better in cases categorized as ICS+ and CPS+. Additionally, our Cox regression analyses identified ICS+ and CPS+ statuses as critical prognostic factors predictive of favorable outcomes. Within our study group of patients receiving immunotherapy, we observed longer OS in the CPS+ and ICS+ subgroups. However, this difference was not statistically significant. The main limitation of our study is the small number of patients receiving immunotherapy. Consequently, our findings suggest that further research involving larger patient cohorts undergoing immunotherapy is necessary to elucidate these relationships more cearly.
Author Contributions
Conceptualization Funda Canaz, Furkan Albayrak; Methodology: Funda Canaz, Emine Dündar; Investigation: Funda Canaz, Furkan Albayrak, Emine Dündar; Data Curation Bülent Yıldız, Metin Demir; Software, Formal Analysis: Funda Canaz, Ertuğrul Çolak; Writing – Original Draft Preparation: Funda Canaz; Writing – Review & Editing: Güntülü Ak; Visualization: Ertuğrul Çolak; Supervision: Güntülü Ak; Project Administration: Funda Canaz.
Funding
No funding was received.
Data Availability Statement
The original contributions presented in this study are included in the article. Further inquiries can be directed to the corresponding author.
Conflicts of Interest
The authors have no conflict of interest to declare.
References
- Pardoll, D.M. The of immune checkpoints in cancer immunotherapy. Nat. Rev. Cancer 2012, 12, 252–264. [Google Scholar] [CrossRef]
- Rajan, A.; Kim, C.; Heery, C.R.; et al. Nivolumab, anti-programmed death-1 (PD-1) monoclonal antibody immunotherapy: Role in advanced cancers. Hum. Vaccines Immunother. 2016, 12, 2219–2231. [Google Scholar] [CrossRef]
- 3.; Kythreotou, A.; Siddique, A.; Mauri, F.A.; et al. PD-L1. J. Clin. Pathol. 2018, 71, 189–194. [Google Scholar] [CrossRef]
- Scheel, A.H.; Ansén, S.; Schultheis, A.M.; et al. PD-L1 expression in non-small cell lung cancer: correlations with genetic alterations. Oncoimmunology 2016, 5, e1131379. [Google Scholar] [CrossRef]
- Planchard, D.; Popat, S.T.; Kerr, K.; et al. Metastatic non-small cell lung cancer: ESMO Clinical Practice Guidelines for diagnosis, treatment and follow-up. Ann. Oncol. 2018, 29, iv192–iv237. [Google Scholar] [CrossRef]
- Ulas, E.B.; Hashemi, S.M.; Houda, I.; et al. Predictive value of combined positive score and tumor proportion score for immunotherapy response in advanced NSCLC. JTO Clin. Res. Rep. 2023, 4, 100532. [Google Scholar] [CrossRef]
- Kulangara, K.; Zhang, N.; Corigliano, E.; et al. Clinical utility of the combined positive score for programmed death ligand-1 expression and the approval of pembrolizumab for treatment of gastric cancer. Arch. Pathol. Lab. Med. 2019, 143, 330–337. [Google Scholar] [CrossRef]
- Lugli, A.; Kirsch, R.; Ajioka, Y.; et al. Recommendations for reporting tumor budding in colorectal cancer based on the International Tumor Budding Consensus Conference (ITBCC) 2016. Mod. Pathol. 2017, 30, 1299–1311. [Google Scholar] [CrossRef]
- Thakur, N.; Ailia, M.J.; Chong, Y.; et al. Tumor budding as a marker for poor prognosis and epithelial–mesenchymal transition in lung cancer: a systematic review and meta-analysis. Front. Oncol. 2022, 12, 828999. [Google Scholar] [CrossRef]
- Karamitopoulou, E. Tumour microenvironment of pancreatic cancer: immune landscape is dictated by molecular and histopathological features. Br. J. Cancer 2019, 121, 5–14. [Google Scholar] [CrossRef]
- Kadota, K.; Yeh, Y.C.; Villena-Vargas, J.; et al. Tumor budding correlates with the protumor immune microenvironment and is an independent prognostic factor for recurrence of stage I lung adenocarcinoma. Chest 2015, 148, 711–721. [Google Scholar] [CrossRef]
- Qian, L.; Zhang, J.; Lu, S.; et al. Potential key roles of tumour budding: a representative malignant pathological feature of non-small cell lung cancer and a sensitive indicator of prognosis. BMJ Open 2022, 12, e054009. [Google Scholar] [CrossRef]
- IASLC Atlas of PD-L1 Testing in Lung Cancer | International Association for the Study of Lung Cancer. Available online: https://www.iaslc.org/publications/iaslc-atlas-pd-l1-testing-lung-cancer (accessed on 11 June 2018).
- Burtness, B.; Harrington, K.J.; Greil, R.; et al. Pembrolizumab alone or with chemotherapy versus cetuximab with chemotherapy for recurrent or metastatic squamous cell carcinoma of the head and neck (KEYNOTE-048): a randomised, open-label, phase 3 study. Lancet 2019, 394, 1915–1928. [Google Scholar] [CrossRef]
- Siegel, R.L.; Kratzer, T.B.; Giaquinto, A.N.; et al. Cancer statistics, 2025. CA Cancer J. Clin. 2025, 75, 10. [Google Scholar] [CrossRef]
- Smolarz, B.; Łukasiewicz, H.; Samulak, D.; et al. Lung Cancer—Epidemiology, Pathogenesis, Treatment and Molecular Aspect (Review of Literature). Int. J. Mol. Sci. 2025, 26, 2049. [Google Scholar] [CrossRef]
- Mountzios, G.; Linardou, H.; Kosmidis, P. Immunotherapy in non-small cell lung cancer: the clinical impact of immune response and targeting. Ann. Transl. Med. 2016, 4, 268. [Google Scholar] [CrossRef]
- Chen, Y.B.; Mu, C.Y.; Huang, J.A. Clinical significance of programmed death-1 ligand-1 expression in patients with non-small cell lung cancer: a 5-year-follow-up study. Tumori J. 2012, 98, 751–755. [Google Scholar] [CrossRef]
- Pan, Z.K.; Ye, F.; Wu, X.; et al. Clinicopathological and prognostic significance of programmed cell death ligand 1 (PD-L1) expression in patients with non-small cell lung cancer: a meta-analysis. J. Thorac. Dis. 2015, 7, 462. [Google Scholar] [CrossRef]
- Velcheti, V.; Schalper, K.A.; Carvajal, D.E.; Anagnostou, V.K.; Syrigos, K.N.; Sznol, M.; et al. Programmed death ligand-1 expression in non-small cell lung cancer. Lab. Investig. 2014, 94, 107–116. [Google Scholar] [CrossRef]
- Imaı, T. Growth patterns in human carcinoma: their classification and relation to prognosis. Obstet. Gynecol. 1960, 16, 296–308. [Google Scholar]
- Lugli, A.; Zlobec, I.; Berger, M.D.; et al. Tumour budding in solid cancers. Nat. Rev. Clin. Oncol. 2021, 18, 101–15. [Google Scholar] [CrossRef]
- Lang-Schwarz, C.; Melcher, B.; Haumaier, F.; et al. Budding and tumor—Infiltrating lymphocytes—Combination of both parameters predicts survival in colorectal cancer and leads to new prognostic subgroups. Hum. Pathol. 2018, 79, 160–167. [Google Scholar] [CrossRef]
- Dawson, H.; Christe, L.; Eichmann, M.; et al. Tumour budding/T cell infiltrates in colorectal cancer: proposal of a novel combined score. Histopathology 2020, 76, 572–580. [Google Scholar] [CrossRef]
- Abd El Khalek, S.M.; Halim, M.I. Tumor budding in gastric adenocarcinoma; reflections on tumor microenvironment and programmed death ligand 1 (PD-L1) expression. Immunopathol. Persa 2023, 9, e31365. [Google Scholar] [CrossRef]
- Pęksa, R.; Kunc, M.; Czapiewski, P.; et al. Tumor budding is an independent prognostic factor in pancreatic adenocarcinoma and it positively correlates with PD-L1 expression on tumor cells. Biomedicines 2022, 10, 1761. [Google Scholar] [CrossRef]
Figure 1.
PD-L1 expression patterns (a) in tumor cells, (b) in tumor and immune cells, (c) in immune cells (x200).
Figure 1.
PD-L1 expression patterns (a) in tumor cells, (b) in tumor and immune cells, (c) in immune cells (x200).
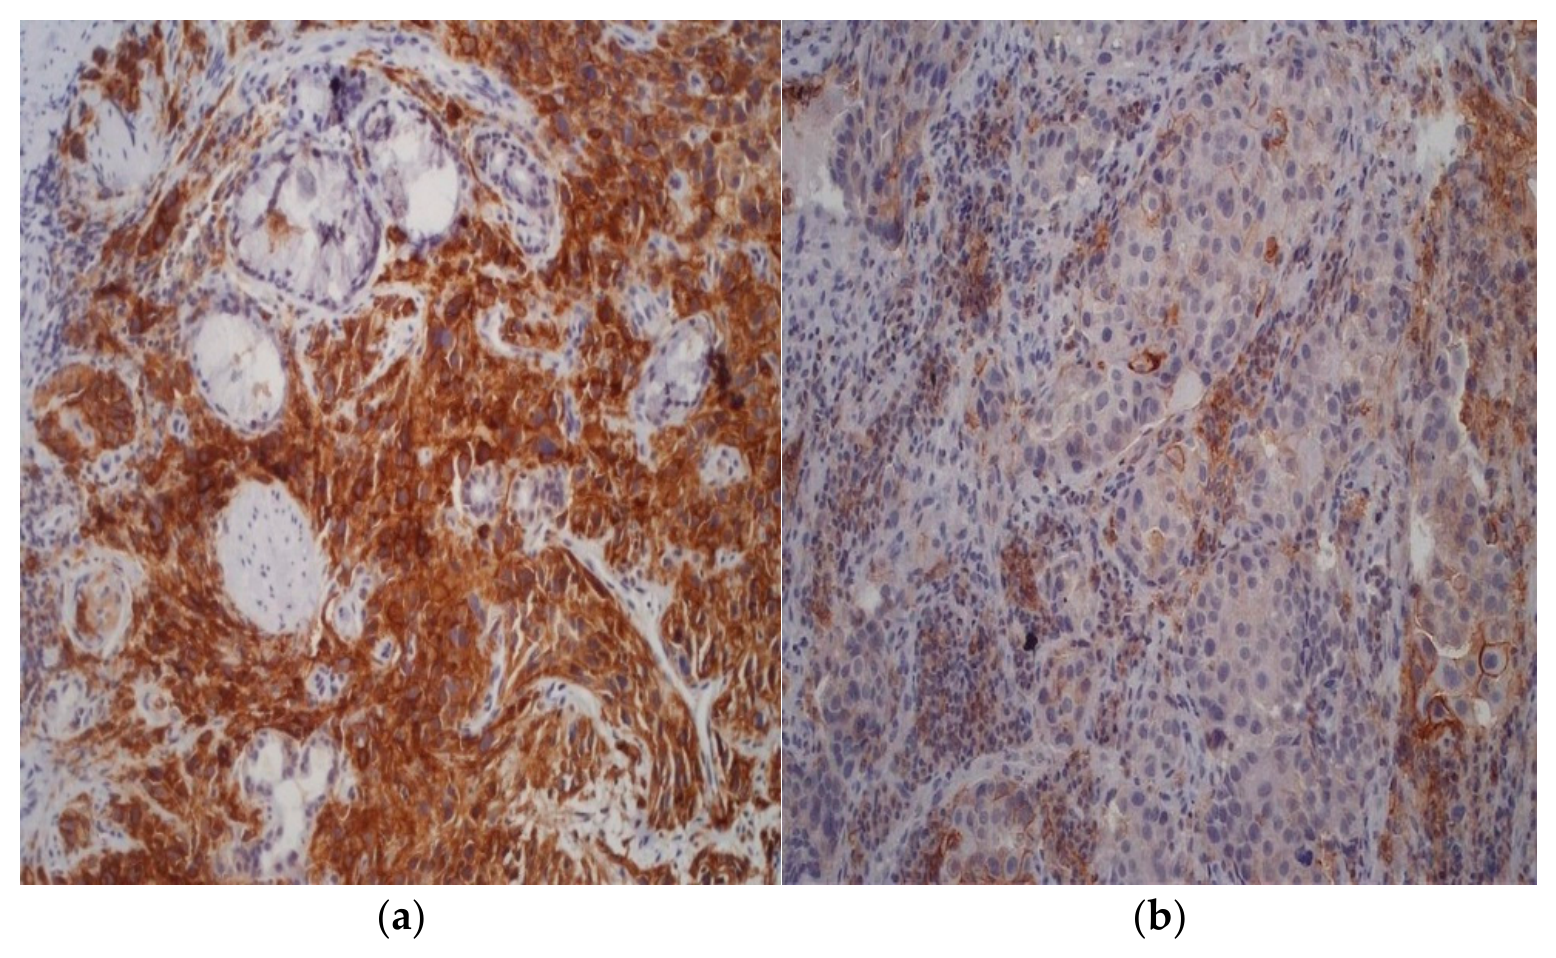
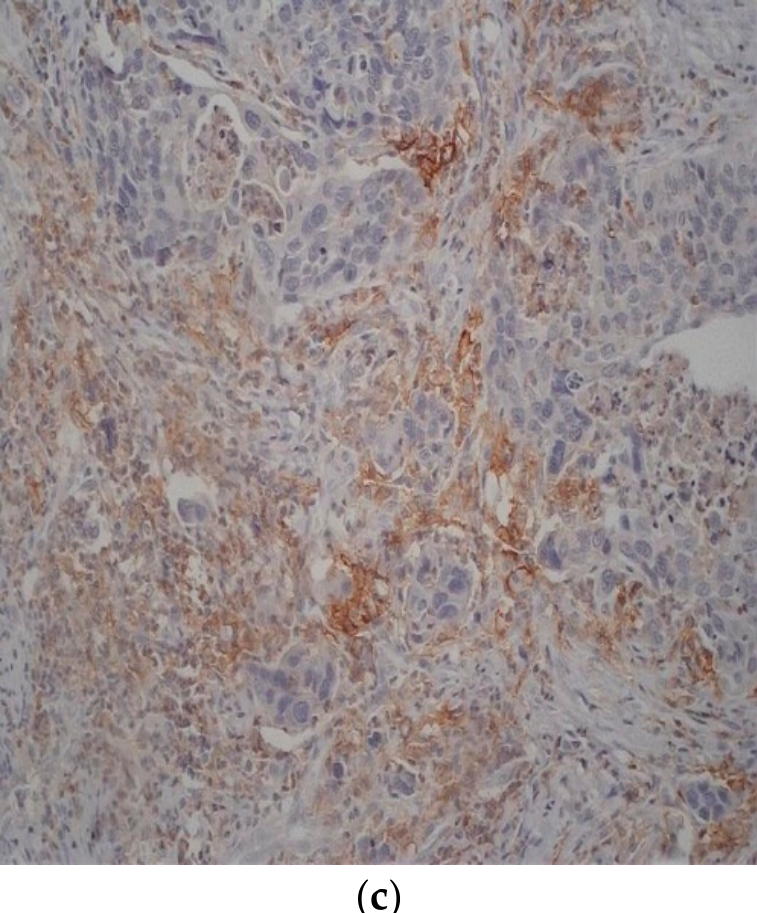
Figure 2.
The tumor budding and immunohistochemical staining (a) Low tumor budding (x200, H&E) (b) P63 immunochemistry, (c) PD-L1 negative expression (x200) (d) High tumor budding (x200, H&E) (e) TTF1 immunochemistry, (f) PD-L1 positive expression (x200).
Figure 2.
The tumor budding and immunohistochemical staining (a) Low tumor budding (x200, H&E) (b) P63 immunochemistry, (c) PD-L1 negative expression (x200) (d) High tumor budding (x200, H&E) (e) TTF1 immunochemistry, (f) PD-L1 positive expression (x200).
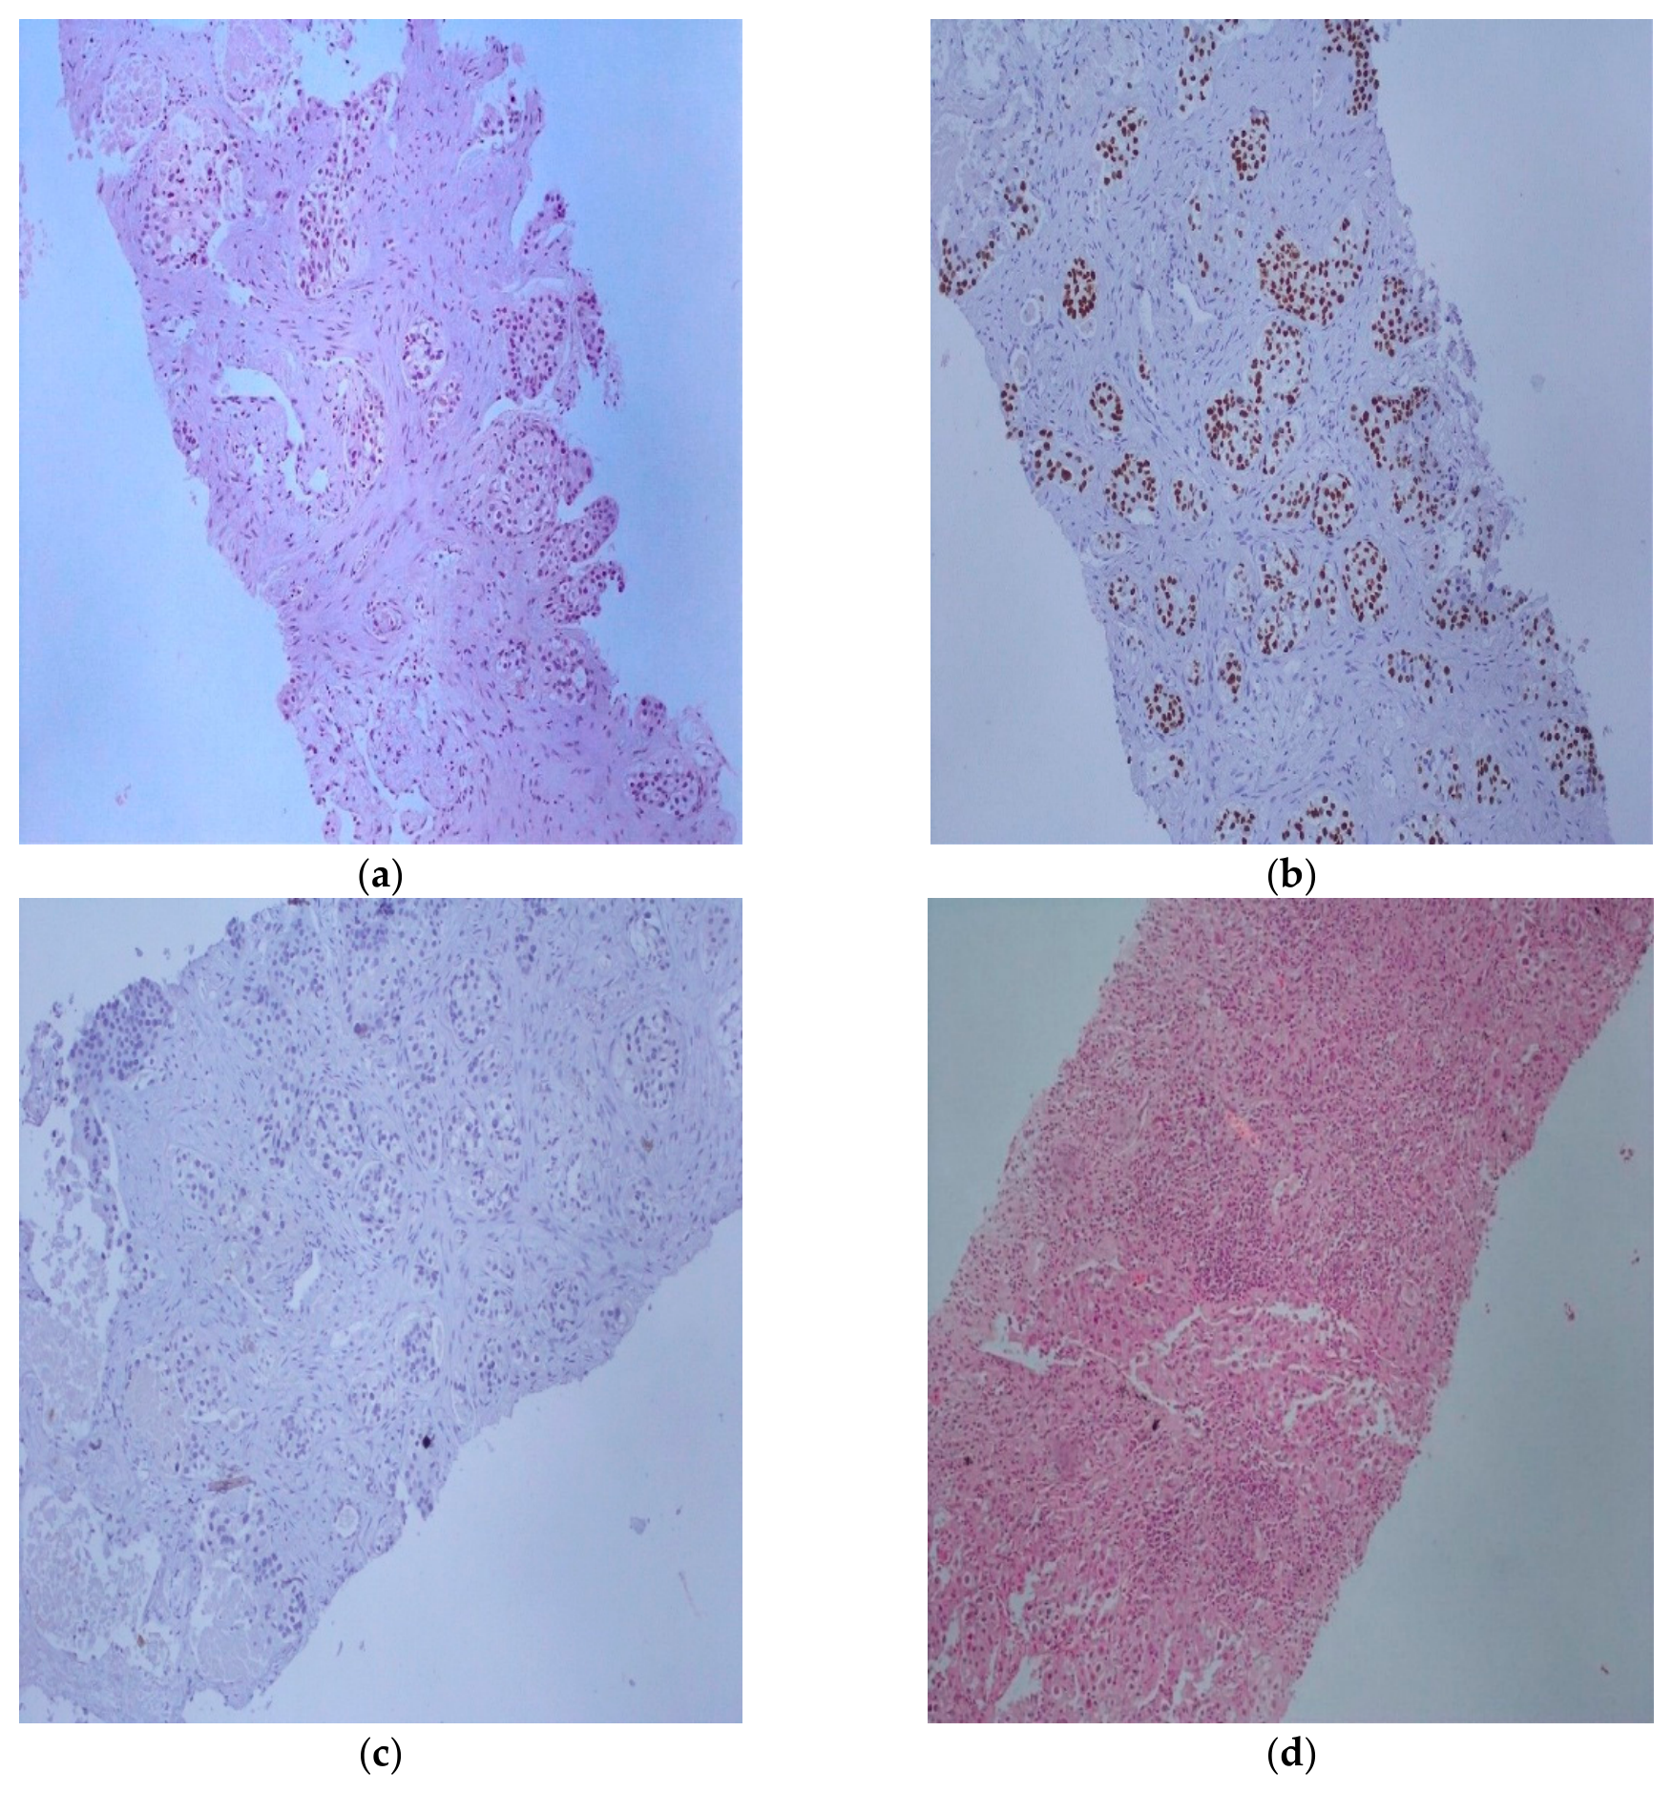
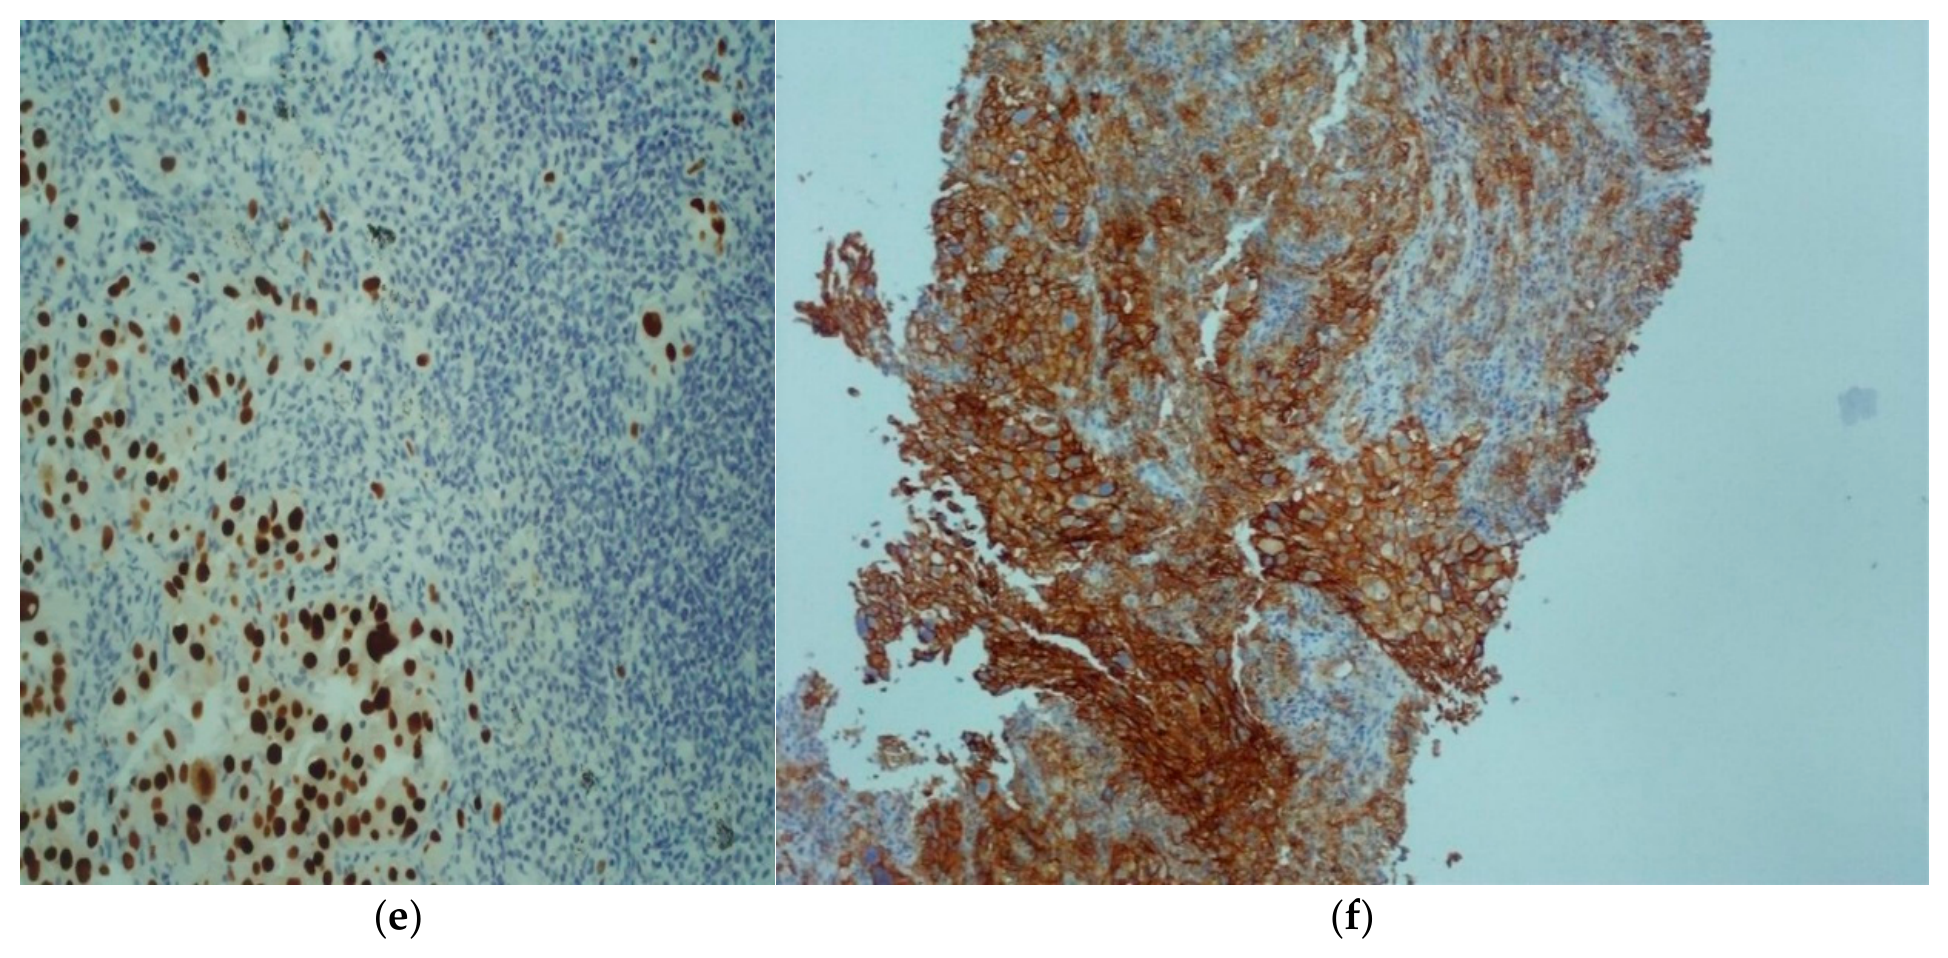
Figure 3.
Kaplan-Meier analysis OS graph for patients with (a) positive TPS (green) and negative TPS (blue). (b) positive CPS (green) and negative CPS (blue) (c) positive ICS (green) and negative ICS (blue).
Figure 3.
Kaplan-Meier analysis OS graph for patients with (a) positive TPS (green) and negative TPS (blue). (b) positive CPS (green) and negative CPS (blue) (c) positive ICS (green) and negative ICS (blue).
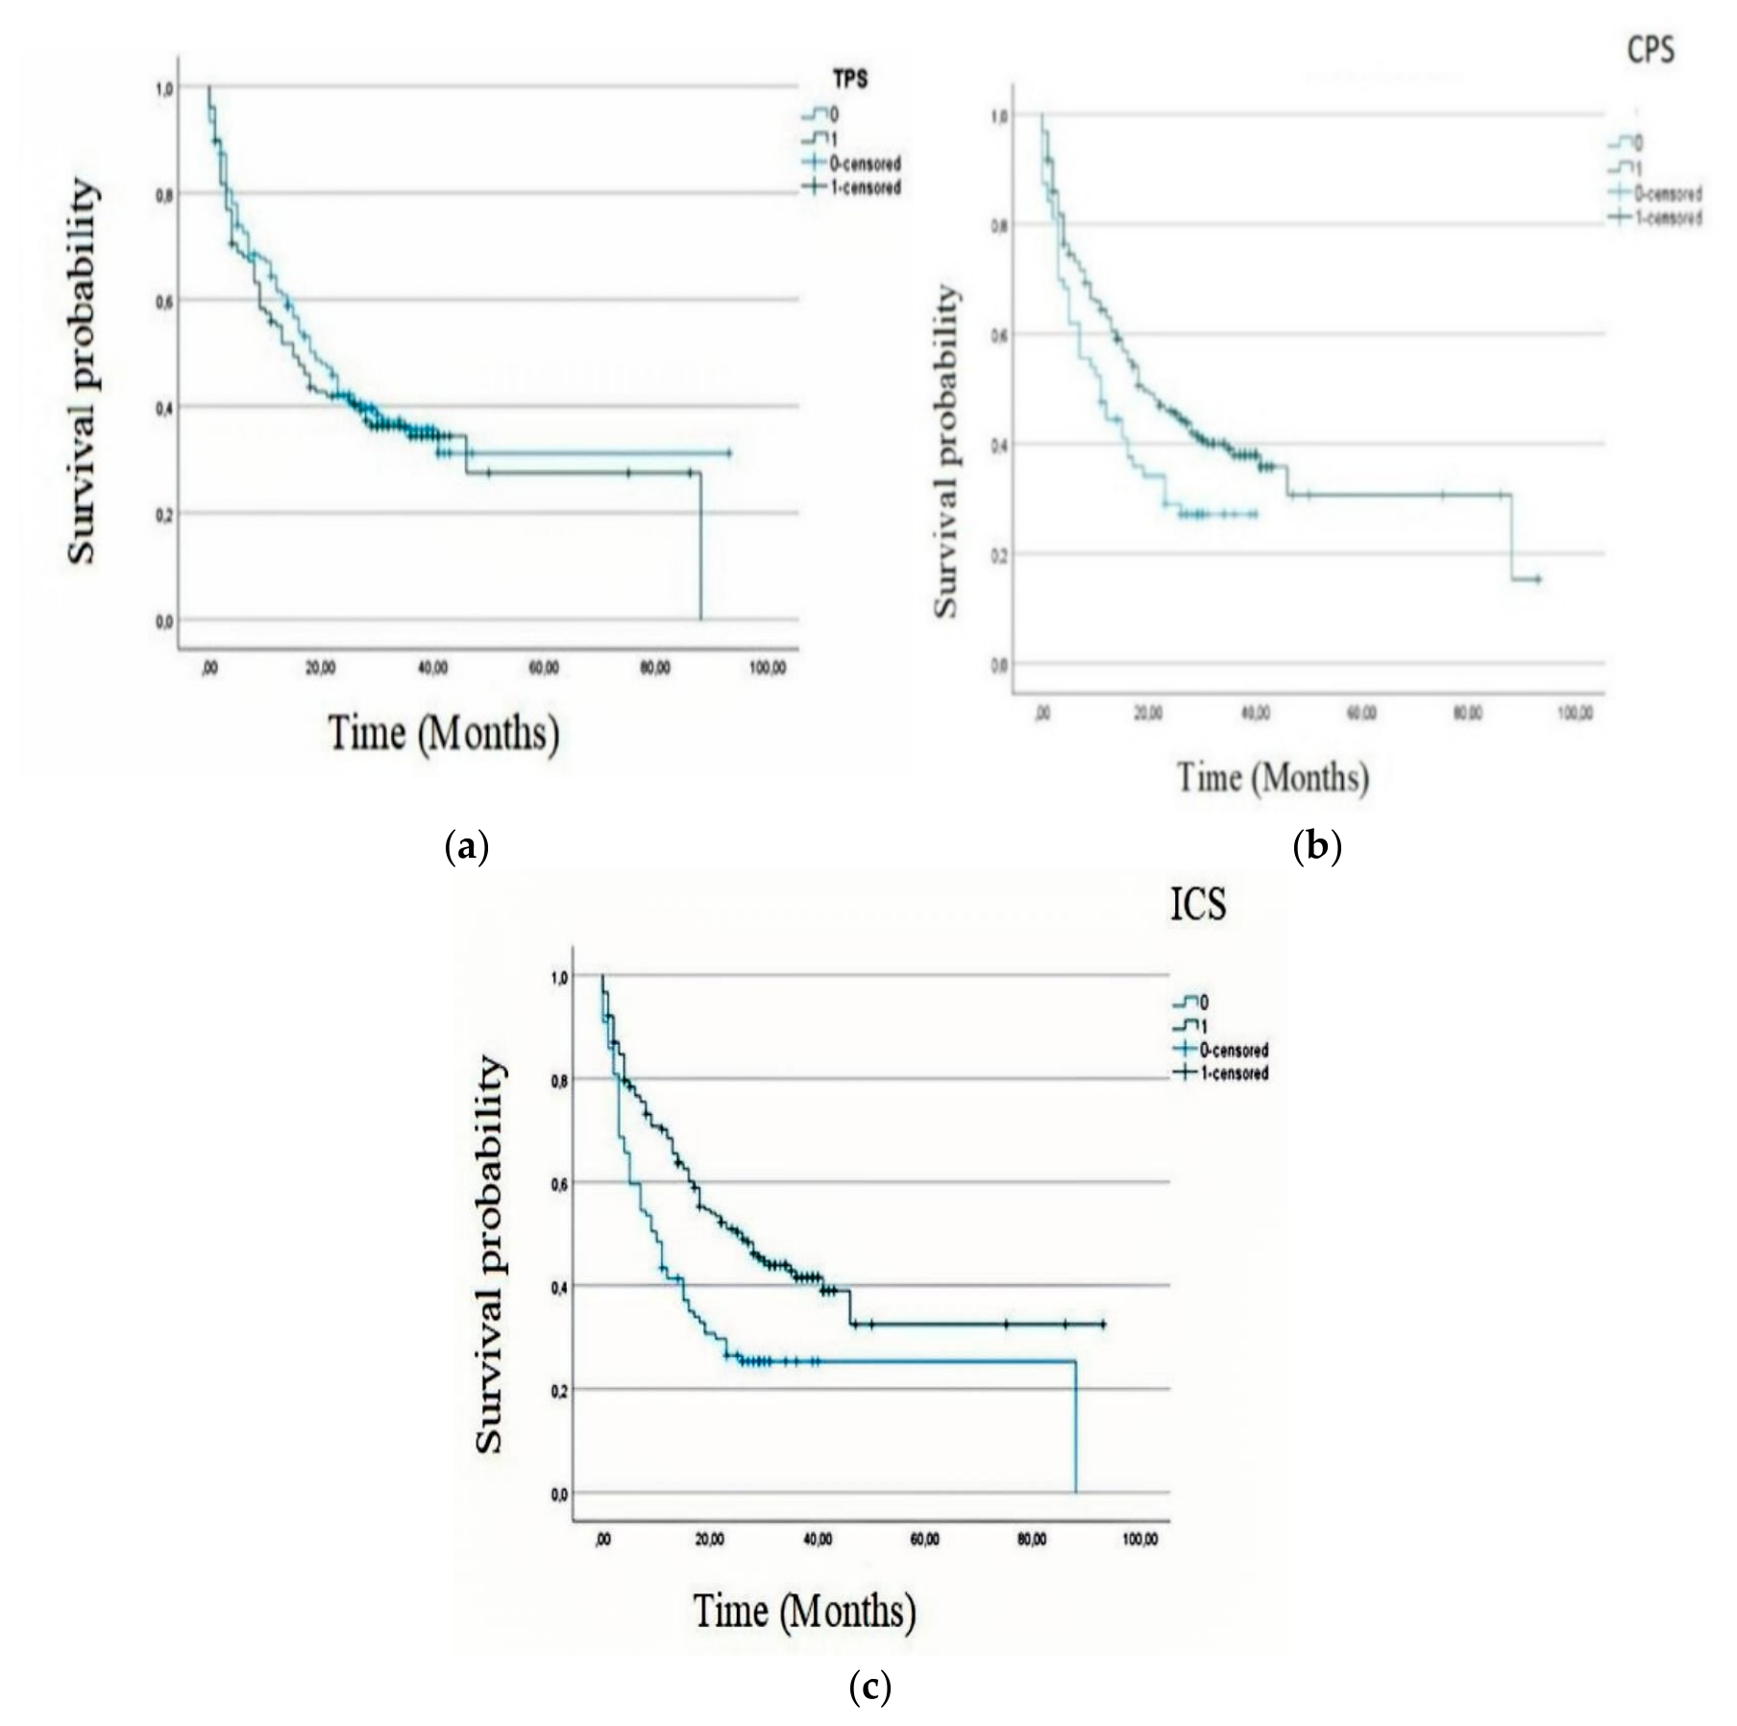
Figure 4.
Kaplan-Meier analysis OS graph for patients with rates (a) TPS < 1% (blue), TPS 1% - 49% (green), and TPS ≥ 50% (red) (b) CPS < 1% (blue), CPS 1% - 19% (green), and CPS ≥ 20% (red).
Figure 4.
Kaplan-Meier analysis OS graph for patients with rates (a) TPS < 1% (blue), TPS 1% - 49% (green), and TPS ≥ 50% (red) (b) CPS < 1% (blue), CPS 1% - 19% (green), and CPS ≥ 20% (red).
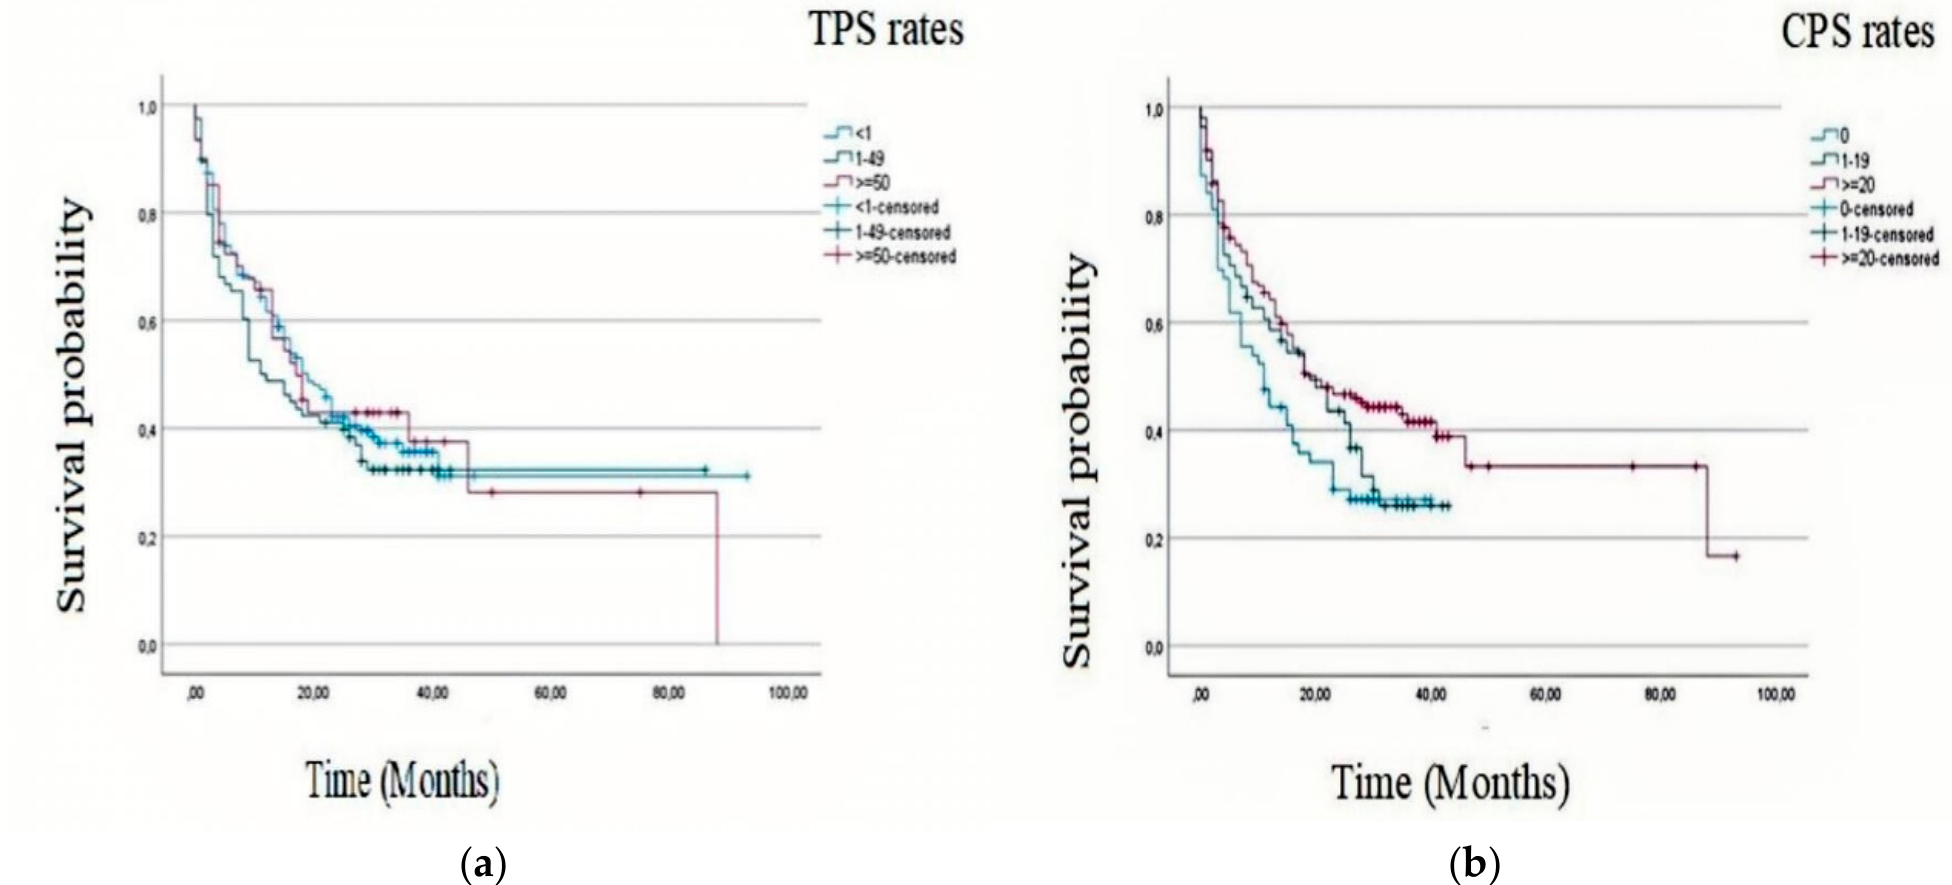

Table 1.
Demographic and clinical characteristics of patients.
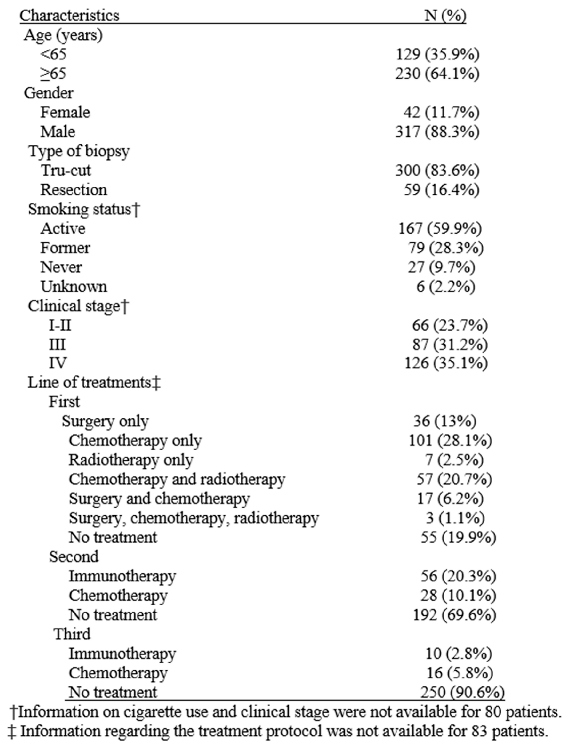 |
Table 2.
Histopathologic features of cases.
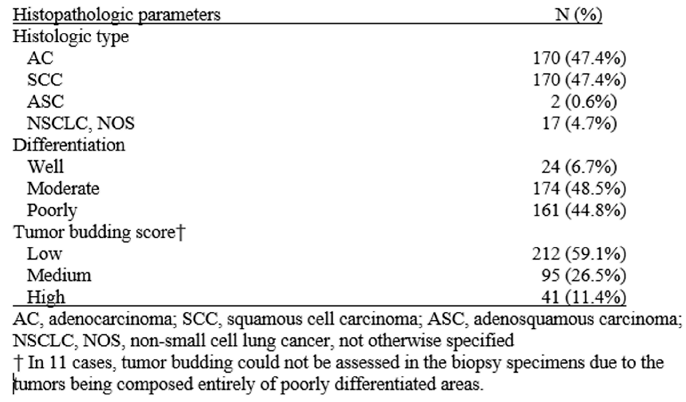 |
Table 3.
PD-L1 expression characteristics.
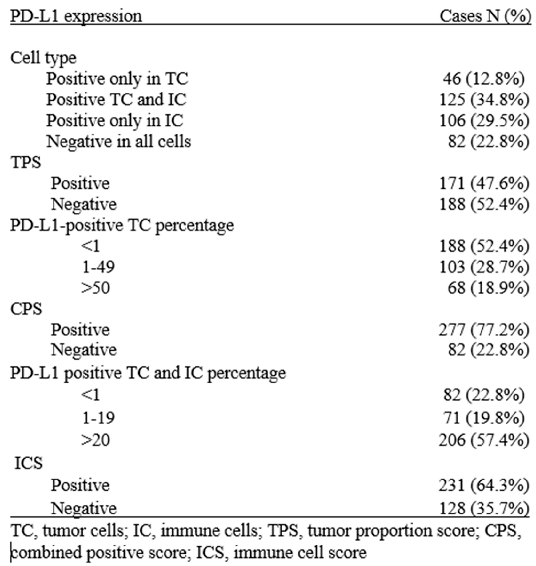 |
Table 4.
Comparison of PD-L1-TPS, TPS ratio and clinicopathological findings.
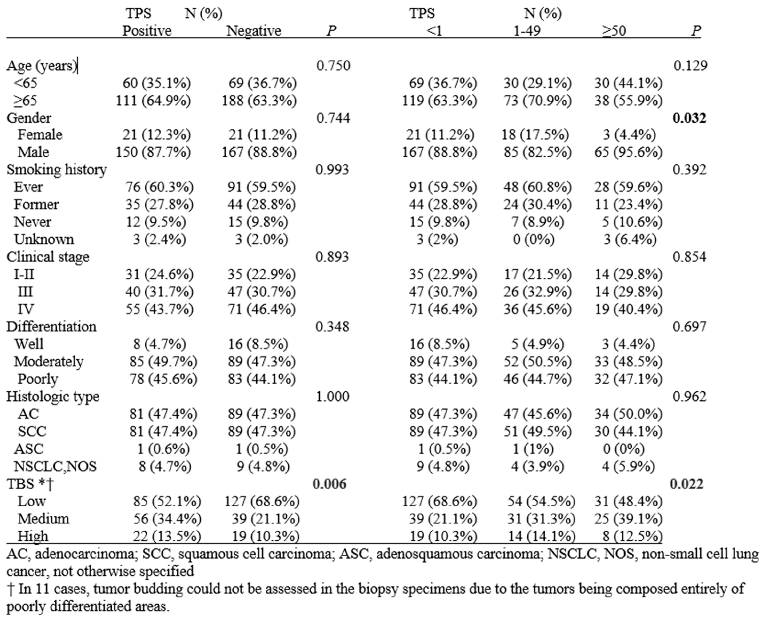 |
Table 5.
Comparison of PD-L1-CPS score and clinicopathological findings.
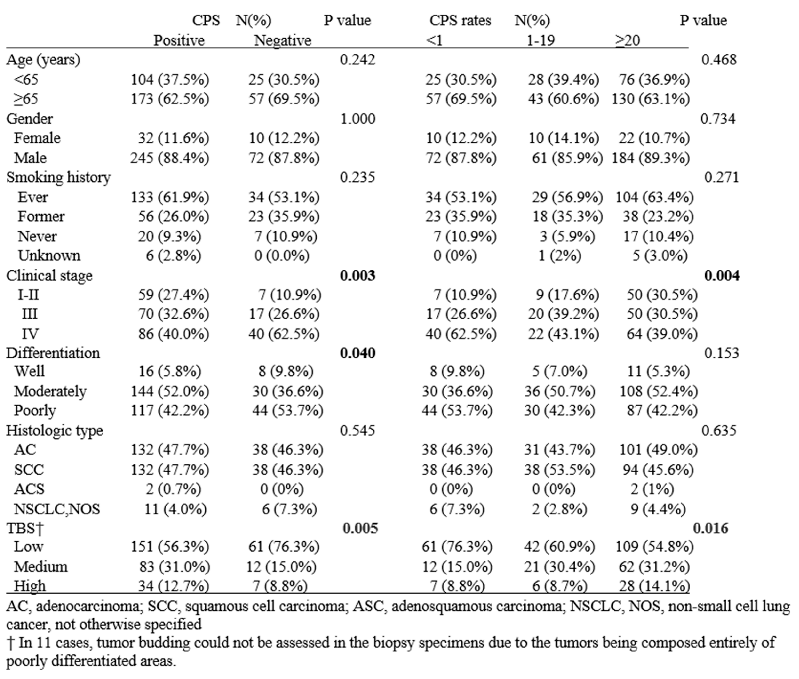 |
Table 6.
Comparison of PD-L1-ICS score and clinicopathological findings.
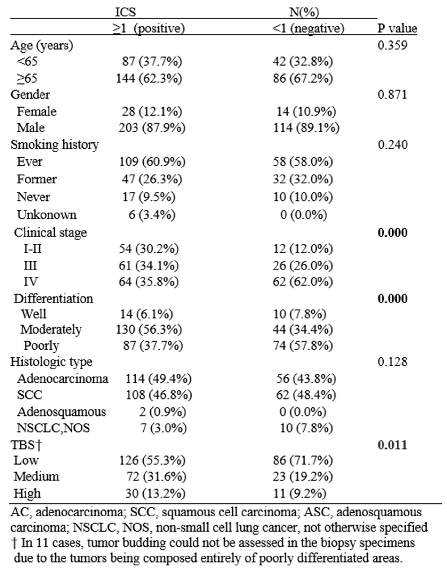 |
Table 7.
Univariate and Multivariate Analyses of Prognostic Variables Associated with the Overall Survival.
Table 7.
Univariate and Multivariate Analyses of Prognostic Variables Associated with the Overall Survival.
 |
Disclaimer/Publisher’s Note: The statements, opinions and data contained in all publications are solely those of the individual author(s) and contributor(s) and not of MDPI and/or the editor(s). MDPI and/or the editor(s) disclaim responsibility for any injury to people or property resulting from any ideas, methods, instructions or products referred to in the content. |
© 2026 by the authors. Licensee MDPI, Basel, Switzerland. This article is an open access article distributed under the terms and conditions of the Creative Commons Attribution (CC BY) license (http://creativecommons.org/licenses/by/4.0/).
Copyright: This open access article is published under a Creative Commons CC BY 4.0 license, which permit the free download, distribution, and reuse, provided that the author and preprint are cited in any reuse.