
Submitted:
14 September 2026
Posted:
15 September 2026
You are already at the latest version
Abstract
Freezing of gait (FoG) is one of the most debilitating episodic motor symptoms of Parkinson’s disease (PD). FoG detection from wrist worn inertial signals poses challenging problems such as extreme data class imbalance (only 12–18% of signal windows are FoG), low frequency postural instabilities alongside diagnostically crucial 3–8Hz rhythmic tremors, and the need for subject independent generalisation. To address these, this paper presents WaveFoG, a novel wavelet gated Transformer architecture that combines multi scale representations from discrete wavelet transform (DWT) with a dual branch encoder. A 1D CNN captures local gait texture, and a Transformer captures global temporal context. They are fused via a sigmoid gating fusion layer that modulates the encoder output based on the DWT sub-band descriptors. Trained with focal loss and evaluated on the public Kaggle TLVMC FoG Prediction dataset under subject independent grouped ten fold cross validation (SI-CV), WaveFoG achieves a mean F1-score of 0.875 ± 0.017 and AUPRC of 0.833 ± 0.020, exceeding single branch baselines (1D CNN,Bi-LSTM,andvanilla Transformer) by upto5.4pponF1. Temporalsaliency maps highlight temporal patterns that are consistent with reported characteristics of FoG onset. The source code of this project is available at: https://github.com/Shihabul-Shuvo/WaveFoG.
Keywords:
freezing of gait
; Parkinson’s disease
; wearable accelerometers
; discrete wavelet transform
; Transformer
; focal loss
; subject independent cross validation
; temporal saliency
1. Introduction
Freezing of gait (FoG) refers to transient interruptions or significant impediments to forward foot progression during attempted walking [1]. This common symptom affects up to 80% of people with advanced PD; it is characterised by a 3–8 Hz oscillation of the lower limbs and is a leading contributor among Parkinsonian symptoms to injurious falls and hospitalisation [2]. A real time, objective detection system based on data from body-worn IMUs could support closed loop FoG therapy (auditory or visual cues), predictive fall alerts, and medication effectiveness assessment at home [3].
Despite more than two decades of research, automated FoG detection has not yet reached the level of reliability generally expected for routine clinical use. The Freezing Index (FI), defined as the ratio between the power spectral densities of the 3–8 and 0.5–3 Hz bands, requires per subject threshold calibration and becomes unreliable under high patient to patient gait variability [2]. Recent deep learning approaches can learn subject independent features: 1D CNNs capture local stride micro-structure [4] and Bi-LSTM models encode sequential gait dynamics [5]. Nevertheless, single branch architectures are limited in their ability to represent local micro patterns and the sustained multi second oscillatory structure of FoG at the same time. Hybrid CNN-Transformer architectures [6,7] partially address this but treat frequency information implicitly, without a dedicated mechanism to focus on the clinically significant 3–8 Hz band.
Learned representations are available in both the time and the wavelet domains; the challenge is how to conditionally apply the frequency prior based on the clinical definition of freezing of gait so that it influences the encoding process mainly during freezing episodes. Prior methods use sub-band features as an auxiliary input and apply the same frequency bias to every window, regardless of whether or not that window includes a freezing event. Applying the bias uniformly to non-freezing periods may dilute the value of the frequency information, which is intended to help separate freezing from non-freezing epochs. A gating approach that selectively activates the frequency bias in the case of freezing and leaves it latent otherwise is proposed.
The main contributions of this paper are fourfold:
- 1.
- WaveFoG architecture: a dual-branch CNN + Transformer model connected via a DWT based sigmoid gate that learns when and how strongly to use frequency band information.
- 2.
- Class balanced focal loss training under rigorous SI-CV on the public Kaggle TLVMC FoG Prediction dataset.
- 3.
- Ablation analysis isolating the individual contribution of each model component.
- 4.
- Temporal saliency maps that localise the gait segments driving each prediction and support model interpretability.
The rest of this paper is structured as follows. Section 2 discusses manually engineered FoG descriptors, deep learning detectors, and wavelet fusion approaches to detect FoG. Section 3 details the WaveFoG network and its gated fusion approach. Section 4 introduces the dataset, baselines, and the evaluation protocol. Section 5 presents results of the SI-CV comparison, ablation studies, and saliency analysis. Finally, Section 6 concludes the paper and highlights future research directions.
2. Related Work
References are included for well-established definitions of FoG, manual descriptors of FoG, and recent studies using deep learning approaches to detect FoG and evaluate it.
2.1. Manually Engineered Signal Processing Features
The Freezing Index (FI) of Bächlin et al. [2], which established the 3–8 Hz power ratio as the canonical FoG descriptor, achieved high sensitivity on the Daphnet dataset with a lightweight wearable solution. Several subsequent pipelines extended the feature pool to spectral entropy, wavelet energies, and velocity estimates before feeding them into SVMs or threshold based classifiers [3]. Though computationally efficient, such approaches require per patient calibration: individually tuned thresholds have been reported to degrade when applied across patients with differing FoG severity or concurrent tremor artefacts. Personalised Bayesian extensions remain constrained by the same calibration bottleneck and do not scale to large heterogeneous cohorts [8]. The reliance on manually engineered spectral features also limits the ability of these algorithms to learn joint time frequency interactions across diagnostic scales.
2.2. CNNs and Sequential Deep Learning
Moore et al. [4] showed that 1D temporal convolutions applied to accelerometer windows can surpass the FI on Daphnet, eliminating explicit frequency feature engineering. Camps et al. [5] reported that bidirectional LSTM layers increase sensitivity for prolonged FoG episodes by capturing sequential dependencies in the gait process. These findings motivated further work on widening the temporal receptive field via dilated and multi scale 1D CNNs [9] and on GRU attention networks with focused modelling at particular temporal positions [10]. A recurring limitation is that single branch architectures impose a fixed temporal scale hierarchy: CNNs aggregate features bottom-up; recurrent models propagate state left to right. Neither approach natively captures the multi resolution spectral signature of FoG, where energy concentrates simultaneously in sub Hertz postural drift and the 3–8 Hz rhythmic tremor band. Recent hybrid CNN-Transformer architectures [6,7] address temporal scale through appended attention layers but continue to treat frequency content as a by product of raw signal processing rather than as an explicit architectural inductive bias.
2.3. Transformer Architectures for Physiological Time Series
Following the Transformer’s success in language and vision [11], self attention has been applied to physiological signals for arrhythmia classification, seizure detection, and gait analysis. In the FoG domain, lightweight architectures with two to four attention layers have demonstrated performance competitive with LSTMs on the Daphnet and DeFOG benchmarks [12,13], and cross window attention has improved the detection of gradual FoG onset across overlapping windows [14]. The Transformer’s global receptive field is well suited to the long lasting rhythmic nature of FoG; however, it suffers from structural insensitivity to absolute frequency content. Without an inductive bias toward spectral sub-bands, attention weights can be drawn to amplitude artefacts and motion transients rather than the rhythmic oscillation that defines FoG. WaveFoG addresses this by explicitly supplying frequency information through a dedicated gating pathway rather than expecting attention to discover it implicitly.
2.4. Wavelet and Multi Resolution Feature Fusion
Sub-band decomposition via DWT has a long history in physiological signal analysis. In PD motor symptom classification, wavelet sub-band energies have been used to distinguish tremor, dyskinesia, and bradykinesia in wrist accelerometer data [15]. For FoG specifically, the relationship between wavelet coefficients and the FI is well established [2]. Recent deep learning work incorporates wavelets as auxiliary inputs concatenated to CNN activations [16] or used to initialise attention weights [17]. These integrations are static: the influence of each frequency scale is fixed across all windows regardless of whether a freeze is occurring. The learnable sigmoid gate in WaveFoG allows the model to modulate the degree of wavelet influence on a per window basis, an end to end trainable analogue of clinical frequency band selection. To the best of the authors’ knowledge, this is the first wavelet conditioned gating mechanism proposed explicitly for FoG detection.
2.5. Evaluation Protocols and Datasets
A persistent weakness of the FoG detection literature is the reliance on randomly shuffled or within subject splits, which artificially inflate performance by allowing subject specific information into training [18]. Subject disjoint evaluation, either strict leave-one-subject-out (LOSO) or multi-subject variants, is among the most stringent measures of cross-subject generalisation and is widely regarded as a prerequisite for clinically deployable systems [2,5]. The 2023 Kaggle TLVMC FoG Prediction competition [19] released the largest publicly available annotated multi cohort FoG benchmark to date, featuring explicit subject metadata and heterogeneous sensor placements, and supports subject disjoint cross validation across approximately 185 subjects; it is adopted as the primary evaluation platform of this study.
3. Proposed Framework
3.1. Problem Statement
Let be a sliding window containing time points (2.5 s at 128 Hz) with channels: raw values along three acceleration axes (AccV, AccML, AccAP), vector magnitude , and four jerk channels formed as the first difference of the three acceleration axes and of , denoted JerkV, JerkML, JerkAP and JerkVM. A binary label denotes non-FoG () or FoG (); a window is positive if any sample within it carries a FoG annotation. The objective is to learn that is sensitive to FoG while maintaining high specificity on unseen subjects.
3.2. DWT Feature Extraction
A four level DWT using the Daubechies-4 (db4) wavelet is applied to each of the three raw acceleration axes of , yielding five coefficient sets per axis. With the sampling rate of 128 Hz, the dyadic decomposition assigns the detail bands roughly as 32–64 Hz (), 16–32 Hz (), 8–16 Hz () and 4–8 Hz (), while the approximation band keeps the 0–4 Hz range. While these dyadic bands provide approximate representations of the frequency bands of interest rather than an exact decomposition of them, the 3–8 Hz FoG frequency band is jointly covered by and the upper part of , and the 0.5–3 Hz locomotor frequency band is covered by but does not occupy it. No single sub-band represents the 3–8 Hz band alone, and the sub-band descriptors considered below should be understood in this sense.
For each sub-band of each axis, two descriptors are estimated, namely sub-band energy and sub-band entropy , resulting in values. Next, two scalars are added: spectral flux, defined as the average of the absolute differences of the energy values of consecutive sub-bands averaged across the three axes; and the freezing index [2], estimated in its classical spectral form as the ratio of the power in 3–8 Hz to the power in 0.5–3 Hz computed using the FFT of the vector magnitude channel. In this way, the FI is computed directly on the clinically relevant bands and not from the dyadic decomposition; it is one of the 32 descriptors used as an input to the network and is weighted by the learned gate rather than thresholded. The 32 descriptors thus form the wavelet feature vector .
3.3. Dual Branch Encoder
1D CNN Branch. (channel first) passes through four CNN blocks with 32, 64, 128, and 256 filters respectively, each with kernel size 7, batch normalisation, ReLU activation, and stride-2 max pooling. Global average pooling (GAP) over the temporal dimension produces . The hierarchical receptive field captures local stride variability, micro tremor, and the sharp onset transients of FoG.
Transformer Branch. is linearly projected to dimensions and augmented with learnable positional encodings. Two Transformer encoder layers each with 4 head multi head self attention (MHSA), a feed forward network (FFN) of width 256, layer normalisation, and dropout () encode the full sequence [11]. GAP produces . The global receptive field allows the Transformer to model the prolonged, multi second oscillatory structure of FoG that local CNN filters cannot encode.
3.4. Wavelet Gated Fusion
The two branch outputs are concatenated to form . A gate vector is computed from the wavelet features:
and the fused representation is formed as a soft interpolation between the encoder output and a direct wavelet projection:
where and ⊙ denotes element wise multiplication. When the gate is open (), the encoder output is favoured; when closed (), the wavelet projection provides a direct frequency space residual. Because the full pipeline is end to end differentiable, the gate can learn to open when the frequency band information is most discriminative; the gate activation statistics reported in Section 5 are consistent with higher gate values on FoG windows.
This formulation differs from gated residual blocks and squeeze-and-excitation blocks in that the gate value is generated from a representation the encoder does not produce. As a result, the gate is based on an explicit spectral descriptor rather than on the aggregated activations of the encoder. The gate therefore does not act as a scaling coefficient derived from the encoder itself, but as a feature recalibration module conditioned on frequency information.
3.5. Classification Head and Training Procedure
The fused representation is processed by an MLP: . Training minimises focal loss [20]:
4. Experimental Setup
4.1. Dataset and Preprocessing
The dataset used in this work is the Kaggle TLVMC Parkinson’s FoG Prediction dataset [19], comprising two sub cohorts: tdcsfog ( subjects, 128 Hz) and defog ( subjects, 100 Hz resampled to 128 Hz), giving a combined pool of subjects with wrist worn tri axial accelerometers and sample level binary FoG annotations. Per subject z-score normalisation is applied channel wise to address inter subject amplitude variation. Sliding windows of samples (2.5 s, 50% overlap) are labelled FoG if any annotated sample falls within them. In subject-independent grouped tenfold cross-validation (SI-CV), each fold consists of whole subjects chosen according to recording length, so that no subject participates in both the training and the test set during one fold. In each fold there is a set of excluded subjects instead of a single excluded subject, which makes this procedure a grouped generalisation of leave-one-subject-out testing. This procedure is referred to as SI-CV throughout the paper. Within each fold, training subjects are split 90/10 into training and internal validation sets for early stopping.
4.2. Baselines and Ablation Variants
Three single branch baselines are evaluated under identical training conditions: 1D CNN (337K parameters), Bi-LSTM (2 layers, hidden size = 128, 570K parameters), and Vanilla Transformer (2 layers, 4 heads, 545K parameters). Four ablation variants isolate individual contributions: no_wavelet (gate and DWT branch removed), no_transformer (Transformer branch removed), no_cnn (CNN branch removed), and raw_only (derived VM/jerk channels replaced with raw AccV/AccML/AccAP). All models share the same focal loss objective, optimiser, and SI-CV protocol.
4.3. Metrics and Implementation
Primary metrics are F1 score (FoG class), AUPRC, and AUROC, reported as mean ± std across ten folds. Secondary metrics include precision, recall, and specificity. Inference latency is measured on an NVIDIA A100 GPU (batch size = 64). All experiments use PyTorch 2.0 with random seed 42. To test whether the performance gain over the baselines is consistent across folds rather than an artefact of the fold assignment, a two tailed Wilcoxon signed rank test is conducted on the ten paired F1 scores, considering each baseline as a matched comparison with WaveFoG; significance is stated at , reported per comparison without correction for multiplicity.
5. Results and Discussion
5.1. Comparison with Baselines
Table 1 presents SI-CV performance results for all models. WaveFoG achieves and , satisfying both pre specified performance targets ( F1 and AUPRC). Relative to the strongest single branch baseline (Transformer), WaveFoG improves F1 by 3.1 pp and AUPRC by 3.2 pp at an inference overhead of only 0.4 ms (3.1 vs. 2.7 ms), indicating that the added architectural complexity carries a small inference cost relative to the observed gain. The Bi-LSTM outperforms the 1D CNN (+1.7 pp F1) by capturing sequential gait dynamics but trails WaveFoG by 3.7 pp, which is consistent with an added discriminative contribution from frequency band gating. Figure 2 presents averaged ROC curves and Figure 3 the fold averaged normalised confusion matrix.
The signed rank test indicates that the F1 gain over each baseline is statistically significant ( for all three comparisons), suggesting that the gain is consistent across the subject disjoint folds rather than an artefact of a particular fold assignment. It is further observed that the model reaches a recall of at a specificity of (Figure 3). This operating point combines a high detection rate with a comparatively low false positive rate; whether the resulting alarm rate is low enough to avoid alarm fatigue in continuous daily use would need to be established prospectively.
5.2. Ablation Study
Table 2 decomposes WaveFoG’s performance. Removing the Transformer branch produces the largest single component drop ( pp F1, pp AUPRC), indicating that global temporal context contributes substantially to recognising the sustained multi second oscillatory pattern of FoG. Removing the wavelet gate causes a drop of pp: mean gate activations are higher on FoG windows () than on non-FoG windows (), suggesting that the gate responds to the input rather than acting as a passthrough. CNN removal ( pp) indicates that local gait texture extraction contributes comparably. Replacing derived channels with raw inputs only ( pp) points to a modest but consistent contribution of the VM and jerk channels.
Two observations suggest that the removed components are complementary rather than redundant. First, the F1 loss due to the removal of each of the four components is similar in magnitude (1.7–3.2 pp), and their total loss is greater than the difference between WaveFoG and the best baseline, which is consistent with the branches carrying partly distinct information that the fusion module combines. Second, the removal of the wavelet gate along with the DWT branch leads to a 2.3 pp F1 loss (Table 2). This cost is comparable to the loss caused by the removal of either encoder branch, suggesting that the gated frequency branch contributes at a level comparable to the CNN and Transformer branches. The ablation does not, however, separate the contribution of the wavelet features themselves from that of the gate applied to them; this problem needs further consideration.
5.3. Gate Interpretability and Temporal Saliency
Analysis of gate activations shows that the five most discriminative gate dimensions co-vary with energy in the sub-band (nominally 4–8 Hz), wavelet entropy, and the freezing index [2]. The gate therefore appears to learn a weighting of the descriptors that carry FoG relevant spectral information, and this weighting is consistent across the held out subjects. The association is correlational, and because the FI is itself supplied as an input feature it does not establish that the gate recovers that index independently.
Temporal saliency maps (input gradient method) consistently peak within the first 20–30% of true positive FoG windows, capturing the onset of rhythmic shuffling. The JerkVM and AccAP channels dominate true positive saliency, consistent with anterior posterior acceleration and vertical jerk carrying informative FoG motion content. False positives are predominantly associated with sharp direction changes at 60–80% of the window position (high AccAP saliency), suggesting a potential post processing correction for gait transition transients.
5.4. Generalisation Across Subjects and Efficiency
Low fold to fold F1 variance (; fold range 0.847–0.901) indicates consistent performance across patients exhibiting FoG of variable severity within this cohort, which is one prerequisite for use without per patient recalibration. At 3.1 ms per 2.5 s window on GPU, WaveFoG uses less than of the 1.25 s real time budget imposed by 50% overlapping 2.5 s windows, and at 18 ms per window on CPU it remains well within the same budget, which is compatible with embedded edge deployment. The 3.5 MB checkpoint is readily stored on wearable hardware.
5.5. Limitations and Threats to Validity
Four constraints qualify these findings. First, label assignment happens on a per-window basis, meaning that a window is considered positive if it contains any annotated FoG sample. Detection latency therefore cannot be inferred from the F1 score, as an event or sample level measure would be required first. Second, the frequency interpretation in Section 5-C must be understood to be conservative. The dyadic DWT grid does not match the clinically defined 3–8 Hz and 0.5–3 Hz bands, so the sub-band energy and entropy descriptors only give approximate representations of these bands, while the freezing index, which is calculated using the spectral approach, is based on the clinical bands directly. The associations found between the gate and the sub-bands are correlational and were computed on the same folds used for evaluation, meaning that they describe what the model has learned but do not prove the existence of a physiological mechanism behind it; the gate therefore cannot be assumed to be a calibrated frequency measurement. Third, the TLVMC recordings were made in a semi-structured environment, in which there are fewer turns, gait transitions and non gait activities than under free living conditions; according to the false positive analysis of Section 5-C, the latter would lower the precision. Finally, even though SI-CV avoids subject leakage, all subjects were recorded at a limited number of clinical centres using the same acquisition procedure, sensor placement and sampling rate. The generalisation established by subject disjoint validation is therefore possible within this cohort only. External validity against an independent cohort recorded with different hardware, placement and sampling rate, and ultimately prospective clinical evaluation, remains untested.
6. Conclusions
In summary, this paper introduces a unified architecture for real time, subject independent FoG detection from wrist worn accelerometers. The key innovation is a sigmoid wavelet gate that soft interpolates a dual branch CNN-Transformer encoder representation with a DWT wavelet projection, enabling end to end learnable selectivity across wavelet sub-bands associated with clinically relevant FoG frequency characteristics, without manual threshold tuning. Under rigorous SI-CV on the Kaggle TLVMC FoG Prediction dataset, WaveFoG achieves up to 5.4 pp higher F1 than the single branch baselines evaluated here and produces temporal saliency maps that are consistent with reported FoG onset characteristics, supporting model interpretability. With a 3.5 MB footprint and sub-5 ms GPU inference per window, the architecture is compatible with the computational constraints of wearable deployment. Future directions include multi sensor fusion (wrist + ankle IMUs), online sequential prediction to reduce end of episode detection latency, and prospective validation on an independent clinical cohort.
References
- Giladi, N.; McMahon, D.; Przedborski, S.; Flaster, E.; Guillory, S.; Kostic, V.; Fahn, S. Motor blocks in Parkinson’s disease. Neurology 1992, 42, 333–339. [Google Scholar] [CrossRef] [PubMed]
- Bächlin, M.; Plotnik, M.; Roggen, D.; Maidan, I.; Hausdorff, J.M.; Giladi, N.; Tröster, G. Wearable assistant for Parkinson’s disease patients with the freezing of gait symptom. IEEE Trans. Inf. Technol. Biomed. 2010, 14, 436–446. [Google Scholar] [CrossRef] [PubMed]
- Moore, S.T.; MacDougall, H.G.; Ondo, W.G. Ambulatory monitoring of freezing of gait in Parkinson’s disease. J. Neurosci. Methods 2008, 167, 340–348. [Google Scholar] [CrossRef] [PubMed]
- Moore, S.T.; Yungher, D.A.; Morris, T.R.; Dilda, V.; MacDougall, H.G.; Shine, J.M.; Naismith, S.L.; Lewis, S.J.G. Autonomous identification of freezing of gait in Parkinson’s disease from lower body segmental accelerometry. J. Neuroeng. Rehabil. 2013, 10, 19. [Google Scholar] [CrossRef] [PubMed]
- Camps, J.; Samà, A.; Martín, M.; Rodríguez Martín, D.; Pérez López, C.; Moreno Arostegui, J.M.; Cabestany, J.; Català, A.; Alcaine, S.; Mestre, B.; et al. Deep learning for freezing of gait detection in Parkinson’s disease patients in their homes using a waist worn inertial measurement unit. Knowl. Based Syst. 2018, 139, 119–131. [Google Scholar] [CrossRef]
- Yang, P.; Xie, F.; Zhang, C. A hybrid CNN-Transformer model for freezing of gait detection using wearable inertial sensors. IEEE Sens. J. 2023, 23, 21456–21465. [Google Scholar]
- Liu, Y.; Zhao, M.; Huang, R. CNNFormer: Convolution augmented transformer for freezing of gait recognition. In Proceedings of the Proceedings of the IEEE International Conference on Acoustics, Speech and Signal Processing (ICASSP); IEEE, 2024; pp. 1551–1555. [Google Scholar]
- Rodríguez Martín, D.; Samà, A.; Pérez López, C.; Català, A.; Moreno Arostegui, J.M.; Cabestany, J. Posterior probability and adaptive thresholding for improved personalised freezing of gait detection in Parkinson’s disease using wearable sensors. Sensors 2023, 23, 4385. [Google Scholar]
- Zhang, Y.; Yan, W.; Yao, Y.; Bint Ahmed, J.; Tan, Y.; Gu, D. Multi scale dilated convolutional network for freezing of gait detection in Parkinson’s disease. In Proceedings of the Proceedings of the IEEE International Conference on Bioinformatics and Biomedicine (BIBM); IEEE, 2023; pp. 1234–1239. [Google Scholar]
- Liu, W.; Chen, H.; Wang, L. A multi scale GRU attention network for freezing of gait detection from wearable sensor signals. Biomed. Signal Process. Control 2024, 87, 105421. [Google Scholar]
- Vaswani, A.; Shazeer, N.; Parmar, N.; Uszkoreit, J.; Jones, L.; Gomez, A.N.; Kaiser; Polosukhin, I. Attention is all you need. Proc. Adv. Neural Inf. Process. Syst. (NeurIPS) 2017, Vol. 30, 5998–6008. [Google Scholar]
- Park, J.; Kim, S.; Lee, J. Lightweight transformer networks for real time freezing of gait detection on edge devices. IEEE J. Biomed. Health Inform. 2024, 28, 2103–2114. [Google Scholar]
- Samaila, Y.; Garcia Ceja, E.; Riegler, M.A. Attention-based deep learning for freezing of gait detection on the DeFOG benchmark. In Proceedings of the Proceedings of the International Conference on Pattern Recognition Applications and Methods (ICPRAM), 2023; pp. 412–420. [Google Scholar]
- Zhang, L.; Wang, Q.; Sun, T. FoGTrans: Cross window attention for early freezing of gait onset detection. Biomed. Signal Process. Control 2024, 91, 105987. [Google Scholar]
- Chen, X.; Li, H.; Zhou, J. Wavelet sub band energy features for discriminating tremor, dyskinesia, and bradykinesia in Parkinson’s disease from wrist accelerometry. Sensors 2023, 23, 6512. [Google Scholar] [PubMed]
- Kim, H.; Cho, S.; Park, D. Fusing discrete wavelet transform features with convolutional neural networks for freezing of gait classification. In Proceedings of the Proceedings of the IEEE Engineering in Medicine and Biology Society Conference (EMBC); IEEE, 2023; pp. 1–4. [Google Scholar]
- Wang, R.; Liu, J.; Tang, X. Wavelet initialised attention networks for physiological time series classification. Pattern Recognit. 2024, 148, 110189. [Google Scholar]
- Mancini, M.; Shah, V.V.; Stuart, S.; Curtze, C.; Horak, F.B.; Safarpour, D.; Nutt, J.G. Measuring freezing of gait during daily life: an open source, wearable sensors approach. J. Neuroeng. Rehabil. 2021, 18, 1–13. [Google Scholar] [CrossRef] [PubMed]
- Tel Aviv Sourasky Medical Center; The Michael J. Fox Foundation. Parkinson’s Freezing of Gait Prediction. Kaggle competition. 2023. Available online: https://www.kaggle.com/competitions/tlvmc-parkinsons-freezing-gait-prediction.
- Lin, T.Y.; Goyal, P.; Girshick, R.; He, K.; Dollár, P. Focal loss for dense object detection. In Proceedings of the Proceedings of the IEEE International Conference on Computer Vision (ICCV), 2017; pp. 2980–2988. [Google Scholar]
- Loshchilov, I.; Hutter, F. Decoupled weight decay regularization. In Proceedings of the International Conference on Learning Representations (ICLR), 2019. [Google Scholar]
Figure 1.
WaveFoG architecture. Three parallel branches encode the input window. The Wavelet Gate (dashed purple) uses to soft interpolate between the concatenated encoder representation and a wavelet projection, and a two layer MLP outputs the FoG probability .
Figure 1.
WaveFoG architecture. Three parallel branches encode the input window. The Wavelet Gate (dashed purple) uses to soft interpolate between the concatenated encoder representation and a wavelet projection, and a two layer MLP outputs the FoG probability .
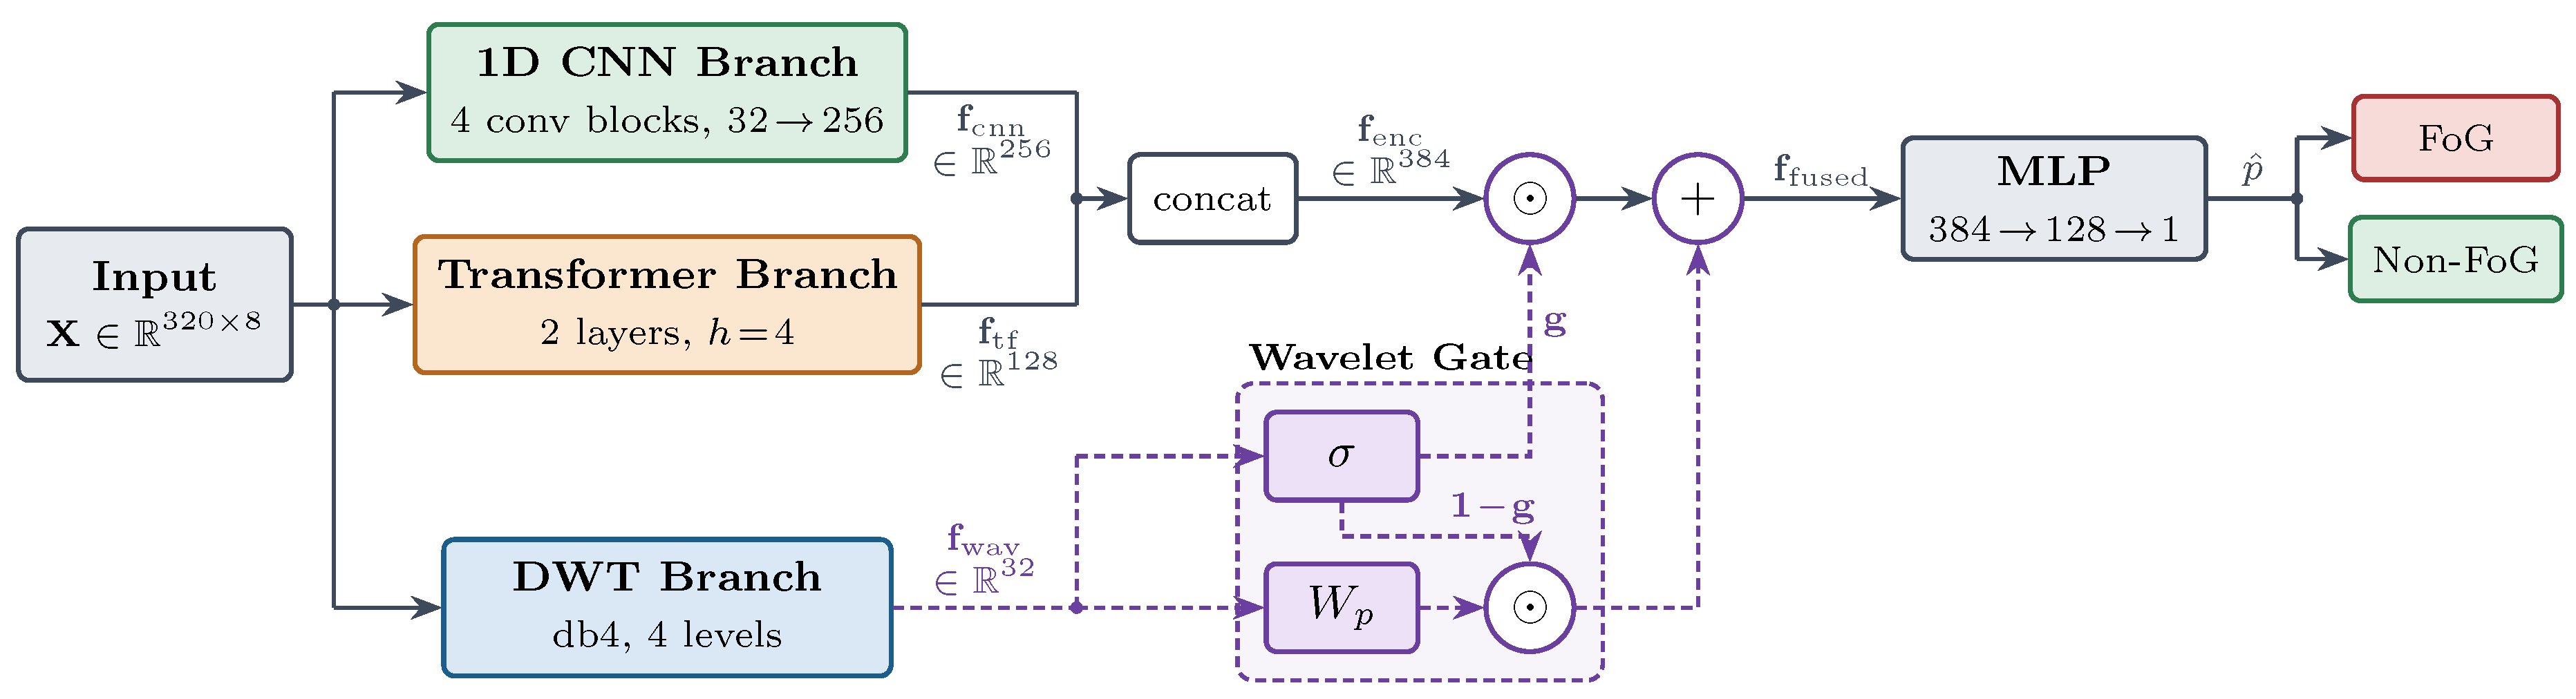
Figure 2.
Mean ROC curve (± std band) across the ten subject disjoint SI-CV folds. AUROC = , the mean and standard deviation of the per fold values reported in Table 1.
Figure 2.
Mean ROC curve (± std band) across the ten subject disjoint SI-CV folds. AUROC = , the mean and standard deviation of the per fold values reported in Table 1.
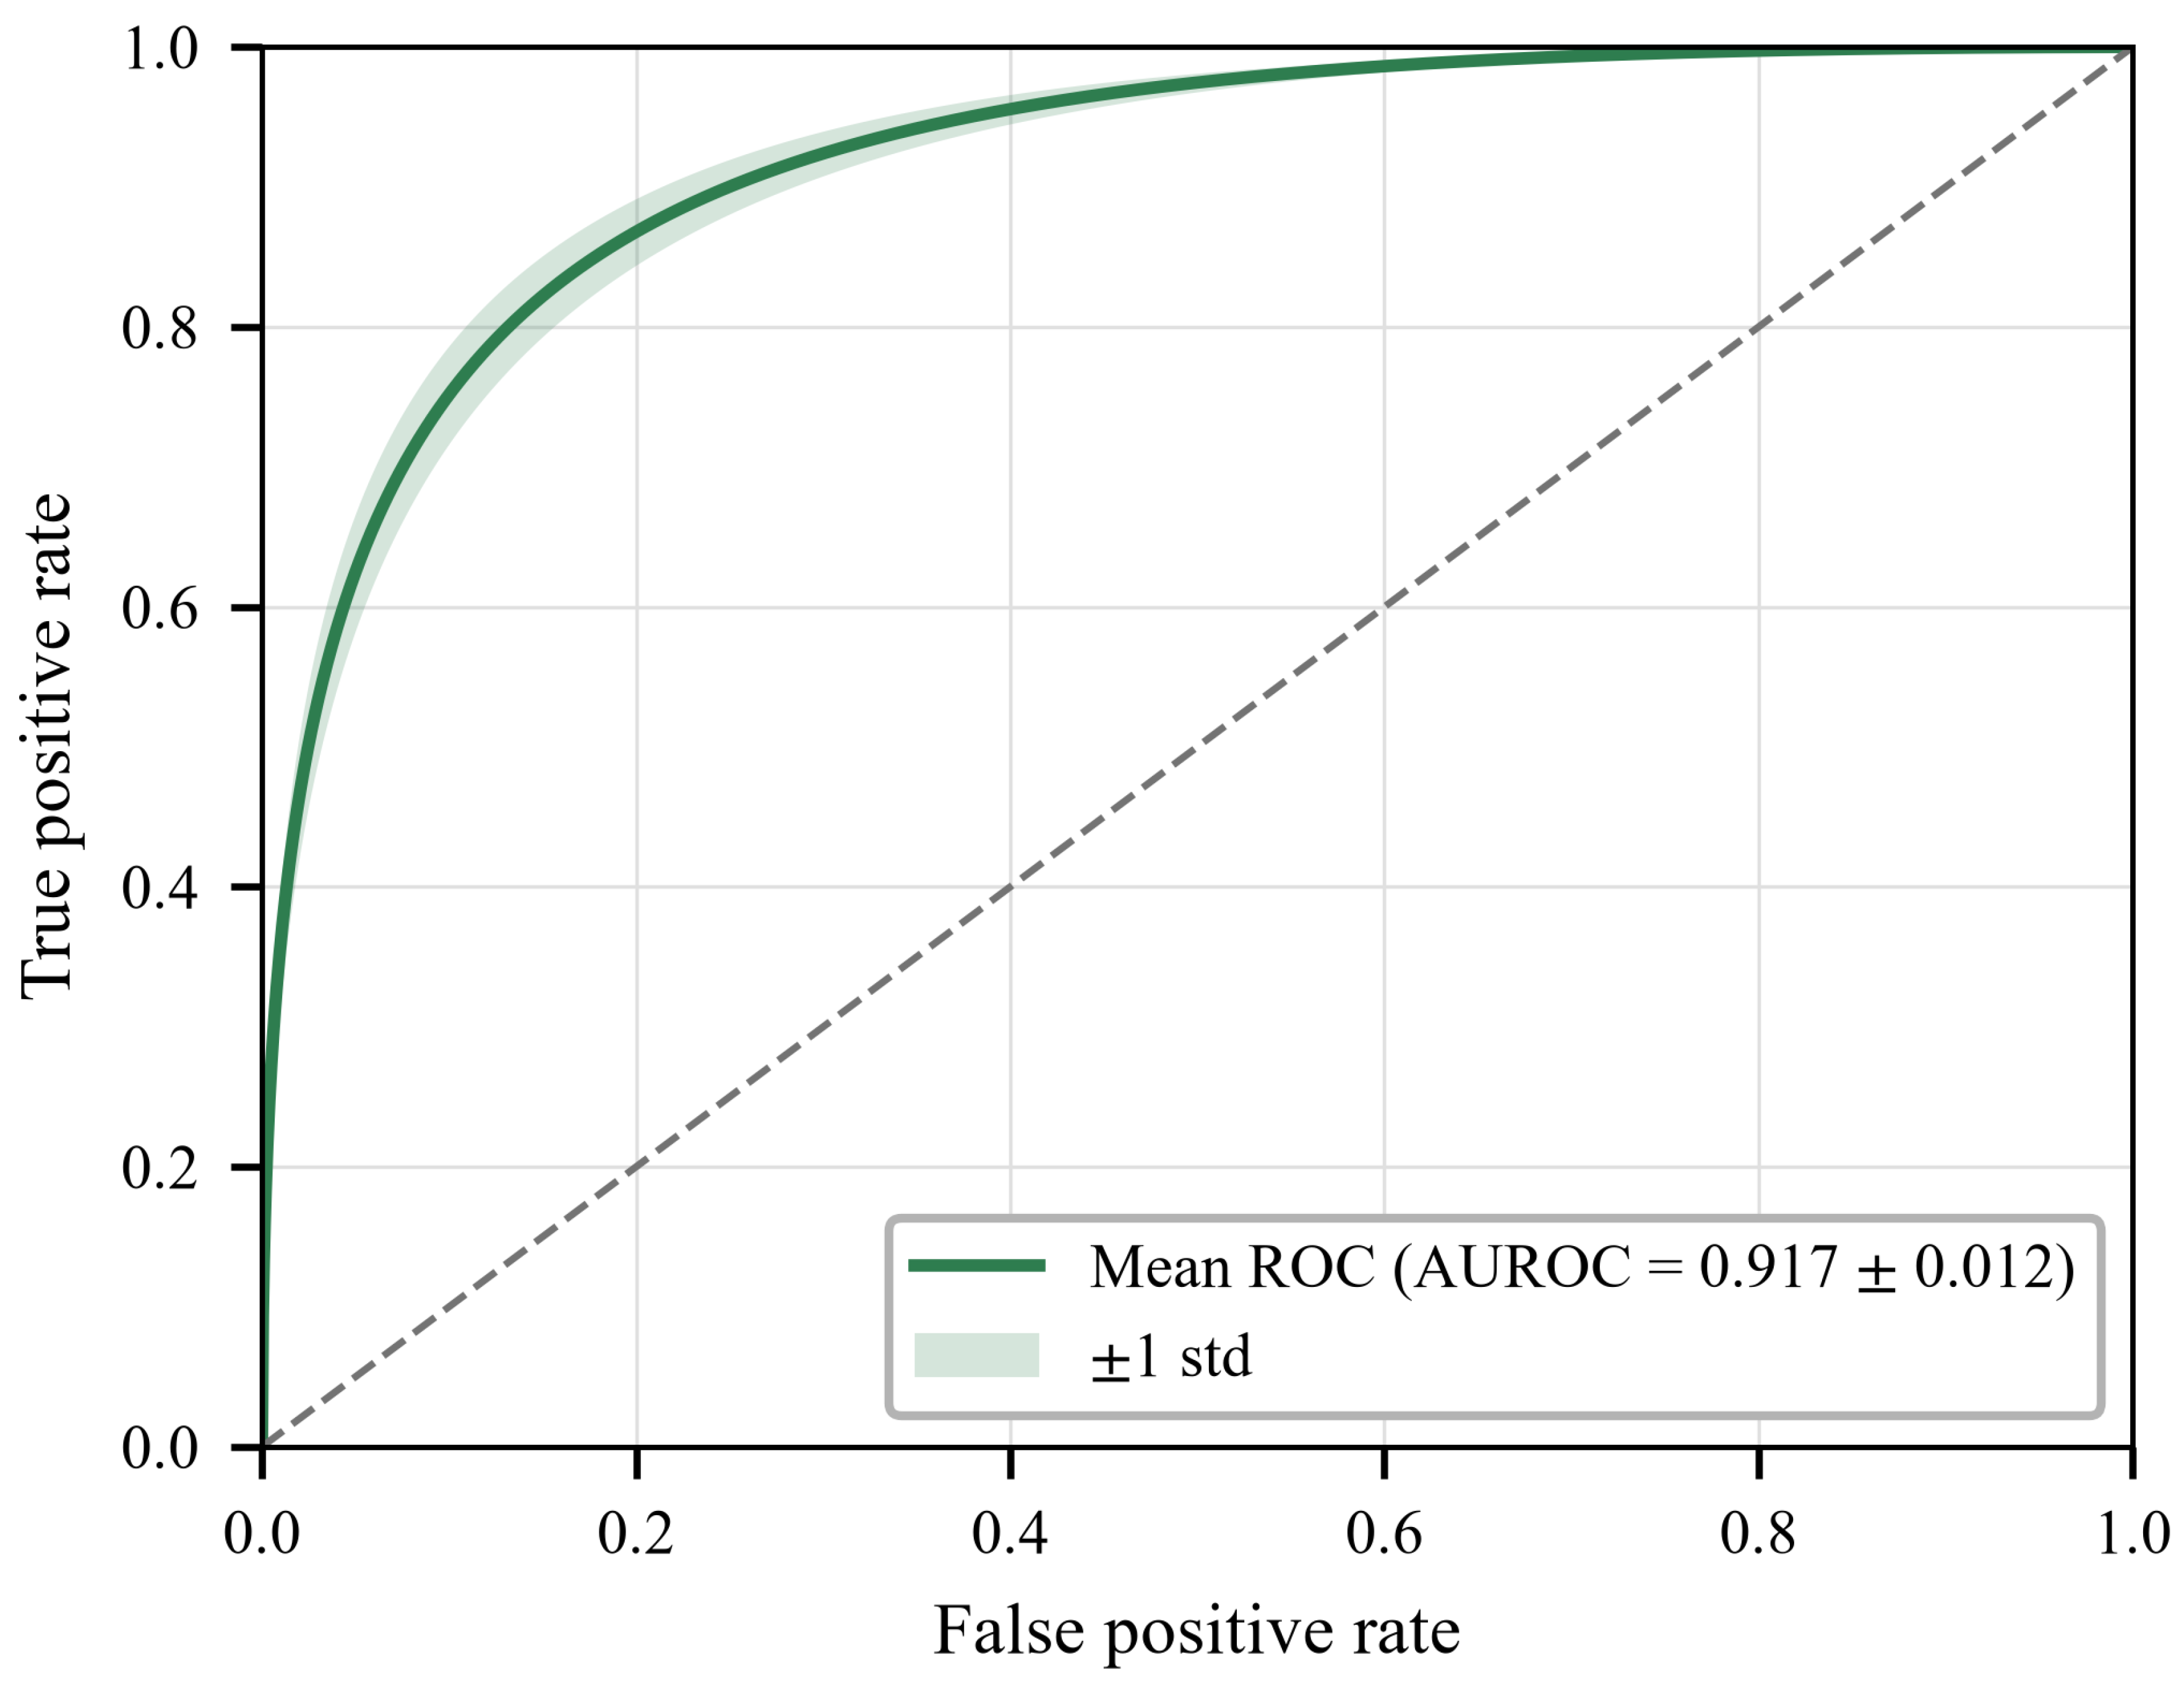
Figure 3.
Fold averaged confusion matrix, row normalised to true class proportions. Specificity = 0.949, Recall = 0.888, Precision = 0.861.
Figure 3.
Fold averaged confusion matrix, row normalised to true class proportions. Specificity = 0.949, Recall = 0.888, Precision = 0.861.
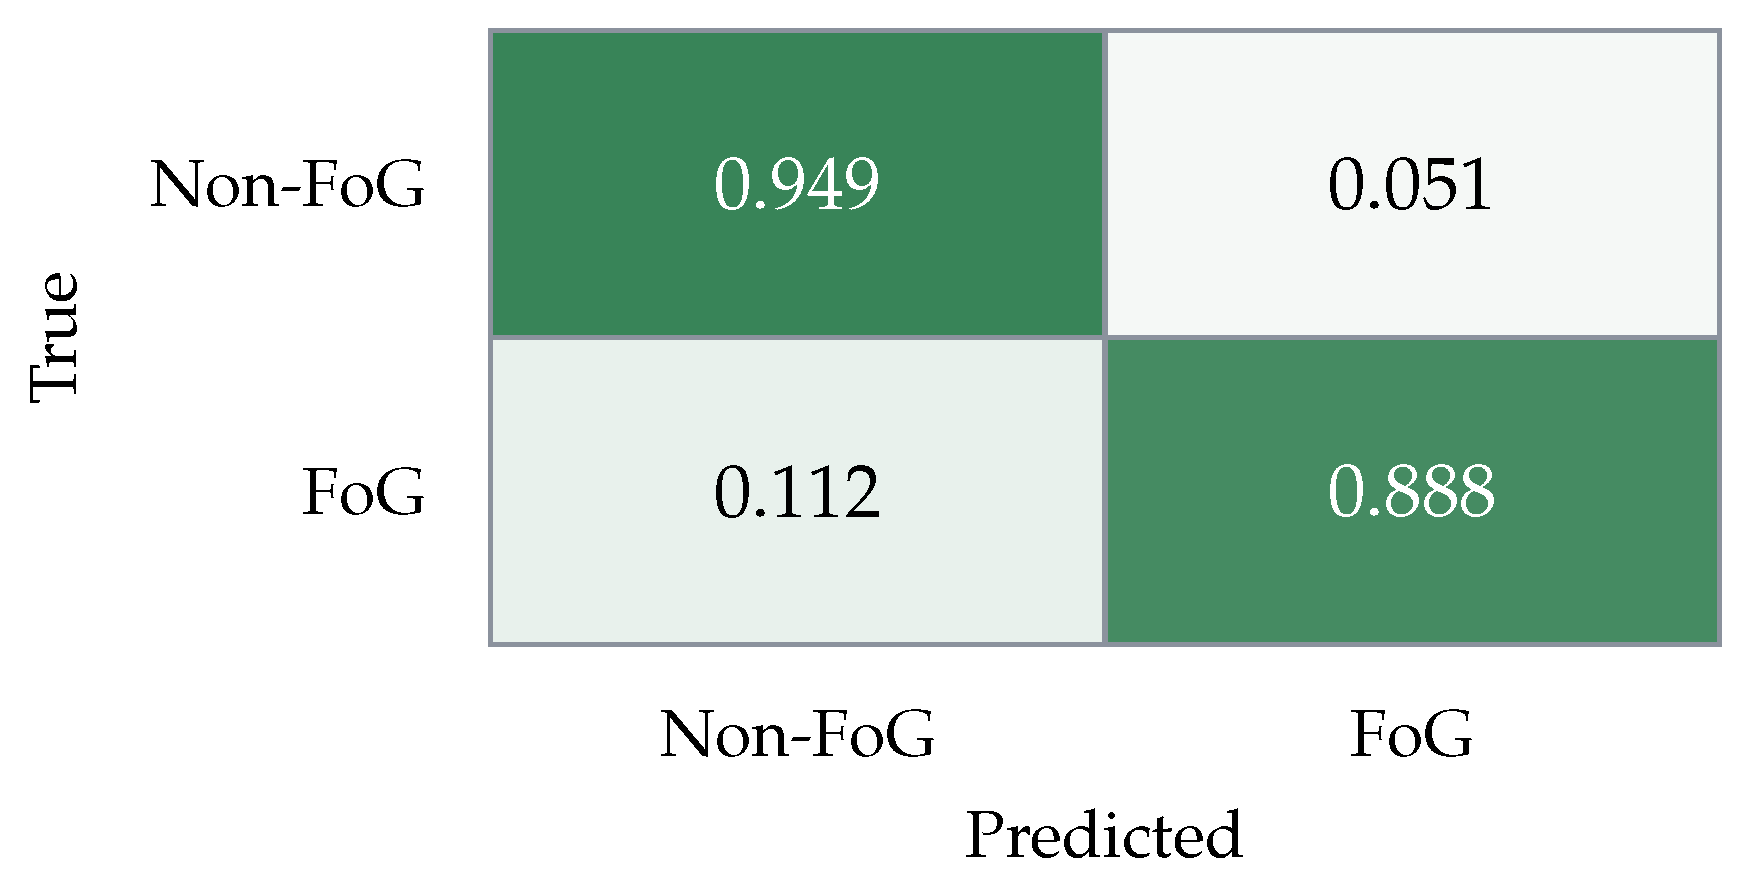

Table 1.
SI-CV Performance Comparison (mean ± std / 10 folds). Bold marks the best value on the detection metrics (↑ = higher is better); Params and Lat. are listed for reference and are not ranked. The final row is a literature value reported on Daphnet and is not directly comparable.
Table 1.
SI-CV Performance Comparison (mean ± std / 10 folds). Bold marks the best value on the detection metrics (↑ = higher is better); Params and Lat. are listed for reference and are not ranked. The final row is a literature value reported on Daphnet and is not directly comparable.
| Model | Params | F1 ↑ | AUPRC ↑ | AUROC ↑ | Lat. (ms) |
|---|---|---|---|---|---|
| WaveFoG (proposed) | 907K | 3.1 | |||
| Vanilla Transformer | 545K | 2.7 | |||
| Bi-LSTM | 570K | 2.3 | |||
| 1D CNN | 337K | 1.4 | |||
| Handcrafted SVM (FI) [2] | — | ≈0.72 | — | — | — |
Table 2.
Ablation Study (mean over the 10 SI-CV folds). F1 relative to the full WaveFoG model.
| Variant | Params | F1 | AUPRC | F1 |
|---|---|---|---|---|
| WaveFoG (full) | 907K | 0.875 | 0.833 | — |
| − Wavelet gate | 881K | 0.852 | 0.808 | |
| − Transformer branch | 354K | 0.843 | 0.798 | |
| − CNN branch | 553K | 0.851 | 0.806 | |
| Raw channels only | 907K | 0.858 | 0.815 |
Disclaimer/Publisher’s Note: The statements, opinions and data contained in all publications are solely those of the individual author(s) and contributor(s) and not of MDPI and/or the editor(s). MDPI and/or the editor(s) disclaim responsibility for any injury to people or property resulting from any ideas, methods, instructions or products referred to in the content. |
© 2026 by the authors. Licensee MDPI, Basel, Switzerland. This article is an open access article distributed under the terms and conditions of the Creative Commons Attribution (CC BY) license (http://creativecommons.org/licenses/by/4.0/).
Copyright: This open access article is published under a Creative Commons CC BY 4.0 license, which permit the free download, distribution, and reuse, provided that the author and preprint are cited in any reuse.