

Submitted:
14 September 2026
Posted:
15 September 2026
You are already at the latest version
Abstract
This study quantified the linkage between the watershed abundance of agricultural mulch film and its accumulation along riverbanks in the Hamada River catchment, Japan, by integrating riverbank monitoring, catchment-wide surveys, hydrological connectivity assessment, and delivery ratio estimation. Mulch film covered 41,748 m² of the watershed during the 2025 growing season, with abundance varying by crop type. Black film was predominantly associated with red perilla, while silver film was almost exclusively used for tobacco. Riverbank monitoring from 2023 to 2025 showed that mulch film accounted for 22.5% of cumulative surface area coverage but only 5.6% of cumulative weight density, reflecting its thin, sheet-form geometry. Its accumulation was associated with episodic hydrological connectivity, with integrated hydrological exposure significantly correlating with both surface area coverage (ρ = 0.72, p < 0.05) and weight density (ρ = 0.66, p < 0.05). In contrast, the accumulation of other macroplastics showed few significant associations with the examined hydrological variables. This study provides the first quantitative estimate of the delivery ratio of agricultural mulch films from agricultural land to river systems. The annual delivery ratio of silver film ranged from 0.17% to 0.31%, with the highest value in the year for the lowest watershed abundance, indicating that delivery was not determined solely by abundance. In 2025, the delivery ratios were 0.18% for silver and 0.06% for black film, exhibiting the same order of magnitude despite a threefold difference in watershed abundance. These findings highlight the need for an abundance-based plastic mulch management strategy at the catchment scale.
Keywords:
agricultural plastic
; mulch film
; macroplastic accumulation
; riverbank
; hydrological connectivity
; delivery ratio
1. Introduction
The use of plastics to enhance agricultural efficiency in cultivation areas has substantially increased. In particular, mulch films are widely used to control weeds, retain soil moisture, and increase crop yields [1,2,3]. However, their increasing use has raised the potential for plastic release into the environment through material degradation during use and harvesting as well as inadequate waste management [4,5]. Mulch film fragments remaining on agricultural land could consequently serve as a source of macroplastics, which may potentially enter aquatic systems and contribute to plastic pollution in rivers [5,6,7]. Other agricultural plastic inputs, such as fertilizers usage may also contribute to macroplastic pollution in agricultural catchments [8].
Macroplastic transport from agricultural land to river systems is influenced by hydrological processes, particularly rainfall. During intense rainfall events, plastic fragments may be transported by surface runoff through drainage channels into rivers [4,9,10,11,12]. However, not all plastic entering the rivers is immediately transported downstream; some is temporarily retained in riparian vegetation or deposited onto riverbanks to form accumulation zones, functioning as temporary sinks in river systems [13,14]. When water levels exceed channel capacity, flow spreads onto vegetated banks, establishing lateral hydrological connectivity between the river channel and the riparian zone and facilitating the transport of buoyant macroplastics onto the bank surface, where they may be retained by riparian vegetation.
Previous studies in Japan have identified plastic mulch as a primary source of agricultural macroplastics. In one agricultural river in Aichi Prefecture, plastic mulch likely originating from nearby tobacco fields accounted for 31–59% of the macroplastics found on the riverbank [11]. A similar pattern has been observed in the Hamada River catchment, where a downstream riverbank survey recorded a significant contribution of mulch film fragments to total macroplastic accumulation [15]. These findings indicate that agricultural mulch film leakage is not an isolated occurrence, but a recurring phenomenon in river systems associated with agricultural areas.
Although the presence of macroplastics in rivers has been widely documented, the quantitative relationships among mulch film abundance within watersheds, hydrological transport processes, and accumulation along riverbanks remain poorly understood. Most studies have focused on quantifying their watershed abundance or riverbank accumulation separately [11,14,16], whereas comprehensive evaluations of their linkage within a catchment, particularly for mulch film, remain lacking. Therefore, this study aimed to quantify the linkage between mulch film abundance in watersheds and its accumulation on riverbanks using an approach that integrates multi-year riverbank monitoring, catchment-wide mulch film surveys, hydrological connectivity assessment, and color-specific delivery ratio estimation. The results are expected to improve understanding of the agricultural mulch film transport pathways within watersheds and support the development of catchment-scale plastic pollution management strategies.
2. Material and Methods
2.1. Study Area and Sampling Design
This study focused on the Hamada River catchment located in Toyohashi City, Aichi Prefecture, Japan. Cropland and paddy field together account for 45.7% of the 17.62 km2 catchment (Table 1) and closely border the river’s tributary network across the western and central catchment, providing a direct pathway for mulch film and other agricultural debris to enter the river system (Figure 1). Red perilla and tobacco are the dominant crops associated with mulch film use (Section 3.2). Sampling points were established in the downstream area of the catchment to capture macroplastic accumulation from the entire catchment, within a 300-m study reach bounded by two bridges and encompassing both riverbanks.
2.2. Data Collection
2.2.1. Riverbank Macroplastic Sampling
Riverbank macroplastic sampling was conducted along a fixed transect located downstream of the Hamada River over three consecutive years (2023–2025), comprising 19 sampling events: five events in 2023 (June 7, June 20, September 4, September 13, and October 19), seven events in 2024 (April 17, May 14, July 3, September 9, October 2, October 14, and November 5), and seven events in 2025 (April 28, May 18, June 2, July 22, September 8, September 24, and November 12). Sampling was conducted following rainfall events to capture active plastic deposition conditions, as increased river water levels facilitate the transport of macroplastics from agricultural areas to riverbank accumulation zones. A threshold water level of 1.2 m was used to identify exceedance events, representing the conditions under which river water could reach the sampling area. The transect extended 10 m parallel to the river flow direction and 2.5 m up the vegetated bank slope, measured along the slope surface from the 1.2 m threshold elevation, resulting in a 25-m2 sampling area (Figure 2). All macroplastics >5 mm within the transect were collected [14,17,18]. Sampling was destructive, with all macroplastic material within the transect removed at each event; consequently, values from each subsequent sampling date represented newly deposited material since the preceding event rather than the cumulative standing stock. The collected plastic mulch fragments were separated from the other macroplastics for further analysis.
2.2.2. Agricultural Mulch Film Survey
Surveys focused exclusively on tobacco fields, the dominant mulch-using crop within the catchment, were conducted in 2023 and 2024. In 2025, the survey scope was expanded from solely tobacco to include all mulch crops, providing a catchment-wide inventory of agricultural plastic mulch. This expanded survey was conducted during summer (June 2025) and autumn (September 2025) to capture contrasting mulch usage conditions across the growing season. Mulch films were generally installed in June, corresponding to the peak application period for summer cropping. By September, field conditions were heterogeneous, comprising plots newly mulched, still using summer mulch, and already harvested with mulch films removed. Because the 2023 and 2024 surveys were restricted to tobacco fields, interannual comparison was limited to the tobacco subset of the 2025 survey. The catchment-wide 2025 inventory was used separately to quantify the total mulch film abundance across all mulch-using crops.
Agricultural plots were identified as mulch-using fields through direct visual observation based on the presence of plastic sheets covering planting beds. The location of each identified plot was recorded using a handheld GPS receiver, and the crop type and film color (black, silver, transparent, or white) were recorded to enable color-specific analysis of mulch film abundance. In the study catchment, plastic mulch was applied to raised planting beds, with a continuous sheet laid over the bed surface and the two longitudinal edges anchored by burying them in adjacent furrows that remained uncovered. Using a tape measure or laser distance meter, the mulch film area for each bed was estimated by multiplying the bed width by the ridge length. The area of all beds within a plot was then summed to obtain the total mulch film area per plot. The survey covered agricultural land throughout the Hamada River catchment, representing the entire upstream area, and contributing to the riverbank sampling transect. These data were used to map the distribution and quantity of mulch films within the catchment and estimate the intensity of their use in the study area.
2.2.3. Hydrological Data Collection
Hydrological data were collected using an automatic water level logger (HOBO U20 water level logger) installed adjacent to the riverbank sampling transect [19]. River water levels were recorded every 10 min in 2023 and 2025. Continuous water level data were unavailable for 2024 because the logger was dislodged and swept away during a high-flow event; therefore, hydrological exposure could not be calculated for that year. For the determination of hydrological connectivity between the river channel and the macroplastic accumulation zone, the survey scope extended 2.5 m along the vegetated bank slope above the 1.2-m riverbank elevation threshold, determined from direct field measurements at the transect location; the slope inclination was not surveyed.
2.3. Data Analysis
2.3.1. Riverbank Macroplastic Characterization
All collected macroplastic samples were transported to a laboratory, thoroughly washed to remove sediment and debris, and dried prior to characterization. Each item was visually inspected and characterized based on the presence or absence of its original form, color, object characteristics, and shape. Weight was measured using a METTLER TOLEDO ME2002 electronic balance. The surface area of each item was estimated by measuring its length and width to approximate its two-dimensional extent. All the metrics were normalized to the area of the fixed transect (10 m x 2.5 m) to allow comparisons between the sampling periods. In addition, item color was classified into four categories corresponding to the mulch film types used in the catchment: black, silver, transparent, and white. For items with different colors on each surface, classification followed the upper (exposed) surface.
Accordingly, plastic debris in riverbank was analyzed based on item abundance (item/m2), surface area coverage (%) and weight density (g/m2). Variations in plastic mulch accumulation across sampling events were then examined to identify temporal deposition patterns on riverbanks. Three metrics were calculated using the following equations [20]:
where the total number, surface area, and weight refer to all the macroplastic items collected within the transect during a single sampling event. The proportional contribution of mulch film to the total abundance, surface area coverage, and weight density for each sampling event was calculated as the mulch film value divided by the sum of the mulch film and other macroplastic values and expressed as a percentage.
In addition to these transect-normalized metrics, the intrinsic mass per unit area of each item was calculated to characterize the material properties of the mulch film, independent of transect-level accumulation. This was defined as each item’s weight divided by its surface area to capture the size of the fragmentation.
2.3.2. Spatial Analysis of Mulch Film Abundance in Watershed
Field survey data on the location and extent of plastic mulch were processed in ArcGIS Pro to map the spatial distribution and abundance of mulch films within the catchment area [21,22]. The total area of the agricultural mulch film was calculated for each season by totaling the film areas of all surveyed plots. Spatial density was assessed using kernel density analysis, with each surveyed plot represented by its GPS location and weighted by the total mulch film area, applying a 200-m search radius and an 11-m output cell size. The resulting surface expressed the relative spatial concentration of mulch films within the catchment.
2.3.3. Hydrological Connectivity Analysis
Hydrological connectivity was analyzed using river water-level data recorded every 10 min. For each sampling period, the IHE value was calculated relative to the 1.2-m riverbank elevation threshold (Section 2.2.3), reflecting the combination of the magnitude of the water level exceeding the threshold and duration of hydrological connectivity [23]. For each sampling event, the IHE (m·h) was calculated by totaling the water-level exceedance above the threshold for each 10-min interval that occurred between the preceding and current sampling dates:
where WLⱼ is the water level recorded at the j-th interval (m), WLth is the riverbank elevation threshold (1.2 m), t is the recording interval expressed in hours (10 min ≈ 0.167 h), and n is the number of 10-min intervals exceeding the threshold. When multiple discrete exceedance episodes occurred within an interval, the water-level excess from all episodes was summed rather than only the single largest peak. For the first sampling event of each observation year (June 7, 2023, and April 28, 2025), for which no preceding sampling date existed, the summation window began on January 1 of that year, consistent with the January–November observation period adopted in this study. In addition, Spearman rank correlation analysis was performed to examine the relationships between riverbank mulch film accumulation metrics (abundance, surface area coverage, and weight density) and hydrological variables (peak water level, exceedance duration, and integrated hydrological exposure). This nonparametric method was selected given the small sample size (n = 12) and non-normal distribution of the data. All statistical analyses were performed using the OriginPro software (OriginLab Corporation, Northampton, MA, USA). Statistical significance was set at p <0.05.
2.3.4. Mulch Film Delivery Ratio
The annual mulch film delivery ratio was defined as the proportion of mulch film area accumulated on the riverbank to the total mulch film area surveyed within the watershed, providing a quantitative basis for linking watershed abundance to riverbank accumulation. Delivery ratios were calculated by color to assess color-specific transport behavior; however, transparent and white films were excluded because degradation and fragmentation render them visually indistinguishable from non-mulch polyethylene debris on the riverbank (i = black, silver).
Based on the 300-m study reach bounded by two bridges (Section 2.1), the total reach-scale riverbank area was 1,500 m2 (both banks, each 2.5-m wide); this bridge-to-bridge approach follows the methods of other riverine macroplastic monitoring studies [24]. The 25-m2 transect corresponds to approximately 1.7% of this area; accordingly, the measured riverbank mulch film area was extrapolated to the entire reach (scaling factor = 60), assuming spatially uniform deposition along the reach and between both banks. The delivery ratio (%) was calculated as follows:
where i denotes the mulch film color. The numerator represents the cumulative surface area of all mulch film of color i collected across sampling events within a given year, scaled by a factor of 60. The denominator represents the total area of mulch film of color i installed in the watershed during the growing season, estimated by combining the June 2025 summer survey with newly mulched plots during the September 2025 autumn survey; plots in continued use from summer were counted only once to avoid double counting. As mulch use was concentrated within these seasons, the two surveys were assumed to capture the annual mulch installation cycle. Because films installed outside this period were not captured, the denominator represented a lower-bound estimate of abundance. Both terms represent cumulative annual areas, with the ratio expressing the proportion of films installed within the watershed for one year that reached and remained within the riverbank accumulation zone.
Because the surveys in 2023 and 2024 covered only tobacco fields, the delivery ratios for those years were calculated for silver film alone as it was used predominantly for tobacco; the tobacco-only surveys essentially captured the full watershed abundance for silver film. As black film was used across multiple crops, the surveys would underestimate its abundance and inflate the ratio. For the catchment-wide survey in 2025, the delivery ratios were calculated for both films.
3. Results and Discussion
3.1. Riverbank Mulch Film Accumulation
Although item color was recorded for all macroplastics collected on the riverbank, only black and silver items were classified as mulch film in the following analysis. Transparent and white films were excluded from this comparison because they lack visual features specific to agricultural mulch; once fragmented and weathered, they are morphologically indistinguishable from packaging films, bags, and other polyethylene debris, and FTIR analysis confirms the composition of polyethylene but cannot identify agricultural mulch specifically. In contrast, silver films retained their metallic surface, and black films retained their opacity even after prolonged environmental exposure, allowing both to be confidently identified throughout the study period.
The temporal variations in plastic item abundance, surface area coverage, and weight density across the 19 sampling events conducted from 2023 to 2025 observation period and the contribution of mulch film relative to other macroplastics are shown in Figure 3. Other macroplastics dominated all three metrics, with mean values of 1.15 item/m2, 1.40%, and 1.67 g/m2, compared with 0.25 item/m2, 0.41%, and 0.10 g/m2 for mulch film. Over the entire observation period, mulch film accounted for 17.9% of cumulative item abundance and 22.5% of cumulative surface area coverage, but only 5.6% of cumulative weight density.
The metrics capture different characteristics of riverbank plastic accumulation. Item abundance reflects the number of discrete plastic items and is sensitive to fragmentation, as a single sheet breaking apart increases item count without increasing the amount of material. Surface area coverage reflects the spatial extent of plastic on the riverbank surface and is primarily governed by the item size. Weight density reflects the weight of the material and is determined by both item size and thickness. The relationship between surface area coverage and weight density depends on the mass per unit area of the plastic material, which is defined as the weight of an item divided by its surface area rather than by the transect area. For mulch film, this value was narrowly constrained and did not considerably differ between colors, with median values of 2.38 mg/cm2 for black film (n = 67) and 2.43 mg/cm2 for silver film (n = 52). Therefore, these two metrics provide largely equivalent information for mulch films. Other macroplastics, which comprise a mixture of item types rather than a single material, exhibited a comparable median (3.33 mg/cm2, n = 548) but a substantially wider range (interquartile range [IQR]: 1.67–9.25 mg/cm2), likely reflecting the presence of rigid, thick-walled plastics whose weight is disproportionately large relative to the riverbank surface they occupy.
The contrast between the materials was evident from their proportional contributions. Mulch films accounted for approximately one-fifth of both the cumulative item abundance and surface area coverage, but less than one-tenth of the cumulative weight density. That is, mulch film contributed to riverbank debris in numbers and areal extent comparable to those of other macroplastics, but contributed far less weight, not because mulch film is exceptionally light per unit area, but because the total weight of the other macroplastic fraction was dominated by a minority of rigid, thick-walled items that have no counterpart among mulch films [25,26]. All mulch film recovered from the riverbank were fragmented pieces rather than intact sheets, with individual items ranging from 1.7 × 10⁻⁴ to 0.12 m2 in surface area (median: 0.006 m2, IQR: 0.002–0.019 m2). Similar studies on riverine macroplastics have reported that thin, sheet-form debris is preferentially transported and stranded on riverbanks during high-flow events owing to their high surface-area-to-weight ratio [27]. The divergence observed here between areal and weight-based metrics is therefore an expected consequence of the material properties of mulch film rather than an artifact of the sampling design.
These observations are consistent with the broader evidence base, in which mulch films are described as thin, difficult to recover once fragmented, and prone to further disintegration [15,28], whereas riverbank plastic studies generally show that stranded debris is spatially patchy and sensitive to the metrics used for quantification [4,29]. Rather than indicating that one metric is more important than the other, this contrast highlights that the three metrics provide complementary information: weight density remains a more appropriate indicator of total debris loading and material flux within a river system, whereas item abundance and surface area coverage more directly reflect the physical footprint of stranded debris on the riverbank, including its potential visual impact and surface-level ecological disturbance (e.g., substrate coverage and shading of riverbank vegetation). For thin, sheet-form debris, such as mulch film, weight-based indicators alone may understate the extent of its physical presence, underscoring the value of jointly reporting multiple metrics when assessing agricultural plastic film pollution.
Beyond these aggregate patterns, because mulch films comprised several color types associated with different agricultural applications within the catchment, accumulation was analyzed by color. The total accumulation of black and silver films per sampling transect is shown in Figure 4. Silver film consistently exceeded black film in both surface area coverage and weight density across all three years (Figure 4). The mass per unit area was similar for black and silver films (2.38 and 2.43 mg/cm2, respectively), consistent with the comparable nominal thickness reported for commercially available black and silver black polyethylene mulch films [30]. Thus, the two colors primarily exhibited differences in the amount of film deposited, rather than in film thickness.
3.2. Agricultural Mulch Film Abundance in Watersheds
3.2.1. Comprehensive Three-Year Abundance of Mulch Film from Tobacco Cultivation
The tobacco cultivation area within the watershed used to estimate silver mulch film abundance for the delivery ratio calculation was lower in 2024 and 2025 than in 2023 (Figure 5). The tobacco cultivation area covered 11,135 m2 in 2023, decreased to 8,920 m2 in 2024 (approximately 20% lower), and increased slightly to 9,395 m2 in 2025, remaining below the 2023 level.
Silver mulch film is commonly applied to tobacco and other crops because its light-reflective properties help reduce soil temperature and deter insect pests [31]. The variations in the tobacco cultivation area may reflect interannual variations in local agricultural practices, such as crop rotation, changes in planting decisions, or shifts in cultivated land allocation within the watershed. Because silver mulch film was almost exclusively associated with tobacco cultivation, tobacco cultivation area was used a reasonable basis for estimating silver mulch film abundance in the watershed for the delivery ratio analysis. This was appropriate given that silver film was used primarily for only one crop type within the catchment, whereas black film was used across various crops.
3.2.2. Mulch Film Abundance in Watershed Across Crop Types in 2025
Plastic mulch films were widely distributed across agricultural lands in the Hamada River catchment, with notable differences in spatial extent and density between the survey seasons in 2025. The kernel density analysis revealed that hotspots (very high-density areas) were concentrated in the western part of the catchment during summer, with several located near the river network (Figure 6). In autumn, the number and intensity of hotspots decline markedly, with only a few moderate- to high-density areas remaining, mainly in the central and southern parts of the catchment. Mulch film coverage was substantially greater in summer than in autumn, reflecting seasonal changes in cropping activity (Table 2). After excluding plots that were continuously installed across both seasons, the total mulch film area in the watershed during the 2025 growing season was 41,748 m2. Mulch-use cultivation in the catchment was concentrated in the summer and autumn seasons, with installation outside this window rarely observed during the field surveys.
The difference in the extent of plastic mulch use between the two seasons was directly attributable to the cropping pattern. Red perilla and tobacco, which accounted for 69% of the total growing season area, were only mulched in summer, with the film removed after harvest (Table 3). Therefore, a greater extent of use in summer indicates a greater quantity of agricultural plastics present within the catchment during that period [5,31,32]. During rainfall, decaying or damaged plastic mulch fragments are transported by surface runoff to drainage channels and rivers. However, informal interviews with several farmers during the field surveys indicated that almost all mulch films were collected after harvest, suggesting that the observed riverbank accumulation likely originated from unintentional losses during handling, transport, or storage, rather than from the systematic abandonment of film in the fields.
The mulch film area disaggregated by crop type and film color is listed in Table 3. Black film accounted for the largest share of the total area (27,070 m2; 64.8%), followed by silver (9,498 m2; 22.7%), transparent (3,885 m2; 9.3%), and white (1,295 m2; 3.1%) films. Red perilla occupied the largest area (19,320 m2) and was covered with black film, followed by tobacco (9,395 m2), which was the only crop grown exclusively under silver film. Watermelon (3,779 m2), other crops (3,121 m2), sweet potatoes (2,475 m2), winter melons (2,408 m2), and lettuce (1,250 m2) occupied relatively small areas and showed more varied film use, with watermelon and other crops incorporating substantial proportions of transparent film and winter melon constituting a substantial proportion of white film.
3.3. Hydrological Controls
The temporal variations in the Hamada River water level during 2023 and 2025 are shown in Figure 7, including the sampling dates and 1.2-m riverbank threshold used to define hydrological connectivity events capable of depositing macroplastics onto the riverbank. In 2023, the background water levels generally remained low and stable (<0.5 m) throughout the observation period, with the highest peak occurring in early June (3.41 m) and second peak (2.13 m) in early September. A similar pattern was observed in 2025, featuring a prominent peak (2.59 m) in early to mid-September and smaller threshold-exceeding events in late May, early June, July, and early November.
Because sampling was conducted after rainfall events by design, the sampling dates followed periods of elevated water levels and their correspondence with hydrological peaks reflected the sampling protocol rather than an independent finding. Therefore, the hypothesis that riverbank deposition is event-driven rather than gradual was tested against the magnitude of hydrological exposure during each inter-event period, quantified as the IHE, rather than against the timing of sampling itself.
The peak water level, duration of exceedance above the 1.2-m riverbank threshold, and IHE for the 12 sampling events analyzed in this study are summarized in Table 4. Peak water level ranged from 0.92 m (April 28, 2025) to 3.41 m (June 7, 2023), with the June 7, 2023, event also producing the longest exceedance duration (14.5 h) and highest IHE value (12.095 m·h), being an order of magnitude greater than that for any other sampling event. The remaining events exhibited comparatively modest IHE values (0–1.336 m·h), reflecting shorter and less intense threshold-exceedance periods. The April 28, 2025 event recorded no threshold exceedance, providing a reference condition in which sampling was conducted following rainfall but no hydrological connectivity was observed at the riverbank.
The temporal pattern shown in Figure 7, combined with the IHE values in Table 4, indicates that hydrological exposure in the Hamada River is highly episodic and dominated by a small number of extreme events rather than gradual or evenly distributed water level fluctuations. This is most clearly illustrated by the June 7, 2023 event, whose exceptional IHE value (12.095 m·h), attributed to both the highest peak water level and longest exceedance duration in the dataset, corresponded to the sampling date with the highest recorded surface area coverage of other macroplastics in the study. This single event illustrates how a high-magnitude flow event can deposit substantial quantities of debris within a short period [33], although the evidence for an event-driven mechanism rests on correlation analysis across all events rather than on any individual date. However, the mulch film surface area coverage did not peak on this date, but instead recorded on September 4, 2023, an event of a considerably lower magnitude. This suggests that extreme flow events preferentially mobilize heavier debris, whereas thin sheet-form mulch films respond to a broader range of connectivity conditions.
Spearman rank correlation confirmed this relationship. IHE was significantly correlated with both surface area coverage (ρ = 0.72, p < 0.05) and weight density (ρ = 0.66, p < 0.05), whereas item abundance was not correlated with any hydrological variable (ρ = 0.47–0.54, p > 0.05), likely reflecting fragmentation, which increases item counts without proportional increases in weight or area (Figure 8). In contrast, other macroplastics showed no significant correlations between the hydrological variables and weight density (ρ = 0.26-0.50, p > 0.05) and surface area coverage (ρ = 0.40-0.48, p > 0.05). However, item abundance was significantly correlated with IHE (ρ = 0.64, p < 0.05). Because sampling followed rainfall by design, these correlations, which compare exposure between events rather than the timing of sampling relative to peaks, provide primary evidence for an event-driven mechanism.
Among the hydrological variables examined, IHE showed the strongest associations with mulch film accumulation, exceeding peak water level (ρ = 0.64 and 0.56 for surface area coverage and weight density, respectively) and duration of exceedance (ρ = 0.65 and 0.61, respectively). The September 8 and 24 events in 2025 illustrate this, with the September 8 event producing a higher peak (2.59 vs. 2.17 m) but remaining above the threshold less than half as long as the September 24 event (1.0 vs. 2.33 h), resulting in a lower IHE (0.931 vs. 1.200 m·h) and lower accumulation (0.19% vs. 0.90%). This comparison suggests that the peak water level alone may not adequately characterize mulch film deposition and that the duration of riverbank connectivity may also contribute. A possible explanation is that prolonged contact of river flow with the vegetated bank provides greater opportunity for floating debris to be retained. Because IHE integrates both magnitude and duration, it was strongly correlated with both variables (ρ = 0.93–0.97, p < 0.05), while duration and peak water level were themselves correlated (ρ = 0.86, p < 0.05); the three variables could not be statistically distinguished at this sample size. Although the differences among correlation coefficients were not tested, IHE exhibited the strongest numerical associations with both surface area coverage and weight density, supporting its use as an integrated hydrological descriptor.
These results indicate that hydrological connectivity between the river channel and riverbank strongly controls the areal and weight-based accumulation of mulch films. When water levels exceed the 1.2-m threshold, rising water can reach the vegetated bank slope, potentially facilitating the lateral transport and retention of mulch film fragments by riparian vegetation [17]. This finding is consistent with previous studies reporting event-driven macroplastic accumulation on riverbanks, with peak deposition occurring during or shortly after high-flow events [9,33]. Therefore, hydrological connectivity operates in conjunction with mulch film abundance in watersheds to govern riverbank accumulation.
3.4. Mulch Film Delivery Ratio
Environmental risk assessments for macroplastic pollution have conventionally relied on weight-based metrics, and several studies on riverbank and floodplain macroplastic deposition have adopted this approach. However, surface area coverage and weight density should be regarded as equally important and complementary metrics, rather than being subordinate to each other. Although weight relates more directly to material load and potential ecological exposure, surface area better reflects the spatial extent of deposition. In this study, the watershed-scale mulch film abundance (Section 3.2) was measured as areal coverage, reflecting standard agricultural application practices, rather than as an installed weight. To maintain unit consistency between watershed abundance and riverbank accumulation in the delivery ratio calculation, surface area was adopted as the primary metric for delivery ratio estimation. Because the mass per unit area of the mulch film was narrowly constrained (Section 3.1), the two metrics provided largely equivalent information for this material; thus, this choice of metric does not affect the interpretation of the results. Nonetheless, weight-based results are reported separately as complementary evidence of accumulation patterns.
The annual delivery ratios for silver mulch film from 2023 to 2025 are listed in Table 5. The delivery ratios for black mulch film could be calculated only for 2025, as crop-specific watershed abundance data were only available for that year. The amount of mulch film accumulated within the riverbank sampling transect was scaled to the 300-m study reach using a scaling factor of 60, yielding estimated riverbank accumulation areas of 18.85, 27.45, and 17.35 m2 for 2023, 2024, and 2025, respectively. Compared with their corresponding watershed abundances of 11,135, 8,920, and 9,395 m2, the resulting delivery ratios were 0.17%, 0.31%, and 0.18%, respectively. The highest delivery ratio was reported in 2024, coinciding with the lowest watershed abundance, whereas the ratios for 2023 and 2025 were comparable despite the higher watershed abundance in 2023.
This interannual variation indicates that the proportion of mulch film accumulating on the riverbank is not determined solely by watershed abundance. The 2024 ratio (0.31%) being nearly double that of the other two years suggests that disproportionately high riverbank accumulation can still occur under favorable transport conditions despite lower mulch film abundance. However, this interpretation cannot be directly verified because quantitative hydrological data (e.g., water level) were unavailable for 2024 following the loss of the sensor during a high-flow event.
The comparable ratios in 2023 (0.17%) and 2025 (0.18%) further support the interpretation that watershed abundance alone cannot entirely predict riverbank accumulation and that year-specific hydrological conditions must also be considered to explain the observed pattern [34,35]. Note that these ratios are calculated under the assumption that films installed in a given year are also mobilized and stranded within that same year. However, because fragments lost during handling may remain within fields or drainage channels for extended periods before transport, the material recovered in one year may have partly originated from earlier installations. Therefore, the delivery ratio should be understood as an annual indicator relating watershed abundance to riverbank accumulation within the same year rather than as a transfer coefficient for a specific cohort of films.
Silver mulch film abundance was estimated based on the tobacco cultivation area, accounting for 98.9% of the total silver film area. The 1.1% contribution from sweet potatoes (103 m2) was excluded to maintain consistency with estimates in 2023 and 2024, for which crop-specific data were only available for tobacco.
Color-specific analysis revealed that the delivery ratio was not proportional to watershed abundance. Despite its considerably greater watershed abundance (27,070 m2), black mulch film exhibited the lowest delivery ratio (0.06%), whereas silver mulch film showed a ratio approximately three times higher (0.18%) even with a watershed abundance less than half as large (9,395 m2).
The higher delivery ratio for silver mulch film compared with black mulch film indicates that the watershed abundance of mulch film does not solely determine riverbank accumulation. Furthermore, silver film was used almost exclusively for tobacco, whereas black film was distributed across multiple crops. However, the present dataset did not allow the factors underlying this difference to be identified; therefore, color-specific contrast should be regarded as an observation requiring further investigation.
Across both colors and all survey years, the delivery ratios (0.06–0.31%) indicate that only a small fraction of mulch film present in the watershed accumulates on the riverbanks, consistent with the field observations showing that most films were recovered after harvest (Section 3.2). Nonetheless, the measurable fraction reflects the susceptibility of the material to loss during handling. Notably, mulch films exposed to UV radiation for several months exhibit decreased mechanical elasticity, thereby increasing their susceptibility to tearing during field removal [36].
4. Conclusion
The three-year study (2023–2025) in the Hamada River agricultural catchment demonstrated that the riverbank accumulation of agricultural mulch film is governed by the combined influence of watershed abundance, hydrological connectivity, and material-specific transport behavior rather than by any single factor. Although other macroplastics dominated all three accumulation metrics, mulch film contributed a substantially greater proportion of surface area coverage (22.5%) than weight density (5.6%), reflecting its thin sheet-form geometry and underscoring the importance of evaluating multiple metrics. Silver film accumulated more surface area coverage than black film across all three years despite representing <25% of the total mulch film area within the watershed. IHE was significantly associated with both surface area coverage (ρ = 0.72, p < 0.05) and weight density (ρ = 0.66, p < 0.05), with stronger associations than peak water level or duration of exceedance alone. Other macroplastics were not significantly associated with any hydrological variables for surface area and weight density metrics, indicating that the physical characteristics of mulch film makes its deposition particularly responsive to connectivity between the river channel and riverbank.
This study provides the first quantitative estimate of the delivery ratio of agricultural mulch films from agricultural land to river systems. The similar delivery ratios for silver and black film (0.18% and 0.06%, respectively) at the order-of-magnitude level indicate that only a small fraction present in the watershed reaches and remains along the riverbank and that this fraction is comparable between film colors despite a threefold difference in their watershed abundances. The highest interannual ratio occurred in 2024 (0.31%), the year with the lowest watershed abundance, indicating that watershed abundance alone is insufficient to explain differences in riverbank accumulation. Therefore, assessments of agricultural plastic film pollution in river systems should consider both the quantity of plastic present within the watershed and hydrological conditions facilitating its transport during the growing season.
Author Contributions
Conceptualization: H.A., K.Y., and T.I. Methodology: H.A., K.Y., and T.I. Field investigation: H.A., N.K., K.Y., and W.K.W. Sample collection: H.A., N.K., K.Y., and W.K.W. Formal analysis: H.A. Data collection and curation: H.A. and N.K. Data visualization: H.A., N.K., and W.K.W. Writing—original draft preparation: H.A. Writing—review and editing: T.I., H.A, K.Y., W.K.W and N.M.N. Supervision: T.I., K.Y., and N.M.N. Project administration: K.Y. and T.I. Funding acquisition: K.Y, and T.I. All authors have read and agreed to the published version of the manuscript.
Funding
This study was supported by the Environmental Research General Promotion Fund (S-19: JPMEERF21S11900).
Acknowledgments
During the preparation of this work, the authors used Claude (powered by 3.5 Sonnet) to assist in improving the English wording, clarity, and academic tone of the manuscript. After using this tool, the authors reviewed and edited the content as needed and took full responsibility for the content of the publication.
Data Availability Statement
The data supporting the findings of this study are available in the manuscript.
Conflicts of Interest
The authors declare no conflicts of interest.
References
- Vox, G.; Viviana, R.; Blanco, I.; Scarascia, G. Mapping of agriculture plastic waste. Agric. Agric. Sci. Procedia 2016, vol. 8, 583–591. [Google Scholar] [CrossRef]
- Prem, M.; Ranjan, P.; Seth, N.; Patle, G. T. Mulching Techniques to Conserve the Soil Water and Advance the Crop Production - A Review. Curr. World Environ. 2020, vol. 15(no. 1). [Google Scholar]
- Salama, K.; Geyer, M. Plastic Mulch Films in Agriculture: Their Use, Environmental Problems, Recycling and Alternatives. Environments 2023, vol. 10. [Google Scholar]
- Liang, R.; et al. Mulch film to plastic debris: A survey of agricultural soils of Hebei. Sci. Total Environ. 2024, vol. 918, 170509. [Google Scholar] [CrossRef] [PubMed]
- Huang, Y.; Liu, Q.; Jia, W.; Yan, C.; Wang, J. Agricultural plastic mulching as a source of microplastics in the terrestrial environment. Environ. Pollut. 2020, vol. 260, 114096. [Google Scholar] [CrossRef] [PubMed]
- Li, Y.; et al. The Plastic Age: River Pollution in China from Crop Production and Urbanization. Environ. Sci. Technol. 2023, vol. 57, 12019–12032. [Google Scholar] [CrossRef] [PubMed]
- Wardhani, W. K.; Yokota, K.; Mahlil, T.; Ngoc, N. M. Event-Based Variations in Microplastic Pollution in a Small Agricultural River During Rainfall. Water 2026, vol. 18, 1–17. [Google Scholar] [CrossRef]
- Tiwari, E. Agricultural plastic pollution reduces soil function even under best management practices. PNAS Nexus 2024, vol. 3(no. 10), 1–10. [Google Scholar] [CrossRef] [PubMed]
- van Emmerik, T. H. M.; Frings, R. M.; Schreyers, L. J.; Hauk, R.; de Lange, S. I.; Mellink, Y. A. M. River plastic transport and deposition amplified by extreme flood. Nat. Water 2023, vol. 1, 514–522 514. [Google Scholar] [CrossRef]
- Liu, D.; Yang, Z.; Gong, Y.; Song, D.; Chen, Y. Occurrence and emission characteristics of microplastics in agricultural surface runoff under different natural rainfall and short-term fertilizer application. J. Hazard. Mater. 2024, vol. 477, 135254. [Google Scholar] [CrossRef] [PubMed]
- Chowdhury, Z.; Yokota, K.; Nguyen, M. N.; Inoue, T. Bank Accumulation of Macroplastic Samples in a Farmland River in Japan. Water. Air. Soil Pollut. 2023, vol. 234(no. 12), 1–16. [Google Scholar] [CrossRef]
- Wang, S.; et al. Occurrence of macroplastic debris in the long-term plastic film-mulched agricultural soil: A case study of Northwest China. Sci. Total Environ. 2022, vol. 831, 154881. [Google Scholar] [CrossRef] [PubMed]
- Van Emmerik, T.; Mellink, Y.; Hauk, R.; Waldschläger, K.; Schreyers, L. “Rivers as Plastic Reservoirs,”. Front Water 2022, vol. 3, 1–8. [Google Scholar] [CrossRef]
- Alimuddin, H.; Wardhani, W. K.; Yokota, K.; Inoue, T.; Nguyen, M. N. Baseline assessment of riverbank macroplastic pollution in downstream areas flowing into mikawa bay, japan Baseline assessment of riverbank macroplastic pollution in downstream areas flowing into mikawa bay, japan. IOP Conf. Ser. Earth Environ. Sci. vol. 1556, 2025. [CrossRef]
- Chowdhury, Z.; Yokota, K.; Minh, N.; Takanobu, N. Quantification of riverine macroplastics in a farmland area in Japan. Environ. Sci. Pollut. Res. 2025, vol. 32(no. 11), 6948–6958. [Google Scholar] [CrossRef] [PubMed]
- Schreyers, L. J.; et al. River plastic transport and storage budget. Water Res. 2024, vol. 259, 121786. [Google Scholar] [CrossRef] [PubMed]
- Gallitelli, L.; Cutini, M.; Cesarini, G.; Scalici, M. Riparian vegetation entraps macroplastics along the entire river course: Implications for eco-safety activities and mitigation strategies. Environ. Res. J. 2024, vol. 263. [Google Scholar] [CrossRef] [PubMed]
- Tasseron, P. F.; Van Emmerik, T. H. M.; De Winter, W.; Vriend, P.; Van Der Ploeg, M. Riverbank plastic distributions and how to sample them. Microplastics Nanoplastics 2024. [Google Scholar] [CrossRef]
- Lasater, A. L.; Austin, B. J.; Scott, E.; Haggard, B. E. A COST-EFFICIENT METHOD TO REMOTELY MONITOR STREAMFLOW IN SMALL-SCALE WATERSHEDS. J. ASABE 2022, vol. 65(no. 2), 275–286. [Google Scholar] [CrossRef]
- Chowdhury, Z.; et al. Comparison Between the Plastic Waste Influx of Rural Rivers: Mlese River in Indonesia and Hamada River in Japan. IOP Conf. Ser. Earth Environ. Sci. 2023, vol. 1268(no. 1), 3–9. [Google Scholar] [CrossRef]
- Briassoulis, D.; et al. GIS mapping of agricultural plastic waste in southern Europe. Sci. Total Environ. 2024, vol. 946. [Google Scholar] [CrossRef] [PubMed]
- I. Blanco, R. V. Loisi; Sica, C.; Schettini, E.; Vox, G. Agricultural plastic waste mapping using GIS. A case study in Italy. Resour. Conserv. Recycl. 2018, vol. 137, 229–242. [Google Scholar] [CrossRef]
- Garbin, S.; Celegon, E. A.; Fanton, P.; Botter, G. Hydrological controls on river network connectivity. R. Soc. Open Sci. 2019, vol. 6(no. 2), 181428. [Google Scholar] [CrossRef] [PubMed]
- Talavera, A. L.; Dalida, L. F. M.; Brida, M.; Diola, L. D. Riverine macroplastic survey along the segments of Tullahan River in Metro Manila, Philippines. 2024, 1–14. [Google Scholar] [CrossRef]
- Blettler, M. C. M.; Ulla, M. A.; Rabuffetti, A. P.; Garello, N. Plastic pollution in freshwater ecosystems: macro-, meso-, and microplastic debris in a floodplain lake. Environ. Monit. Assess. 2017. [Google Scholar] [CrossRef] [PubMed]
- Morales, C.; Reynoso, F. L.; Castañeda, R. Macroplastics in the Bottom of the Veracruz Reef System National Park. Sustainability 2023, vol. 15. [Google Scholar]
- Munkhbat, D.; Battulga, B.; Oyuntsetseg, B.; Kawahigashi, M. Dynamics of plastic debris and its density change between river compartments in the Tuul River system, Mongolia. Environ. Sci. Pollut. Res. 2024, vol. 31(no. 57), 65548–65558. [Google Scholar] [CrossRef] [PubMed]
- Steinmetz, Z.; et al. Plastic mulching in agriculture. Trading short-term agronomic benefits for long-term soil degradation? Sci. Total Environ. 2016, vol. 550, 690–705. [Google Scholar] [CrossRef] [PubMed]
- van Emmerik, T.; Strady, E.; Kieu-Le, T. C.; Nguyen, L.; Gratiot, N. Seasonality of riverine macroplastic transport. Sci. Rep. 2019, vol. 9, 1–9. [Google Scholar] [CrossRef] [PubMed]
- Liang, et al. Natural aging and adsorption / desorption behaviors of polyethylene mulch films: Roles of film types and exposure patterns. J. Hazard. Mater. 2024, vol. 466, no. January, 133588. [Google Scholar] [CrossRef] [PubMed]
- Yadav, D.; Rao, K. V. R.; Trivedi, A.; Rajwade, Y.; Verma, N. Reflective mulch films a boon for enhancing crop production: A. Environ. Conserv. J. 2023, vol. 24(no. 1), 281–287. [Google Scholar] [CrossRef]
- Meng, F.; Fan, T.; Yang, X.; Riksen, M.; Xu, M.; Geissen, V. Effects of plastic mulching on the accumulation and distribution of macro and micro plastics in soils of two farming systems in Northwest China. PeerJ 2020, vol. 8, 1–20. [Google Scholar] [CrossRef] [PubMed]
- Schreyers, J.; et al. Flood Characteristics Drive River-Scale Macroplastic Deposition. Environ. Sci. Technol. 2025, vol. 59, 19414–19423. [Google Scholar] [CrossRef] [PubMed]
- Ibrahim, E.; Gobin, A. Spatio-temporal dynamics of plastic mulch use in crop rotation at parcel and regional scales. Int. J. Appl. Earth Obs. Geoinf. 2024, vol. 129, 103829. [Google Scholar] [CrossRef]
- T. van Emmerik, M. Liro; Wyzga, B.; Liro, J.; Mikus, P. Macroplastic Storage and Remobilization in Rivers. Water 2020, 22–29. [Google Scholar] [CrossRef]
- Guo, K.; Cao, M.; Gu, F.; Wu, F.; Yang, H.; Xu, H. Mechanical Properties of Metallocene Linear Low-Density Polyethylene Mulch Films Correlate with Ultraviolet Irradiation and Film Thickness. Sustainability 2023. [Google Scholar] [CrossRef]
Figure 1.
Map of the study area and land use/land cover distribution in the watershed. Data are derived from the JAXA high-resolution land-use and land-cover map of Japan using ArcGIS Pro.
Figure 1.
Map of the study area and land use/land cover distribution in the watershed. Data are derived from the JAXA high-resolution land-use and land-cover map of Japan using ArcGIS Pro.
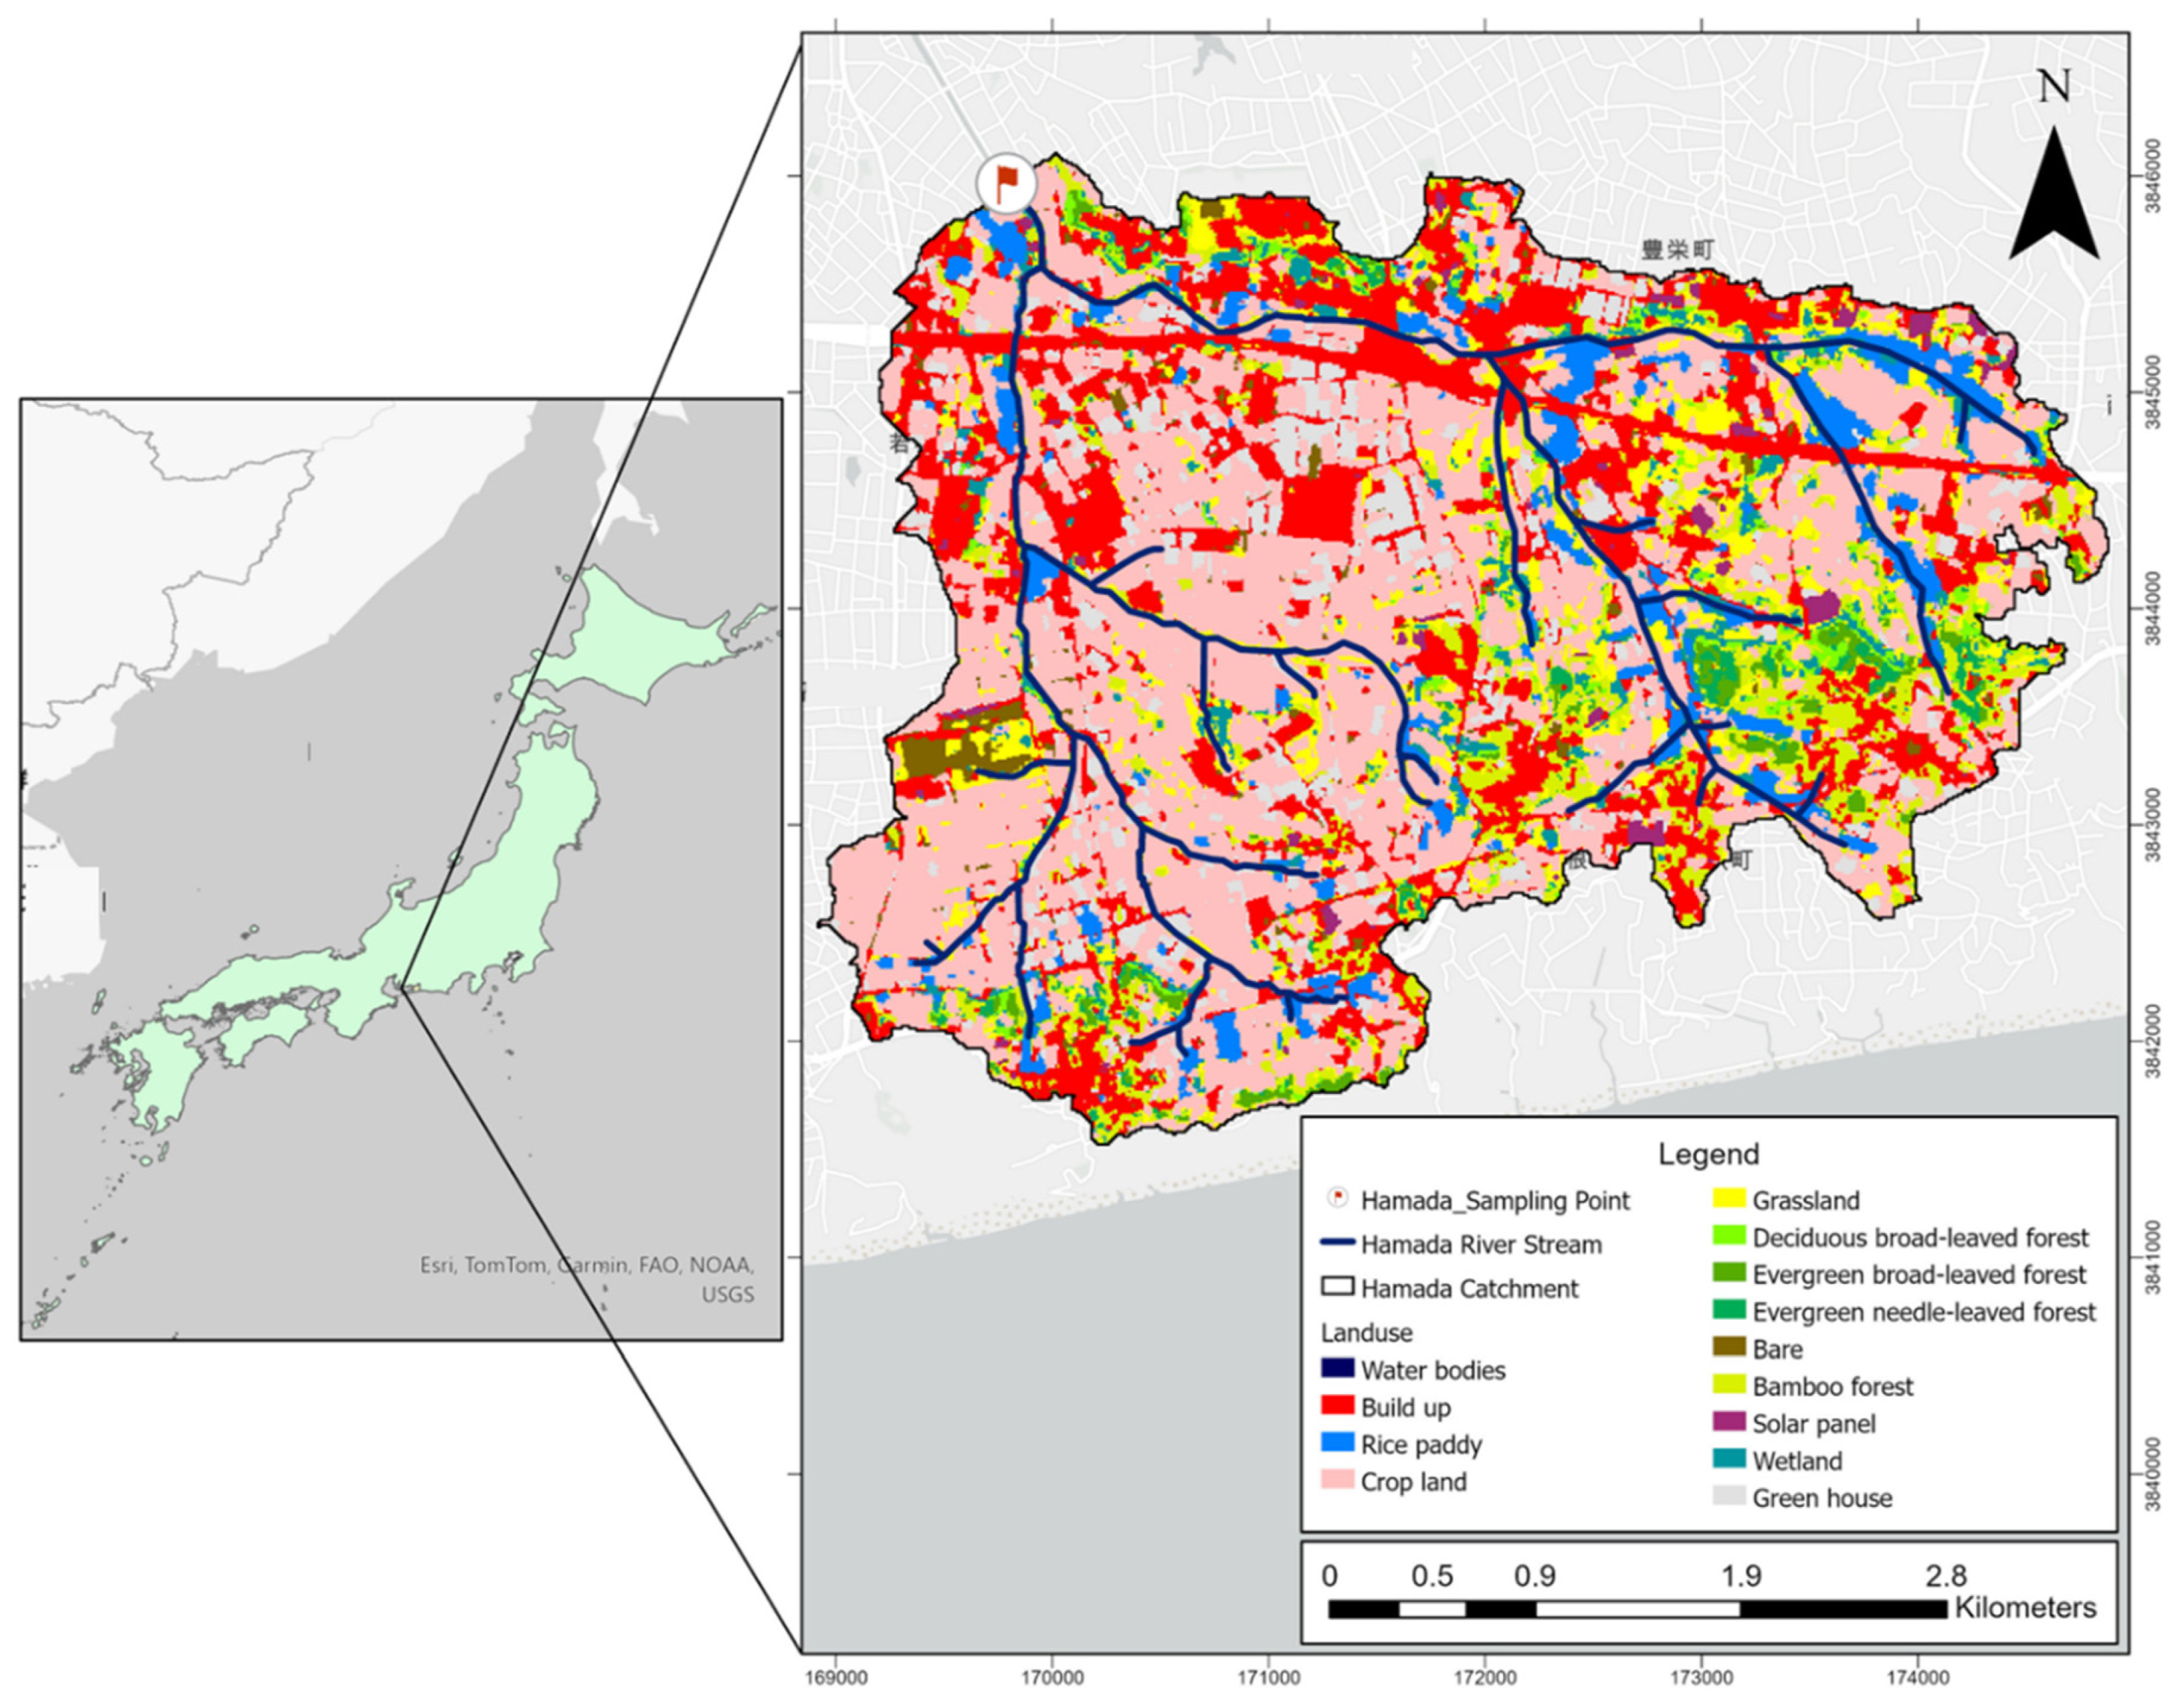
Figure 2.
Illustration of the riverbank macroplastic sampling design.
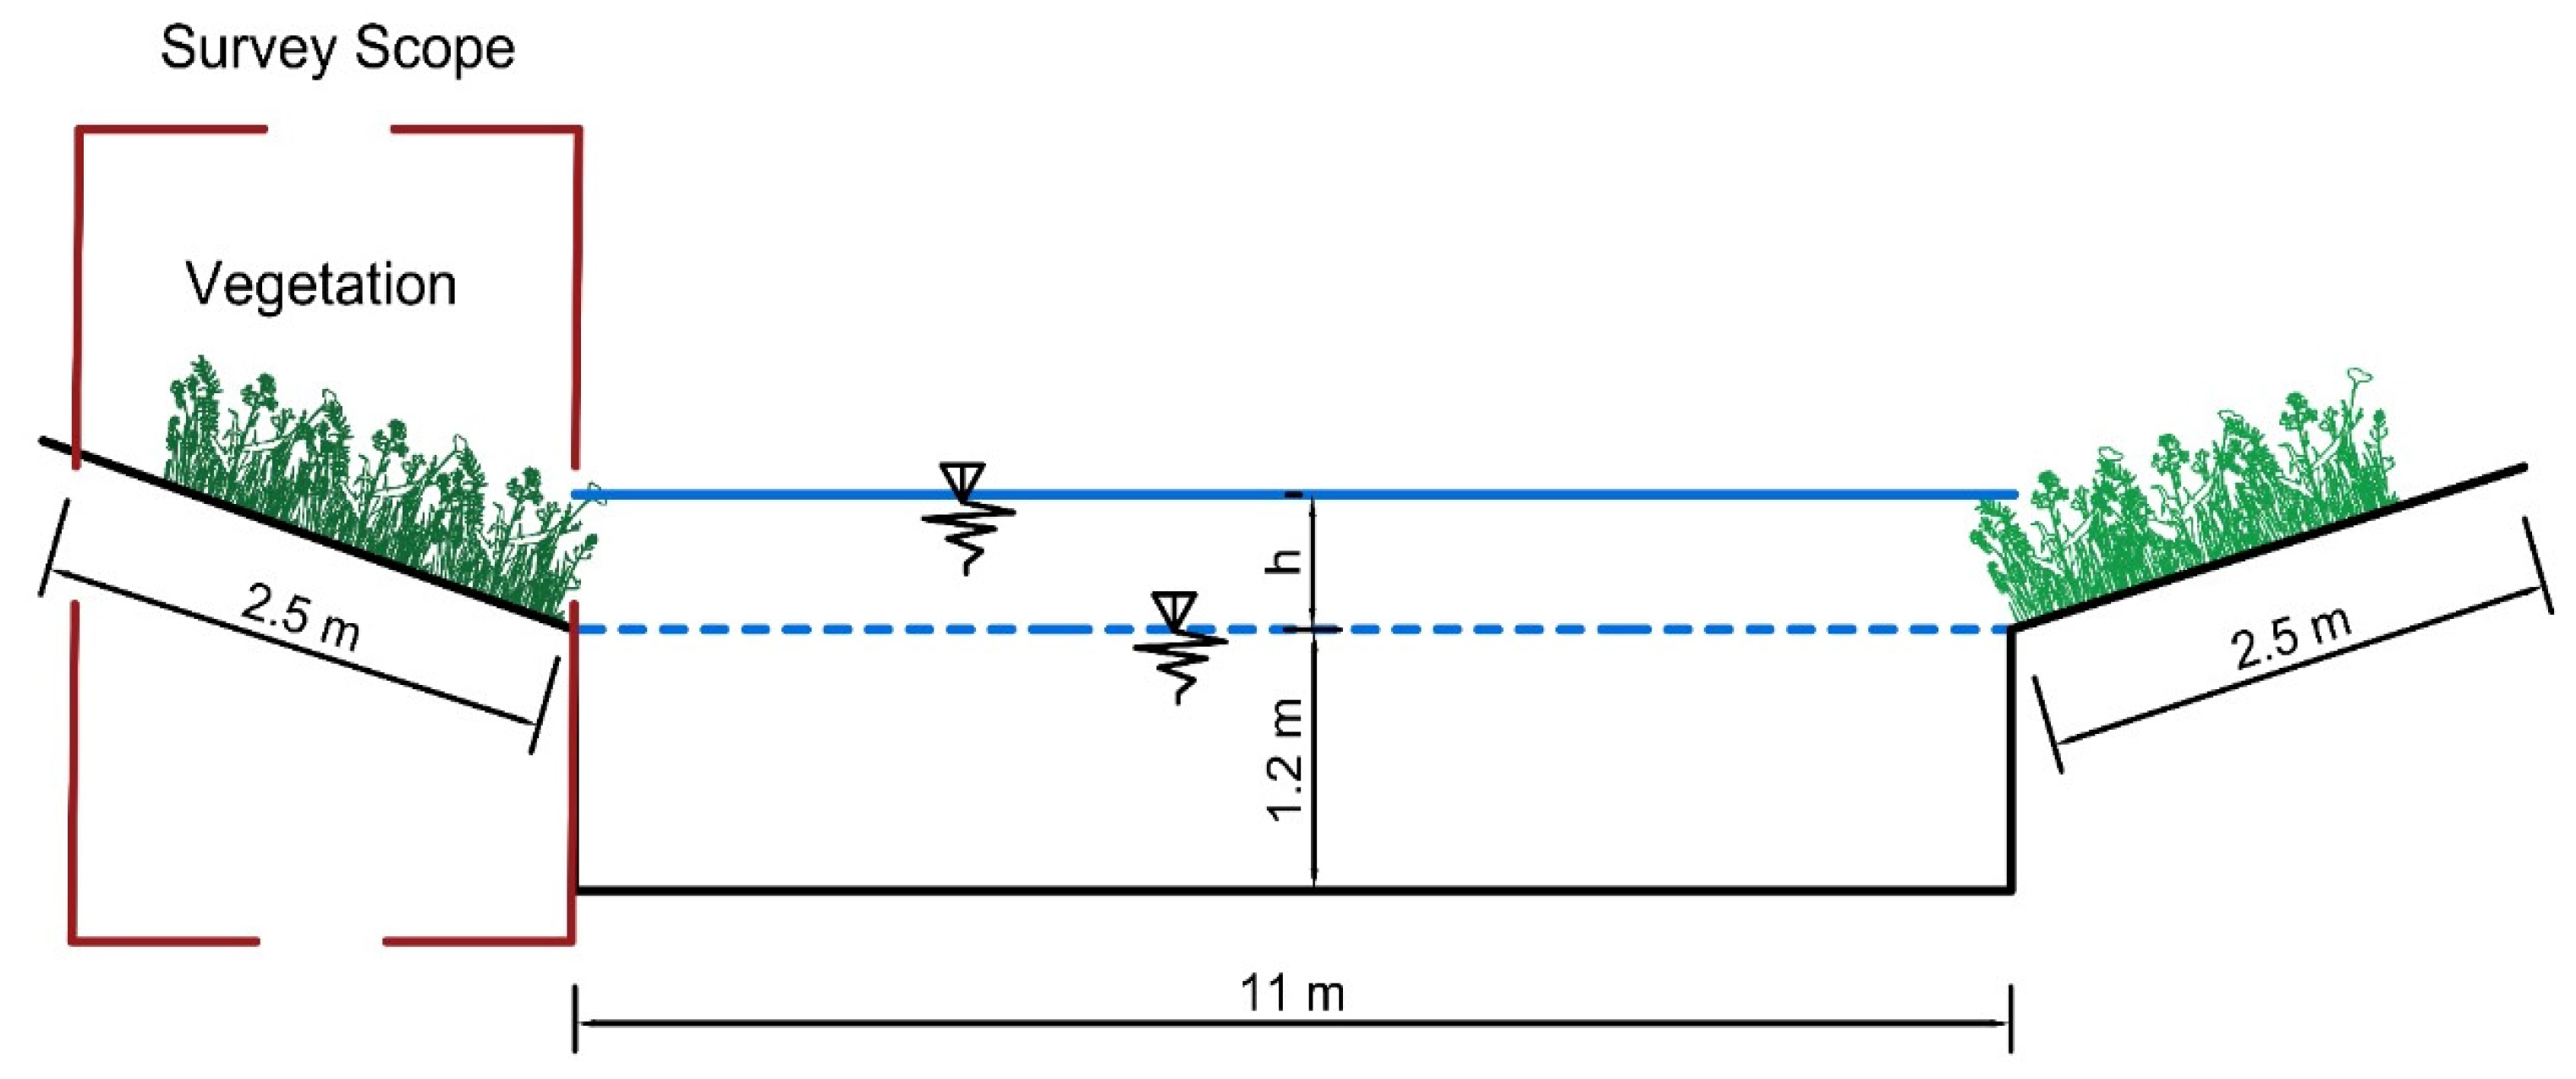
Figure 3.
Temporal variation in riverbank accumulation of mulch film and other macroplastics during the sampling events in 2023–2025: (a) item abundance (item/m2), (b) surface area coverage (%), and (c) weight density (g/m2).
Figure 3.
Temporal variation in riverbank accumulation of mulch film and other macroplastics during the sampling events in 2023–2025: (a) item abundance (item/m2), (b) surface area coverage (%), and (c) weight density (g/m2).
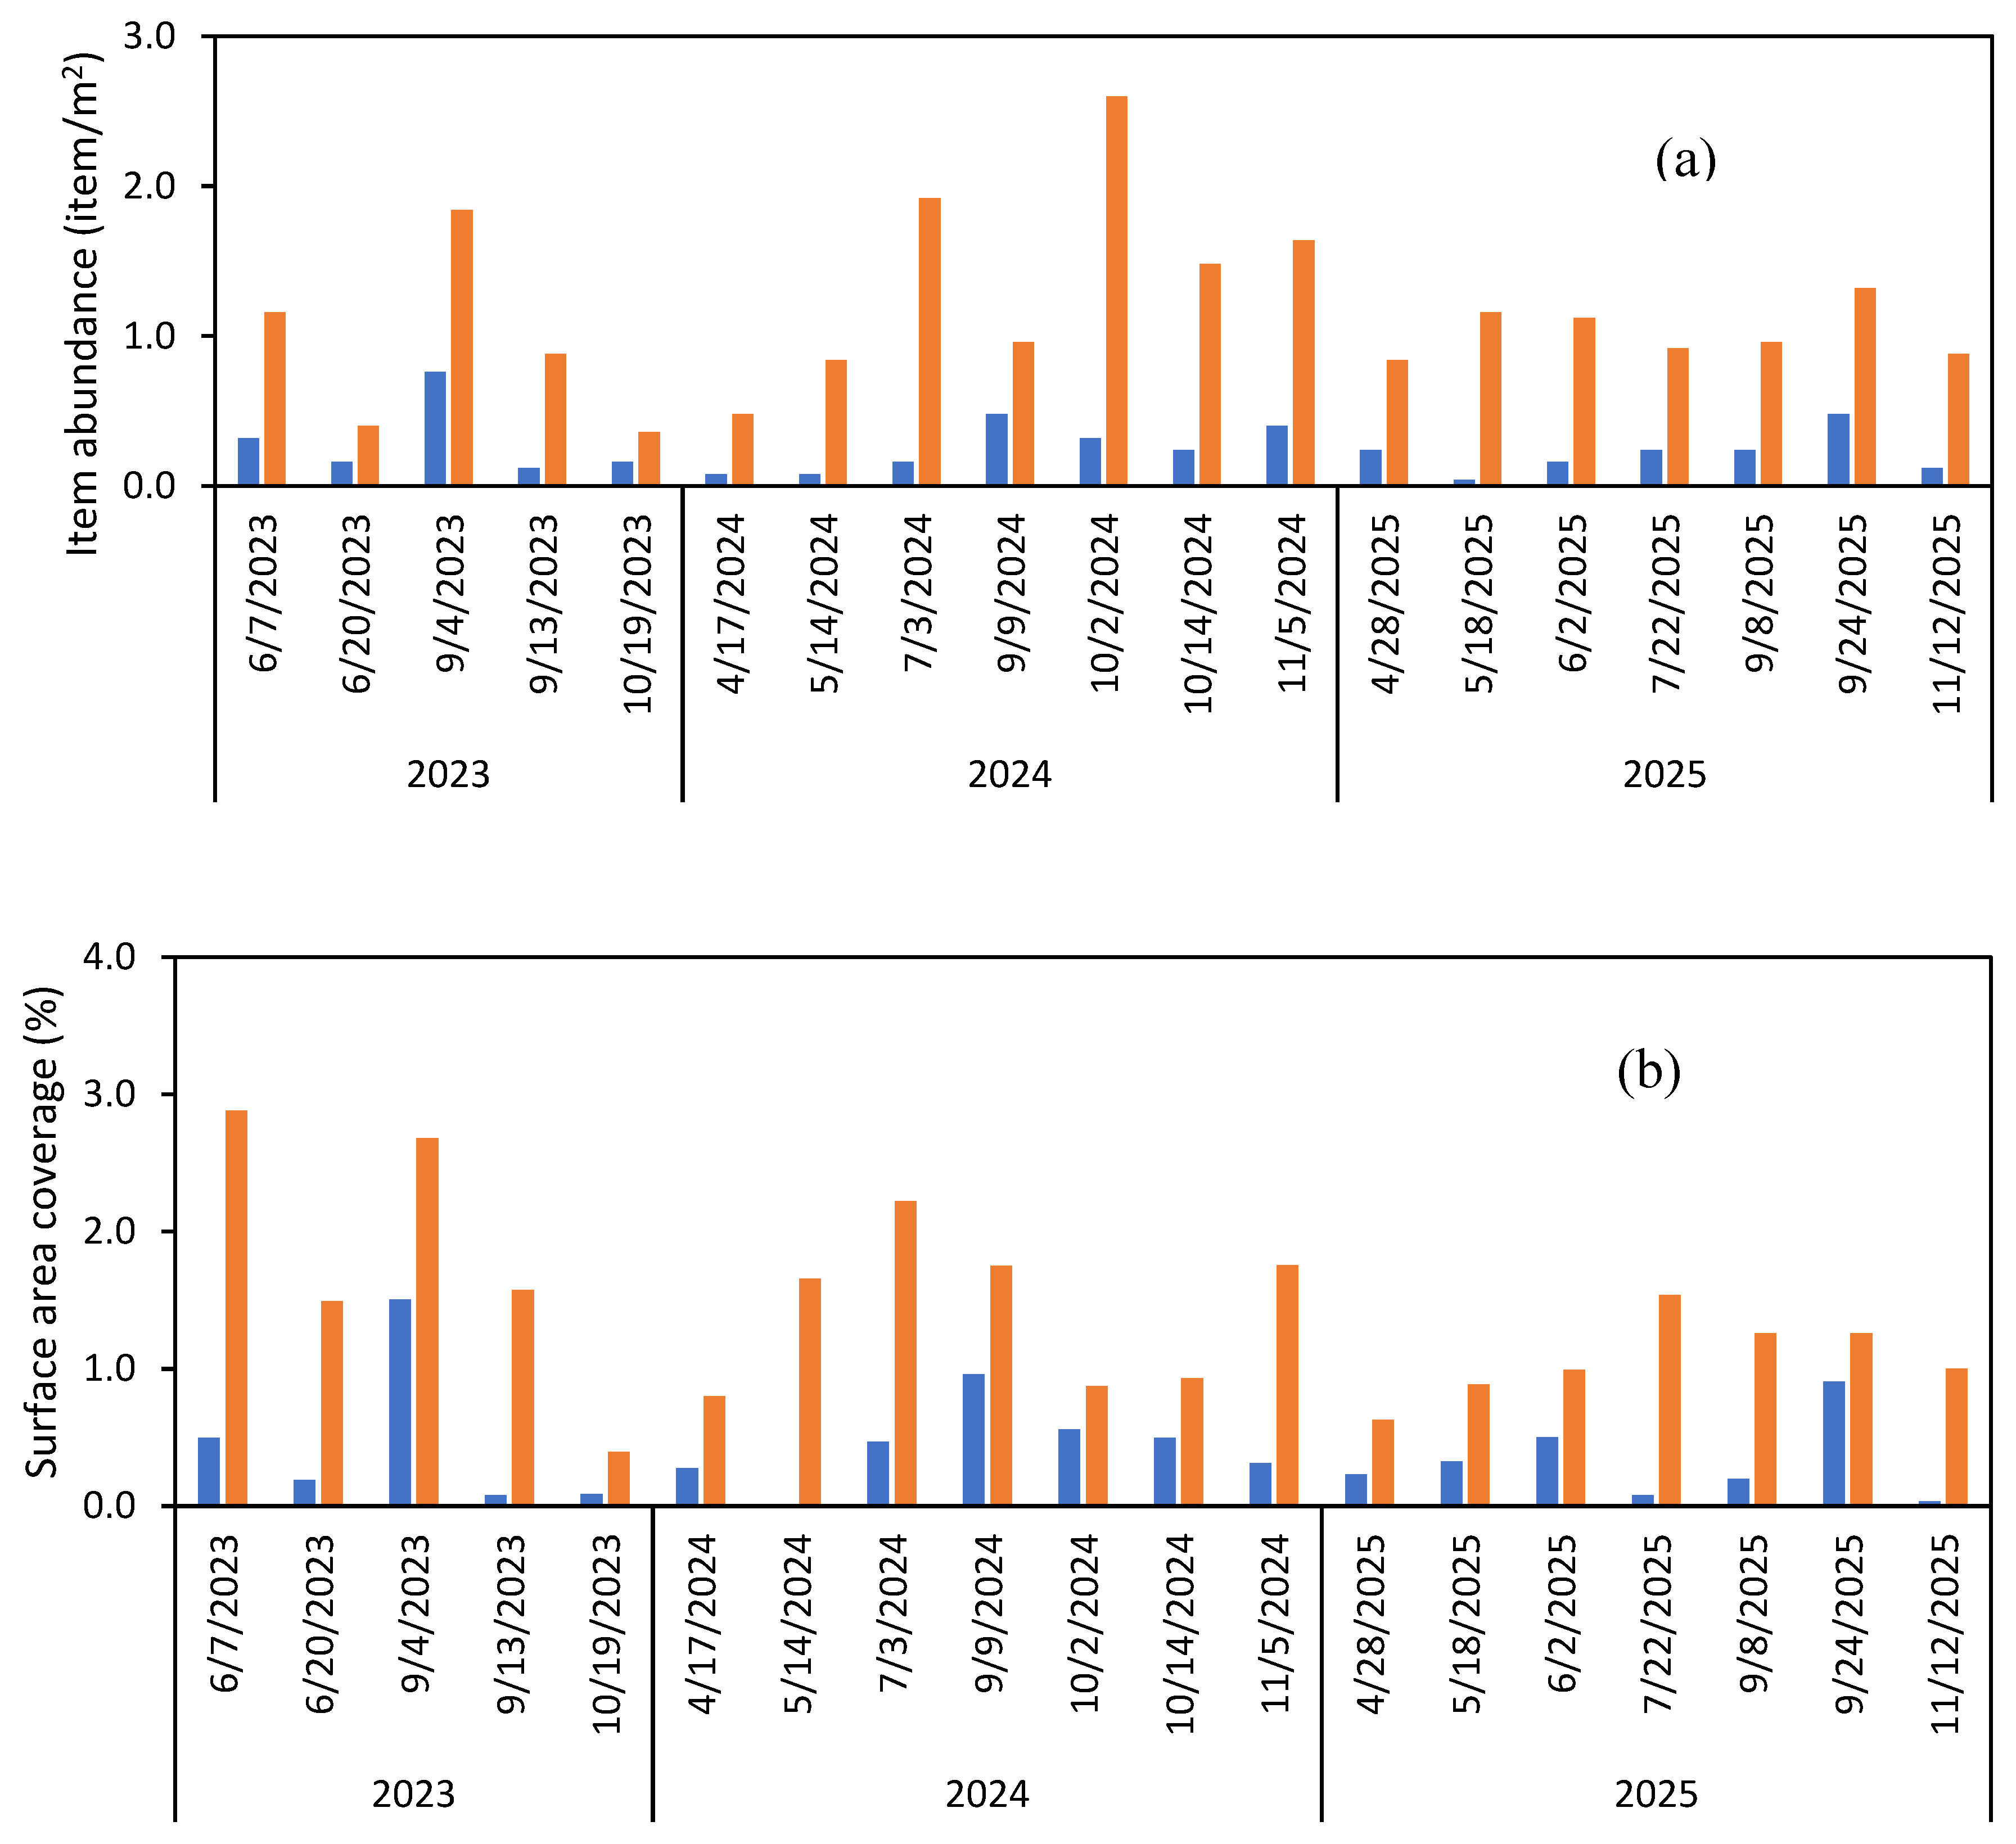
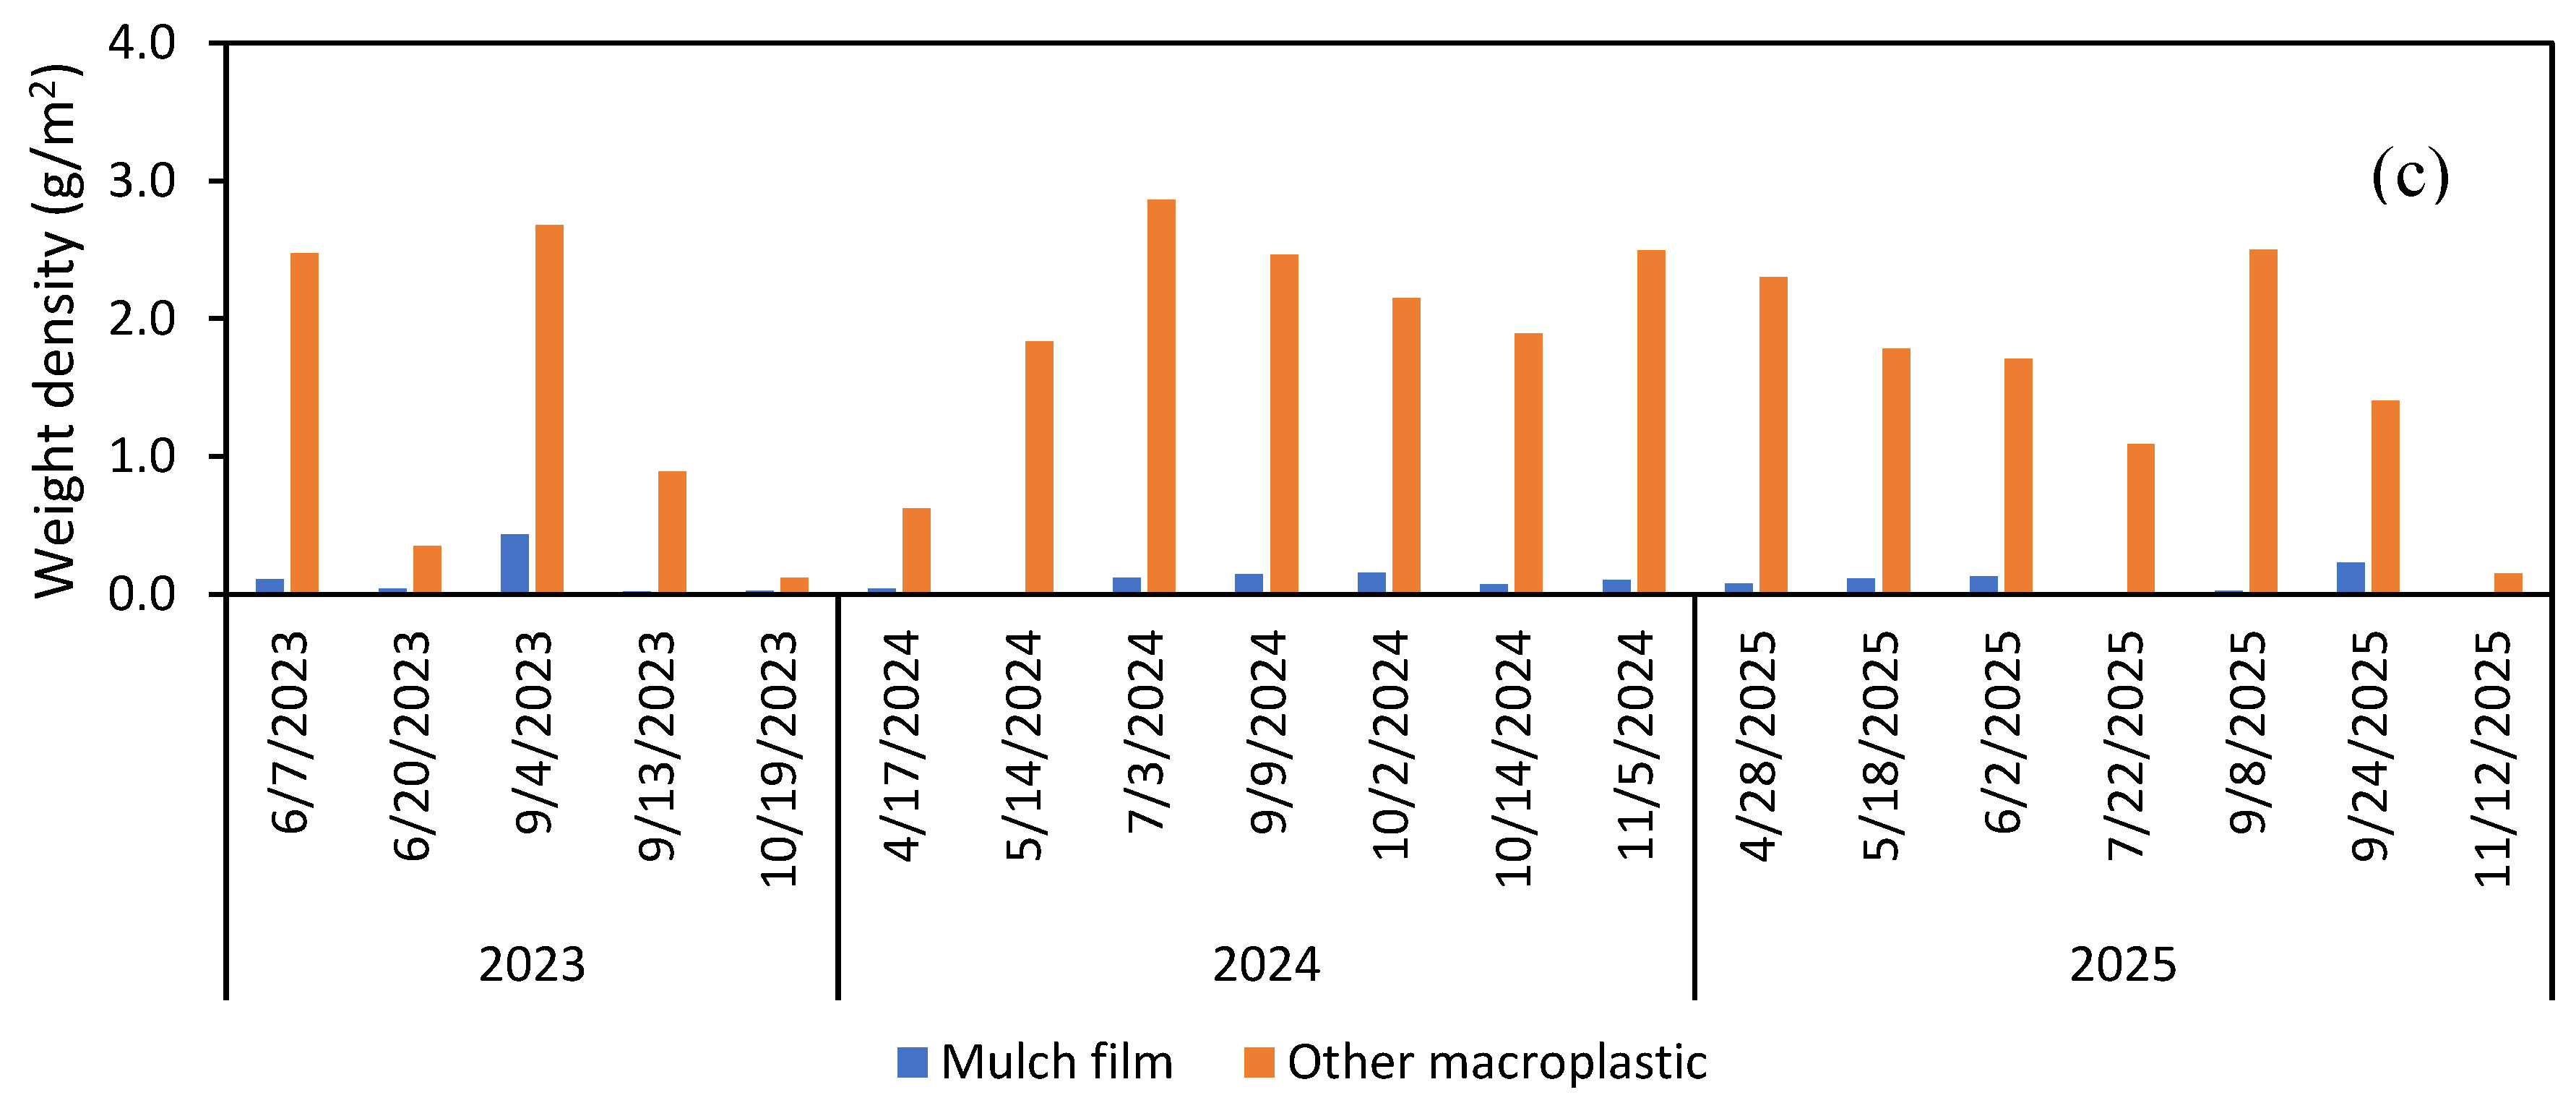
Figure 4.
Mulch film accumulation on the riverbank by film color, 2023–2025: (a) surface area coverage (%) and (b) weight density (g/m2).
Figure 4.
Mulch film accumulation on the riverbank by film color, 2023–2025: (a) surface area coverage (%) and (b) weight density (g/m2).
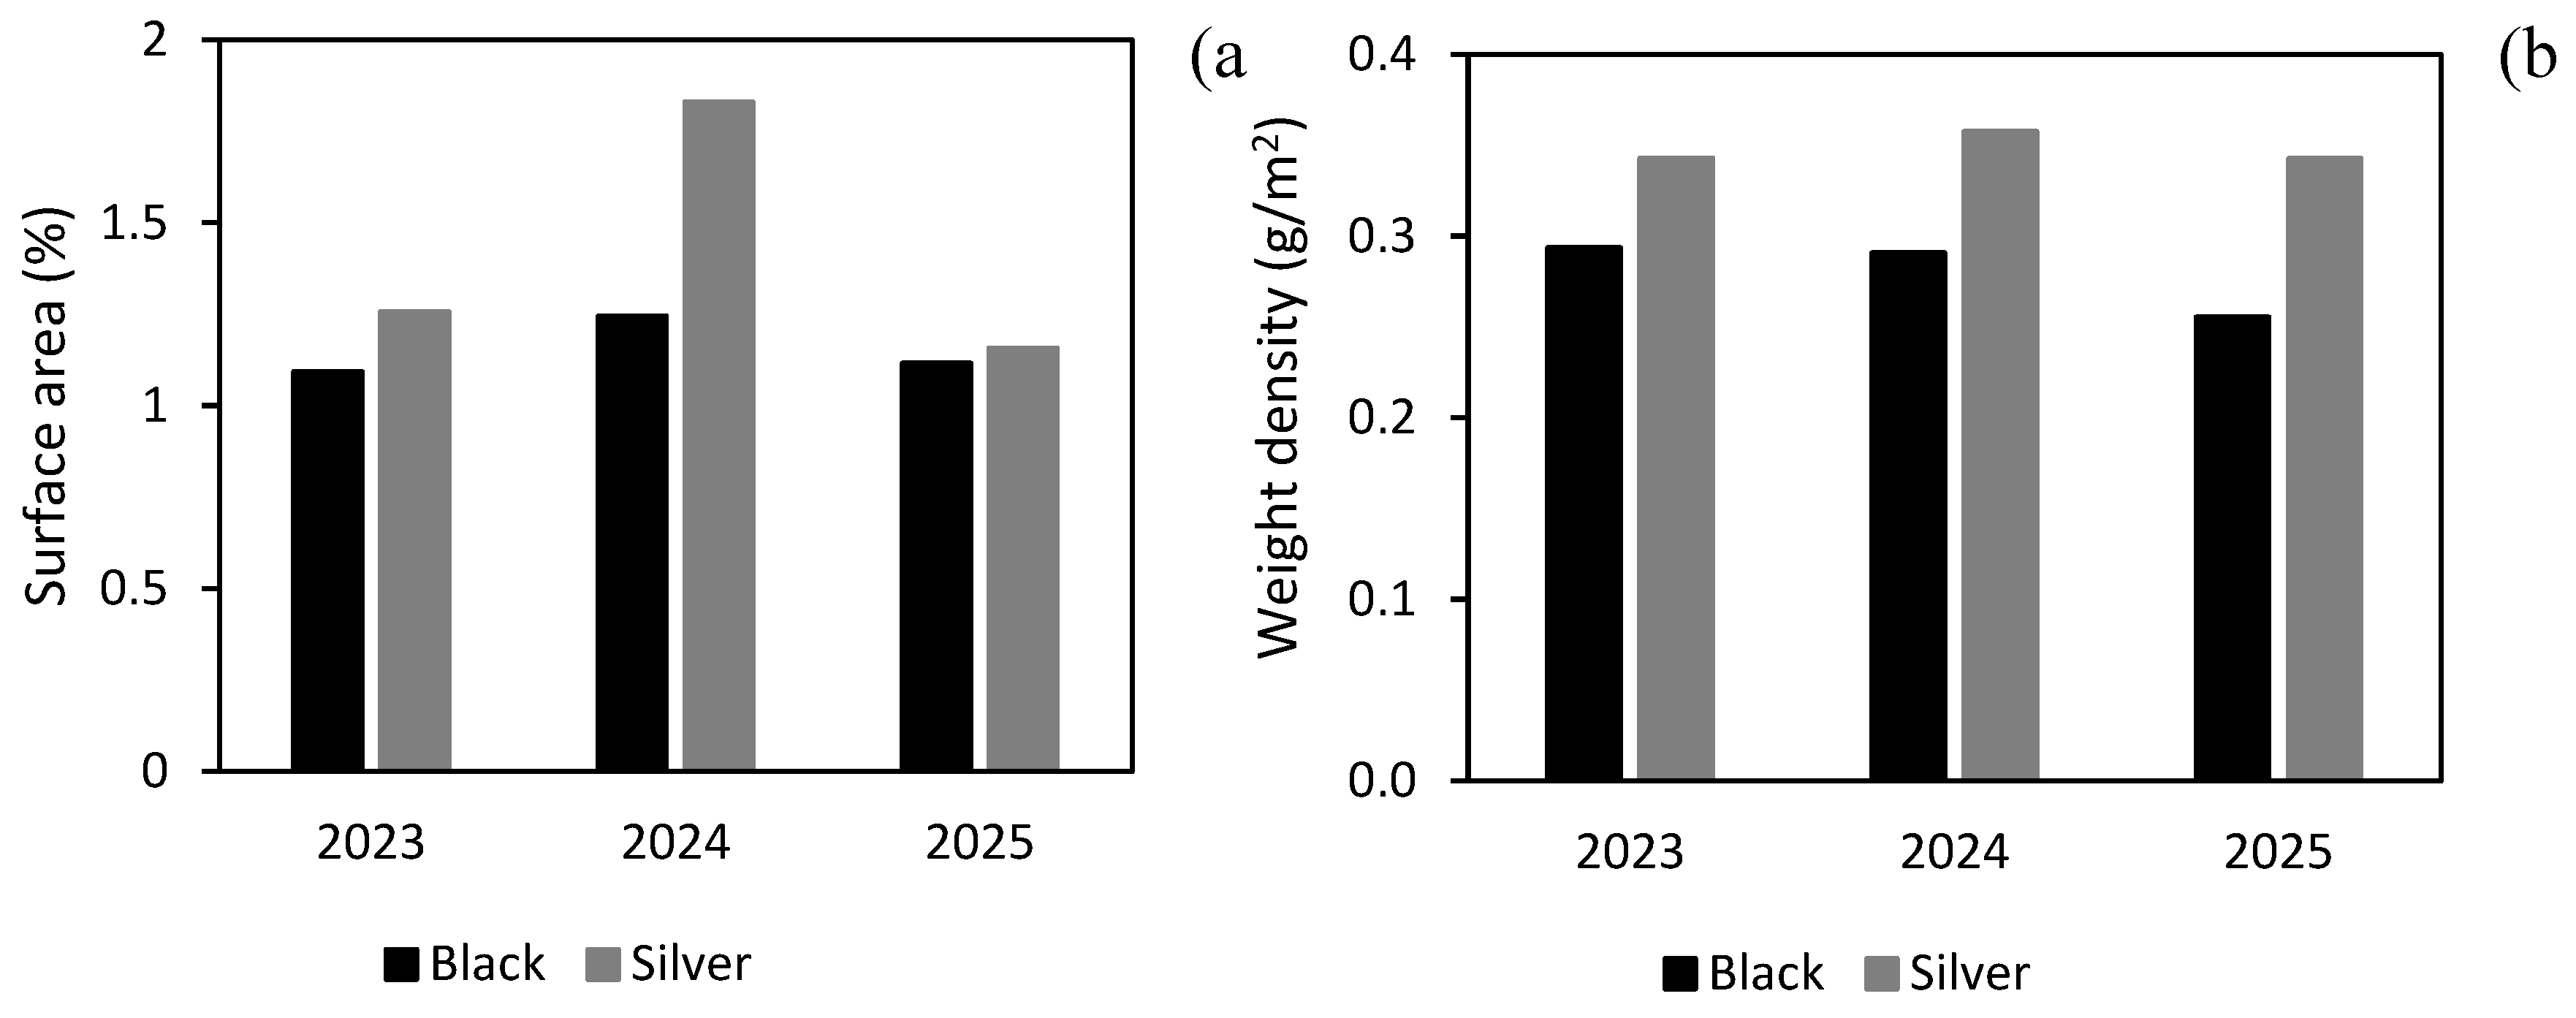
Figure 5.
Mulch film usage area by tobacco cultivation across three years survey (2023–2025).
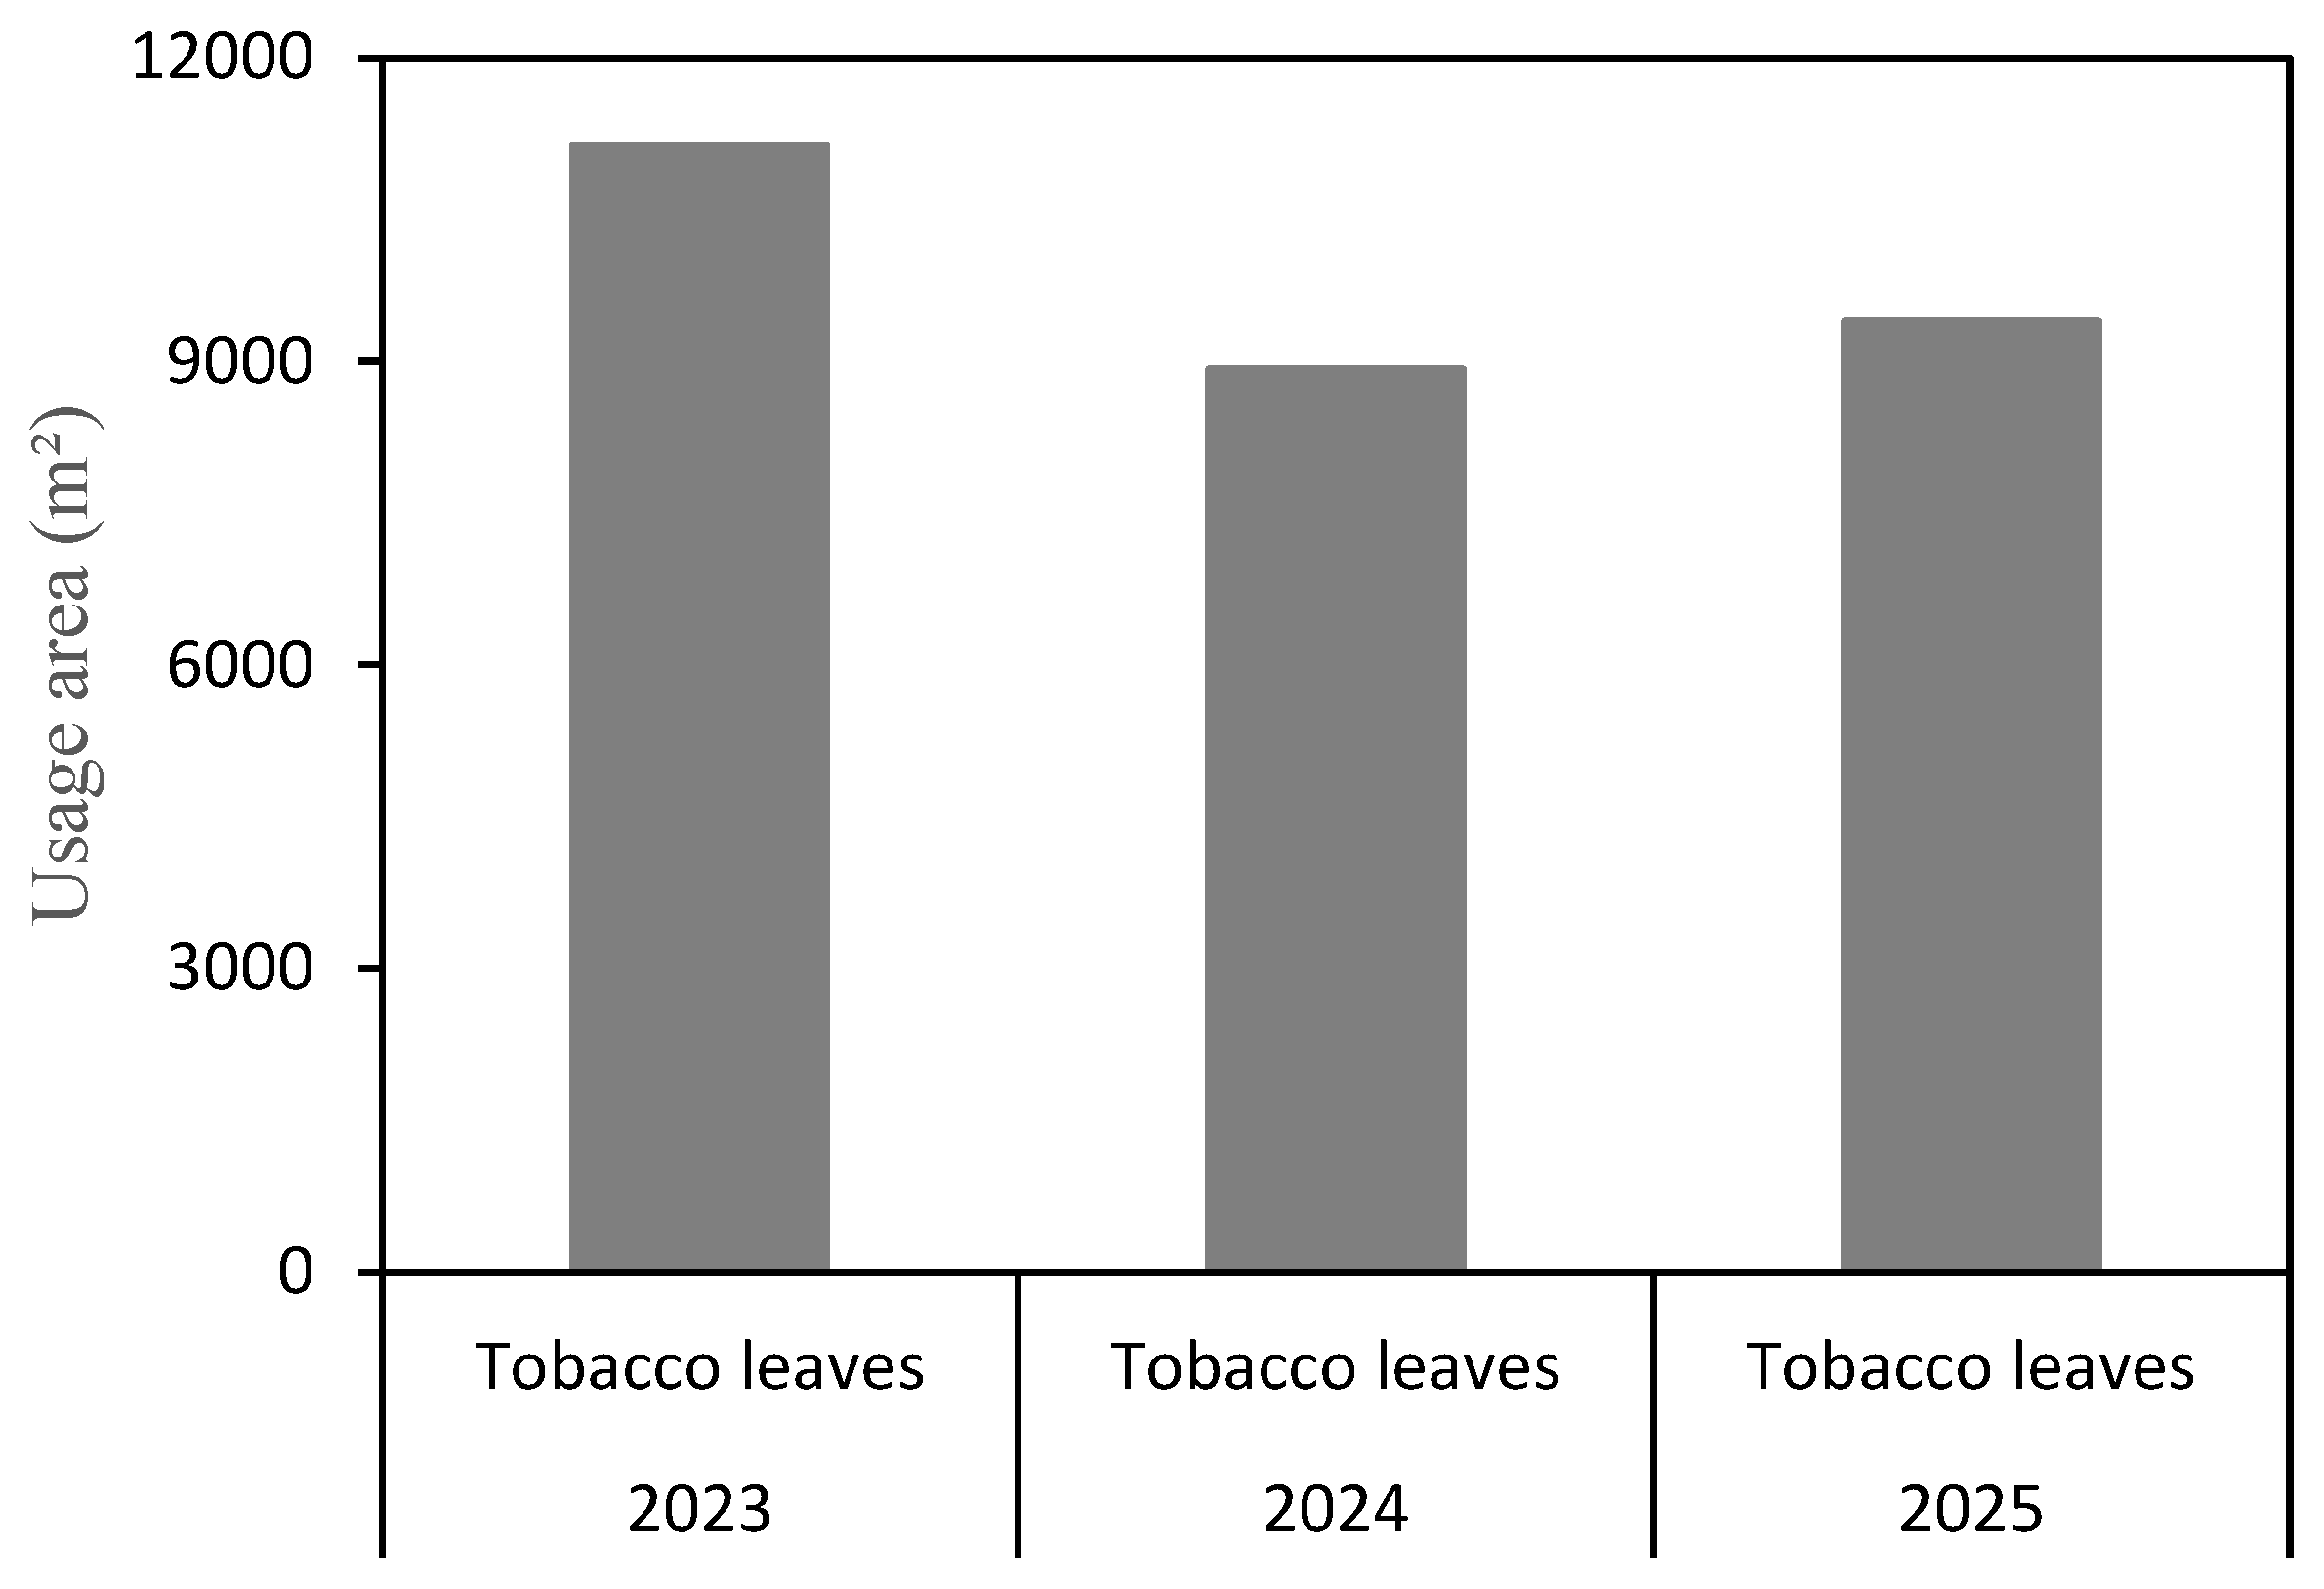
Figure 6.
Spatial distribution and hotspot density of agricultural mulch film in the Hamada River catchment during summer and autumn.
Figure 6.
Spatial distribution and hotspot density of agricultural mulch film in the Hamada River catchment during summer and autumn.
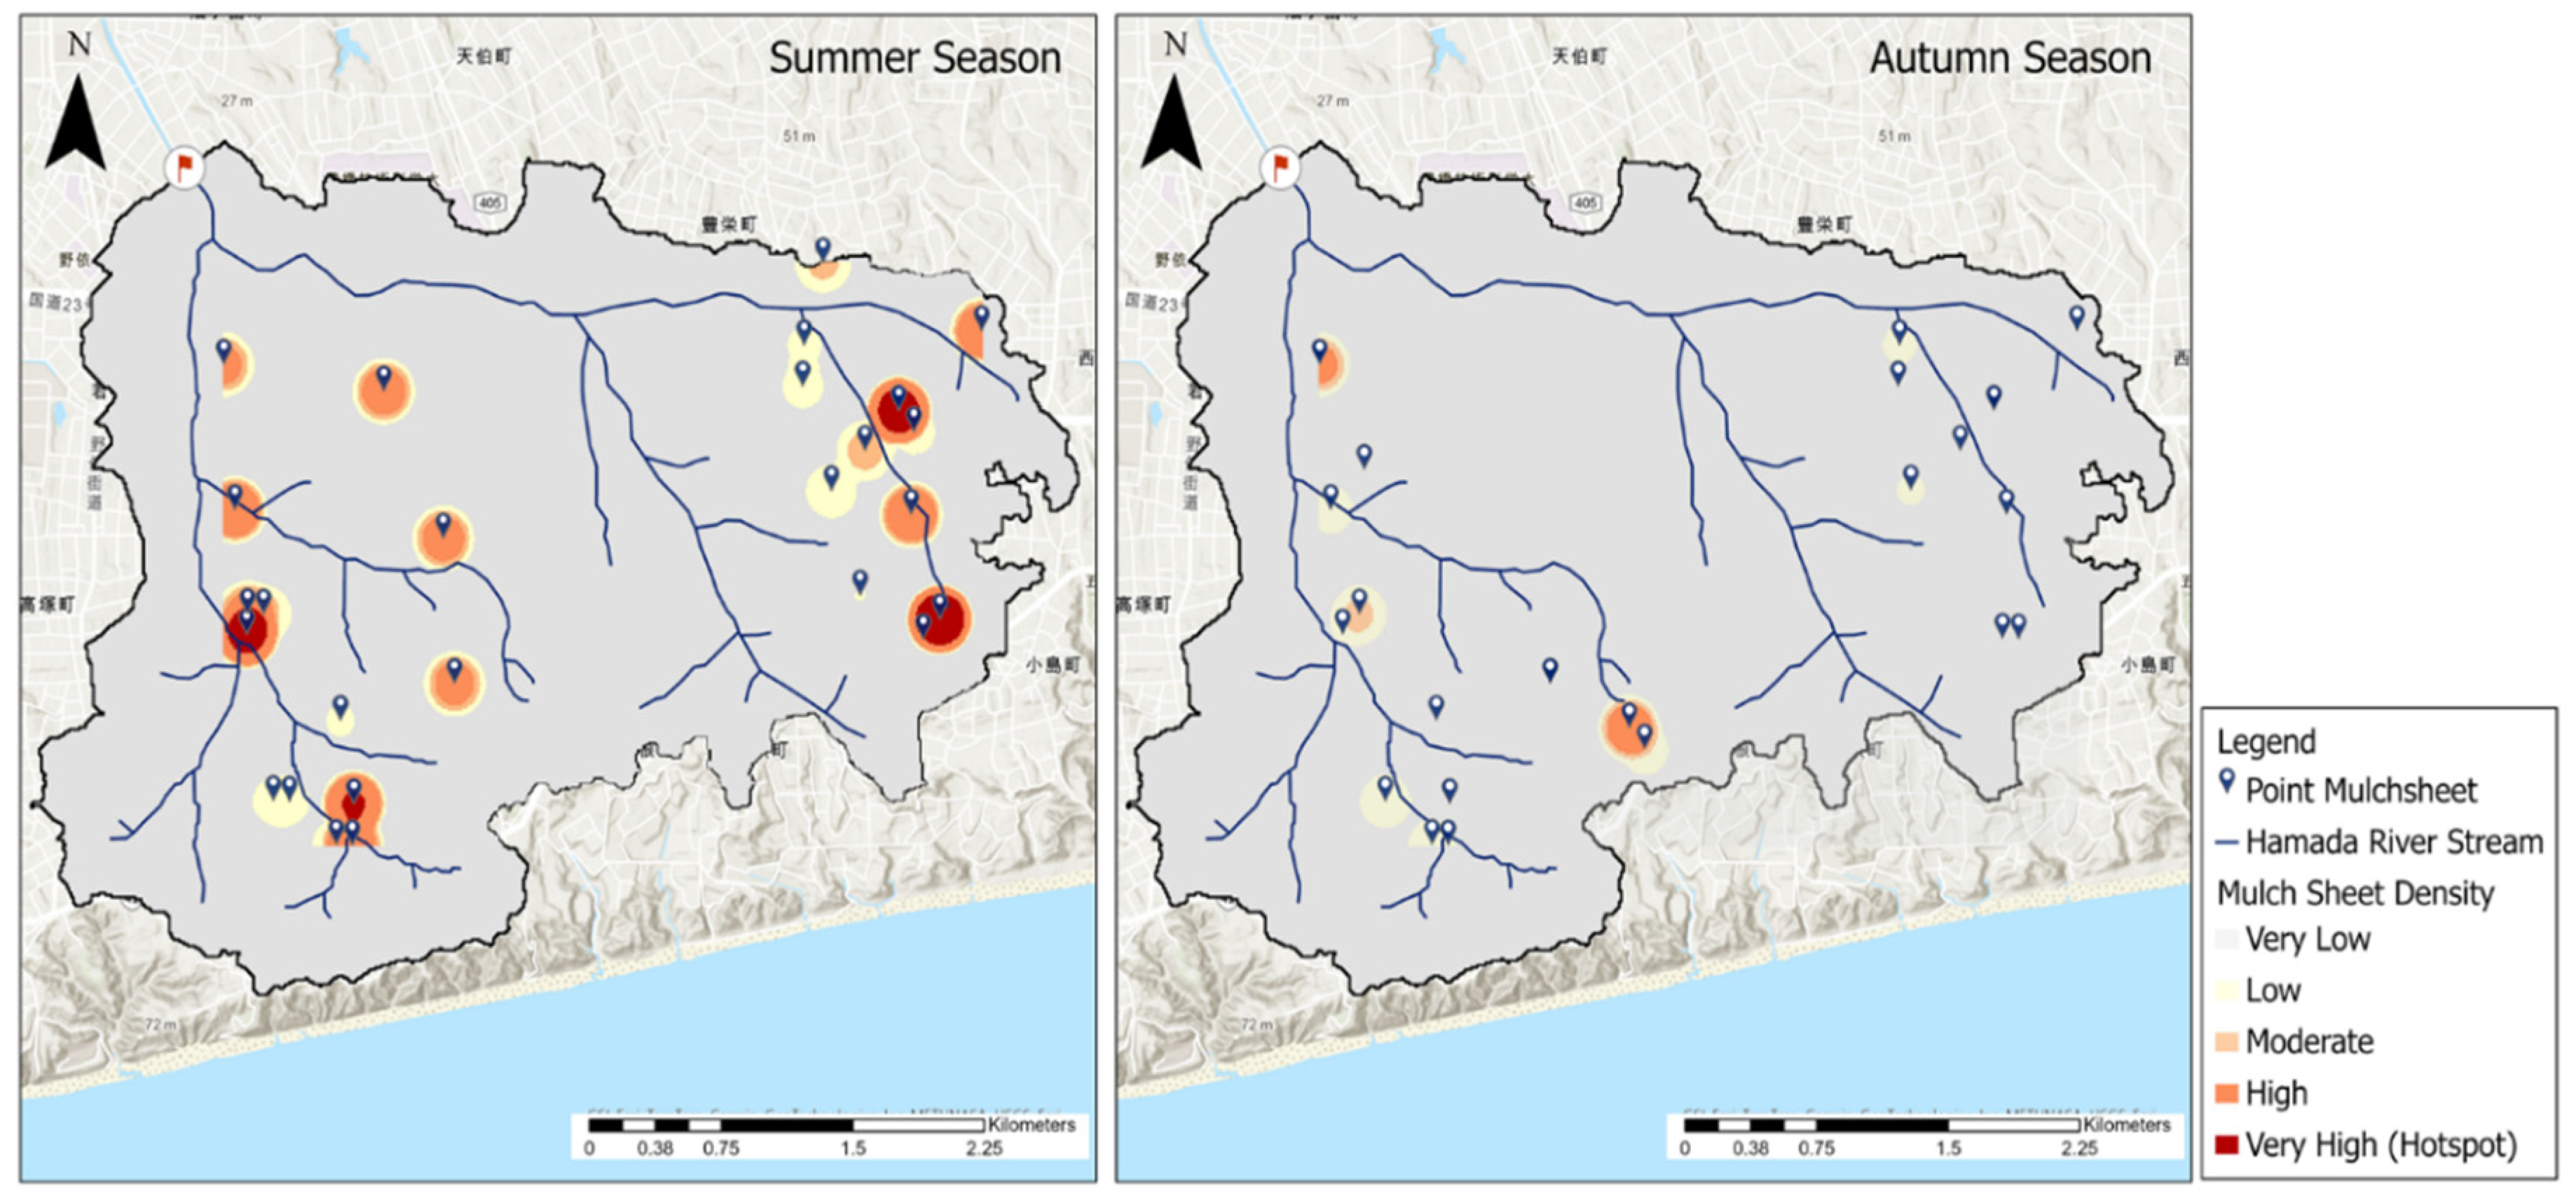
Figure 7.
Temporal variations in Hamada River water level with the sampling dates and 1.2-m threshold: (a) 2023 and (b) 2025.
Figure 7.
Temporal variations in Hamada River water level with the sampling dates and 1.2-m threshold: (a) 2023 and (b) 2025.
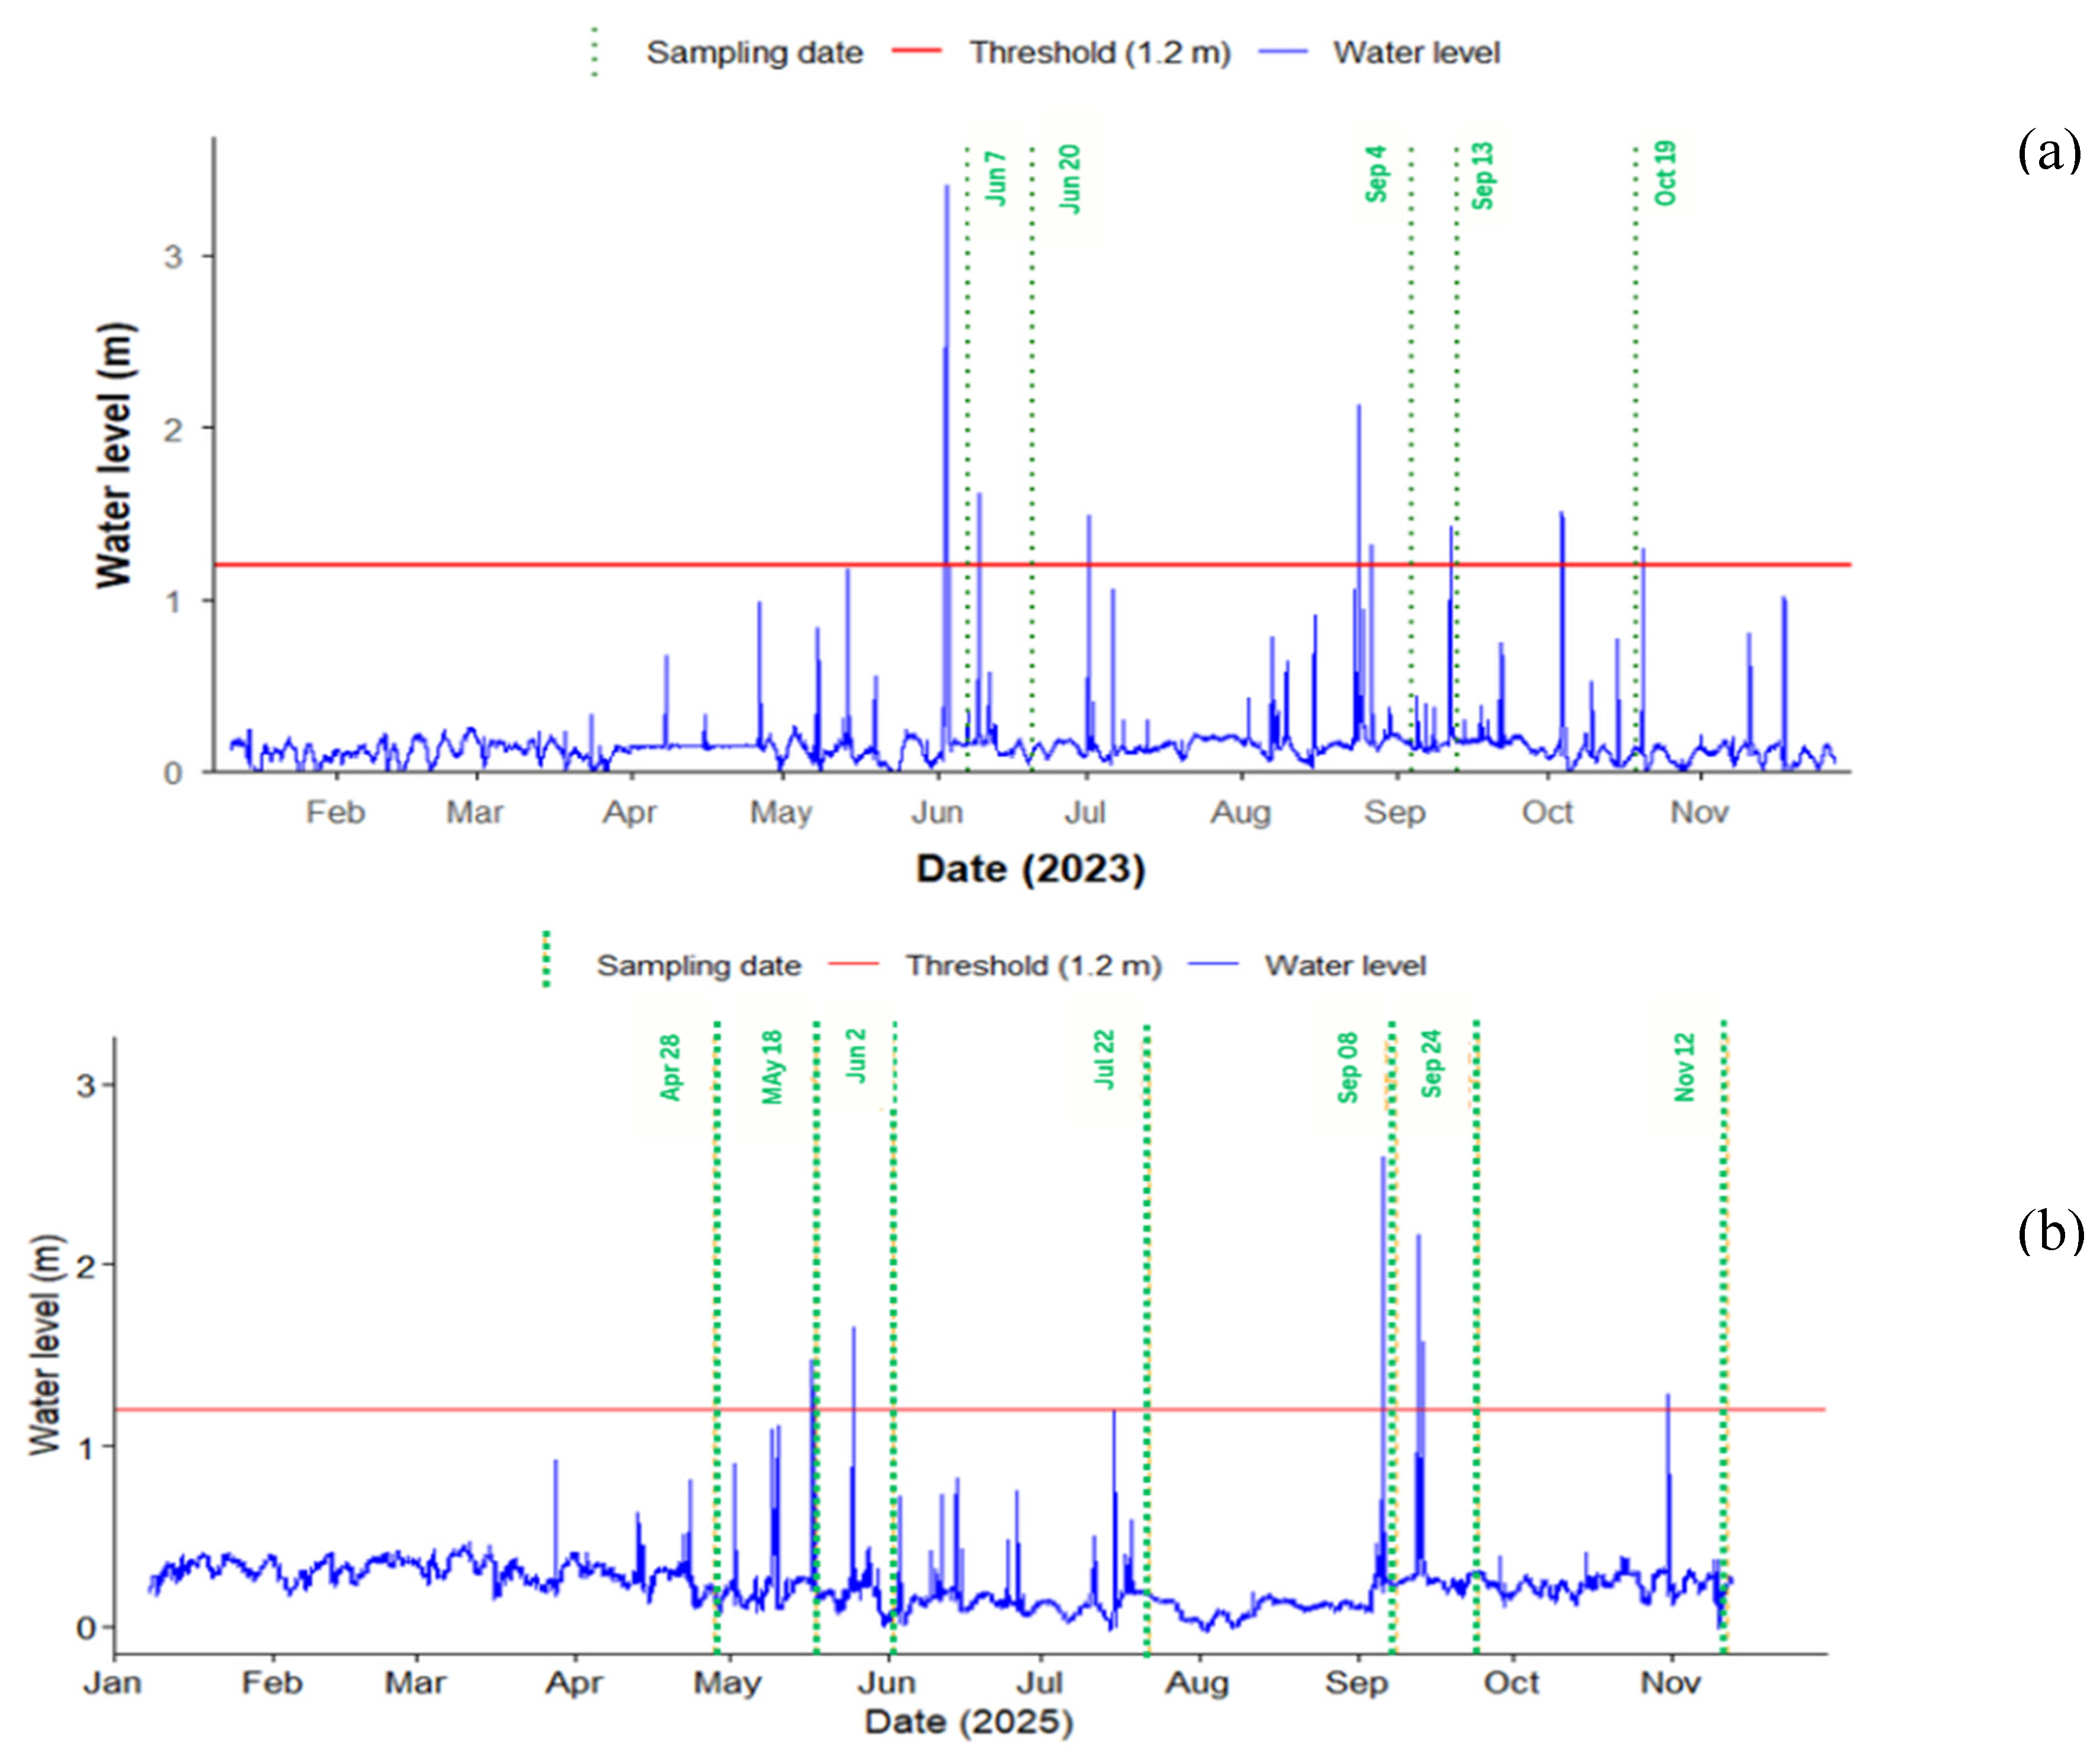
Figure 8.
Spearman rank correlation matrices between hydrological variables and riverbank accumulation metrics for mulch film (red, lower left) and other macroplastics (blue, upper right); n = 12 for both. Correlations among the three hydrological variables are identical in both panels. Two-tailed test; *p < 0.05.
Figure 8.
Spearman rank correlation matrices between hydrological variables and riverbank accumulation metrics for mulch film (red, lower left) and other macroplastics (blue, upper right); n = 12 for both. Correlations among the three hydrological variables are identical in both panels. Two-tailed test; *p < 0.05.
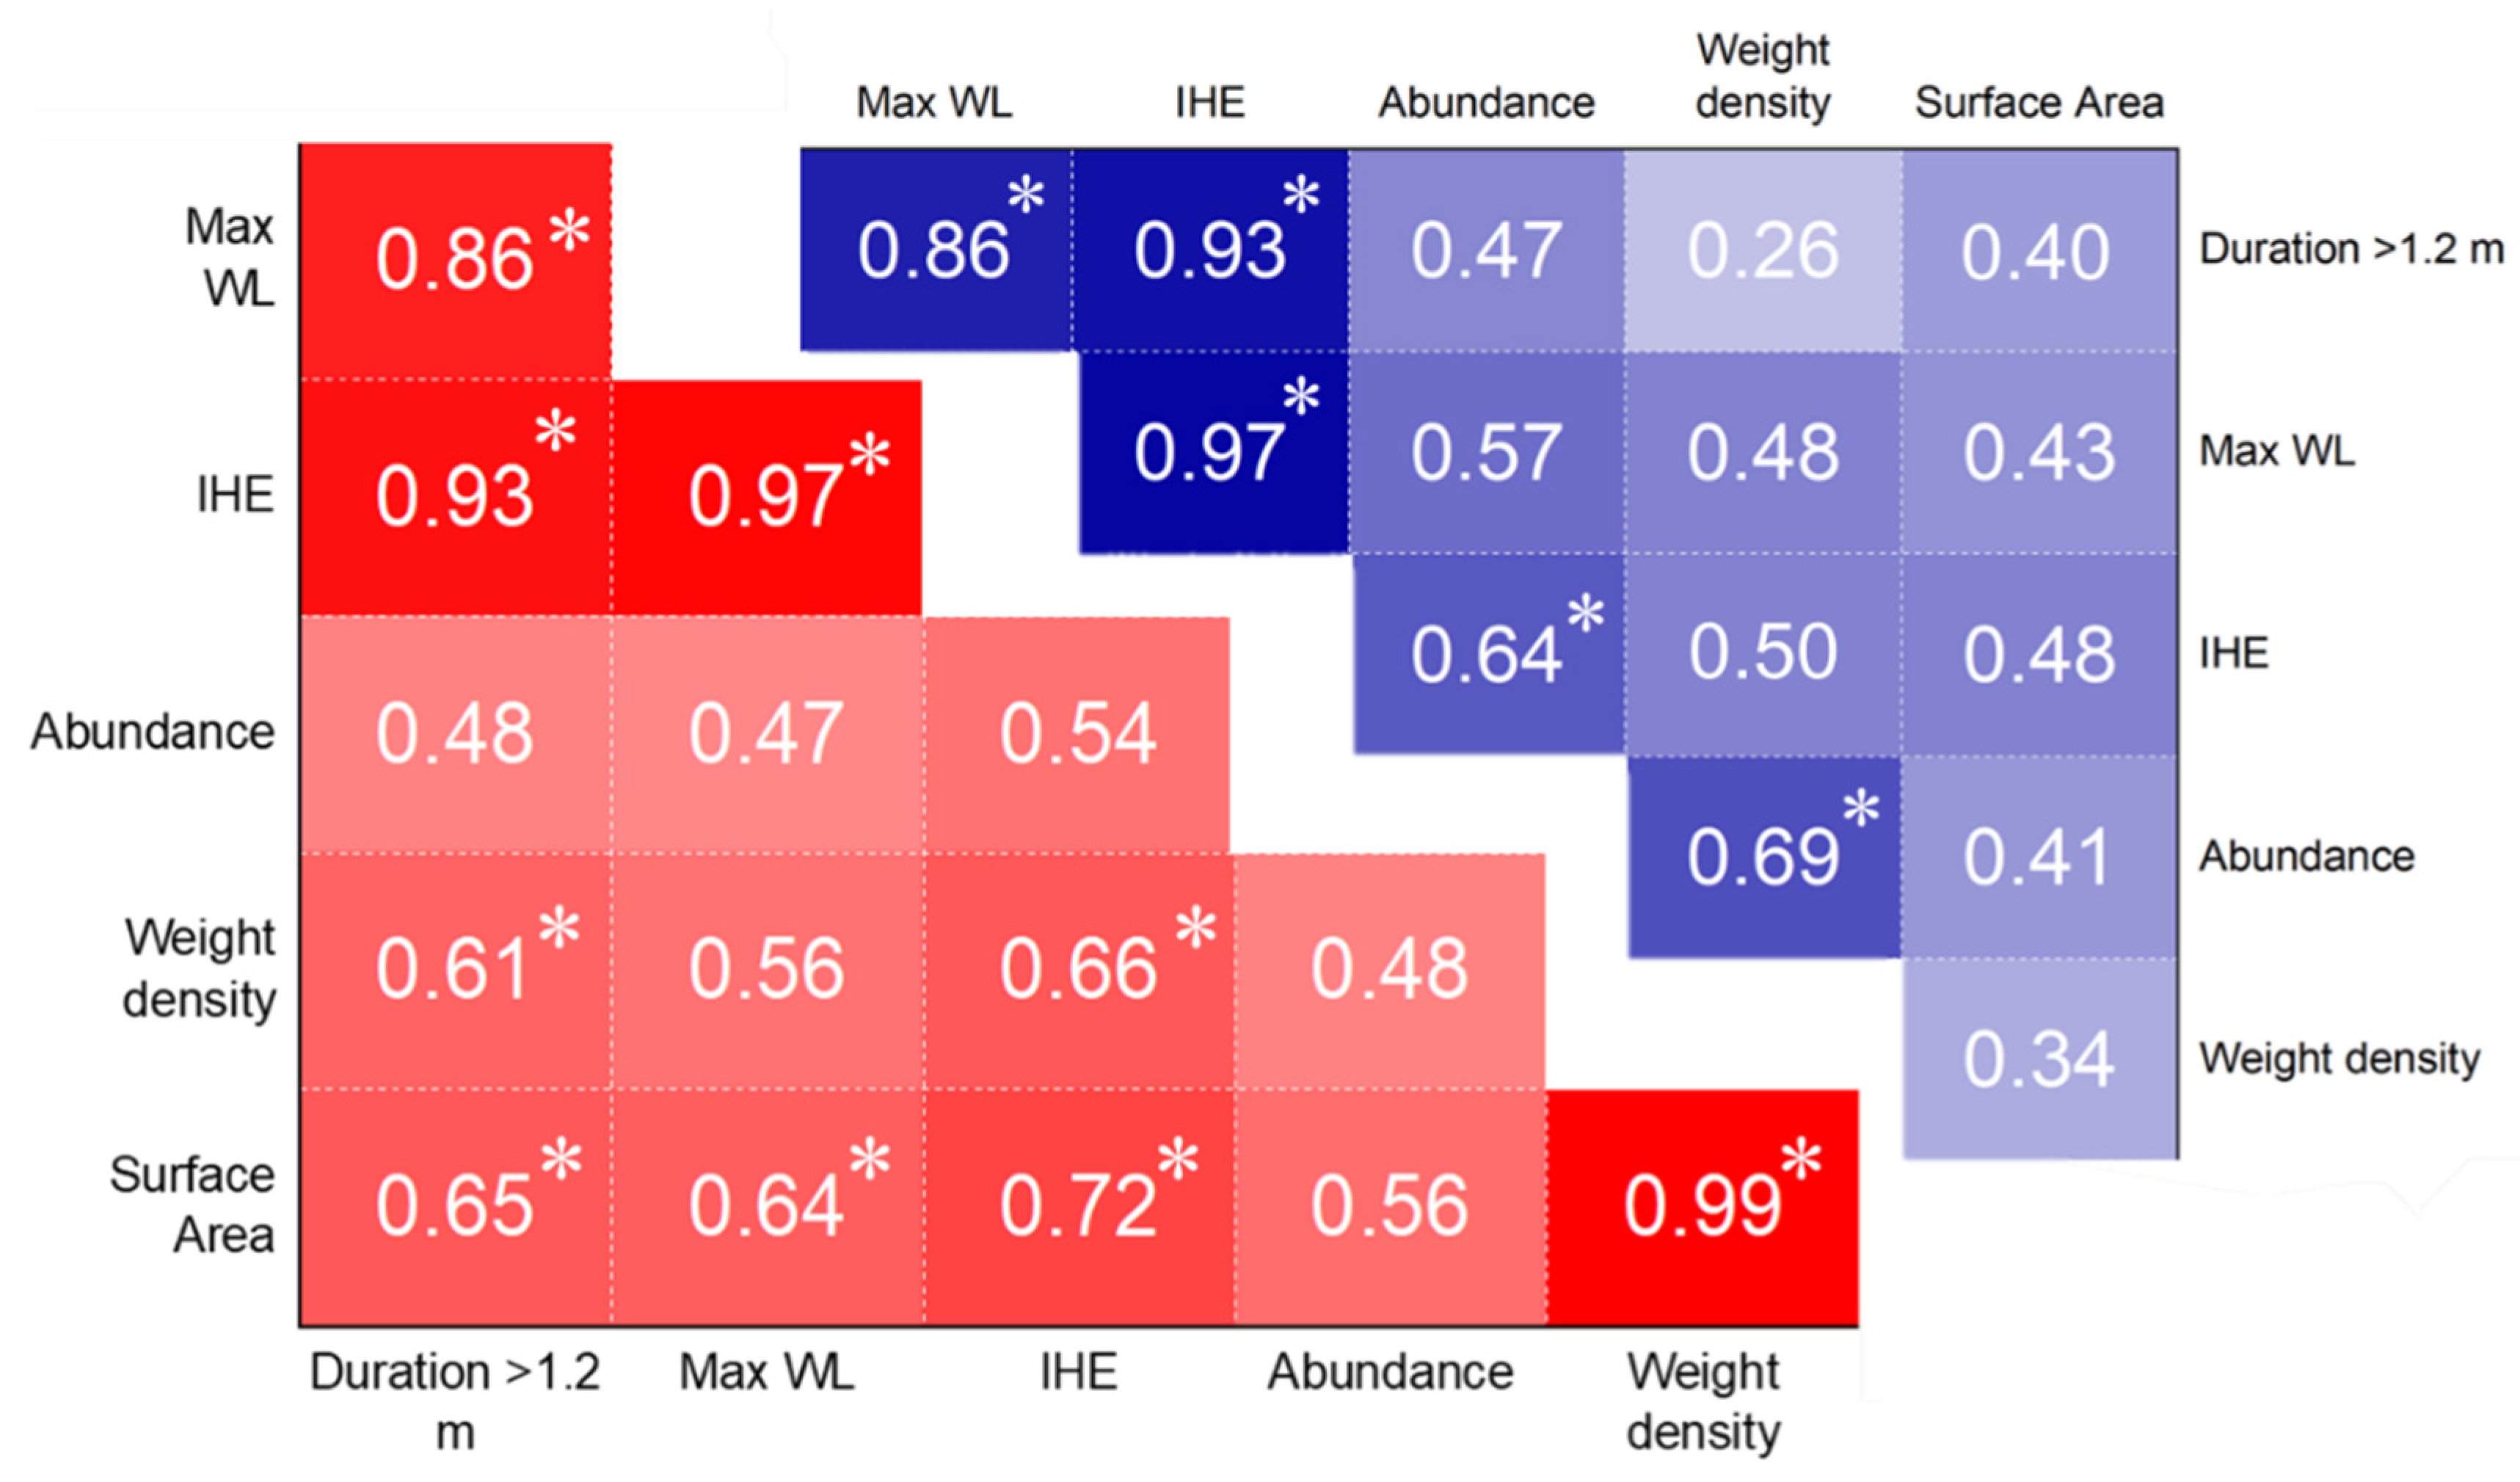

Table 1.
Land use/land cover classification in the watershed.
| Land Use/Land Cover | Area (km2) | Catchment (%) |
|---|---|---|
| Water bodies | 0.0001 | 0.0 |
| Built-up (Urban) | 3.91 | 22.2 |
| Paddy field | 0.95 | 5.4 |
| Cropland (Farmland) | 7.10 | 40.3 |
| Grassland | 1.34 | 7.6 |
| Deciduous broad-leaved forest | 0.22 | 1.2 |
| Evergreen broad-leaved forest | 0.20 | 1.2 |
| Evergreen needle-leaved forest | 0.15 | 0.9 |
| Bare | 0.28 | 1.6 |
| Bamboo forest | 1.39 | 7.9 |
| Solar panel | 0.18 | 1.0 |
| Green house | 0.60 | 3.4 |
| Wetland | 1.29 | 7.3 |
| Total | 17.62 | 100 |
Table 2.
Seasonal variation in agricultural mulch film area and coverage.
| Area (m2) | Catchment coverage (%) | Farmland coverage (%) | |
|---|---|---|---|
| Summer | 40,292 | 0.23 | 0.57 |
| Autumn | 1,456 | 0.008 | 0.02 |
Table 3.
Mulch film area (m2) by crop type and film color in the Hamada River catchment in 2025.
| Crop type | Black | Silver | Transparent | White | Total | Season* |
|---|---|---|---|---|---|---|
| Red perilla | 19,320 | 0 | 0 | 0 | 19,320 | Summer only |
| Tobacco leaves | 0 | 9,395 | 0 | 0 | 9,395 | Summer only |
| Watermelon | 1,041 | 0 | 2,738 | 0 | 3,779 | Both |
| Sweet potato | 2,241 | 103 | 36 | 95 | 2,475 | Both |
| Winter melon | 1,208 | 0 | 0 | 1,200 | 2,408 | Both |
| Lettuce | 1,250 | 0 | 0 | 0 | 1,250 | Autumn only |
| Other | 2,010 | 0 | 1,111 | 0 | 3,121 | Both |
*Season: Summer only = film removed after summer harvest; both: film retained across both surveys; autumn only = newly installed in autumn.
Table 4.
Water level exceedance and integrated hydrological exposure (IHE) during each inter-sampling period.
Table 4.
Water level exceedance and integrated hydrological exposure (IHE) during each inter-sampling period.
| Sampling Date | Peak Water Level (m) | Excess depth (m) | Duration >1.2 m (hour) | IHE (m·h) |
|---|---|---|---|---|
| 6/7/2023 | 3.41 | 2.21 | 14.50 | 12.095 |
| 6/20/2023 | 1.62 | 0.42 | 1.83 | 0.346 |
| 9/4/2023 | 2.13 | 0.93 | 2.67 | 1.336 |
| 9/13/2023 | 1.42 | 0.22 | 0.50 | 0.060 |
| 10/19/2023 | 1.51 | 0.31 | 1.83 | 0.231 |
| 4/28/2025 | 0.92 | 0 | 0 | 0 |
| 5/18/2025 | 1.47 | 0.27 | 0.67 | 0.103 |
| 6/2/2025 | 1.65 | 0.45 | 1.50 | 0.450 |
| 7/22/2025 | 1.29 | 0.09 | 0.33 | 0.025 |
| 9/8/2025 | 2.59 | 1.39 | 1.00 | 0.931 |
| 9/24/2025 | 2.17 | 0.97 | 2.33 | 1.200 |
| 11/12/2025 | 1.28 | 0.08 | 0.33 | 0.017 |
Table 5.
Three-year delivery ratio of silver and black mulch film (2023–2025).
| Year | Color | Actual amount stranded of mulch film (measured, m2) |
Estimated mulch film area on riverbank (reach-scale, m2) |
Mulch film area in watersheds (m2) |
Delivery Ratio (%, Eq. 5) |
|---|---|---|---|---|---|
| 2023 | Silver | 0.314 | 18.85 | 11,135 | 0.17 |
| 2024 | 0.457 | 27.45 | 8,920 | 0.31 | |
| 2025 | 0.289 | 17.35 | 9,395 | 0.18 | |
| Black | 0.279 | 16.74 | 27,070 | 0.06 |
Disclaimer/Publisher’s Note: The statements, opinions and data contained in all publications are solely those of the individual author(s) and contributor(s) and not of MDPI and/or the editor(s). MDPI and/or the editor(s) disclaim responsibility for any injury to people or property resulting from any ideas, methods, instructions or products referred to in the content. |
© 2026 by the authors. Licensee MDPI, Basel, Switzerland. This article is an open access article distributed under the terms and conditions of the Creative Commons Attribution (CC BY) license (http://creativecommons.org/licenses/by/4.0/).
Copyright: This open access article is published under a Creative Commons CC BY 4.0 license, which permit the free download, distribution, and reuse, provided that the author and preprint are cited in any reuse.