
Submitted:
15 September 2026
Posted:
15 September 2026
You are already at the latest version
Abstract
Predicting the interaction and competition of multiple hydraulic fractures is essential for designing efficient stimulation treatments in shale reservoirs. This study develops a two-dimensional hydro-mechanical finite-discrete element method (FDEM) framework that couples Biot poroelasticity, Darcy flow in the rock matrix, cubic-law flow in fractures, Carter-type leak-off, cohesive-zone damage, and post-failure block contact. The model is verified against the classical KGD solution; the relative errors in fracture half-length and maximum aperture remain below 3%. A parametric study is then performed to quantify the effects of horizontal principal stress difference, cluster spacing, injection rate, and fracturing-fluid viscosity on multi-cluster fracture growth. Increasing the horizontal stress difference suppresses deflection and branching and promotes nearly planar fracture growth. Increasing cluster spacing weakens stress-shadow interference, and the middle-fracture length increases from 18.5 m at 5 m spacing to 39.8 m at 20 m spacing. Increasing the injection rate from 6 to 12 m3/min raises the maximum fracture aperture from 1.4 to 3.2 mm and promotes secondary branching. Low-viscosity fluid enhances leak-off and shear-dominated branching, whereas high-viscosity fluid favors wider, tensile-dominated fractures; at 100 mPa·s, the branching frequency is 72% lower than in the 1 mPa·s case. The combined results indicate that a high injection rate, moderate cluster spacing, and subsequent low-viscosity slickwater displacement provide a favorable strategy for enhancing fracture-network development. The framework provides a process-oriented numerical basis for parameter screening and hydraulic-fracturing design in shale reservoirs.
Keywords:
hydraulic fracturing
; finite-discrete element method (FDEM)
; shale reservoir
; hydromechanical coupling
; multi-cluster fractures
; stress shadow
; fracture propagation
1. Introduction
Hydraulic fracturing is a key stimulation process for improving fluid access to low-porosity and low-permeability unconventional reservoirs. Its effectiveness depends not only on creating individual fractures but also on controlling the geometry, connectivity, and interaction of multiple fractures initiated from closely spaced clusters. During treatment, fracture growth is governed by the coupled effects of in-situ stress, rock deformation, fluid pressure, leak-off, fracture interaction, and operational parameters. Consequently, understanding the mechanisms that control fracture deflection, branching, aperture, and stress-shadow interference is central to improving stimulated reservoir volume (SRV) and treatment efficiency [1,2,3,4,5,6,7,8].
Field observations and previous studies have shown that in-situ stress is a primary control on hydraulic-fracture orientation and extent [9,10,11]. Analytical models such as the PKN, KGD, and penny-shaped formulations provide important benchmarks for idealized fracture growth [12,13,14,15,16,17,18,19,20,21,22], but their simplifying assumptions limit their ability to represent branching, coalescence, contact, and multi-fracture competition. Conventional finite-element approaches can also require remeshing as cracks propagate, while enriched or discontinuum-based approaches are better suited to evolving fracture paths [23,24,25]. For shale stimulation, a numerical framework should therefore resolve both the continuous deformation of the rock matrix and the discontinuous evolution of fractures while maintaining fluid-solid coupling.
The finite-discrete element method (FDEM) provides such a framework by combining finite-element deformation with discrete fracture and contact mechanics. Zero-thickness cohesive interfaces can represent fracture initiation and progressive damage, whereas contact algorithms describe the mechanical response after interface failure. When coupled with matrix seepage and fracture flow, FDEM can explicitly represent the transition from intact porous rock to an evolving hydraulic-fracture network. This capability is particularly useful for investigating multi-cluster stimulation, where neighboring fractures interact through stress shadows and compete for fluid and propagation space.
Accordingly, this study develops a two-dimensional hydro-mechanical FDEM model for multi-cluster hydraulic fracturing in shale. The framework couples Biot poroelasticity, Darcy seepage, cubic-law fracture flow, Carter-type leak-off, cohesive-zone damage, and post-failure contact. The model is first verified against the classical KGD solution. It is then used to quantify the effects of four process variables—horizontal principal stress difference, cluster spacing, injection rate, and fracturing-fluid viscosity—on fracture morphology and propagation. Finally, the individual sensitivities are integrated into a combined stimulation strategy. The principal contribution is a unified process-level analysis linking controllable treatment parameters to stress-shadow interaction, fracture opening, and branching behavior within one verified FDEM framework.
The remainder of the paper is organized as follows. Section 2 presents the governing equations, constitutive assumptions, fracture-damage formulation, and hydro-mechanical coupling strategy. Section 3 describes model verification and the parametric simulations. Section 4 discusses the coupled mechanisms, engineering implications, and limitations of the model, and Section 5 summarizes the main conclusions.
2. Materials and Methods
2.1. Modeling Assumptions
A coupled hydro-mechanical FDEM framework is established to simulate hydraulic-fracture initiation and propagation in saturated shale. The following assumptions are introduced to retain the dominant physical processes while maintaining computational tractability:
(1) The intact rock matrix is simplified as fully saturated linear elastic porous media, and fluid migration within internal micropores complies with the classical Darcy seepage theory;
(2) Propagating hydraulic fractures are idealized as smooth parallel-plate flow channels, where low-Reynolds laminar transport of injected fracturing fluid follows the standard cubic flow law;
(3) Rock deformation generated during hydraulic fracturing is categorized as infinitesimal strain deformation, and the initiation and progressive expansion of fractures are governed by the irreversible damage evolution criterion of the cohesive zone model;
(4) The fracturing fluid adopted in the simulation is defined as incompressible Newtonian fluid, and fluid percolation from fracture surfaces toward the surrounding rock matrix is incorporated into the fluid mass conservation equation;
(5) A bidirectional fluid-solid coupling algorithm is developed based on Biot poroelastic theory, and an explicit time-stepping integration scheme is utilized for iterative dynamic solving of the multi-field coupled system.
2.2. Solid Mechanical Governing Equations
The FDEM numerical technique discretizes fractured rock media into continuous finite element units to characterize matrix deformation responses. Zero-thickness cohesive interface units are embedded at the boundaries of adjacent rock blocks to capture the whole process of hydraulic fracture initiation and progressive expansion. Meanwhile, discrete element contact mechanics are coupled to quantify the discontinuous mechanical characteristics of fractured rock, including interface extrusion, relative sliding and post-failure block displacement.
2.2.1. Dynamic Equilibrium Equation of Solid Medium
In accordance with Newton’s second law of motion, a global dynamic equilibrium formula considering structural damping is constructed to describe the transient mechanical response of rock mass nodes under fracturing disturbance.
where M denotes the nodal lumped mass matrix, C represents the global damping matrix of the rock structural system, and , , u refer to nodal acceleration, velocity and displacement vectors respectively.
The total external load acting on rock blocks can be decomposed into five independent mechanical components:
Specifically, Fel is the elastic internal force induced by finite element unit deformation; Fco corresponds to the bonding constraint force of damageable cohesive interfaces; Fct is the frictional contact force between discrete rock blocks after fracture opening; Ffl stands for the equivalent load generated by pore and fracture fluid pressure; Fg is the body load induced by rock gravity acceleration.
2.2.2. Biot Poroelastic Constitutive Relation
To quantitatively characterize the fluid-solid interaction effect of saturated porous rock, the Biot poroelastic effective stress principle is adopted to establish the correlation between rock mechanical state and pore fluid pressure. The total stress tensor is superposed by the effective stress borne by rock skeleton and the additional stress induced by pore fluid pressure:
where σ is the macroscopic total stress tensor of rock mass, σ' is the effective stress carried by rock solid skeleton, α is the Biot effective stress coefficient, pm represents matrix pore fluid pressure, and I is the second-order unit tensor.
Under infinitesimal deformation conditions, the rock skeleton exhibits linear elastic mechanical properties, and its constitutive relationship is expressed as:
where 𝔻 refers to the fourth-order elastic stiffness tensor of rock materials, and ε is the infinitesimal strain tensor calculated from displacement gradient:
2.2.3. Cohesive Zone Damage and Fracture Evolution Model
Zero-thickness cohesive units are pre-laid along potential fracture propagation paths to reproduce the physical fracture process zone formed during hydraulic fracturing. A bilinear traction-separation constitutive model is employed to simulate the full-range mechanical evolution of rock interfaces, covering initial damage generation, progressive stiffness degradation and ultimate structural failure.
The mechanical response of cohesive interfaces is dominated by the quantitative relationship between interface traction and relative displacement:
where σn and τs denote normal tensile traction and tangential shear traction on cohesive interfaces, while δn andδs represent normal opening displacement and tangential sliding displacement of interface units respectively.
A dimensionless irreversible damage variable varying from 0 to 1 is defined to quantitatively assess the progressive damage degree of rock bonding interfaces. The dynamic evolution formula of damage is presented as follows:
where δ0 is the critical displacement for triggering initial interface damage, δf is the ultimate displacement causing complete interface fracture, and δmax is the maximum interface separation displacement recorded in the loading process, which ensures the irreversibility of damage accumulation. The interface remains intact at D = 0 and completely loses mechanical bearing capacity at D = 1.
A mixed-mode fracture criterion based on critical energy release rate is adopted to evaluate the dynamic propagation status of hydraulic fractures:
where GI and GII are transient energy release rates corresponding to mode-I tensile fracture and mode-II shear fracture, GIc and GIIc are critical fracture toughness values for tensile and shear failure, and m is the calibration exponent for the mixed fracture criterion.
2.2.4. Contact Mechanical Equations for Discrete Rock Blocks
After cohesive units fail completely and hydraulic fractures open, the contact interaction algorithm between adjacent discrete rock blocks is activated. Inter-block contact force is divided into normal compression component and tangential friction component to accurately simulate the post-fracturing movement and mechanical response of rock blocks.
The normal contact interaction between rock blocks conforms to the linear stiffness mechanical model:
where kn is the normal contact stiffness of block contact surfaces, and Δn represents the normal embedding depth between adjacent contact blocks.
The tangential frictional contact behavior obeys the classical Mohr-Coulomb shear strength criterion:
where ks denotes tangential contact stiffness, Δs is the relative tangential sliding displacement of contact surfaces, φ is the internal friction angle of fractured rock mass, c is the residual cohesion of fracture surfaces, and Ac is the effective contact area between discrete rock blocks.
2.3. Multi-Field Seepage Governing Equations
2.3.1. Seepage Equation for the Rock Matrix
Combining Darcy seepage theory and Biot poroelastic mass conservation principle, a transient seepage governing formula for saturated rock matrix is established. This equation fully considers the coupling effects of rock volumetric deformation and fracture fluid percolation on dynamic variation of pore pressure:
where Mb is the Biot modulus characterizing pore volume compressibility, km is the inherent permeability of rock matrix, μl is the dynamic viscosity of fracturing fluid, εv is the volumetric strain of rock skeleton, and qlk is the unit-volume fluid percolation flux from hydraulic fractures to surrounding matrix. Volumetric strain is defined as the divergence of nodal displacement vector:
The Biot modulus is determined by the comprehensive compression characteristics of rock solid skeleton and pore filling fluid:
where ϕ represents matrix porosity, Kl and Ks are the bulk modulus of fracturing fluid and rock solid skeleton respectively.
2.3.2. Flow Governing Equation for Hydraulic Fractures
Fluid flow inside hydraulic fractures is simplified as parallel-plate laminar flow, and the flow conductivity of fractures is governed by the aperture-dependent cubic law. The transient mass conservation equation for internal fracture flow incorporates wellbore fluid injection and fracture wall fluid percolation effects:
where w is the dynamic aperture of propagating hydraulic fractures, which is numerically equivalent to the normal opening displacement of cohesive interface units; pf is the fluid pressure within fracture cavities; w3/12μl denotes the dynamic flow conductivity of hydraulic fractures; qtotal is the cumulative fluid percolation flux on fracture surfaces; Qinj represents the fluid injection source term at wellbore perforation positions.
The average transport velocity of fracturing fluid along fracture propagation direction is calculated via the cubic flow law:
The seepage velocity of fluid in rock matrix pores complies with the classical Darcy velocity formula:
The time-dependent fluid percolation behavior from fractures to matrix is quantified by the widely applied Carter percolation theoretical model:
where Cl is the Carter percolation coefficient correlated with rock physical properties, t is the real-time simulation duration, and t0 corresponds to the initiation moment of each independent hydraulic fracture.
The Biot effective stress coefficient is calculated based on the modulus ratio of dry rock matrix and pure rock skeleton:
where Kdry denotes the bulk modulus of dry rock matrix without pore fluid filling.
The critical normal opening displacement for tensile damage initiation of cohesive units is determined by rock tensile strength and interface elastic stiffness:
where σt is the uniaxial tensile strength of rock materials, and kcoh is the initial elastic stiffness of cohesive interface units.
The critical tangential sliding displacement triggering shear damage of cohesive interfaces is defined by the peak shear strength of rock internal bonding surfaces:
where τmax represents the peak shear strength of rock bonding interfaces.
In numerical simulation procedures, the macroscopic aperture of hydraulic fractures is quantitatively characterized by the normal opening displacement of embedded cohesive units:
3. Results
This section first evaluates the numerical accuracy of the hydro-mechanical FDEM framework using a classical analytical benchmark and then examines the effects of horizontal principal stress difference, cluster spacing, injection rate, and fracturing-fluid viscosity on multi-cluster fracture propagation.
3.1. Model Verification Against the KGD Solution
The coupled fluid-flow and solid-deformation formulation was verified using a simplified single-fracture problem corresponding to the classical two-dimensional KGD configuration. An incompressible Newtonian fluid was injected into the fracture using the parameters defined in the original model setup. Fracture half-length and maximum aperture at the fracture center were selected as verification metrics because they directly reflect the coupled pressure–deformation response.
Table 1 compares the temporal evolution predicted by the analytical KGD solution and the FDEM model. Across the five reported injection times, the relative errors in fracture half-length range from 1.17% to 2.73%, while the errors in maximum fracture aperture range from 1.26% to 2.68%. All deviations remain below 3%, supporting the ability of the numerical framework to reproduce the benchmark fracture-growth response before it is applied to the multi-cluster cases.
3.2. Parametric Analysis of Multi-Cluster Fracture Propagation
A two-dimensional domain measuring 400 m × 200 m with three injection points is used for the parametric simulations. Unless a parameter is varied in a sensitivity case, the baseline properties are those listed in Table 2. The analysis focuses on four variables that directly affect the fracturing process: horizontal principal stress difference, cluster spacing, injection rate, and fracturing-fluid viscosity.
3.2.1. Effect of Horizontal Principal Stress Difference
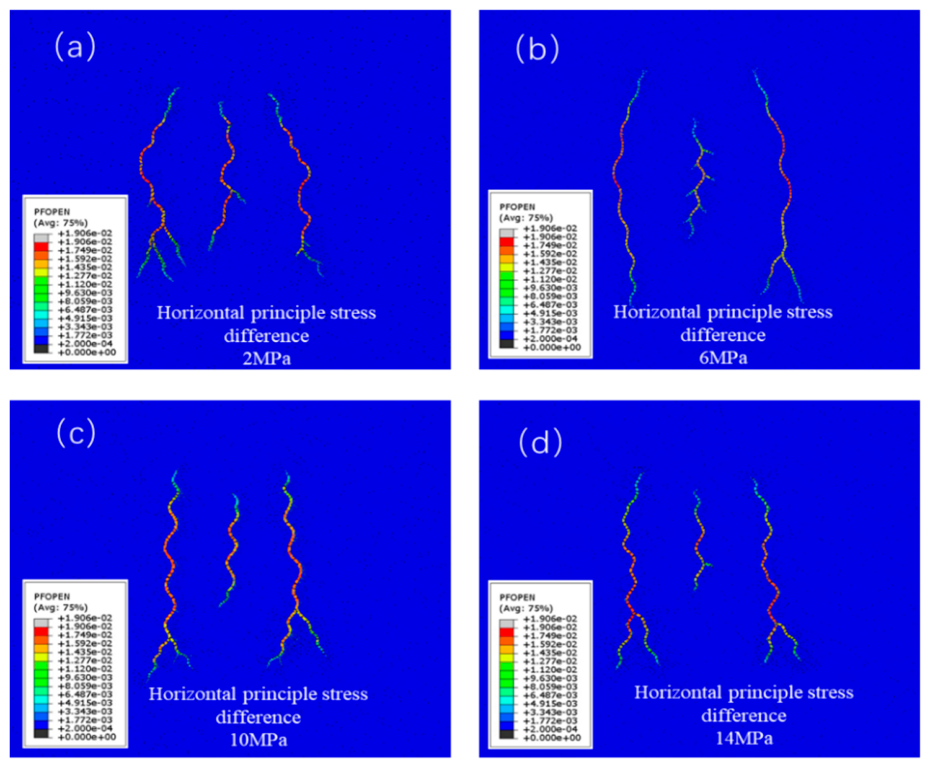
The horizontal principal stress difference was set to 2, 6, 10, and 14 MPa. At low stress differences, fracture paths exhibit stronger deflection and branching, producing Y-shaped and dendritic geometries and a larger stimulated fracture-network area. The reported total fracture lengths for the low-stress-difference cases reach 215.4 and 187.4 m. As the stress difference increases, the stress field increasingly constrains propagation to a preferred direction, and Mode-I opening becomes dominant. At 14 MPa, the fractures are comparatively straight and parallel with little lateral branching, and the total fracture-network length decreases to 142.1 m. These results indicate that increasing stress anisotropy reduces the opportunity for fracture-path reorientation and therefore lowers network complexity.
Figure 1.
Fracture geometries under different horizontal principal stress differences. (a) 2 MPa; (b) 6 MPa; (c) 10 MPa; (d) 14 MPa.
Figure 1.
Fracture geometries under different horizontal principal stress differences. (a) 2 MPa; (b) 6 MPa; (c) 10 MPa; (d) 14 MPa.
3.2.2. Effect of Cluster Spacing
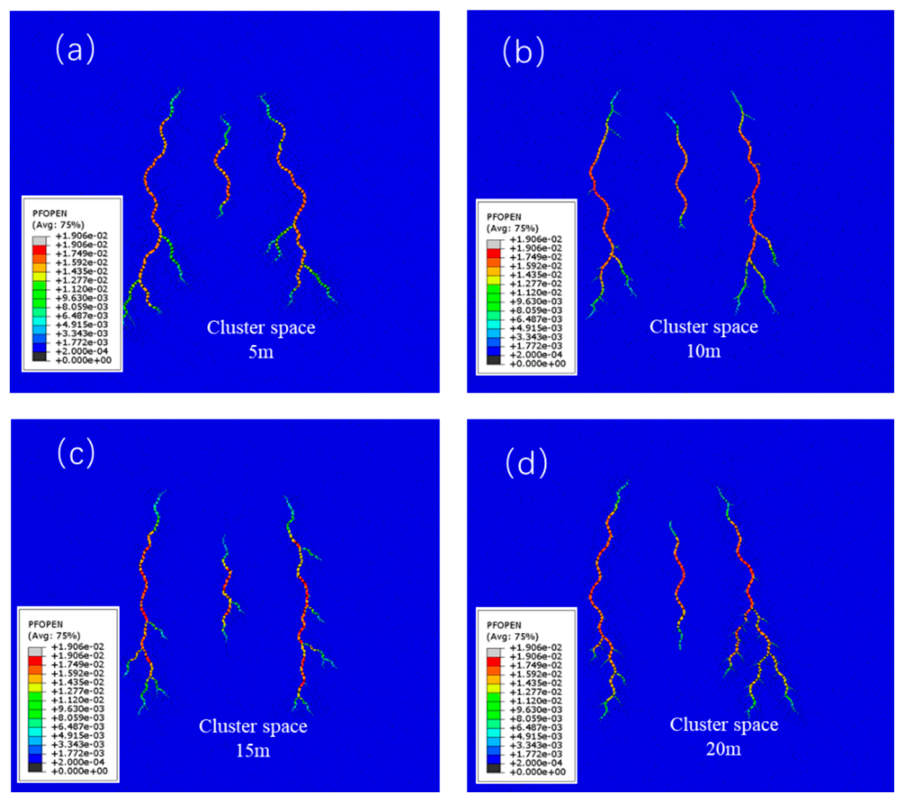
For three simultaneously propagating fractures, cluster spacing was set to 5, 10, 15, and 20 m. Fluid pressure and fracture opening generate induced stresses around each fracture, producing a stress-shadow interaction that is strongest when adjacent clusters are close. As spacing increases, the compressive interference acting on the middle fracture weakens. The middle-fracture length consequently increases from 18.5 m at 5 m spacing to 39.8 m at 20 m spacing, while its share of the total three-fracture length rises from 11.78% to 24.43% (Table 3). At small spacing, the central fracture is strongly suppressed and may arrest, bifurcate, or redirect toward a lower-resistance path. Thus, cluster spacing controls not only individual fracture length but also the uniformity of propagation among simultaneously stimulated clusters.
Figure 2.
Fracture geometries under different cluster spacings. (a) 5 m; (b) 10 m; (c) 15 m; (d) 20 m.
Figure 2.
Fracture geometries under different cluster spacings. (a) 5 m; (b) 10 m; (c) 15 m; (d) 20 m.
3.2.3. Effect of Injection Rate
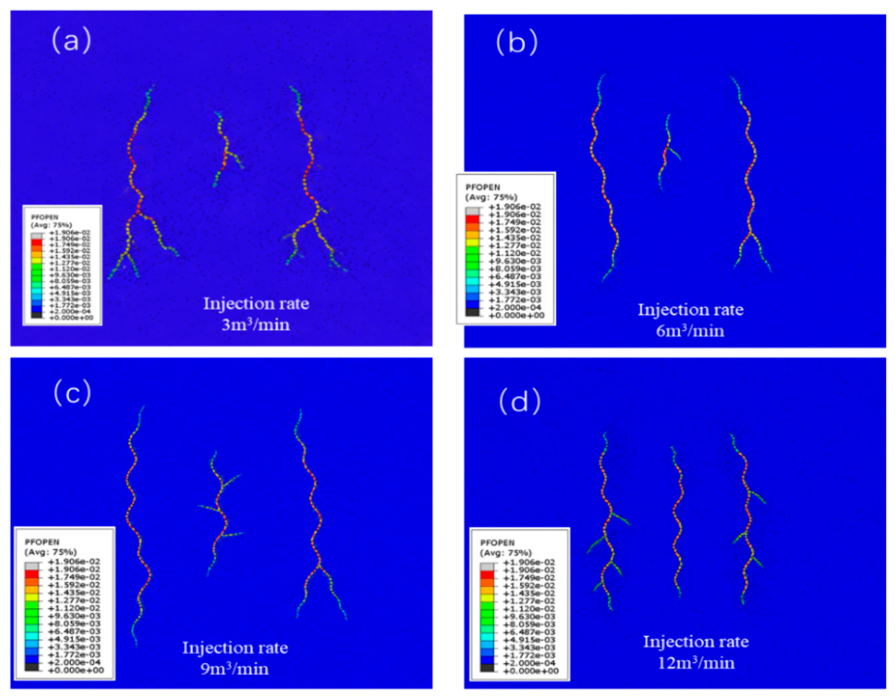
Injection rates of 3, 6, 9, and 12 m3/min were evaluated. According to fluid mass conservation and the cubic-flow relation, a higher injection rate increases the rate of pressure accumulation within the fractures and therefore raises the mechanical driving force for opening and propagation. The simulations show that increasing the injection rate from 6 to 12 m3/min increases the maximum dynamic fracture aperture from 1.4 to 3.2 mm. Higher-rate cases also develop more secondary branches near the primary-fracture tips, indicating that elevated net pressure activates a larger number of damageable interfaces and increases fracture-network complexity.
Figure 3.
Fracture geometries under different injection rates. (a) 3 m3/min; (b) 6 m3/min; (c) 9 m3/min; (d) 12 m3/min.
Figure 3.
Fracture geometries under different injection rates. (a) 3 m3/min; (b) 6 m3/min; (c) 9 m3/min; (d) 12 m3/min.
3.2.4. Effect of Fracturing-Fluid Viscosity
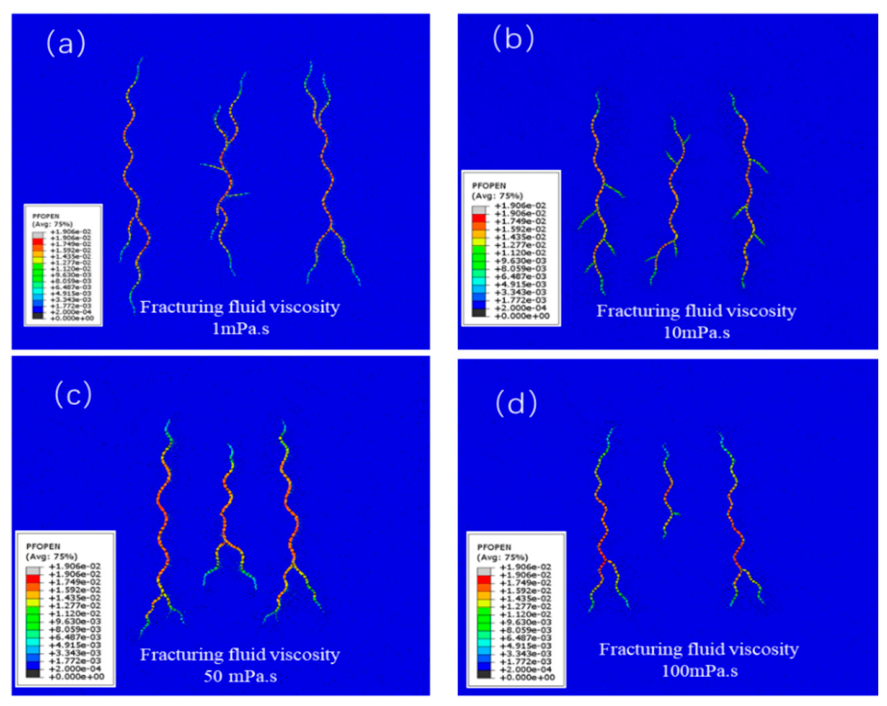
Fracturing-fluid viscosities of 1, 10, 50, and 100 mPa·s were investigated. Fluid viscosity alters both pressure transmission along the fracture and leak-off into the porous matrix. In the 1 mPa·s case, stronger fluid penetration into the matrix increases pore pressure around the fracture and reduces effective confinement, which is associated with more extensive shear-related branching and a fine, reticulated fracture pattern. At 100 mPa·s, leak-off is reduced and pressure is concentrated more strongly within the primary fracture, favoring Mode-I opening. The resulting fractures are wider but less branched; the reported average width reaches 2.6 mm, while the branching frequency is 72% lower than in the 1 mPa·s case. The results therefore demonstrate a trade-off between fracture width and geometric complexity as viscosity changes.
Figure 4.
Fracture geometries under different fracturing-fluid viscosities. (a) 1 mPa·s; (b) 10 mPa·s; (c) 50 mPa·s; (d) 100 mPa·s.
Figure 4.
Fracture geometries under different fracturing-fluid viscosities. (a) 1 mPa·s; (b) 10 mPa·s; (c) 50 mPa·s; (d) 100 mPa·s.
3.3. Integrated Process Optimization
The sensitivity results were combined to identify a process window that favors fracture-network development. A high injection rate increases fracture pressure and promotes opening and secondary damage, whereas excessively close cluster spacing intensifies stress-shadow suppression of the central fracture. Low-viscosity slickwater favors leak-off-assisted pressure diffusion and branching. On this basis, the simulation matrix in Table 4 indicates that Schedule 4—10 m cluster spacing, 12 m3/min injection rate, and 1 mPa·s fluid viscosity—produces the most developed branching pattern among the four tested schedules (Figure 5). This combination should be interpreted as the optimum within the investigated numerical cases rather than as a universal field optimum.
4. Discussion
4.1. Coupled Mechanisms Governing Multi-Cluster Fracture Growth
The simulations show that the four investigated variables act through two coupled mechanisms: the redistribution of stress around neighboring fractures and the redistribution of fluid pressure between fractures and the porous matrix. Horizontal stress anisotropy sets the background directional constraint on fracture growth. Cluster spacing then controls the magnitude of fracture-induced stress shadows superimposed on that background field. Injection rate governs the rate at which net pressure and fracture opening are generated, while viscosity influences how pressure is partitioned between along-fracture transport and leak-off into the matrix. The resulting fracture geometry is therefore not controlled by any single parameter; it emerges from the competition between directional stress confinement, fracture–fracture interaction, pressure buildup, and fluid penetration.
4.2. Implications for Hydraulic-Fracturing Design
From a process-design perspective, the results support coordinated rather than independent selection of cluster spacing, injection rate, and fluid rheology. Very small cluster spacing can increase the number of initiation sites but may reduce propagation uniformity because the central fracture experiences stronger stress-shadow suppression. Increasing injection rate can partly offset propagation resistance by raising net pressure, but the present simulations also show that fluid viscosity changes whether this additional energy produces wider primary fractures or a more highly branched network. The combined schedule analysis therefore favors high-rate injection with moderate spacing followed by low-viscosity slickwater when the design objective is fracture-network complexity and SRV. Field application should nevertheless account for pumping limits, proppant transport, formation heterogeneity, and containment, which are outside the present model scope.
4.3. Model Limitations and Future Work
Several limitations define the range of applicability of the present results. First, the model is two-dimensional and therefore does not represent vertical fracture growth, height containment, or three-dimensional stress interaction. Second, the rock matrix is treated as a saturated linear-elastic porous medium and the injected fluid as incompressible and Newtonian; shale heterogeneity, anisotropy, non-Newtonian rheology, and multiphase effects are not explicitly represented. Third, potential fracture paths are controlled by the embedded cohesive-interface discretization, and the current study does not report a systematic mesh-sensitivity or cohesive-parameter uncertainty analysis. Finally, the integrated optimization is based on the tested numerical schedules and is not calibrated to a specific field treatment. Future work should therefore include three-dimensional simulations, heterogeneous and anisotropic shale properties, explicit natural-fracture networks, mesh and time-step sensitivity analyses, and validation against laboratory or field fracture diagnostics.
5. Conclusions
A two-dimensional hydro-mechanical FDEM framework was developed and verified to investigate multi-cluster hydraulic-fracture propagation in shale. The model couples matrix deformation and seepage, fracture flow, cohesive damage, and post-failure contact. Comparison with the KGD benchmark yielded relative errors below 3% for fracture half-length and maximum aperture. The main findings are as follows:
(1) Horizontal principal stress difference strongly controls fracture-path complexity. Low stress anisotropy permits greater deflection and branching, whereas high stress anisotropy promotes straighter, more parallel Mode-I-dominated propagation; the reported total fracture-network length decreases to 142.1 m at a 14 MPa stress difference.
(2) Cluster spacing governs stress-shadow competition. Increasing spacing from 5 to 20 m increases the middle-fracture length from 18.5 to 39.8 m and raises its share of the total three-fracture length from 11.78% to 24.43%, demonstrating improved propagation uniformity as inter-fracture interference weakens.
(3) Injection rate controls pressure buildup and fracture opening. Increasing the rate from 6 to 12 m3/min increases the maximum dynamic aperture from 1.4 to 3.2 mm and promotes additional secondary branching.
(4) Fracturing-fluid viscosity produces a trade-off between branching complexity and primary-fracture width. The 1 mPa·s case favors leak-off and branching, whereas the 100 mPa·s case produces wider, more planar fractures and a 72% lower branching frequency.
(5) Within the investigated parameter space, the combined schedule using a high injection rate, moderate cluster spacing, and low-viscosity slickwater generates the most developed fracture network. This result provides a process-screening guideline, but field-scale optimization requires further calibration and three-dimensional validation.
Acknowledgments
This work was supported by the Tianshan Talent Program of Xinjiang Uygur Autonomous Region under project “Research and Application of New Supporting Agents for Oil and Gas Reservoir Stimulation” (No. 2022TSYCJC0028). The authors gratefully acknowledge financial support.
Conflicts of Interest
The authors declare no competing financial interest.
References
- Zeng, J.; Wang, X. Z.; Guo, J. C.; et al. Composite linear flow model for multi-fractured horizonal wells in tight sand reservoirs with the threshold pressure gradient. J. Pet. Sci. Eng. 2018, 165, 890–912. [Google Scholar] [CrossRef]
- Wang, Z. L.; Lou, Y.; Pan, J. P. China’s Oil & gas resources exploration and development and its prospect. Explor. Prod. 2017, 25(03), 1–6. [Google Scholar]
- Wang, K.; Zhang, H. L.; Zhang, R. H.; et al. Characteristics and influencing factors of ultra-deep tight sandstone reservoir structural fracture: a case study of Keshen-2 gas field, Tarim Basin. Acta Petrol. Sin. 2016, 37(6), 714–727. [Google Scholar]
- Yang, T.; Zhang, G. S.; Liang, K.; et al. The exploration of global tight sandstone gas and forecast of the development tendency in China. Strateg. Study CAE 2012, 14(6), 64–68. [Google Scholar]
- Zeng, L. B.; Ke, S. Z.; Liu, Y. Research methods of low permeability oil and gas reservoir fractures; Petroleum Industry Press: Beijing, 2010; pp. 1–187. [Google Scholar]
- Olsonje; Laubachse; Eichhublp. Estimating natural fracture producibility in tight gas sandstones, coupling diagenesis with geomechanical modeling. Lead. Edge 2010, 29(12), 1494–1499. [Google Scholar] [CrossRef]
- Zeng, L.; Liu, W.; Li, J.; et al. Natural fractures and their influence on shale gas enrichment Sichuan Basin, China. J. Pet. Sci. Eng. 2016, 30, 1–9. [Google Scholar] [CrossRef]
- Liu, W.; Zeng, L.; Zhang, B.; et al. Influence of natural fractures on gas accumulation in the Upper Triassic tight gas sandstones in the northwestern Sichuan Basin, China. Mar. Pet. Geol. 2017, 83, 60–72. [Google Scholar] [CrossRef]
- Fisher, M. K.; Davidson, B. M.; Goodwin, A. K.; et al. Integrating fracture mapping technologies to optimize stimulations in the Barnett shale. SPE Annual Technical Conference and Exhibition, San Antonio, Texas, 2022a; pp. SPE–77411. [Google Scholar]
- Fisher, M. K.; Wright, C. A.; Davidson, B. M.; et al. Integrating fracture mapping technologies to optimize stimulations in the Barnett shale. SPE Annual Technical Conference and Exhibition, San Antonio, Texas, 2002b; pp. SPE–77412. [Google Scholar]
- Maxwell, S. C.; Urbanci, K. T.; Steinsberger, N. P.; et al. Microseismic imaging of hydraulci fracture complexity in the barnett shale. SPE Annual Technical Conference and Exhibition, San Antonio, Texas, 2003; pp. SPE–77440. [Google Scholar]
- Perkins, T. K.; Kern, L. R. Width of hydraulic fractures. J. Pet. Technol. 1961, 13(9), 937–949. [Google Scholar] [CrossRef]
- Gu, H.; Weng, X. Criterion for fractures crossing frictional interfaces at nonorthogonal angles. 44th US Rock Mechanics Symposium and 5th US-Canada Rock Mechanics Symposium, 2010; p. ARMA-10-198. [Google Scholar]
- Tan, P.; Jin, Y.; Han, K.; et al. Analysis of hydraulic fracture initiation and vertical propagation behavior in laminated shale formation. Fuel 2017, 206, 482–493. [Google Scholar] [CrossRef]
- Zhang, H.; Sheng, J. J. Numerical simulation and optimization study of the complex fracture network in naturally fractured reservoirs. J. Pet. Sci. Eng. 2020, 195, 107726. [Google Scholar] [CrossRef]
- Rui, Z. H.; Guo, T. K.; Feng, Q.; et al. Influence of gravel on the propagation pattern of hydraulic fracture in the conglomerate reservoir. J. Pet. Sci. Eng. 2018, 165, 627–639. [Google Scholar] [CrossRef]
- Zhang, G. D.; Sun, S. S.; Chao, K.; et al. Investigation of the nucleation, propagation and coalescence of hydraulic fractures in conglomerate reservoirs using a coupled fluid loe-DEM approach. Powder Technol. 2019, 354, 301–313. [Google Scholar] [CrossRef]
- Mingile, C.; Sun, Y. W.; Fu, P. C.; et al. Surrogate-based optimization of hydraulic fracture in pre-existing fracture networks. Comput. Geosci. 2013, 58, 69–79. [Google Scholar] [CrossRef]
- Wang, H. Y. Hydraulic fracture propagation in naturally fractures reservoirs: Complex fracture or fracture networks. J. Nat. Gas. Sci. Eng. 2019, 68, 102911. [Google Scholar] [CrossRef]
- Wei, Y. S.; Wang, J. L.; Yu, W.; et al. A smart productivity evaluation method for shale gas wells based on 3D fractal fracture network model. Pet. Explor. Dev. 2021, 48(4), 787–796. [Google Scholar] [CrossRef]
- Wan, X. C.; Rasouli, V.; Damjance, B.; et al. Coupling of fracture model with reservoir to simulate shale gas production with complex fractures and nanopores. J. Pet. Sci. Eng. 2020, 193, 107422. [Google Scholar] [CrossRef]
- Sobhaniaraghn, B.; Mansur, W. J.; Peter, F. C. Three-dimensional investigation of multiple stage hydraulic fracturing in unconventional reservoirs. J. Pet. Sci. Eng. 2016, 146, 1063–78. [Google Scholar] [CrossRef]
- Khoei, A. R.; Vahab, M.; Ehsani, H.; et al. XFEM modeling of large plasticity deformation; a convergence study on various blending strategies for weak discontinuities. Eur. J. Comput. Mech. 2015, 24(3), 79–106. [Google Scholar] [CrossRef]
- Hanks, C. L.; Lorenz, J.; Teufel, L.; et al. Lithologic and structural controls on natural fracture distribution and behavior within the Lisburne Group, northeastern Brooks Range and North Slope subsurface, Alaska. AAPG Bull. 1997, 81(10), 1700–1720. [Google Scholar] [CrossRef]
- Wang, H.; Sharma, M. M. New variable compliance method for estimating closure stress and fracture compliance from DFIT data. paper 187348 Presented at the SPE Annual Technical Conference and Exhibition Held, San Antonio, TX, USA, 09-11 October; 2017. [Google Scholar]
Figure 5.
Fracture geometries for the four combined parameter schedules.
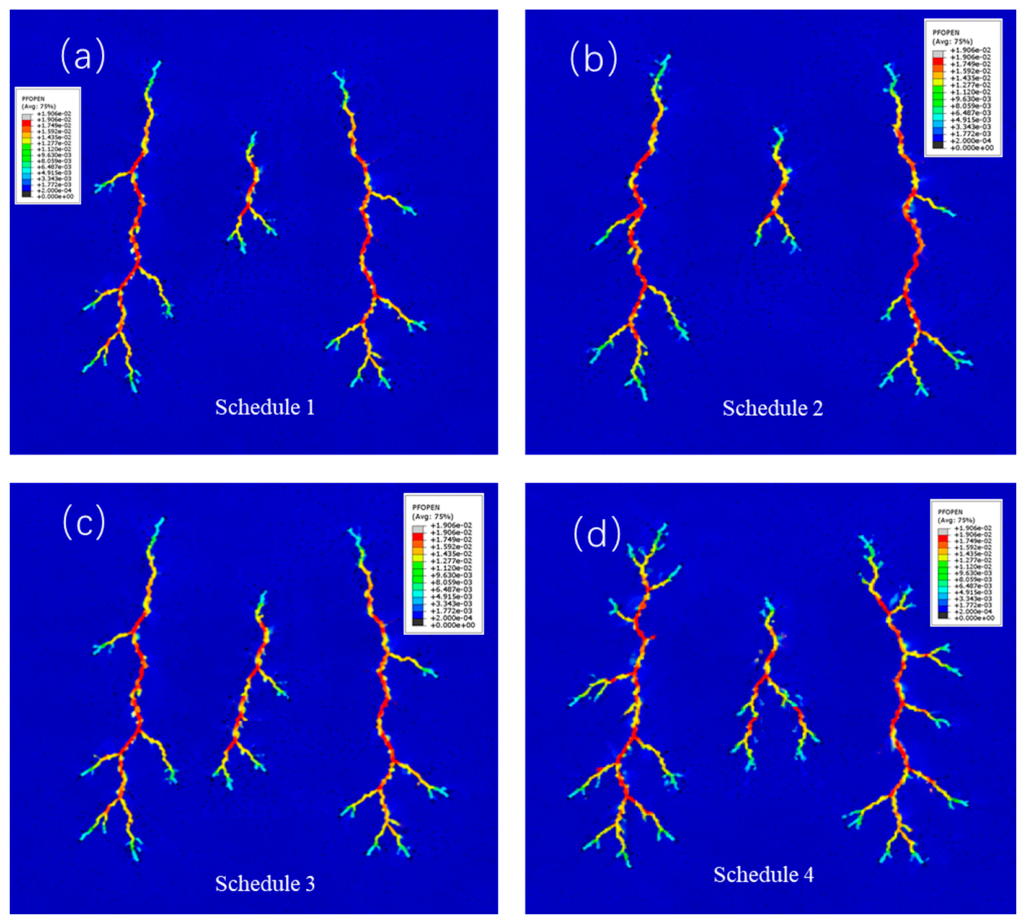

Table 1.
Comparison of fracture half-length and maximum aperture predicted by the FDEM and KGD models.
Table 1.
Comparison of fracture half-length and maximum aperture predicted by the FDEM and KGD models.
| Injection Time /(s) | Half-length(KGD) /(m) | Half-length(FDEM) /(m) | Error /(%) | Maximum fracture aperture (KGD)/ (mm) | Maximum fracture aperture (FDEM)/ (mm) | Error /(%) |
|---|---|---|---|---|---|---|
| 10 | 12.45 | 12.11 | 2.73 | 1.12 | 1.15 | 2.68 |
| 20 | 18.23 | 17.85 | 2.08 | 1.34 | 1.31 | 2.24 |
| 30 | 22.11 | 21.68 | 1.94 | 1.48 | 1.45 | 2.03 |
| 40 | 25.32 | 24.91 | 1.62 | 1.59 | 1.57 | 1.26 |
| 50 | 28.15 | 27.82 | 1.17 | 1.68 | 1.65 | 1.79 |
Table 2.
Baseline input parameters for the numerical simulations.
| Parameter | Value |
| Injection rate | 0.2 m3/min |
| Young’s modulus | 35 GPa |
| Poisson’s ratio | 0.25 |
| The minimum horizontal stress | 10 MPa |
| The maximum horizontal stress | 17 MPa |
| Formation void ratio | 0.1 |
| Fluid leak off parameter | 1e-6 m3/Pa·s |
| Teneile strength | 6.32MPa |
| Formation porosity | 0.5 |
Table 3.
Quantitative analysis of fracture propagation lengths under different cluster spacings.
| Cluster space/ (m) | Left-fracture length/(m) | Middle-fracture length/(m) | Right-fracture length/(m) | Center fracture length ratio (%) |
|---|---|---|---|---|
| 5 | 68.2 | 18.5 | 69.1 | 11.78 |
| 10 | 65.4 | 27.1 | 66.0 | 17.09 |
| 15 | 62.1 | 33.6 | 61.8 | 21.33 |
| 20 | 60.7 | 39.8 | 62.4 | 24.43 |
Table 4.
Combined parameter schedules used for fracture-network optimization.
| Schedule | Cluster space/m | Injection rate/m3/min | Viscosity of fracturing fluid/mPa.s |
| 1 | 15 | 6 | 50 |
| 2 | 15 | 9 | 10 |
| 3 | 10 | 12 | 10 |
| 4 | 10 | 12 | 1 |
Disclaimer/Publisher’s Note: The statements, opinions and data contained in all publications are solely those of the individual author(s) and contributor(s) and not of MDPI and/or the editor(s). MDPI and/or the editor(s) disclaim responsibility for any injury to people or property resulting from any ideas, methods, instructions or products referred to in the content. |
© 2026 by the authors. Licensee MDPI, Basel, Switzerland. This article is an open access article distributed under the terms and conditions of the Creative Commons Attribution (CC BY) license.
Copyright: This open access article is published under a Creative Commons CC BY 4.0 license, which permit the free download, distribution, and reuse, provided that the author and preprint are cited in any reuse.