

Submitted:
13 September 2026
Posted:
15 September 2026
You are already at the latest version
Abstract
Accessibility of digital mental health tools for people with disabilities remains insufficiently evaluated. Psikiatris.id was developed as an application integrating screening and psychotherapy support. This pilot study evaluated usability and user experience among adults with and without blindness/low vision. An explanatory sequential mixed-methods design was used. Usability and user experience were assessed using the System Usability Scale (SUS) and User Experience Questionnaire (UEQ), followed by semi-structured interviews and integration of quantitative and qualitative data. Between-group comparisons used Mann–Whitney U tests with Holm adjustment across SUS and six UEQ dimensions. Sixty-six adults participated, including 33 with and 33 without blindness/low vision. Median SUS was 60.00 [57.50–67.50] among participants with blindness/low vision and 67.50 [55.00–77.50] among those without, with no significant difference (P=.143). UEQ medians were positive; perspicuity differed significantly between groups after Holm adjustment (adjusted P=.001746). Participants valued understandable screening, integrated functions, and AI as a space for disclosure, but identified screen-reader barriers, assisted-testing limitations, navigational complexity, and AI turn-taking and loading problems. Psikiatris.id showed positive user experiences, with independent accessibility still needing improvement. Further development should prioritize unassisted accessibility testing before clinical effectiveness is evaluated.
Keywords:
digital application
; mental health
; usability
; user experience
1. Introduction
Mental disorders constitute a substantial and persistent global health burden, with depression and anxiety among the most prevalent conditions. The Global Burden of Disease 2019 study estimated approximately 970.1 million prevalent cases of mental disorders worldwide in 2019, including 301.4 million cases of anxiety disorders and 279.6 million cases of depressive disorders, making these the two most common mental disorders globally [1]. In Indonesia, population-based evidence likewise indicates a substantial burden. A national survey involving 31,442 adults in 2014–2015 found that 21.8% reported moderate-to-severe depressive symptoms [2]. More recently, a nationwide web-panel survey involving data from 16,096 Indonesian adults found that 14.7% had symptoms consistent with anxiety and/or depression, comprising 5.2% with anxiety symptoms alone, 4.0% with depressive symptoms alone, and 5.5% with both [3]. The burden appears particularly pronounced among people with blindness/low vision. A recent systematic review and meta-analysis found pooled prevalences of 21% for depression and 22% for anxiety among individuals with irreversible vision loss [4]. Population-based evidence similarly demonstrates a positive association between blindness/low vision and depression, with depression affecting approximately 27% of people with blindness/low vision in pooled analyses [5].
Despite the availability of evidence-based mental health care, substantial treatment gaps remain. Across World Mental Health Surveys in 21 countries, only 27.6% of individuals with a 12-month anxiety disorder received any treatment and only 9.8% received possibly adequate treatment, with substantially lower coverage in lower-income settings [6]. Similarly, cross-national analyses of major depressive disorder estimated that only approximately 10% of affected individuals received quality- and user-adjusted effective treatment, corresponding to a treatment gap of approximately 90% [7]. In ASEAN countries, barriers to professional psychological help-seeking include stigma and sociocultural beliefs, low mental health literacy, self-reliance, difficulty disclosing psychological problems, and limited availability and affordability of services [8]. These challenges may be compounded among people with blindness/low vision, in whom psychological symptoms may be attributed to vision loss, knowledge of mental health problems and treatments may be limited, and eye-care or rehabilitation professionals may lack sufficient time, training, or confidence to recognize and discuss depression and anxiety [9]. Nevertheless, appropriately adapted psychological care can be effective; a multicentre randomized trial of stepped care incorporating watchful waiting, CBT-based guided self-help, problem-solving treatment, and referral reduced the 24-month incidence of depressive and anxiety disorders among visually impaired older adults [10].
Digital mental health technologies may provide one strategy for narrowing these diagnostic and treatment gaps by extending screening and psychological support beyond conventional face-to-face services. A systematic review comparing digital and paper-based psychiatric self-report questionnaires found generally high interformat reliability, including promising findings for the PHQ-9, although equivalence cannot be assumed for every instrument or implementation [11]. A systematic review of digital psychiatric assessment tools identified depression and generalized anxiety disorder among the most frequently evaluated conditions and found that digital assessment commonly involved digitized versions of established questionnaires, although diagnostic accuracy varied and the quality of evidence remained heterogeneous [12]. In low- and middle-income countries, a systematic review and meta-analysis of 80 randomized trials involving 12,070 participants found that digital mental health interventions significantly reduced depressive and anxiety symptoms compared with control conditions [13]. A separate meta-analysis similarly found beneficial effects of digital interventions for common mental disorders in LMICs [14]. Therapist-supported internet-delivered CBT has also demonstrated effects comparable to face-to-face CBT across psychiatric and somatic conditions [15].
Despite this potential, the rapidly expanding digital mental health marketplace has important limitations in clinical evidence, accessibility, personalization, and user-centred design. Systematic evaluations of popular mental health applications have identified substantial variability in their quality, integrity, clinical evidence, and available mental health services [16,17]. Evaluation of 98 self-guided CBT-based apps for depression further showed that only 28 incorporated at least four evidence-based CBT techniques, approximately one-third provided suicide-risk resources, meaningful personalization was uncommon, and data sharing with third-party service providers was widespread [18]. Accessibility represents an additional and frequently overlooked concern. Digital mental health interventions are often promoted as solutions to access barriers, yet their accessibility for people with disabilities has received comparatively little research attention [19]. Moreover, accessibility is not synonymous with general user experience; an application may receive favorable usability or user-experience ratings while still presenting substantial barriers to screen-reader users or people with other accessibility needs [19]. These limitations underscore the need for digital mental health technologies that are not only evidence-informed but also systematically evaluated for usability, user experience, accessibility, safety, and inclusivity across users with differing functional abilities. Therefore, we developed Psikiatris.id as an inclusive digital mental health application for depression and anxiety screening and psychological support among adults with or without blindness/low vision. This study aimed to evaluate the usability and user experience in these populations, as well as their perception towards this application.
2. Materials and Methods
Methods
Study design
This study was an explanatory sequential mixed-methods design. Quantitative assessment with the System Usability Scale (SUS) and User Experience Questionnaire (UEQ) was followed by semi-structured interviews to contextualize participants’ experiences of the application.
The study was conducted using a hybrid approach. Participants with blindness/low vision were members in Sentra Wyata Guna Bandung. Sentra Wyata Guna Bandung is a Technical Implementation Unit located in Bandung City, West Java Province, operating under the direct coordination of the Directorate General of Social Rehabilitation within the Ministry of Social Affairs of the Republic of Indonesia. Moreover, this center is the oldest and largest care facility for the visually impaired in Indonesia that aims to gather and rehabilitate people with blindness/low vision to be able to function independently in the society. Participants with blindness/low vision underwent in-person evaluation at Sentra Wyata Guna, Bandung, Indonesia, in August 2026. Participants without blindness/low vision were taken from several communities, namely Trash Ranger Indonesia and Youth Ranger Indonesia; both of which were non-profit humanitarian organizations. Participants without blindness/low vision completed the evaluation remotely in August 2026.
Digital mental health application
Psikiatris.id (https://psikiatris.id/) is a digital mental health application developed for Indonesian adults that incorporates evidence-informed screening and psychological-support content (Figure 1). Its principal components include the Patient Health Questionnaire-9 (PHQ-9) and Generalized Anxiety Disorder-7 (GAD-7), CBT-related exercises, guided breathing, virtual nature, and an AI-based virtual avatar. Incorporating established instruments and therapeutic principles does not itself establish the clinical effectiveness of the integrated application.
The application was developed with accessibility and inclusive design as explicit considerations because it is intended for use by adults both blind and sighted. The AI-based component was designed as a supportive digital companion rather than as a replacement for clinical diagnosis or professional mental health care.
Participants and eligibility
The source population consisted of adults who had participated in the internal usability evaluation of the application. Eligible records were included if participants were aged ≥18 years, had completed the SUS and UEQ, had participated in the internal application evaluation by using the screening and psychotherapy components, and had an appropriate consent or ethical basis permitting the use of their data for research purposes. Records were excluded if the primary outcome data were incomplete, duplicated, could not be verified, or did not meet the target population criteria.
Participant characteristics
Demographic characteristics, which included age, sex, and vision-related disability status, were obtained during internal evaluation. Vision-related disability status was classified into three: total blindness, low vision, or no blindness/low vision.
Sample Size
Quantitative Data
For the SUS sample-size calculation, a standard deviation of 17.5 points was assumed, consistent with a published summary of SUS variability [20]. Targeting a 95% confidence interval half-width of 6 points, the sample size per group was calculated using the mean estimation formula:
n = (Z1-a/2 x SD / d)2 = (1,96 x 17,5 / 6)2 = 32,7
The calculation indicates a minimum requirement of 33 respondents per group.
Qualitative Data
After the collection of the quantitative data, we ranked the scores of SUS and UEQ from the individuals in the respective group. Individuals in the higher and lower end of scores of SUS and UEQ were determined to be the candidates for the interview. The number of interview participants was not determined through statistical calculation but rather based on the principle of data saturation, which means data collection ceased when additional interviews no longer yielded meaningful new themes or information.
Quantitative measures
System Usability Scale
Usability was evaluated using the System Usability Scale (SUS), originally developed by Brooke [21]. SUS consists of 10 statements rated on a five-point response scale ranging from strongly disagree to strongly agree and provides a global assessment of perceived system usability. For odd-numbered items, the score contribution is calculated as the response minus 1; for even-numbered items, the contribution is calculated as 5 minus the response. The sum of the adjusted item scores is multiplied by 2.5, producing a total score ranging from 0 to 100, with higher scores indicating better perceived usability. The Indonesian adaptation of SUS was used in this study. Sharfina and Santoso developed the Indonesian adaptation through cross-cultural adaptation procedures and reported good internal consistency, with a Cronbach α of 0.841 [22].
User Experience Questionnaire
User experience was evaluated using the User Experience Questionnaire (UEQ) developed by Laugwitz, Held, and Schrepp [23]. The UEQ consists of 26 bipolar items rated using a seven-position semantic differential scale. Item responses are transformed to values ranging from −3 to +3. The instrument measures six dimensions: Attractiveness, representing the overall impression of the product; Perspicuity, representing ease of understanding and learning; Efficiency, representing the effort required to complete tasks; Dependability, representing perceived control and predictability; Stimulation, representing excitement and motivation; and Novelty, representing perceived creativity and innovativeness. The official Indonesian-language version of the UEQ was used. An Indonesian version is provided by the official UEQ project, with Harry B. Santoso listed as the contributor of the Indonesian translation. Scale scores were calculated according to the standard UEQ scoring procedure. Higher positive values indicate a more favorable user experience. UEQ scale scores were additionally compared with the established UEQ benchmark dataset to contextualize the application’s user-experience performance relative to previously evaluated interactive products. The descriptive summaries in Table 3 use medians and quartiles, but benchmark categories refer to group-level mean scale scores, as required for UEQ benchmarking [24]. The 26-item summary is an exploratory aggregate rather than an official overall UEQ scale and has no benchmark classification.
Questionnaire administration and potential measurement bias
Following application testing, all participants completed the Indonesian SUS and UEQ. For participants with blindness/low vision using researcher/volunteer read-aloud administration. For assisted completion, the volunteer presented the exact items and response anchors, including both UEQ adjective poles and their order, and recorded participants’ own selected responses.
Semi-structured interviews
A subset of participants participated in semi-structured interviews designed to explore aspects of application use that could not be adequately captured through standardized questionnaires. The interview guide explored users’ initial impressions of the application, perceived ease of use and navigation, experience with mental health screening, experience with psychological modules, interaction with the AI avatar, accessibility, emotional responses, perceived benefits, barriers to use, suggestions for further development, and willingness to use or recommend the application. Interviews were conducted in Indonesian and audio-recorded when participants provided permission for recording. Audio recordings were transcribed verbatim. Direct identifiers, including participant names and other potentially identifying information, were removed during preparation of the transcripts for analysis. Each participant was subsequently identified using a study code (eg, P01, P02, and P03). Only de-identified quotations from participants who had consented to the use of quotations were eligible for inclusion in the manuscript.
Quantitative analysis
Data analysis was conducted using the IBM SPSS Statistics version 29. Participant characteristics were summarized using frequencies and percentages for categorical variables. Age, SUS scores, and UEQ scores are presented as median [first quartile–third quartile]. Shapiro–Wilk tests assessed outcome distributions within each comparison group; normality of the pooled sample alone was not used to determine the between-group test.
The Mann–Whitney U test was used for the age, SUS, and UEQ comparisons reported in Sex distributions were compared using Pearson’s chi-square test; expected cell counts exceeded five. Tests were two-sided, with a significance threshold of 0.05. Holm adjustment was applied across seven primary comparisons (SUS and the six UEQ dimensions). The exploratory 26-item UEQ summary was not to be interpreted as a confirmatory endpoint. SUS internal consistency was estimated using Cronbach’s α after aligning item direction. A nonsignificant group comparison was not interpreted as evidence of equivalence.
Qualitative analysis
Interview transcripts were analyzed using thematic analysis with a structured codebook approach. This formulation was selected because the analysis combined a predefined coding framework derived from the interview domains with systematic coding of participant narratives. The codebook included categories relating to initial experience, usability and navigation, screening, psychological modules, the AI avatar, accessibility, emotional responses, perceived benefits, barriers, development recommendations, and intention to use the application.
The analysis proceeded through iterative stages. First, transcripts were read in full to achieve familiarization with the dataset. Second, meaningful segments of text were identified and assigned one or more initial codes when appropriate. Third, related initial codes were organized within broader analytic categories. Analytic memos were recorded to preserve contextual information and emerging interpretations. Fourth, patterns across participants were examined and related categories were organized into candidate themes. Candidate themes were subsequently reviewed against both the coded extracts and the complete dataset, refined for conceptual coherence and distinctiveness, and assigned concise definitions and names. Finally, representative de-identified quotations were selected to illustrate each theme.
Initial coding and all coded extracts were conducted by BMN and AW. Disagreements regarding code application or category assignment were resolved through discussion and refinement of the codebook.
Mixed-methods integration
Quantitative and qualitative findings were integrated during the interpretation phase using a joint-display and narrative-weaving approach. Quantitative results from SUS and UEQ were juxtaposed with corresponding qualitative findings to identify convergence, complementarity, or divergence between standardized scores and participants’ reported experiences. For example, quantitative findings concerning perspicuity or efficiency could be interpreted alongside interview findings regarding navigation, clarity of instructions, or accessibility barriers. Joint displays are an established strategy for integrating quantitative and qualitative evidence in explanatory sequential mixed-methods research.
Ethical considerations
Ethical approval for this study was obtained from the Health Research Ethics Committee of Dr. Moewardi General Hospital (Komisi Etik Penelitian Kesehatan RSUD Dr. Moewardi), Indonesia (approval no. 1.481/VIII/HREC/2026; issued in August 2026). All participants provided informed consent before participation. Data were de-identified before analysis, and study identifiers were used in place of direct personal identifiers. Only anonymized interview quotations from participants who provided consent for quotation were included in the analysis and reporting. Data were de-identified before analysis, and study identifiers were used in place of direct personal identifiers. Only anonymized interview quotations from participants who provided consent for quotation were included in the analysis and reporting.
3. Results
3.1. Participant Characteristics
A total of 66 participants were included, comprising 33 participants with blindness/low vision and 33 participants without blindness/low vision (Table 1). The overall median age was 25 years [22.25–32.00]. Most participants were male (47/66, 71.2%); the proportions were 69.7% and 72.7% in the blindness/low vision and blindness/low vision, respectively (P=.786). Among participants with blindness/low vision, 22 (66.7%) were totally blind and 11 (33.3%) had low vision.
3.2. System Usability Scores
The overall median SUS score was 62.50 [55.00–75.00] (Table 2). Participants with blindness/low vision had a median score of 60.00 [57.50–67.50], compared with 67.50 [55.00–77.50] among participants without blindness/low vision. The Mann–Whitney U comparison was not statistically significant (P=.143). Cronbach’s α was 0.691 overall, 0.759 in participants without blindness/low vision, and 0.524 in participants with blindness/low vision. The lower α in the blindness/low vision warrants caution regarding score consistency and between-group interpretation.
3.4. User Experience Questionnaire
Overall UEQ medians ranged from 0.75 [0.25–1.50] for Novelty to 2.00 for Perspicuity [0.50–2.75] and Stimulation [0.25–2.50] (Table 3). Participants with blindness/low vision had numerically higher medians across all six dimensions. Perspicuity showed the clearest difference: 2.50 [1.75–3.00] versus 0.75 [0.00–2.25] in participants without blindness/low vision (unadjusted P=.000249; Holm-adjusted P=.001746). Stimulation was also higher (2.00 [1.25–2.50] versus 0.75 [0.00–2.50]; P=.016), but its adjusted P value was 0.099. Adjusted differences in Attractiveness, Efficiency, Dependability, and Novelty were not statistically significant. The exploratory 26-item summary had medians of 1.54 [0.72–2.08] overall, 1.69 [1.23–2.08] with blindness/low vision, and 1.00 [0.00–2.08] without blindness/low vision (unadjusted P=0.046). This exploratory result was not adjusted for multiplicity.
The benchmark categories retained in Table 3 classify overall Attractiveness, Perspicuity, and Stimulation as Good, and Efficiency, Dependability, and Novelty as Above average. In the visual-impairment group, Attractiveness, Perspicuity, and Stimulation were Excellent; Efficiency was Good; and Dependability and Novelty were Above average. In participants without blindness/low vision, Dependability was Below average and the other five dimensions were Above average.

Table 3.
User Experience Questionnaire scores of participants with and without blindness/low vision.
Table 3.
User Experience Questionnaire scores of participants with and without blindness/low vision.
| UEQ Dimension | Total (n=66), median [Q1–Q3]; benchmark | Without blindness/low vision (n=33), median [Q1–Q3]; benchmark | Blindness/low vision(n=33), median [Q1–Q3]; benchmark | p-value |
Holm- adjusted p |
| Attractiveness | 1,67 [0,83–2,46]; Good | 1,50 [0,00–2,33]; Above average | 1,67 [1,33–2,50]; Excellent | 0,091 | 0,364 |
| Perspicuity | 2,00 [0,50–2,75]; Good | 0,75 [0,00–2,25]; Above average | 2,50 [1,75–3,00]; Excellent | 0,000249 | 0,001746 |
| Efficiency | 1,50 [0,25–2,25]; Above average | 0,75 [0,00–2,25]; Above average | 1,50 [1,00–2,25]; Good | 0,189 | 0,428 |
| Dependability | 1,25 [0,50–2,19]; Above average | 0,75 [0,00–2,25]; Below average | 1,25 [1,00–2,00]; Above average | 0,072 | 0,358 |
| Stimulation | 2,00 [0,25–2,50]; Good | 0,75 [0,00–2,50]; Above average | 2,00 [1,25–2,50]; Excellent | 0,016 | 0,099 |
| Novelty | 0,75 [0,25–1,50]; Above average | 0,50 [0,00–1,50]; Above average | 1,00 [0,25–1,50]; Above average | 0,270 | 0,428 |
| 26 item Summary | 1,54 [0,72–2,08] | 1,00 [0,00–2,08] | 1,69 [1,23–2,08] | 0,046 | — |
3.4. Thematic Findings from Qualitative Analysis
The qualitative analysis generated five overarching themes and 15 subthemes describing participants’ experiences with the digital mental health application. The themes captured not only participants’ perceptions of usability and user experience, but also important tensions between perceived ease of use and actual accessibility, the value and complexity of an all-in-one platform, opportunities and limitations of AI-mediated interaction, individualized responses to screening and psychological exercises, and conditions influencing continued adoption.
3.4.1. Theme 1. Perceived Ease of use did not Always Translate into Independent Accessibility
Participants generally described the application as understandable and relatively easy to use. However, among participants with blindness, perceived ease of use did not necessarily mean that the application could be operated independently. Accessibility depended substantially on compatibility with screen readers, availability of auditory guidance, and the ability to navigate the application without assistance. This distinction was particularly evident among participants who had been guided by volunteers during testing and therefore felt unable to judge the application’s true independent usability.
“If you want to show the application, don’t guide us. That way, we can know whether the menus can actually be read by the screen reader. If they cannot be read, then it is useless.” — P05
- Subtheme 1.1. Clear instructions and understandable screening supported initial usability
Most participants considered the instructions and screening questions easy to understand. The language used in the screening process was generally perceived as sufficiently straightforward, suggesting that comprehension of the content itself was not a major barrier to initial use.
“For me, it was easy. The instructions were easy to understand.” — P01
Similarly, one participant without blindness/low vision commented:
“The questions were easy to understand, even from a layperson’s perspective.” — P08
These accounts indicate that the application’s basic instructions and screening content were generally comprehensible across different user groups.
- Subtheme 1.2. Assistive-technology compatibility was a prerequisite for independent use
For participants with blindness/low vision, compatibility with assistive technologies was repeatedly described as a fundamental requirement rather than an optional enhancement. Participants specifically referred to TalkBack, screen readers, and auditory cues as necessary for navigating the application independently.
“A lot of my friends were asking whether TalkBack could read everything. People who are blind use TalkBack; they use the voice, the screen reader.” — P03
Another participant emphasized that compatibility could vary across devices:
“Not every screen reader can read everything. On a phone, there can still be problems—it may freeze or something else may happen.” — P05
Thus, accessibility was closely tied to whether core functions could be perceived and controlled through assistive technologies.
- Subtheme 1.3. Assisted testing could mask actual accessibility barriers
Several participants with blindness/low vision had used the application with substantial assistance from volunteers. Consequently, they distinguished between being able to complete tasks with help and being able to operate the application independently.
“Maybe it was because I wasn’t using it by myself. I was being assisted.” — P01
A participant with more severe blindness/low vision expressed this limitation more explicitly:
“I did not actually hold or operate it myself, so I still don’t know where the difficulties are, what the problems are, or what its advantages are.” — P06
These accounts suggest that successful task completion during assisted testing may overestimate actual independent usability.
3.4.2. Theme 2. Comprehensiveness was Valued but Created Navigational Complexity
Participants frequently valued the breadth of the application, particularly its integration of screening, psychological exercises, mood-related functions, educational content, and AI interaction within a single platform. However, the same comprehensiveness could also make the interface more difficult to navigate. The perceived benefit of having many functions therefore depended on how clearly those functions were organized and introduced.
“It’s like an all-in-one package. Everything is already complete here, so you don’t have to keep moving from one application to another.” — P09
- Subtheme 2.1. An all-in-one platform increased perceived value
Participants perceived integration as an important advantage over applications offering only isolated functions.
“If I want screening somewhere else, I might not get meditation. If I want meditation, I might not get screening. This is like an all-in-one package; everything is already here.” — P09
A similar view was expressed by another participant:
“The instruments are very complete. Other websites may separate them, but here all the psychiatric screening aspects are included in one website.” — P08
The integration of multiple mental health functions therefore contributed substantially to perceived usefulness.
- Subtheme 2.2. Feature abundance increased navigational and cognitive burden
Although comprehensiveness was valued, several participants also indicated that having many features could make navigation more confusing, particularly when information architecture was not sufficiently clear.
“There are some features that probably won’t be used again because other features are more useful. The way the menus are arranged is still a little confusing.” — P09
Age and digital familiarity were also perceived to influence navigation:
“Older generations may be a little confused when exploring and understanding the features because there are so many features here. My father could basically only use the screening part.” — P10
Thus, feature richness was perceived as beneficial only when supported by appropriate interface organization.
- Subtheme 2.3. Clearer information architecture, onboarding, and personalization were needed
Participants suggested that clearer explanations before entering specific modules could help users understand why and how particular features should be used.
“Before entering the actual feature, there could be an introduction explaining what it is for and how to use it.” — P08
Personalization was also perceived as important for broadening accessibility:
“Could the font size be enlarged? If the target users are broader, there may be people with visual problems or older people who find the text difficult to read.” — P10
These findings suggest that improving the application did not necessarily require reducing the number of features, but rather improving their organization, explanation, and adaptability.
3.4.3. Theme 3. AI Lowered Barriers to Disclosure but Conversational Friction Constrained Engagement
AI-mediated interaction was perceived as particularly valuable by some participants who found it difficult to disclose personal experiences to other people. For these participants, the application provided a lower-pressure environment for expression. However, this benefit was counterbalanced by limitations in conversational timing, voice naturalness, turn-taking, and technical reliability.
“I don’t think I can really talk about things with other people because I’m a very closed person. With this application, I can be more open.” — P02
- Subtheme 3.1. AI provided a low-pressure space for disclosure
Several participants described the application as facilitating disclosure because interacting with an AI felt less socially demanding than speaking directly with another person.
“I cannot really talk about these things with other people. I am a very closed person.” — P02
Another participant similarly reported:
“The application is comfortable for talking about things because I am a very closed person. It feels more comfortable and safer. I can talk freely.” — P04
For some participants, this was not necessarily related to embarrassment but to convenience and reduced interpersonal burden:
“It turns out that you don’t always have to talk to another person. Talking through the application also works. Sometimes it is simpler than having to call someone.” — P09
- Subtheme 3.2. Turn-taking, voice quality, and technical reliability disrupted conversational flow
A recurrent concern involved the AI responding before participants had finished speaking.
“It was too fast. It was like talking to a doctor, but before I had finished speaking, it had already answered. It felt like I was being cut off.” — P05
Participants without blindness/low vision also noticed limitations in conversational naturalness:
“The voice still sounded formal, like Google. When we talk, we cannot interrupt it. We have to wait until the AI has completely finished before we can speak again.” — P10
Technical interruptions further affected continuity:
“After about two or three exchanges, the website started loading and I could not continue.” — P08
Together, these findings indicate that conversational quality depended not only on the content generated by the AI but also on pacing, turn-taking, latency, and continuity.
- Subtheme 3.3. Users retained clear boundaries between AI and human or professional support
Despite recognizing the usefulness of AI, participants did not uniformly prefer it over human interaction.
“It was fine talking with the AI, but I would still prefer talking with a human. With a human, you can really have a conversation.” — P05
Participants also emphasized that digital screening should not be confused with clinical diagnosis:
“I’m worried that when the screening result appears, people might treat it like a self-diagnosis. Maybe there should be contact information for relevant professionals.” — P07
These accounts support positioning the AI component as an adjunctive source of support rather than a substitute for professional care.
3.4.4. Theme 4. Screening and Psychological Exercises Supported Self-Awareness and Immediate Relief, but Benefits were Individualized
Screening and psychological exercises were generally perceived as useful components of the application. Participants described increased awareness of their emotional states and, in some cases, immediate feelings of calmness or relief following breathing, meditation, or CBT-related exercises. However, these benefits varied between individuals and were strongly influenced by personal preferences and the design of the intervention.
“It makes us more aware of our own psychological condition.” — P07
- Subtheme 4.1. Screening was understandable and promoted self-awareness
Screening appeared to encourage some participants to reflect on experiences they had previously not identified or discussed.
“It helped me understand myself better, to know what I actually need from myself through those questions.” — P02
Another participant reported recognizing emotional difficulties only after using the application:
“I only realized it after using the application.” — P04, referring to recognizing anxiety and stress.
The perceived usefulness of screening was also apparent among participants without blindness/low vision:
“The most useful part for me was the screening. Sometimes we wonder, ‘Why have I been acting differently lately?’” — P10
- Subtheme 4.2. Psychological exercises could provide immediate emotional relief
Some participants described feelings of relaxation, emotional release, or temporary relief after engaging with psychological exercises.
“When I used the CBT feature, I felt a sense of relief, like something had been released. Feelings that had been held inside could be expressed through the application.” — P09
However, another participant emphasized that this effect could be temporary:
“There was some calmness, but it only lasted while I was sitting there. Once I got up and started moving again, the heavy feeling came back.” — P06
Accordingly, the findings reflect participants’ subjective immediate experiences rather than evidence of clinical effectiveness.
- Subtheme 4.3. Audio design and individual preferences shaped the therapeutic experience
Responses to audio-based exercises varied considerably.
One participant reported:
“I think I felt relaxed when I tried it.” — P03
In contrast, another participant found some nature sounds distracting:
“For me, it didn’t make me feel calm. It was a little noisy.” — P02
For a participant with blindness/low vision, the audio design also interfered with the ability to follow the breathing exercise:
“I was very confused. I couldn’t hear the cue for when to breathe in because the nature sounds were louder. I couldn’t hear when to breathe in or breathe out.” — P05
These contrasting experiences indicate that audio interventions were both preference-sensitive and accessibility-sensitive.
- Subtheme 4.4. Screening required appropriate clinical framing and referral pathways
Participants recognized the potential value of screening but also identified potential risks if screening results were interpreted as diagnoses.
“I’m worried that people might see the screening result and treat it as a diagnosis. There should probably be a way to contact relevant professionals.” — P07
The presence of referral-related features was viewed positively:
“There was a feature showing the nearest hospital, and it really matched the location where we were at the time.” — P08
These findings highlight the importance of linking digital screening with clear interpretation and appropriate pathways to professional care.
3.4.5. Theme 5. Acceptance was High but Conditional on Accessibility, Reliability, and Personal Relevance
Participants generally expressed positive intentions toward future use and recommendation of the application. Nevertheless, acceptance was often conditional. In particular, participants with blindness/low vision emphasized that willingness to continue using or recommending the application depended on whether accessibility barriers were addressed.
“Yes, I would definitely recommend it—if it can actually be accessed.” — P05
- Subtheme 5.1. Perceived usefulness supported willingness to reuse and recommend
Participants frequently linked future use to perceived personal benefits such as opportunities for disclosure, screening, and psychological support.
“Yes, I would like to use it again because I can use it to talk about things.” — P02
One participant had already retained the application:
“I still have it installed on my phone. I’ll keep using it and see how it develops.” — P09
These accounts suggest favorable initial acceptability and perceived usefulness.
- Subtheme 5.2. Continued adoption depended on unresolved practical barriers
For some participants, willingness to use the application was explicitly conditional on improvements.
“It depends on accessibility. Accessibility has to come first.” — P05
A similar conditional response was expressed by another participant:
“If the voice access and the pacing were improved according to what blind users need, then I would probably use it again.” — P06
Thus, favorable attitudes toward the application should not be interpreted as unconditional acceptance.
- Subtheme 5.3. Engagement features could support sustained rather than one-off use
Participants proposed several features intended to encourage regular engagement, including daily check-ins, longitudinal feedback, reminders, and gamification.
“There could be a daily check-in, and then a graph showing how you were yesterday compared with today. If someone checks in regularly, they could also get points or rewards.” — P08
The same participant proposed reminders to maintain engagement:
“If we forget to check in, a notification could come to the smartphone saying that we have not checked in today.” — P08
Another participant viewed several existing features as suitable for repeated use:
“Those main features are already very good for daily use.” — P09
These suggestions distinguish initial acceptability from sustained engagement and indicate that continued use may depend on mechanisms that encourage repeated interaction.
3.5. Integration of Quantitative and Qualitative Data
Quantitative and qualitative findings were integrated to examine whether standardized usability and user-experience scores were consistent with participants’ reported experiences and to identify areas in which the interview findings provided additional explanation (Table 4). Overall, the two data sources demonstrated substantial complementarity rather than simple agreement. The overall median SUS score was 62.50 [55.00–75.00]. Although participants with blindness/low vision had a lower median SUS score than participants without blindness/low vision (60.00 [57.50–67.50] versus 67.50 [55.00–77.50]), this difference was not statistically significant (P=.143). Qualitative findings expanded this result by demonstrating that several participants with blindness/low vision regarded the application content and instructions as understandable while simultaneously reporting difficulty with independent operation, particularly because of screen-reader compatibility, auditory guidance, and reliance on assistance during testing. One participant emphasized that the usability of the application could not be meaningfully assessed for blind users if its menus could not be independently accessed through a screen reader. Thus, the absence of a statistically significant difference in overall SUS scores did not imply equivalence in independent accessibility between groups.
The clearest quantitative–qualitative contrast was observed for Perspicuity. Participants with blindness/low vision reported significantly higher Perspicuity scores than those without blindness/low vision (median 2.50 [1.75–3.00] versus 0.75 [0.00–2.25]; P=.000249; Holm-adjusted P=.001746). This finding was partly confirmed by the interviews, in which participants frequently described the instructions and screening questions as understandable. However, qualitative data also revealed an important distinction between understanding an interface and being able to operate it independently. Some visually impaired participants had completed application tasks with volunteer assistance and explicitly stated that this prevented them from determining whether they could use the application independently. Consequently, the high Perspicuity scores appeared to reflect perceived clarity and comprehensibility, whereas the interviews identified additional accessibility requirements that were not directly represented by the UEQ dimension. This constituted the most prominent area of mixed confirmation and discordance across the two data sources.
The remaining UEQ dimensions were generally consistent with participants’ positive assessments, while the interviews provided more granular explanations of feature-specific strengths and limitations. Positive Attractiveness and Novelty scores were supported by participants’ appreciation of the application’s broad range of integrated functions, with the application described as an “all-in-one package” that reduced the need to move between separate mental health applications. Similarly, the higher Stimulation score observed among participants with blindness/low vision was consistent with qualitative reports of curiosity, perceived usefulness, and intentions to continue using the application, although the quantitative between-group difference did not remain significant after correction for multiple comparisons. In contrast, positive average Efficiency and Dependability scores coexisted with specific reports of voice-recognition problems, loading interruptions, restrictive AI turn-taking, navigation difficulties, and inconsistent assistive-technology compatibility. These findings suggest that aggregate user-experience scores captured overall impressions but could obscure localized barriers affecting particular features, devices, or user groups.
Finally, several clinically relevant findings emerged exclusively from the qualitative data and therefore expanded rather than directly confirmed the SUS and UEQ results. Some participants described AI-mediated interaction as a lower-pressure environment for disclosure, particularly when they were reluctant to discuss personal concerns with other people, while others retained a preference for human interaction. Psychological exercises were also associated with subjective feelings of calmness or emotional relief for some users, although these effects were heterogeneous and sometimes temporary. Participants additionally emphasized the need to distinguish screening from diagnosis and to provide clear pathways to professional support. Taken together, the integrated findings indicate that the application was generally perceived positively. Accessibility, technical reliability, conversational quality, personalization, and appropriate clinical boundaries emerged as critical considerations for further development that would have been incompletely captured by the standardized quantitative measures alone.
4. Discussion
Overall SUS score
Psikiatris.id had an overall median SUS score of 62.50 [55.00–75.00]. Previous digital mental health usability studies provide context but cannot be directly ranked against this median. Stiles-Shields et al. reported mean SUS scores of 70.00 and 84.10 for Boost Me and Thought Challenger at week 3, increasing to 78.33 and 88.57 at week 6 [25]. Halim et al. reported a mean of 75.9 ± 13.09 for an individualized virtual-reality intervention [26]. Differences in summary statistics, populations, exposure duration, and administration conditions prevent a direct performance comparison.
Several factors may explain these differences. The applications evaluated by Stiles-Shields et al. were relatively focused behavioral or cognitive interventions, whereas Psikiatris.id integrates screening, psychological exercises, virtual nature, and conversational AI within a single system [25]. Participants in the present study explicitly regarded this comprehensiveness as simultaneously valuable and potentially confusing. The findings therefore suggest a potential design trade-off: integrating multiple functions may increase perceived usefulness while also increasing navigational and cognitive demands.
Perspicuity
The overall median Perspicuity score was 2.00 [0.50–2.75]. Published mean scores from other UEQ studies offer contextual examples rather than direct comparators for this median. Naccache et al. reported a Perspicuity score of 1.80, categorized as Good, for a smartphone companion application for adolescents with anorexia nervosa [27]. CanSelfMan, a mobile self-management application for children with cancer and their caregivers, achieved Perspicuity scores of 1.895 among children and 1.830 among caregivers [28]. Halim et al. similarly reported that Perspicuity fell within the Good UEQ benchmark range in their individualized virtual-reality application, with qualitative feedback frequently describing the system as easy to use and navigate [26].
However, the particularly high Perspicuity score among participants with blindness/low vision requires careful interpretation. Qualitative interviews confirmed that screening questions and instructions were generally understandable, but simultaneously revealed that some participants could not confidently determine whether the application could be operated independently because they had received assistance during testing. Others specifically identified screen-reader compatibility as a prerequisite for actual use. Thus, the quantitative and qualitative results demonstrate both confirmation and discordance: the application may be conceptually easy to understand while still presenting barriers to independent physical or technological interaction. This distinction is theoretically important because Perspicuity and accessibility are related but non-equivalent constructs. Perspicuity evaluates perceived clarity and learnability [29], whereas accessibility determines whether users can perceive, navigate, and interact with the system through the sensory and assistive channels available to them [30]. A blind user may therefore completely understand what an application is requesting while being unable to activate a particular control because the element is not correctly exposed to a screen reader. Zhou et al.’s work similarly demonstrated that a system that is generally usable can still require disability-specific adjustments before users with disabilities can independently perform the intended tasks [30].
Attractiveness
The overall median Attractiveness score was 1.67 [0.83–2.46]. For context, Naccache et al. reported a score of 1.50 for their mental health companion application [27], while CanSelfMan reported 1.956 among children and 1.853 among parents or caregivers [28]. These reported mean scores should not be interpreted as equivalent to, or directly ranked against, the median in the present study.
The qualitative findings provide additional insight into what Attractiveness represented to users. Participants particularly valued having screening, psychological support, and other mental health functions consolidated within one application, with one participant describing Psikiatris.id as an “all-in-one package.” Thus, positive Attractiveness ratings appeared to reflect not only aesthetic design but also perceptions of comprehensiveness, convenience, and functional value.
Calm trial participants reported satisfaction and willingness to recommend the app [31], while Wysa reviewers described its friendly penguin interface as approachable [32]. These findings concern acceptability rather than UEQ Attractiveness, but suggest that emotional tone and perceived usefulness can accompany visual appeal. For blind users of Psikiatris.id, an inviting experience should also be evaluated through voice quality, interaction pacing, and accessible controls.
Visual aesthetics nevertheless remain relevant to overall user experience, particularly for sighted users. Perrig et al. experimentally compared aesthetically enhanced and less aesthetic versions of the same smartphone web application and found substantially higher perceived usability in the aesthetic condition (d = 0.86) [33]. They proposed an aesthetic-usability halo effect, whereby favorable aesthetic impressions influence users’ subjective judgments of usability even when underlying functionality is otherwise equivalent [33]. Pleasing aesthetics have also been associated with greater preference, trust, satisfaction, and willingness to reuse software [33]. However, this explanation should not be extrapolated directly to visually impaired users.
Efficiency
The overall median Efficiency score was 1.50 [0.25–2.25]. Naccache et al. reported a mean of 1.09 [27], while CanSelfMan reported means of 1.934 and 1.880 among children and caregivers [28]. These provide context rather than direct comparisons with the present median. The CanSelfMan authors linked efficiency to an integrated but modular structure [28].
Headspace’s evaluated sessions lasted 5–10 minutes [34], and Calm participants were asked to meditate for at least 10 minutes daily [31]. Brief sessions may fit daily routines, but intervention duration is not a measure of interface efficiency. Psikiatris.id should therefore be evaluated using task completion time, unnecessary navigation steps, and screen-reader interaction burden, particularly where loading or turn-taking interrupts users.
Dependability
The overall median Dependability score was 1.25 [0.50–2.19], with no significant adjusted between-group difference. Naccache et al. reported a mean of 1.31 [27], and CanSelfMan reported means of 1.803 and 1.820 [28]. Halim et al. reported Below Average Dependability together with lag and limited avatar interaction [26]. These contextual findings emphasize the importance of predictable operation.
Wysa user feedback identified repetitive responses and failures to understand users [32]. Such conversational breakdowns offer a parallel to the turn-taking and continuity problems reported for Psikiatris.id. They suggest assessing predictable responses, recovery after misunderstanding, and user control. Dependability concerns perceived control and predictability; neither a positive UEQ score nor trust in a conversational agent establishes clinical safety.
These findings demonstrate a form of localized discordance between standardized ratings and task-specific experiences. A system may be considered efficient and predictable overall while still containing a limited number of highly consequential failures. This interpretation is consistent with Borghouts et al., who identified technical issues as the most commonly reported technology-related barrier to digital mental health engagement across 25 studies. Reported problems included application crashes, difficulty locating information, cumbersome login procedures, and navigation difficulties [35].
Stimulation
The overall median Stimulation score was 2.00 [0.25–2.50]. Published mean scores included 1.40 in Naccache et al. [27] and 1.776 and 1.680 among children and caregivers in CanSelfMan [28]. Halim et al. reported a Good benchmark classification for Stimulation [26]. These comparisons describe related design experiences rather than establish relative performance across studies.
Qualitative findings supported the favorable Stimulation result, with participants expressing curiosity, perceived usefulness, willingness to reuse the application, and interest in observing its future development. Nevertheless, their intention to continue using Psikiatris.id was frequently conditional on resolving accessibility and technical problems. This highlights an important distinction between initial stimulation and sustained engagement. Borghouts et al. conceptualized engagement as encompassing initial adoption, uptake, and continued interaction and showed that sustained engagement depends on relevance, motivation, user experience, personalization, technical performance, and contextual circumstances [35].
Several participants proposed features such as daily check-ins, progress visualization, reminders, points, and rewards to encourage sustained use. These suggestions parallel the broader literature on gamification. In a systematic review of 70 studies covering 50 mental health and well-being technologies, Cheng et al. identified progress feedback, points, rewards, narrative elements, personalization, and customization among the most frequently used gamification components; promoting engagement was one of the principal reasons for implementing them [36].
A 2026 survey of 536 meditation-app users, most commonly using Headspace or Calm, found generally low engagement [37]. This complements the distinction between initial enthusiasm and continued use in Psikiatris.id. Wysa reviewers also valued interactive exercises [32]. These findings motivate longitudinal measurement of return visits and completed activities.
Novelty
Novelty had the lowest overall median (0.75 [0.25–1.50]). Naccache et al. likewise identified Novelty as a comparatively weaker dimension, with a reported mean of 0.88 [27]. CanSelfMan reported mean Novelty scores of 1.711 among children and 1.670 among caregivers [28]. Naccache et al. further observed qualitatively that perceptions of an application as insufficiently modern or visually appealing could negatively influence its novelty and early adoption [27].
The qualitative findings in the present study suggest that users regarded the integration of screening, psychological interventions, and AI within one platform as distinctive, even though individual technological components were not necessarily perceived as novel. This distinction is relevant because conversational AI has become increasingly familiar through general-purpose AI technologies. Thus, the novelty of Psikiatris.id may derive more from its integration and orchestration of evidence-based mental health functions than from any single technological feature.
The combination of cognitive-behavioral and mindfulness strategies in Headspace [34], app-delivered meditation in Calm [31], and conversational CBT support in Wysa [38] indicates that these component approaches already have precedents. Thus, a potential contribution of Psikiatris.id is their integration for an Indonesian population with differing visual abilities, rather than invention of the individual components.
AI-mediated disclosure and human support
One of the most clinically relevant qualitative findings was that some participants experienced the AI conversational component as a lower-pressure environment for discussing personal concerns. These findings are consistent with studies of mental health conversational agents. Beatty et al. found evidence of a measurable therapeutic alliance between users and Wysa, a free-text CBT conversational agent. Their qualitative analysis identified gratitude, perceived positive impact, personification, safety, and comfort as elements contributing to the bond between users and the chatbot [33]. At the same time, some users expressed frustration when the conversational agent misunderstood their responses, illustrating that perceived conversational limitations can disrupt this bond [33].
The online disinhibition effect provides one potential theoretical framework for understanding lower-pressure disclosure. Suler proposed that online environments can reduce psychological restraints on self-expression through mechanisms including anonymity, invisibility, asynchronicity, solipsistic introjection, dissociative imagination, and minimization of authority [39]. These characteristics may facilitate what he described as benign disinhibition, in which users disclose emotions, fears, wishes, or other personal experiences more readily than they would during face-to-face interactions [39]. Although this framework was developed primarily for online interpersonal communication rather than contemporary AI systems, the reduction of immediate interpersonal evaluation may provide a plausible explanation for why some participants in the present study found AI-mediated communication less socially demanding.
Screening, self-awareness, and psychological exercises
Participants generally perceived the screening component as understandable and useful for reflecting on their psychological condition. The self-awareness finding is consistent with previous research on digital self-monitoring. Bakker and Rickard found that greater engagement with the MoodPrism self-monitoring application predicted decreases in depressive and anxiety symptoms and increases in mental well-being. Among participants with clinically elevated depression or anxiety at baseline, these associations were mediated by increases in emotional self-awareness [40]. Emotional self-awareness may therefore represent one pathway through which structured digital reflection enables users to identify and differentiate emotional experiences.
Psychological exercises, including CBT-related activities, breathing, and relaxation components, were also associated with subjective feelings of calmness or emotional relief, which is compatible with recent experimental evidence. Sandkühler et al. compared 12 app-based psychotherapeutic exercises—including cognitive restructuring, mindfulness, guided imagery, progressive muscle relaxation, diaphragmatic breathing, positive expressive writing, and gratitude practice—and found that each intervention reduced immediate anxiety more than control conditions [41]. Effect sizes varied substantially between exercises, ranging approximately from d = 0.5 to 1.5, including substantial differences between exercises belonging to similar therapeutic categories [41]. The variability observed by Sandkühler et al. is particularly consistent with the individualized responses identified qualitatively in Psikiatris.id. Different techniques do not necessarily produce equivalent effects for all individuals, and the same sensory or psychological component may be beneficial to one user but distracting or inaccessible to another. Bakker et al. similarly emphasized that transdiagnostic CBT can provide a common framework for anxiety and depressive disorders while still requiring tailoring of intervention components according to individual needs [42].
Clinical-outcome research provides a separate test of benefit. A 2025 Headspace trial randomized 168 adults with elevated anxiety or depressive symptoms and found greater symptom improvement than a waitlist control, sustained at a three-week follow-up [34]. An eight-week Calm trial, analyzing 88 stressed college students, reported improvements in stress, mindfulness, and self-compassion [31]. Wysa alliance findings address the perceived relationship with the agent rather than establish symptom efficacy [38]. In Psikiatris.id, reported self-awareness and immediate relief should therefore motivate controlled longitudinal evaluation, while screening results remain distinct from clinical diagnoses.
Strengths and limitations
This study has several strengths. First, the explanatory sequential mixed-methods approach enabled standardized usability and user-experience measures to be interpreted alongside participants’ direct descriptions of application use. The present study therefore contributes evidence from a population that remains comparatively underrepresented in digital mental health usability research. Third, the evaluation considered multiple dimensions of user experience rather than relying on a single global usability score. Combining SUS, all six UEQ dimensions, and qualitative interviews made it possible to identify both global perceptions and feature-specific experiences. Fourth, the study provides context-specific evidence from Indonesia, which is included in low- and middle-income countries.
Several limitations should also be acknowledged. First, this was an early-stage pilot study with relatively modest subgroup sizes. The nonsignificant difference in SUS between groups therefore cannot be considered evidence of equivalent usability. Second, the two participant groups were evaluated under different conditions: participants with disabilities underwent in-person testing, whereas participants without disabilities completed the evaluation remotely. Third, assisted testing may have underestimated actual accessibility barriers. Some visually impaired participants explicitly stated that they could not fully evaluate independent usability because they had been guided during application use. Fourth, the visual-impairment group itself was heterogeneous, including participants with total blindness and low vision. Their accessibility requirements may differ substantially, and larger studies should analyze these groups separately where feasible. Finally, the study was not designed as a clinical efficacy trial. Participants’ reports of increased self-awareness, calmness, emotional relief, or benefits from AI interaction should therefore be interpreted as perceived and immediate user experiences, not as evidence that Psikiatris.id reduces depressive or anxiety symptoms. Future studies with larger samples would provide more precise estimates and enable more detailed examination of heterogeneity within visual-impairment categories. Moreover, controlled longitudinal trials will be necessary to determine the clinical effectiveness and safety of the screening, psychotherapeutic, and AI-supported components.
The administration procedures and potential interviewer and social-desirability effects are addressed in Methods. Their implications remain relevant to the interpretation of the present self-report outcomes, particularly because testing setting coincided with blindness/low-vision status.
SUS internal consistency was lower in participants with blindness/low vision (α=.524) than in participants without blindness/low vision (α=.759). This limits confidence in the precision of subgroup scores and motivates further assessment of item interpretation and measurement comparability; it does not demonstrate invalidity or establish measurement invariance. The significant adjusted Perspicuity difference should therefore be interpreted alongside the assisted-testing context, modest sample size, and broader measurement limitations. Favorable perceptions of the AI avatar do not establish technical safety, protection of sensitive disclosures, or reliable detection and management of suicidal risk. These require specific evaluation beyond SUS, UEQ, and qualitative acceptability.
5. Conclusions
This pilot explanatory sequential mixed-methods study of 66 Indonesian adults found positive user experience ratings. Usability scores showed no statistically significant difference between participants with and without blindness/low vision. Perspicuity was higher in the blindness/low vision group after Holm adjustment, but perceived clarity did not establish independent accessibility. Participants valued integrated functions while describing screen-reader barriers, navigational complexity, conversational friction, and variable immediate responses to psychological exercises. Further development should prioritize independent accessibility, technical reliability, standardized outcome-measure administration, and documented AI privacy and safety procedures. Larger studies and controlled longitudinal evaluations are required before drawing conclusions about clinical effectiveness or safety.
Author Contributions
Conceptualization, B.M.N., A.W., A.D., and S.I.; methodology, B.M.N. and A.W.; software, B.M.N. and A.W.; validation, B.M.N., A.W., A.D., and S.I.; formal analysis, B.M.N. and A.W..; investigation, B.M.N. and A.W.; resources, B.M.N., A.W., A.D., and S.I.; data curation, B.M.N. and A.W.; writing—original draft preparation, B.M.N. and A.W.; writing—review and editing, B.M.N., A.W., A.D., and S.I.; visualization, B.M.N.; supervision, A.D. and S.I.; project administration, B.M.N., A.W., A.D., and S.I.; funding acquisition, A.D. and S.I.. All authors have read and agreed to the published version of the manuscript.
Funding
This research received no external funding.
Institutional Review Board Statement
In this section, you should add the Institutional Review Board Statement and approval number, if relevant to your study. You might choose to exclude this statement if the study did not require ethical approval. Please note that the Editorial Office might ask you for further information. Please add “The study was conducted in accordance with the Declaration of Helsinki, and approved by the Health Research Ethics Committee of Dr. Moewardi General Hospital (Komisi Etik Penelitian Kesehatan RSUD Dr. Moewardi), Indonesia (approval no. 1.481/VIII/HREC/2026; issued in August 2026).
Informed Consent Statement
Informed consent was obtained from all subjects involved in the study.
Data Availability Statement
Data supporting the results can be found in https://docs.google.com/spreadsheets/d/1JW531YDons5uWlO4pthImxjc6tzAOVW97naFQ-mqxyA/edit?gid=862818290#gid=862818290 .
Acknowledgments
We thank all of the participants from Sentra Wyata Guna Bandung, Trash Ranger Indonesia, and Youth Ranger Indonesia and research volunteers for their participation in this pilot study.
Conflicts of Interest
The authors declare no conflict of interest.
Abbreviations
The following abbreviations are used in this manuscript:
| AI | Artificial Intelligence |
| ASEAN | Association of Southeast Asian Nations |
| CBT | Cognitive Behavioral Therapy |
| GAD-7 | Generalized Anxiety Disorder-7 |
| HREC | Health Research Ethics Committee |
| IBM | International Business Machines |
| LMICs | Low- and Middle-Income Countries |
| PHQ-9 | Patient Health Questionnaire-9 |
| Q1 | First Quartile |
| Q3 | Third Quartile |
| RSUD | Rumah Sakit Umum Daerah |
| SD | Standard Deviation |
| SPSS | Statistical Package for the Social Sciences |
| SUS | System Usability Scale |
| UEQ | User Experience Questionnaire |
References
- GBD 2019 Mental Disorders Collaborators. Global, regional, and national burden of 12 mental disorders in 204 countries and territories, 1990–2019: a systematic analysis for the Global Burden of Disease Study 2019. Lancet Psychiatry 2022, 9(2), 137–150. [Google Scholar] [CrossRef] [PubMed]
- Peltzer, K.; Pengpid, S. High prevalence of depressive symptoms in a national sample of adults in Indonesia: childhood adversity, sociodemographic factors and health risk behaviour. Asian J. Psychiatr. 2018, 33, 52–59. [Google Scholar] [CrossRef] [PubMed]
- Arulsamy, K.; Effendy, E.; Mardhiyah, S.; Amin, M.M.; Husada, M.S.; Camellia, V.; et al. The economic burden of anxiety and depression in Indonesia: evidence from a cross-sectional web panel survey. Front Public Health 2025, 13, 1667726. [Google Scholar] [CrossRef] [PubMed]
- Shah, N.; Tran, E.; Aly, M.; Phu, V.; Laughlin, E.; Malvankar-Mehta, M.S. Depression and anxiety in patients with irreversible vision loss: meta-analysis and systematic review. Int. J. Psychiatry Med. 2026, 61(5), 574–602. [Google Scholar] [CrossRef] [PubMed]
- Virgili, G.; Parravano, M.; Petri, D.; Maurutto, E.; Menchini, F.; Lanzetta, P.; et al. The association between vision impairment and depression: a systematic review of population-based studies. J. Clin. Med. 2022, 11(9), 2412. [Google Scholar] [CrossRef] [PubMed]
- Alonso, J.; Liu, Z.; Evans-Lacko, S.; et al. Treatment gap for anxiety disorders is global: results of the World Mental Health Surveys in 21 countries. Depress Anxiety 2018, 35(3), 195–208. [Google Scholar] [CrossRef] [PubMed]
- Vigo, D.; Haro, J.M.; Hwang, I.; Aguilar-Gaxiola, S.; Alonso, J.; Borges, G.; et al. Toward measuring effective treatment coverage: critical bottlenecks in quality- and user-adjusted coverage for major depressive disorder. Psychol. Med. 2022, 52(10), 1948–1958. [Google Scholar] [CrossRef] [PubMed]
- Syafitri, D.U.; Mawaddah, S.; Lau, J.Y.F.; Brown, J.S.L. Barriers and facilitators of psychological help-seeking of people with depression, anxiety, and stress symptoms among ASEAN countries: a systematic review. Int. J. Soc. Psychiatry 2026, 72(3), 419–438. [Google Scholar] [CrossRef] [PubMed]
- van Munster, E.P.J.; van der Aa, H.P.A.; Verstraten, P.; van Nispen, R.M.A. Barriers and facilitators to recognize and discuss depression and anxiety experienced by adults with vision impairment or blindness: a qualitative study. BMC Health Serv. Res. 2021, 21, 749. [Google Scholar] [CrossRef] [PubMed]
- van der Aa, H.P.A.; van Rens, G.H.M.B.; Comijs, H.C.; Margrain, T.H.; Gallindo-Garre, F.; Twisk, J.W.R.; et al. Stepped care for depression and anxiety in visually impaired older adults: multicentre randomised controlled trial. BMJ 2015, 351, h6127. [Google Scholar] [CrossRef] [PubMed]
- Alfonsson, S.; Maathz, P.; Hursti, T. Interformat reliability of digital psychiatric self-report questionnaires: a systematic review. J. Med. Internet Res. 2014, 16(12), e268. [Google Scholar] [CrossRef] [PubMed]
- Martin-Key, N.A.; Spadaro, B.; Funnell, E.; Barker, E.J.; Schei, T.S.; Tomasik, J.; et al. The current state and validity of digital assessment tools for psychiatry: systematic review. JMIR Ment. Health 2022, 9(3), e32824. [Google Scholar] [CrossRef] [PubMed]
- Kim, J.; Aryee, L.M.D.; Bang, H.; Prajogo, S.; Choi, Y.K.; Hoch, J.S.; et al. Effectiveness of digital mental health tools to reduce depressive and anxiety symptoms in low- and middle-income countries: systematic review and meta-analysis. JMIR Ment. Health 2023, 10, e43066. [Google Scholar] [CrossRef] [PubMed]
- Karyotaki, E.; Miguel, C.; Panagiotopoulou, O.M.; Harrer, M.; Seward, N.; Sijbrandij, M.; et al. Digital interventions for common mental disorders in low- and middle-income countries: a systematic review and meta-analysis. Glob. Ment. Health 2023, 10, e68. [Google Scholar] [CrossRef] [PubMed]
- Hedman-Lagerlöf, E.; Carlbring, P.; Svärdman, F.; Riper, H.; Cuijpers, P.; Andersson, G. Therapist-supported Internet-based cognitive behaviour therapy yields similar effects as face-to-face therapy for psychiatric and somatic disorders: an updated systematic review and meta-analysis. World Psychiatry 2023, 22(2), 305–314. [Google Scholar] [CrossRef] [PubMed]
- Rickard, N.S.; Kurt, P.; Meade, T. Systematic assessment of the quality and integrity of popular mental health smartphone apps using the American Psychiatric Association’s app evaluation model. Front Digit Health 2022, 4, 1003181. [Google Scholar] [CrossRef] [PubMed]
- Camacho, E.; Cohen, A.; Torous, J. Assessment of mental health services available through smartphone apps. JAMA Netw. Open 2022, 5(12), e2248784. [Google Scholar] [CrossRef] [PubMed]
- Martinengo, L.; Stona, A.C.; Griva, K.; Dazzan, P.; Pariante, C.M.; von Wangenheim, F.; et al. Self-guided cognitive behavioral therapy apps for depression: systematic assessment of features, functionality, and congruence with evidence. J. Med. Internet Res. 2021, 23(7), e27619. [Google Scholar] [CrossRef] [PubMed]
- Bunyi, J.; Ringland, K.E.; Schueller, S.M. Accessibility and digital mental health: considerations for more accessible and equitable mental health apps. Front Digit Health 2021, 3, 742196. [Google Scholar] [CrossRef] [PubMed]
- Sauro, J.; Lewis, J.R. The variability and reliability of standardized UX scales [Internet]. MeasuringU 2023. [Google Scholar]
- Brooke, J. SUS: a “quick and dirty” usability scale. In Usability Evaluation in Industry; Jordan, P.W., Thomas, B., Weerdmeester, B.A., McClelland, I.L., Eds.; Taylor & Francis: London, 1996; pp. 189–194. [Google Scholar]
- Sharfina, Z.; Santoso, H.B. An Indonesian adaptation of the System Usability Scale (SUS). In 2016 International Conference on Advanced Computer Science and Information Systems (ICACSIS); IEEE, 2017; pp. 145–148. [Google Scholar] [CrossRef]
- Laugwitz, B.; Held, T.; Schrepp, M. Construction and evaluation of a User Experience Questionnaire. In HCI and Usability for Education and Work. Lecture Notes in Computer Science; Holzinger, A., Ed.; Springer: Berlin, 2008; vol. 5298, pp. 63–76. [Google Scholar] [CrossRef]
- Schrepp, M. User Experience Questionnaire Handbook. Official UEQ project. Accessed. (accessed on 12 September 2026). [CrossRef]
- Stiles-Shields, C.; Montague, E.; Kwasny, M.J.; Mohr, D.C. Behavioral and cognitive intervention strategies delivered via coached apps for depression: pilot trial. Psychol. Serv. 2019, 16(2), 233–238. [Google Scholar] [CrossRef] [PubMed]
- Halim, I.; Stemmet, L.; Hach, S.; Porter, R.; Liang, H.N.; Vaezipour, A.; et al. Individualized virtual reality for increasing self-compassion: evaluation study. JMIR Ment. Health 2023, 10, e47617. [Google Scholar] [CrossRef] [PubMed]
- Naccache, B.; Mesquida, L.; Raynaud, J.P.; Revet, A. Smartphone application for adolescents with anorexia nervosa: an initial acceptability and user experience evaluation. BMC Psychiatry 2021, 21, 467. [Google Scholar] [CrossRef] [PubMed]
- Mehdizadeh, H.; Asadi, F.; Nazemi, E.; Mehrvar, A.; Yazdanian, A.; Emami, H. A mobile self-management app (CanSelfMan) for children with cancer and their caregivers: usability and compatibility study. JMIR Pediatr. Parent. 2023, 6, e43867. [Google Scholar] [CrossRef] [PubMed]
- Schrepp, M.; Hinderks, A.; Thomaschewski, Jr. Construction of a benchmark for the User Experience Questionnaire (UEQ). Int. J. Interact. Multimed. Artif. Intell. 2017, 4(4), 40–44. [Google Scholar] [CrossRef]
- Zhou, L.; Saptono, A.; Setiawan, I.M.A.; Parmanto, B. Making self-management mobile health apps accessible to people with disabilities: qualitative single-subject study. JMIR Mhealth Uhealth 2020, 8(1), e15060. [Google Scholar] [CrossRef] [PubMed]
- Huberty, J.; Green, J.; Glissmann, C.; Larkey, L.; Puzia, M.; Lee, C. Efficacy of the mindfulness meditation mobile app ‘Calm’ to reduce stress among college students: randomized controlled trial. JMIR Mhealth Uhealth 2019, 7(6), e14273. [Google Scholar] [CrossRef] [PubMed]
- Malik, T.; Ambrose, A.J.; Sinha, C. Evaluating user feedback for an artificial intelligence–enabled, cognitive behavioral therapy–based mental health app (Wysa): qualitative thematic analysis. JMIR Hum. Factors 2022, 9(2), e35668. [Google Scholar] [CrossRef] [PubMed]
- Perrig, S.A.C.; Ueffing, D.; Opwis, K.; Brühlmann, F. Smartphone app aesthetics influence users’ experience and performance. Front Psychol. 2023, 14, 1113842. [Google Scholar] [CrossRef] [PubMed]
- Staiano, W.; Callahan, C.E.; Davis, M.; Tanner, L.; Kunkle, S.; Glover, J.; et al. Efficacy of a self-guided transdiagnostic intervention for adults with anxiety and depression: randomized controlled trial. JMIR Mhealth Uhealth 2025, 13, e79759. [Google Scholar] [CrossRef] [PubMed]
- Borghouts, J.; Eikey, E.; Mark, G.; De Leon, C.; Schueller, S.M.; Schneider, M.; et al. Barriers to and facilitators of user engagement with digital mental health interventions: systematic review. J. Med. Internet Res. 2021, 23(3), e24387. [Google Scholar] [CrossRef] [PubMed]
- Cheng, V.W.S.; Davenport, T.; Johnson, D.; Vella, K.; Hickie, I.B. Gamification in apps and technologies for improving mental health and well-being: systematic review. JMIR Ment. Health 2019, 6(6), e13717. [Google Scholar] [CrossRef] [PubMed]
- Adams, J.; Davies, J.; Wattanatakulchat, P.; Galante, J.; Miller, F.; D’Alfonso, S.; et al. Engagement with meditation apps: cross-sectional survey of use and associations. J. Med. Internet Res. 2026, 28, e71960. [Google Scholar] [CrossRef] [PubMed]
- Beatty, C.; Malik, T.; Meheli, S.; Sinha, C. Evaluating the therapeutic alliance with a free-text CBT conversational agent (Wysa): a mixed-methods study. Front Digit Health 2022, 4, 847991. [Google Scholar] [CrossRef] [PubMed]
- Suler, J. The online disinhibition effect. Cyberpsychol Behav. 2004, 7(3), 321–326. [Google Scholar] [CrossRef] [PubMed]
- Bakker, D.; Rickard, N. Engagement in mobile phone app for self-monitoring of emotional wellbeing predicts changes in mental health: MoodPrism. J. Affect Disord. 2018, 227, 432–442. [Google Scholar] [CrossRef] [PubMed]
- Sandkühler, J.F.; Kahl, F.; Sadurska, M.Z.; Brietbart, P.; Greenberg, S.; Brauner, J. The immediate impact of app-based psychotherapeutic exercises on anxiety: an RCT. Depress Anxiety 2025, 2025(1), 5586831. [Google Scholar] [CrossRef] [PubMed]
- Bakker, D.; Kazantzis, N.; Rickwood, D.; Rickard, N. Mental health smartphone apps: review and evidence-based recommendations for future developments. JMIR Ment. Health 2016, 3(1), e7. [Google Scholar] [CrossRef] [PubMed]
Figure 1.
Psikiatris.id application display: a. and b. Display of home page; c. Display of article page; d., e., and f. Display of screening and psychotherapy support page.
Figure 1.
Psikiatris.id application display: a. and b. Display of home page; c. Display of article page; d., e., and f. Display of screening and psychotherapy support page.
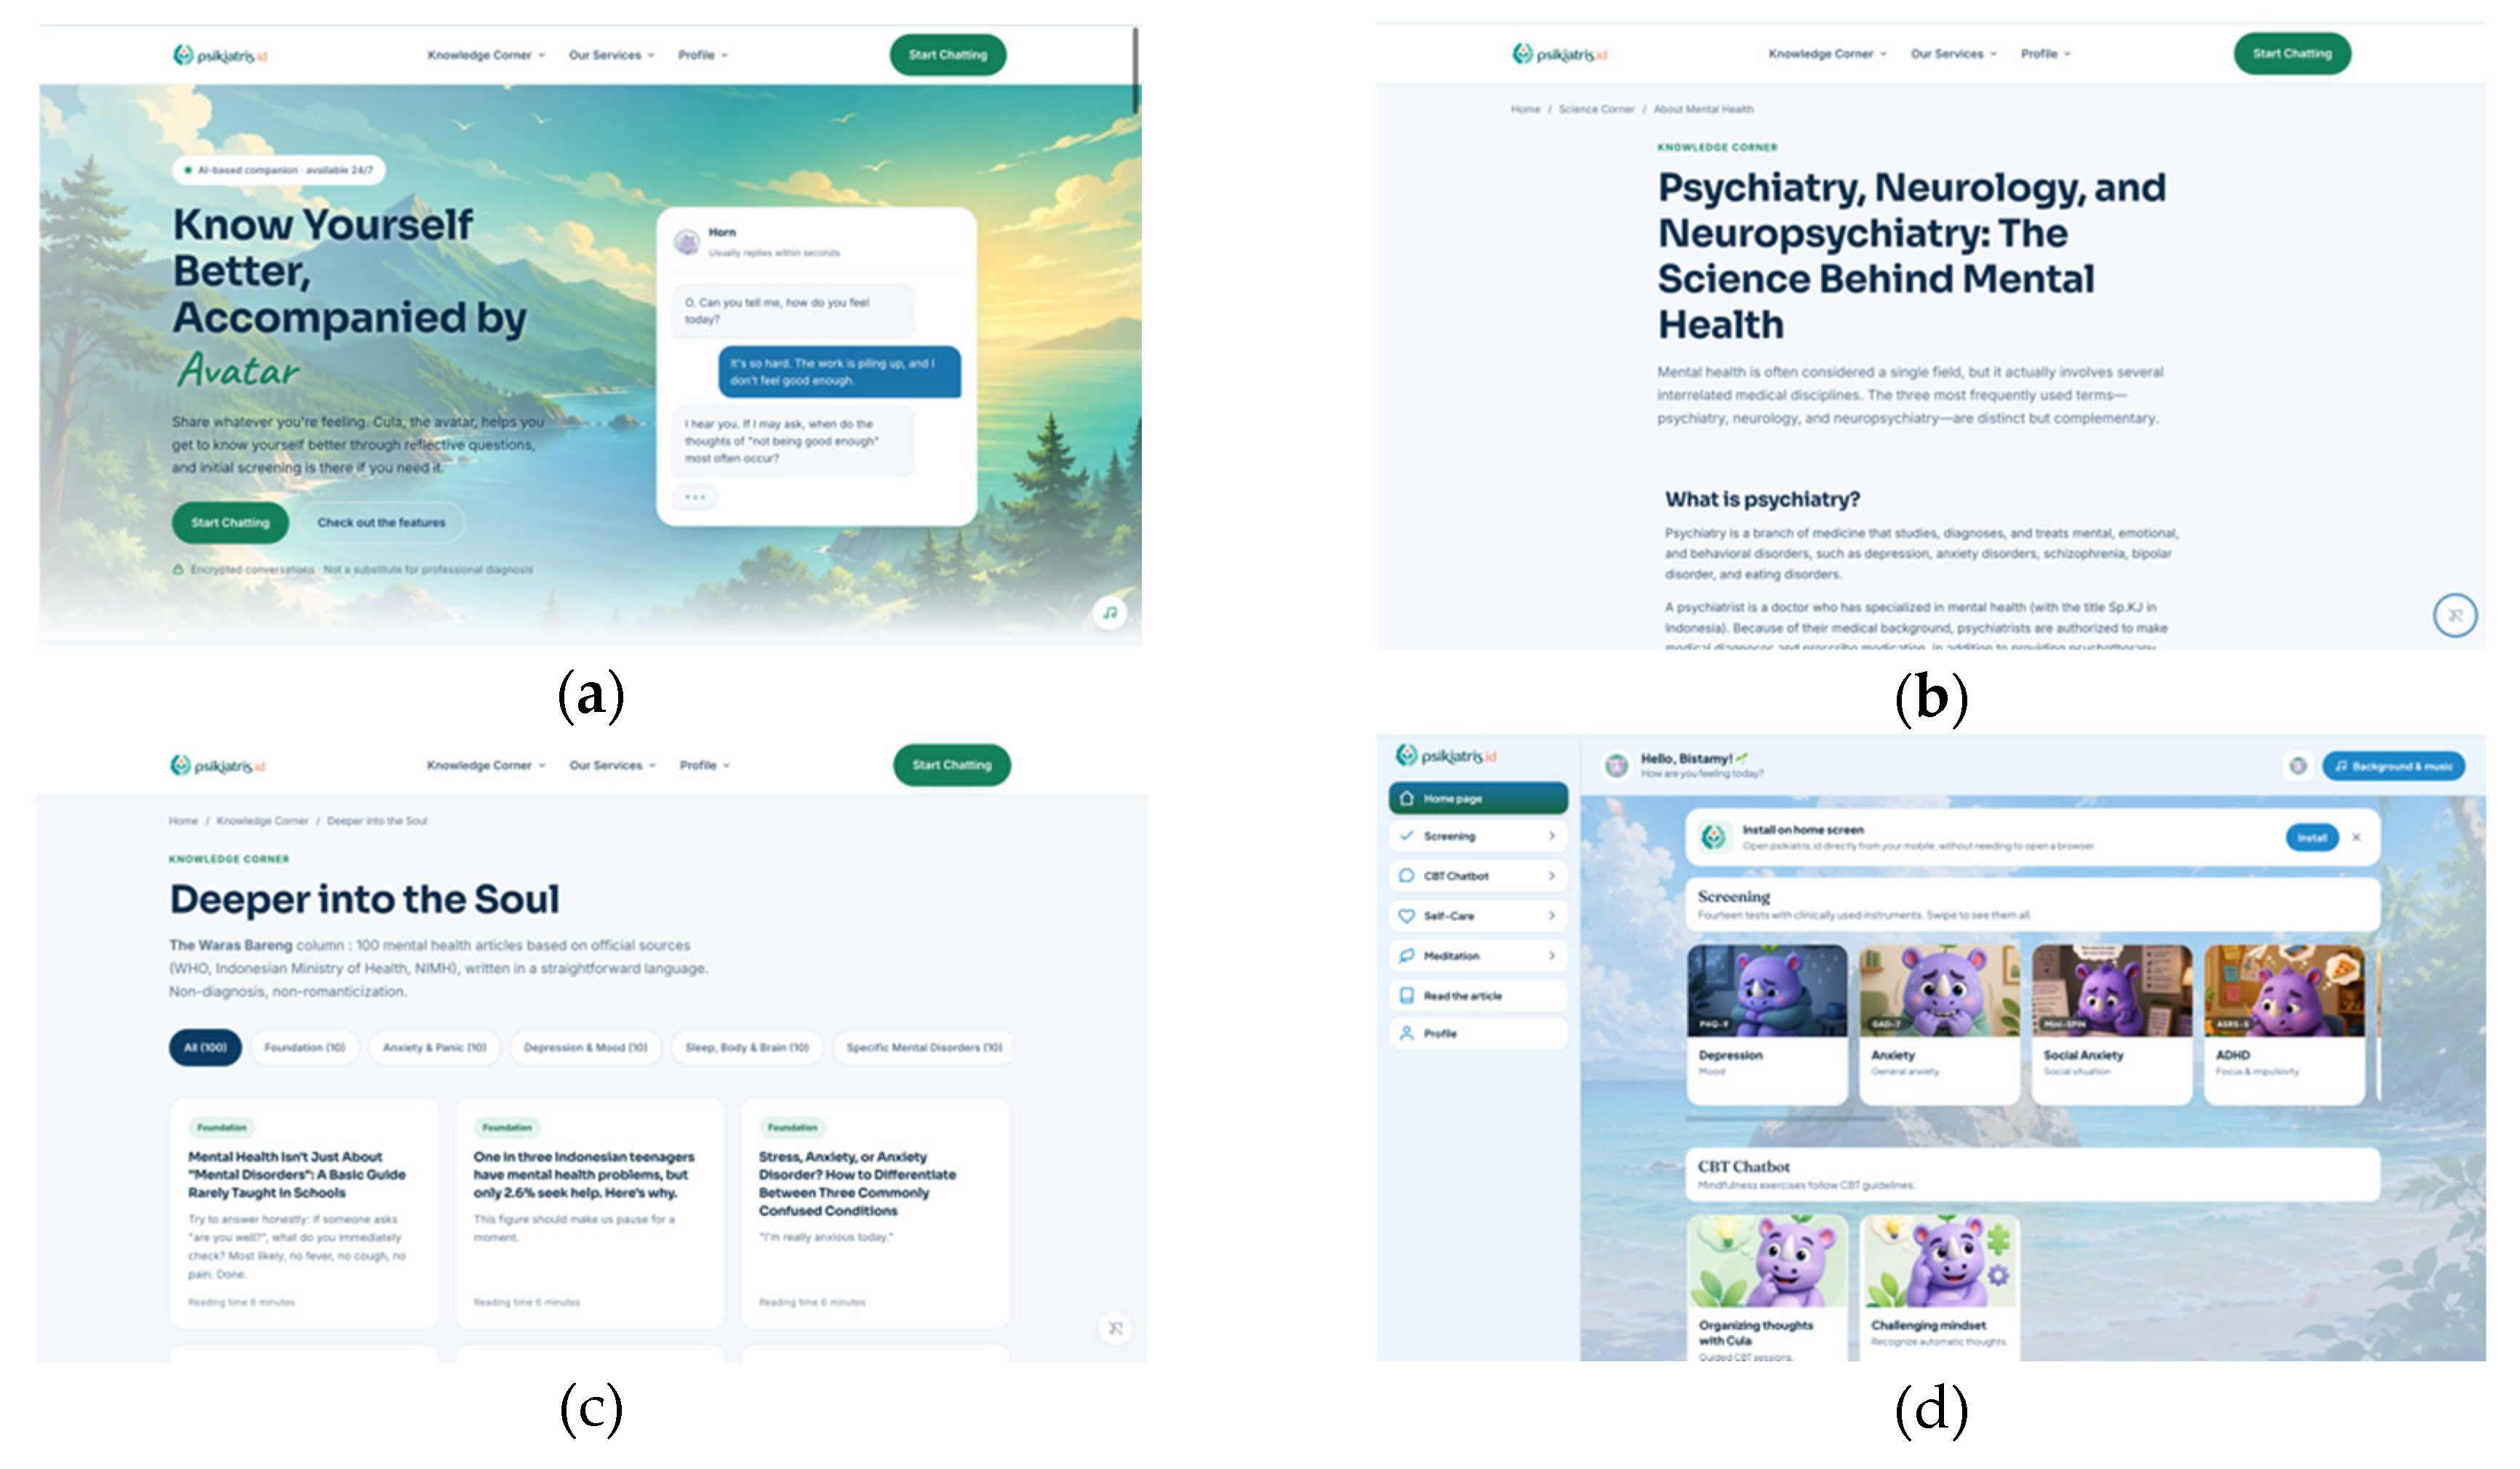
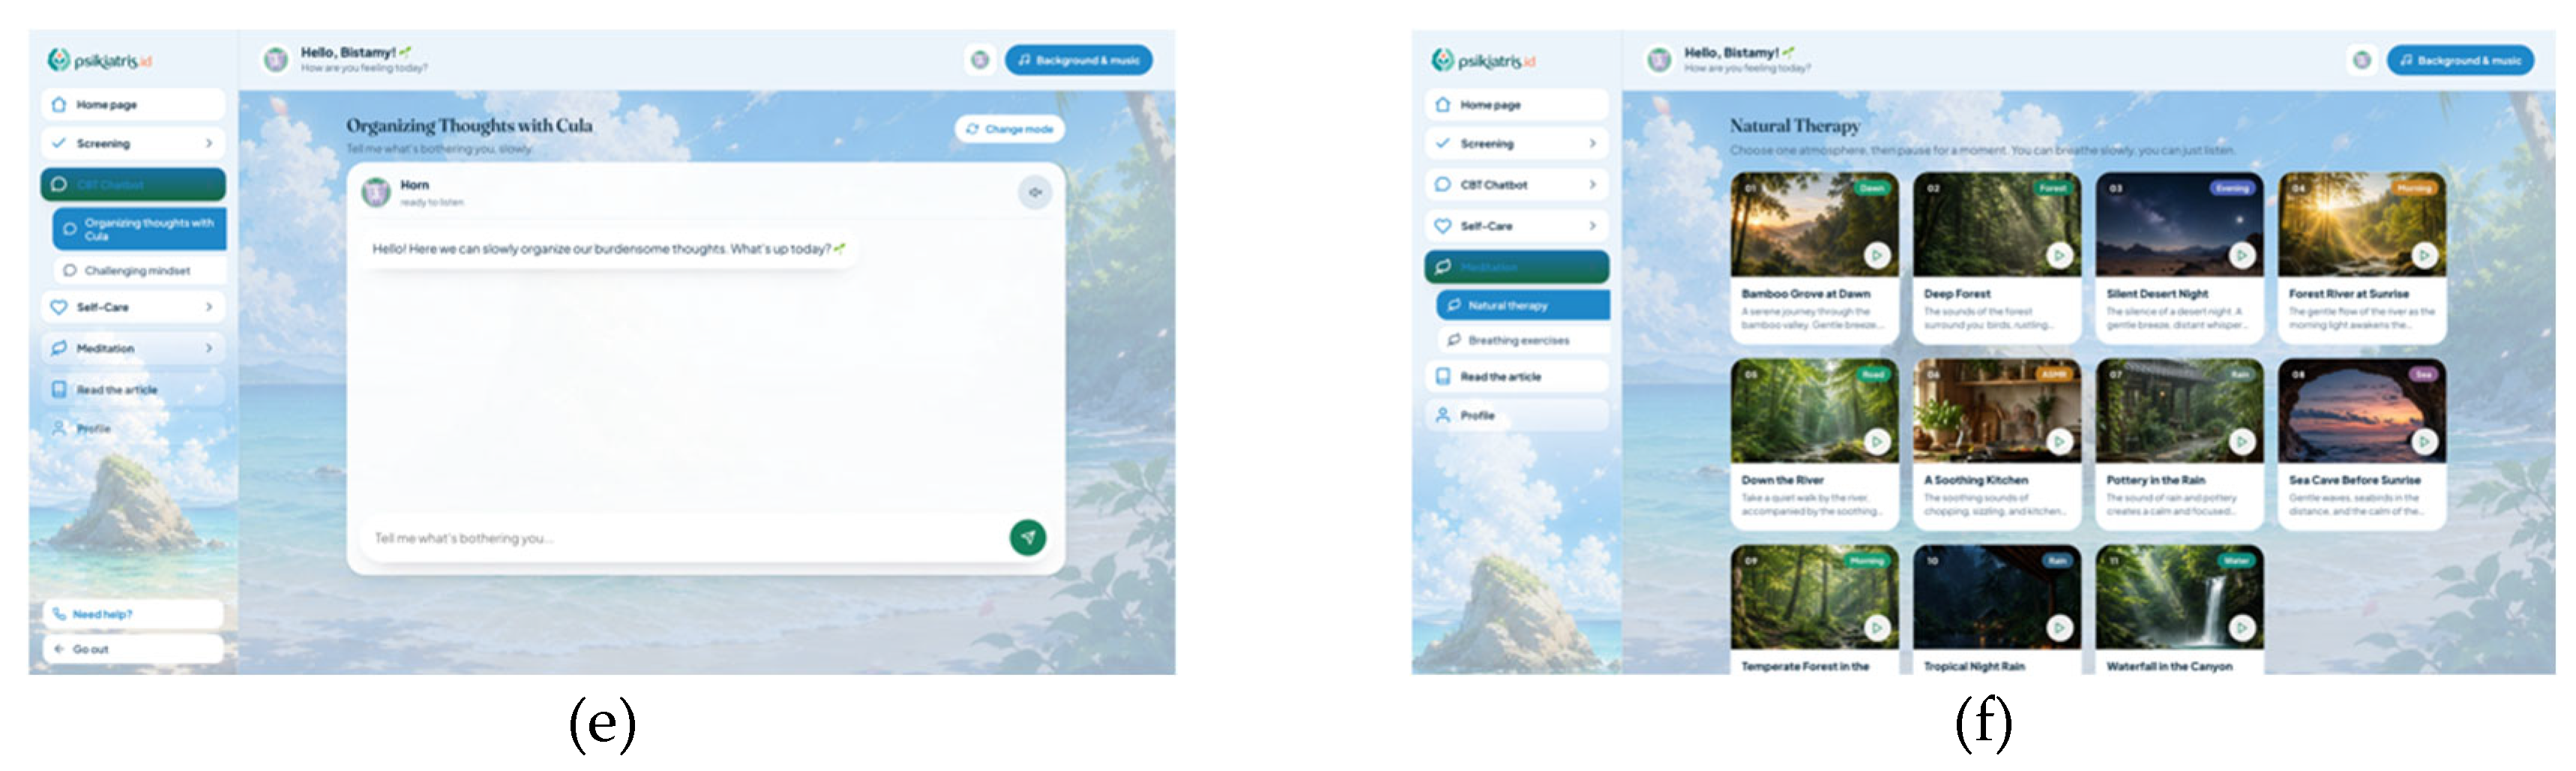
Table 1.
Participants Characteristics.
| Characteristics | Total (n=66) | Without blindness/low vision (n=33) | Blindness/low vision (n=33) | p |
| Age, median [Q1–Q3] | 25 [22,25–32] | 25 [22–30] | 28 [23–33] | 0,724 |
| Male, n (%) | 47 (71,2%) | 24 (72,7%) | 23 (69,7%) | 0,786 |
| Female, n (%) | 19 (28,8%) | 9 (27,3%) | 10 (30,3%) | — |
| Low vision, n (%) | 11 (16,7%) | 0 (0%) | 11 (33,3%) | — |
| Totally blind, n (%) | 22 (33,3%) | 0 (0%) | 22 (66,7%) | — |
Table 2.
System Usability Scale scores of participants with and without blindness/low vision.
| Parameter | Total (n=66) | Without blindness/low vision (n=33) | Blindness/low vision (n=33) | p value |
| SUS, median [Q1–Q3] | 62,50 [55,00–75,00] | 67,50 [55,00–77,50] | 60,00 [57,50–67,50] | 0,143 |
| Cronbach’s α | 0,691 | 0,759 | 0,524 | — |
Table 4.
Joint display of integration of quantitative and qualitative data.
| Quantitative finding | Related qualitative theme/subtheme | Representative qualitative evidence | Integration | Integrated interpretation |
| Overall usability (SUS). Median SUS was 62.50 [55.00–75.00] overall, 60.00 [57.50–67.50] with blindness/low vision, and 67.50 [55.00–77.50] without blindness/low vision. The between-group difference was not statistically significant (P=.143). | Theme 1: Perceived ease of use did not always translate into independent accessibility. | Participants generally described the application as understandable, but visually impaired participants emphasized that independent operation depended on screen-reader compatibility. P05 stated, “If the menus cannot be read by the screen reader, then it is useless.” | Expansion | The nonsignificant difference in SUS did not indicate equivalent accessibility between groups. Qualitative findings revealed barriers to independent use that could not be fully captured by the overall SUS score. |
| Perspicuity. Median scores were 2.50 [1.75–3.00] with blindness/low vision versus 0.75 [0.00–2.25] without blindness/low vision (P=.000249; Holm-adjusted P=.001746). | Subtheme 1.1: Clear instructions and understandable screening supported initial usability; Subthemes 1.2–1.3: assistive-technology compatibility and assisted testing. | Participants frequently considered the instructions easy to understand. P01 stated, “For me, it was easy. The instructions were easy to understand.” However, the same participant noted that the application had not been used independently: “Maybe it was because I wasn’t using it by myself. I was being assisted.” | Confirmation and discordance | The high Perspicuity score was consistent with participants’ perception that the content and instructions were clear. However, clarity did not necessarily imply independent accessibility. Assistance during testing and limitations in screen-reader compatibility may explain why high perceived comprehensibility coexisted with substantial accessibility barriers. |
| Attractiveness. The overall median was 1.67 [0.83–2.46], compared with 1.67 [1.33–2.50] with blindness/low vision and 1.50 [0.00–2.33] without blindness/low vision (P=.091; Holm-adjusted P=.364). | Theme 2: Comprehensiveness was valued but created navigational complexity. | Participants generally responded positively to the application and valued its breadth of functions. P09 described it as “an all-in-one package” in which users did not have to move between separate applications. | Confirmation and expansion | Positive Attractiveness scores were consistent with favorable initial impressions and the perceived value of an integrated platform. Qualitative findings further showed that attractiveness reflected not only appearance but also perceived comprehensiveness and functionality. |
| Efficiency and Dependability. Overall medians were 1.50 [0.25–2.25] and 1.25 [0.50–2.19], respectively. Adjusted between-group differences were not significant (P=.428 and P=.358, respectively). | Theme 2: Comprehensiveness was valued but created navigational complexity; Theme 3: AI lowered barriers to disclosure but conversational friction constrained engagement. | Despite generally positive ratings, participants reported specific technical disruptions. P08 noted that “after about two or three exchanges, the website started loading and I could not continue.” P10 also reported that the voice-based AI required users to wait until the AI had completely finished speaking before responding. | Expansion with localized discordance | Positive average Efficiency and Dependability scores coexisted with feature-specific problems involving loading, conversational turn-taking, device compatibility, navigation, and assistive technologies. Standardized domain scores therefore appeared to mask localized usability failures that became evident during interviews. |
| Stimulation. Median scores were 2.00 [1.25–2.50] with blindness/low vision and 0.75 [0.00–2.50] without blindness/low vision (P=.016; Holm-adjusted P=.099). | Theme 5: Acceptance was high but conditional on accessibility, reliability, and personal relevance. | Participants described curiosity and willingness to continue using the application. P09 stated, “I still have it installed on my phone. I’ll keep using it and see how it develops.” | Confirmation | The qualitative findings supported the relatively favorable Stimulation scores, particularly through expressions of curiosity, perceived usefulness, and willingness to reuse the application. However, continued engagement remained conditional on resolving accessibility and technical barriers. |
| Novelty. The overall median was 0.75 [0.25–1.50], compared with 1.00 [0.25–1.50] with blindness/low vision and 0.50 [0.00–1.50] without blindness/low vision (P=.270; Holm-adjusted P=.428). | Theme 2: Comprehensiveness was valued but created navigational complexity. | Participants particularly valued the integration of multiple mental health functions. P08 stated that screening instruments and other psychiatric functions were available “in one website”, whereas comparable functions were often separated across different platforms. | Confirmation and expansion | Positive Novelty scores were consistent with perceptions that integrating multiple evidence-based mental health functions into one application was distinctive. However, participants did not necessarily perceive every technological component as novel, as some compared the AI interface with existing general-purpose AI systems. |
| No direct SUS/UEQ counterpart. | Theme 3: AI provided a low-pressure space for disclosure but did not replace human support. | P02 explained, “I don’t think I can really talk about things with other people because I’m a very closed person. With this application, I can be more open.” Conversely, P05 stated that talking with AI was acceptable but that talking with a human was preferable. | Expansion | The interviews identified a potential role for AI in reducing interpersonal barriers to disclosure, while simultaneously establishing a clear boundary between AI-mediated support and human or professional interaction. This experience was not directly represented by SUS or UEQ scores. |
| No direct SUS/UEQ counterpart. | Theme 4: Screening and psychological exercises supported self-awareness and immediate relief, but benefits were individualized. | P09 described CBT-related interaction as producing “a sense of relief, like something had been released.” In contrast, P06 described the calming effect as temporary, with distress returning after the exercise ended. P07 also raised concern that users might interpret screening results as self-diagnosis and suggested links to professional care. | Expansion | Qualitative findings extended the standardized usability measures by identifying perceived psychological benefits, substantial individual variation, and the need for appropriate clinical framing and referral pathways. |
Disclaimer/Publisher’s Note: The statements, opinions and data contained in all publications are solely those of the individual author(s) and contributor(s) and not of MDPI and/or the editor(s). MDPI and/or the editor(s) disclaim responsibility for any injury to people or property resulting from any ideas, methods, instructions or products referred to in the content. |
© 2026 by the authors. Licensee MDPI, Basel, Switzerland. This article is an open access article distributed under the terms and conditions of the Creative Commons Attribution (CC BY) license (http://creativecommons.org/licenses/by/4.0/).
Copyright: This open access article is published under a Creative Commons CC BY 4.0 license, which permit the free download, distribution, and reuse, provided that the author and preprint are cited in any reuse.