Preprint
Article

This version is not peer-reviewed.

Distinct Immunological Signatures Characterize Long COVID: A Biomarker-Based Comparative, Multivariable, and Clustering Analysis

Submitted:

14 September 2026

Posted:

15 September 2026

You are already at the latest version

Abstract

Background: Long COVID is clinically heterogeneous; objective biomarkers for diagnosis and biological stratification remain incompletely defined. Methods: We conducted a cross-sectional analysis of 191 de-identified post-COVID participants (158 with long COVID; 33 without sequelae), assessing eight biomarkers. Values below detection limits were imputed as half the assay-specific threshold. Analyses included two-sided Mann–Whitney U tests with Benjamini–Hochberg false-discovery-rate (FDR) correction, logistic regression, receiver operating characteristic analysis with stratified bootstrap confidence intervals (B=1,000), and Ward hierarchical clustering. Results: The long COVID group showed significantly higher IL-6, TNF-α, CXCL9, IP-10, SLAMF1, IL15RA, and IL-18 levels (all FDR q<0.001), whereas IFN-λ3 was not discriminatory (P=0.658). CXCL9 showed the highest single-marker performance (AUC 0.998, 95% confidence interval [CI] 0.989–1.000), followed by IL-6 (AUC 0.991) and IP-10 (AUC 0.973). In the stable multivariable model, higher log10-transformed TNF-α (adjusted odds ratio [aOR] 10.38, 95% CI 1.25–86.36; P=0.030), SLAMF1 (aOR 48.30, 95% CI 4.34–537.16; P=0.002), and IL15RA (aOR 14.45, 95% CI 2.52–82.83; P=0.003) remained independently associated with long COVID, whereas IL-18 was not significant (P=0.207). The model achieved an AUC of 0.995. Clustering identified high-inflammatory and moderate-inflammatory long COVID subtypes (n=79 each). Conclusions: Persistent inflammatory chemokine and cytokine elevation characterizes long COVID, with strong discrimination by CXCL9 and IL-6. Biomarker-defined subtypes support biological heterogeneity and may guide future patient stratification.

Keywords: 
;  ;  ;  ;  ;  

1. Introduction

Post-COVID condition, also called long COVID, is defined by symptoms that usually begin within 3 months after acute coronavirus disease 2019 (COVID-19), persist for at least 2 months, and cannot be explained by an alternative diagnosis [1]. Long COVID remains a substantial public-health problem, and persistent symptom burden has been documented after both mild and severe acute infection [2,3].
Clinical heterogeneity is one of the central challenges in long COVID research. Patients may present with fatigue, cognitive dysfunction, dyspnea, autonomic symptoms, musculoskeletal complaints, or multisystem symptom constellations, which complicates diagnosis, phenotyping, and treatment selection [2,3].
A growing literature suggests that immune dysregulation is one of the most reproducible biological features of long COVID. Earlier longitudinal work showed persistent inflammatory mediator abnormalities and immune-cell perturbations months after infection [4]. Systematic reviews likewise highlight recurrent elevations in inflammatory biomarkers, particularly Interleukin-6 (IL-6) and Tumor Necrosis Factor-alpha (TNF-α), although no single marker has been uniformly accepted across studies [5,6].
Recent mechanistic studies have refined this picture. Deep immunophenotyping linked long COVID to persistent T-cell dysregulation, inflammation, and an uncoordinated adaptive immune response [7], while longer follow-up suggested partial normalization over time in some patients [8]. Multi-omics and proteomic investigations further support clinically relevant biological subgroups and soluble biomarker networks involving inflammatory signaling, immune-cell dysfunction, and tissue-specific manifestations [9,10,11,12].
Against this background, we performed a corrected analysis of a de-identified post-COVID biomarker cohort to compare long COVID with post-COVID patients without sequelae, identify independent biomarker associations, evaluate diagnostic performance, and explore biomarker-defined long COVID subtypes.

2. Materials and Methods

2.1. Study Design and Analytical Dataset

This study was a cross-sectional analysis of the collected data in Kochi Medical University Hospital, Sapporo Medical University Hospital, St. Marianna University Hospital and Aichi Medical University Hospital. We have collected two consecutively cohorts: 158 patients with long COVID and 33 post-COVID individuals without sequelae, for a total analytical sample of 191 participants.
The dataset was de-identified, which did not include age, sex, comorbidities, severity of acute COVID-19, vaccination history, symptom definitions, treatment history, or time from infection to blood sampling. Accordingly, the present manuscript should be interpreted as a biomarker-focused comparison rather than a fully adjusted clinical epidemiology study.

2.2. Biomarkers and Data Handling

The analyzed biomarkers were as follows: interferon-λ3 (IFN-λ3), IL-6, TNF-α, C-X-C motif chemokine ligand 9 (CXCL9) (previously, monokine induced by gamma interferon (MIG)), Interferon gamma-induced protein 10 (IP-10), Signaling lymphocytic activation molecule family member 1 (SLAMF1) (CD150), Interleukin-15 receptor subunit alpha (IL15RA), and Interleukin-18 (IL-18). Concentration-based biomarkers (IFN-λ3, IL-6, TNF-α, CXCL9, IP-10) were analyzed in pg/mL, whereas SLAMF1, IL15RA, and IL-18 were recorded as Normalized Protein Expression (NPX) log2 values.
Numeric strings using decimal commas were standardized to decimal points. Values reported below the lower detection limit (e.g., <3.0, <0.15, and ≦31.3) were imputed as one-half of the corresponding assay-specific threshold (cimputed = LOD/2). After this preprocessing step, no biomarker values were missing in either cohort.

2.3. Statistical Analysis

Because several biomarkers showed right-skewed distributions and left-censoring at assay thresholds, between-group comparisons used two-sided Mann–Whitney U tests with a significance threshold of α=0.05. Effect size was summarized by the rank-biserial correlation (rrb = 1 − (2U)/(n1×n2)), ranging from −1 to +1. False-discovery-rate (FDR) correction across the eight biomarkers used the Benjamini–Hochberg procedure (q < 0.05).
For multivariable logistic regression modeling, the outcome was defined as binary (long COVID = 1, no sequelae = 0). TNF-α was log10-transformed prior to analysis (TNF-α* = log10(TNF-α + ε)) because of strong right skew. All continuous predictors were standardized (z-scores) so that odds ratios represented a 1-standard-deviation increment. IL-6 and CXCL9 showed near-complete separation between groups and were excluded from the multivariable model to avoid quasi-complete separation and infinite maximum-likelihood estimates. The final model included TNF-α*, SLAMF1, IL15RA, and IL-18. Results are expressed as adjusted odds ratios (aOR) with 95% confidence intervals (CI) and two-sided P values.
Diagnostic performance was quantified using receiver operating characteristic (ROC) analysis. Area under the curve (AUC) confidence intervals were estimated by stratified bootstrap resampling (B=1,000 iterations). The optimal operating point was determined using Youden’s index (J = sensitivity + specificity − 1).
Within the long COVID cohort (n=158), unsupervised Ward hierarchical clustering (Euclidean distance) was performed on standardized biomarker values after log10 transformation of concentration markers with substantial skew. IFN-λ3 was excluded from clustering because it had near-zero variance due to floor effects. A two-cluster solution (k=2) was retained for manuscript reporting based on interpretability.

3. Results

3.1 Study Population and Biomarker Completeness

The corrected analytical dataset comprised 191 participants, including 158 patients with long COVID and 33 post-COVID individuals without sequelae. After preprocessing of decimal separators and below-limit values, all eight biomarkers were complete in both cohorts. IFN-λ3 displayed a pronounced floor effect: 157 of 158 long COVID samples and all 33 control samples were recorded below the assay threshold. Biomarker distributions across the two groups are summarized in Figure 1.
Box-and-jitter plots showing the distributions of seven biomarkers in the long COVID group (n=158; salmon) and the no-sequelae group (n=33; blue). Concentration-based biomarkers (IL-6, TNF-α, CXCL9, and IP-10; pg/mL) are displayed on a log10 scale; SLAMF1, IL15RA, and IL-18 are presented as NPX (log2) values. Boxes denote the median and interquartile range (IQR); whiskers extend to 1.5 × IQR; individual data points are overlaid as jittered dots. P values were derived from two-sided Mann–Whitney U tests, and q values are Benjamini–Hochberg FDR-adjusted P values across the eight measured biomarkers. IFN-λ3 is not shown because of a pronounced floor effect (157/158 long COVID samples and 33/33 no-sequelae samples were below the lower limit of detection).
Abbreviations: CXCL9, C-X-C motif chemokine ligand 9; FDR, false discovery rate; IFN, interferon; IL, interleukin; IL15RA, interleukin-15 receptor subunit alpha; IP-10, interferon gamma-induced protein 10; IQR, interquartile range; NPX, Normalized Protein Expression; SLAMF1, signaling lymphocyte activation molecule family member 1; TNF, tumor necrosis factor.

3.2. Univariate Biomarker Comparison

Compared with the no-sequelae group, the long COVID group showed significantly higher IL-6, TNF-α, CXCL9, IP-10, SLAMF1, IL15RA, and IL-18 levels, and all seven associations remained significant after FDR correction (Figure 1, Table 1). The most pronounced between-group differences were observed for CXCL9 (median 106.00 [IQR 65.90–151.00] vs 19.00 [15.00–22.00] pg/mL; FDR q=2.86×10⁻¹⁸; rrb=0.987), IL-6 (2.00 [1.40–4.25] vs 0.20 [0.20–0.40] pg/mL; FDR q=2.86×10⁻¹⁸; rrb=0.983), and IP-10 (118.00 [92.22–152.75] vs 44.00 [34.00–67.00] pg/mL; FDR q=3.69×10⁻¹⁷; rrb=0.946). IFN-λ3 was not discriminatory (p=0.658).

3.3. Multivariable Logistic Regression

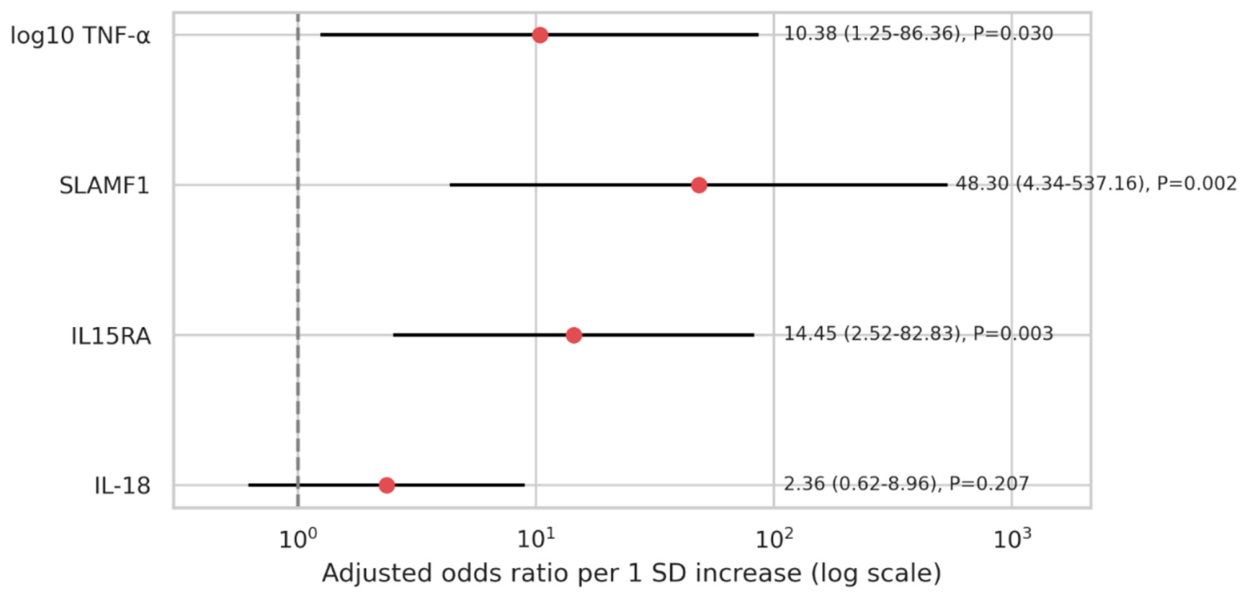
Because IL-6 and CXCL9 showed near-complete separation between groups, stable multivariable modeling was restricted to overlapping biomarkers (TNF-α, SLAMF1, IL15RA, IL-18). In the final logistic regression model (Figure 2, Table 2), higher log10-transformed TNF-α (aOR 10.38, 95% CI 1.25–86.36; P=0.030), SLAMF1 (aOR 48.30, 95% CI 4.34–537.16; P=0.002), and IL15RA (aOR 14.45, 95% CI 2.52–82.83; P=0.003) were independently associated with long COVID. IL-18 was included in the model but did not reach statistical significance (aOR 2.36, 95% CI 0.62–8.96; P=0.207).
Forest plot of adjusted odds ratios (aORs; red dots) with 95% confidence intervals (horizontal lines) from the stable multivariable logistic regression model. TNF-α was log10-transformed before analysis, and all continuous predictors were standardized (z-scores); thus, aORs represent the change in odds per 1-standard-deviation (SD) increase. IL-6 and CXCL9 were excluded from the model because of quasi-complete separation between groups. The vertical dashed line indicates aOR = 1 (no association), and the x-axis is displayed on a log scale. Abbreviations: aOR, adjusted odds ratio; CI, confidence interval; IL, interleukin; IL15RA, interleukin-15 receptor subunit alpha; SD, standard deviation; SLAMF1, signaling lymphocyte activation molecule family member 1; TNF, tumor necrosis factor.
TNF-α was log10-transformed prior to analysis to address right skew. All continuous predictors were standardized to z-scores; aORs therefore represent the change in odds of long COVID per 1-SD increment in each predictor. IL-6 and CXCL9 were excluded from the multivariable model owing to near-complete group separation, which causes maximum-likelihood estimates to diverge (quasi-complete separation). * P<0.05; ** P<0.01; ns, not significant (P≥0.05). Abbreviations: aOR, adjusted odds ratio; CI, confidence interval; CXCL9, C-X-C motif chemokine ligand 9; IL, interleukin; IL15RA, interleukin-15 receptor subunit alpha; SD, standard deviation; SLAMF1, signaling lymphocyte activation molecule family member 1; TNF, tumor necrosis factor.

3.4. Diagnostic Performance

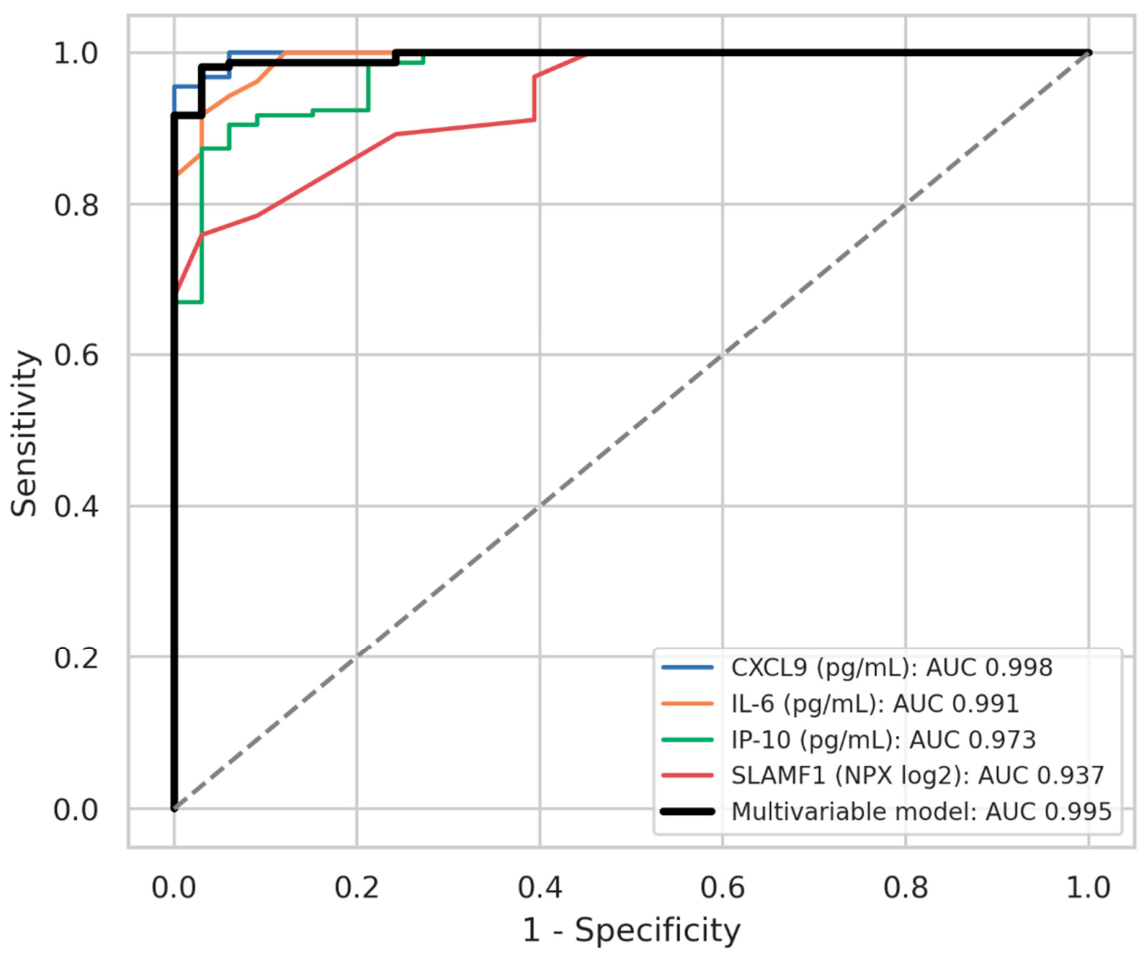
ROC analysis showed excellent discrimination for several single biomarkers (Table 3, Figure 3). CXCL9 showed the highest single-marker performance (AUC 0.998, 95% CI 0.989–1.000), followed by IL-6 (AUC 0.991, 95% CI 0.978–0.999) and IP-10 (AUC 0.973, 95% CI 0.948–0.993). The stable multivariable model achieved an AUC of 0.995 (95% CI 0.983–0.999), with 96.8% sensitivity and 97.0% specificity at the Youden-optimal cutoff. This model did not materially outperform CXCL9 alone, suggesting that CXCL9 is a particularly strong candidate discriminator in this cohort.

3.5. Long COVID Subtype Analysis

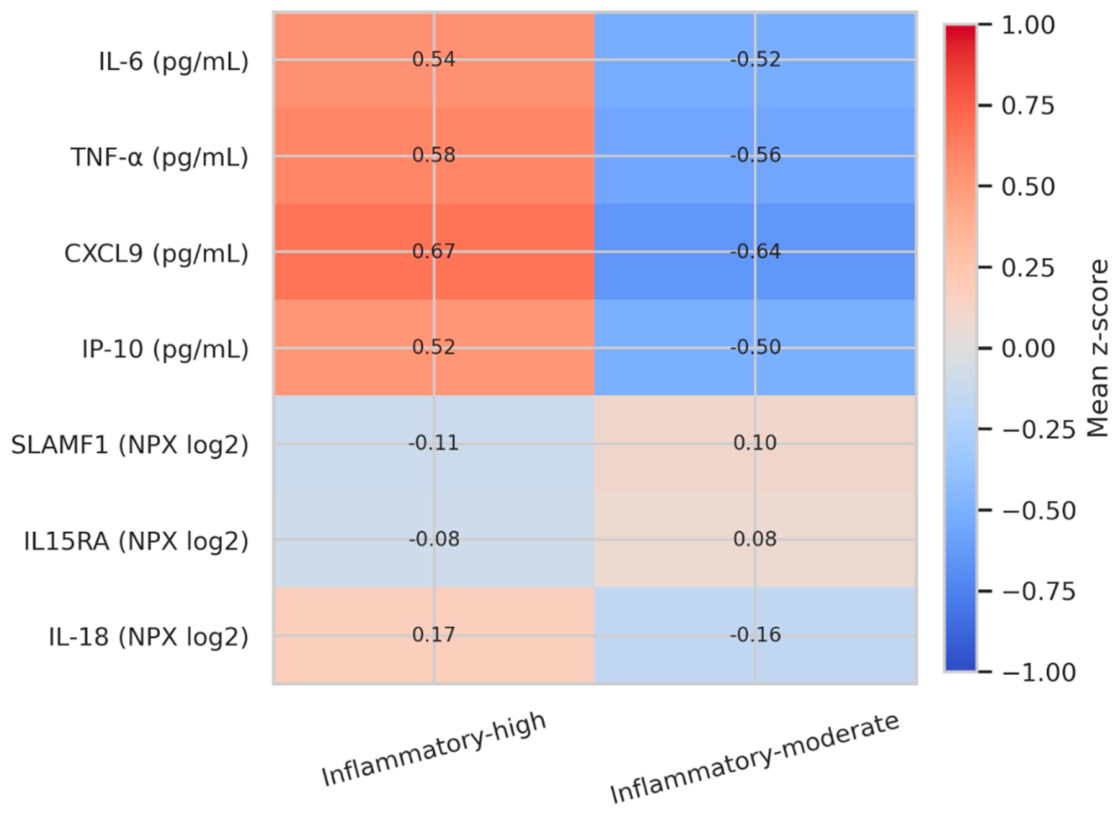
Unsupervised hierarchical clustering within the long COVID cohort identified two equally sized subtypes (n=79 each), designated here as high-inflammatory and moderate-inflammatory clusters (Table 4, Figure 4). The high-inflammatory cluster showed substantially higher CXCL9, TNF-α, IL-6, and IP-10 levels than the moderate-inflammatory cluster (all FDR q ≤ 1.12×10⁻⁸). By contrast, IL15RA, IL-18, and SLAMF1 were not significantly different after FDR correction. These findings indicate that intra-long-COVID heterogeneity in this dataset was driven primarily by inflammatory chemokine and cytokine intensity.

4. Discussion

In this corrected cohort analysis, long COVID was characterized by a reproducible biomarker pattern involving elevated inflammatory cytokines, interferon-related chemokines, and immune-activation markers. The strongest between-group signals were observed for CXCL9, IL-6, and IP-10, whereas IFN-λ3 did not separate long COVID from post-COVID participants without sequelae.
The combination of elevated IL-6 and TNF-α supports the concept of persistent low-grade inflammation in long COVID, which has been repeatedly proposed as one of the biological substrates of chronic fatigue, malaise, and multisystem symptoms [4,5,6,7,8]. At the same time, the very strong elevation of CXCL9 and IP-10 is consistent with sustained interferon-related chemokine activity, suggesting persistent immune stimulation even after resolution of the acute infection [7,9,10,11,12].
The near-perfect discrimination of CXCL9 in this cohort (AUC 0.998) warrants dedicated mechanistic consideration. CXCL9 is a canonical IFN-γ–inducible chemokine secreted by activated macrophages, endothelial cells, and fibroblasts, and it recruits CXCR3⁺ effector CD4⁺ and CD8⁺ T cells, natural killer cells, and activated monocytes to sites of chronic type-1 immune activation [13,14]. Direct evidence for CXCL9 persistence in long COVID comes from the longitudinal proteomic work of Talla et al., who identified an inflammatory PASC subcluster in which CXCL9, together with CXCL10 and CXCL11, remained elevated for more than 250 days after acute infection, alongside sustained IFN-γ and TNF signaling [15]. Our cross-sectional findings — a highly elevated CXCL9 signal, a coordinated IP-10 elevation, and clustering-defined inflammatory subgroups — are directionally consistent with this longitudinal signature and suggest that a substantial proportion of the long COVID population studied here occupies an interferon-driven inflammatory state rather than a resolving post-acute trajectory. Beyond a persistence marker, CXCL9 has also been mechanistically implicated in post-COVID end-organ pathology: Quiroga et al. recently reported that serum CXCL9 (together with CXCL10) is selectively elevated in individuals with persistent post-COVID pulmonary sequelae defined by both structural (CT) and functional (DLCO) impairment, positioning CXCL9 as a candidate mediator, not merely a bystander, of tissue-level long COVID pathology [16]. Convergent evidence from acute COVID-19 further supports CXCL9 as a prognostic node linking endothelial dysfunction and dysregulated lymphocyte responses to inflammatory severity [17], and post-acute cohorts with prior severe COVID-19 show a prolonged vascular-injury pattern in which CXCL9 and CXCL10 remain among the most persistently elevated plasma proteins [17,18]. An additional interpretive layer is provided by inflammaging biology: CXCL9 has recently been identified as one of the top-ranked molecular constituents of biological immune age, being progressively elevated with chronological aging, mechanistically linked to endothelial dysfunction, and associated with declining muscle strength and mortality in older adults [19,20,21]. In the context of long COVID, the strong CXCL9 signal observed here may therefore reflect not only IFN-γ–driven immune activation but also a superimposed inflammaging-like state. Emerging data on anti-chemokine autoantibodies, including anti-CXCL9 responses that inversely correlate with post-acute symptom trajectories, further suggest that the CXCL9 axis is actively engaged, and not incidentally elevated, in long COVID [22]. Whether CXCL9 elevation is pathogenic, or predominantly a downstream reporter of unresolved antigenic or interferon signaling remains an important mechanistic question that longitudinal and interventional studies should address.
The strong IL-6 elevation observed here (AUC 0.991) is consistent with, and extends, a converging body of evidence positioning IL-6 as one of the most reproducible soluble biomarkers of long COVID. In a systematic review and meta-analysis of 22 eligible studies, Yin et al. reported a pooled mean IL-6 concentration of 20.92 pg/mL (95% CI 9.30–32.54) in long COVID patients and concluded that elevated IL-6 is significantly and reproducibly associated with the condition across heterogeneous cohorts and assay platforms [23]. Subsequent reviews have reinforced IL-6 as a central node of the persistent inflammatory network in post-acute SARS-CoV-2 sequelae [5,6,24,25]. Mechanistically, IL-6 is a pleiotropic cytokine engaging both classic and trans-signaling pathways; in the post-viral setting, sustained IL-6 activity has been linked to endothelial activation, hepatic acute-phase reprogramming, and neuroinflammatory signaling that contributes to fatigue, cognitive impairment, and mood disturbance [24,26,27]. The concurrent elevation of IL-6 and TNF-α in our cohort is consistent with a monocyte- and macrophage-driven low-grade inflammatory state, which has also been described in extracellular-vesicle–mediated propagation of post-acute inflammation and in longitudinal biomarker profiling two years after severe acute COVID-19 [28,29]. However, the long COVID IL-6 literature is not uniformly concordant: some carefully controlled studies have failed to detect significant IL-6 elevation in well-characterized long COVID cohorts [30], and scoping reviews note that IL-6 tends to be more consistently elevated in the acute and early-convalescent phases than at later post-acute time points [25]. These discrepancies likely reflect heterogeneity in assay sensitivity (particularly for low-abundance basal IL-6), sampling time from infection, comorbidity structure, and — critically — case definitions that variably enrich for inflammation-dominant subphenotypes. The very strong IL-6 signal observed in our data should therefore be interpreted as evidence that this cohort captured an inflammation-predominant slice of the long COVID spectrum, an interpretation directly supported by our clustering analysis, which resolved an equally sized high-inflammatory subtype distinguished primarily by IL-6, TNF-α, CXCL9, and IP-10 intensity. From a translational standpoint, this positions IL-6 not only as a diagnostic biomarker candidate but also as a plausible therapeutic node: IL-6-pathway blockade (e.g., tocilizumab, sarilumab) is being actively evaluated for biomarker-selected post-acute cytokine phenotypes [24], and our data reinforce the rationale for restricting such trials to IL-6-high, biomarker-defined long COVID subgroups.
Among the single markers, CXCL9 showed near-perfect discrimination in this cohort (AUC 0.998). The fact that the multivariable model (AUC 0.995) did not materially outperform CXCL9 alone is clinically important: if replicated externally, parsimonious biomarker strategies may prove sufficient for case enrichment or research stratification. However, the present data should not yet be interpreted as establishing a stand-alone clinical diagnostic test.
The multivariable model further suggested that TNF-α, SLAMF1, and IL15RA remain independently associated with long COVID after restricting analysis to biomarkers with sufficient overlap between groups. SLAMF1 and IL15RA may reflect persistent cellular immune activation involving T-cell and natural killer cell biology, complementing the chemokine-based signal captured by CXCL9 and IP-10. SLAMF1 (CD150), a homophilic member of the signaling lymphocyte activation molecule family, is broadly expressed on activated T cells, B cells, NK cells, and myeloid populations, where it modulates T-cell receptor signaling, Th1/Th2 balance, and cytokine production upon sustained immune activation [31,32,33]. IL15RA, the high-affinity α-chain of the IL-15 receptor, is trans-presented by macrophages and dendritic cells and is essential for the homeostatic maintenance and effector function of memory CD8⁺ T cells and NK cells during chronic antigenic or inflammatory stimulation [34,35]. Their coordinated elevation in our long COVID cohort is therefore biologically consistent with persistent T-cell and NK-cell activation — a cellular immune signature directly complementary to the IFN-γ–driven, CXCR3-dependent chemotactic milieu captured by CXCL9 and IP-10 [13,14,15,25]— and consistent with deep-immunophenotyping evidence that long COVID involves sustained T-cell dysregulation and an uncoordinated adaptive immune response [7]. An additional methodological implication is that IL-6 and CXCL9 showed such strong between-group separation that they could not be stably incorporated into a conventional multivariable logistic model. This does not weaken their biological relevance; rather, it indicates that their discriminatory signal in this dataset was so strong that regression-based estimation of independent effects became unstable.
The cluster analysis extends the group-comparison results by showing that long COVID is not biomarker-homogeneous. Two equally sized subtypes emerged, principally separated by IL-6, TNF-α, CXCL9, and IP-10 intensity. This result is directionally consistent with recent multi-omics and mechanistic studies proposing biologically distinct long COVID subgroups rather than a single unified syndrome [9,10,11,12]. Importantly, however, the identified clusters should not yet be regarded as definitive clinical subphenotypes. In this dataset, clustering primarily reflected differences in inflammatory signal intensity, and it remains uncertain whether these groups correspond to differences in symptom patterns, functional impairment, prognosis, or treatment responsiveness.
The behavior of IFN-λ3 deserves separate comment. Nearly all values were recorded below the assay threshold, meaning that the lack of group discrimination should not be overinterpreted as evidence that IFN-λ3 biology is irrelevant in long COVID. Rather, within the constraints of this assay and dataset, IFN-λ3 could not be meaningfully resolved. Because the present analysis compared individuals with and without long COVID after the acute phase, the observed biomarker differences should not be interpreted as demonstrating causality. Elevated cytokine and chemokine levels may contribute to symptom persistence, but they may also reflect downstream consequences of ongoing physiological stress, altered immune set points after SARS-CoV-2 infection, or unmeasured host factors predisposing certain individuals to sustained immune activation.
From a translational perspective, these biomarkers may be more immediately useful for research stratification than for routine diagnosis. A compact panel centered on CXCL9, with or without selected complementary immune-activation markers, could help enrich biologically defined long COVID populations for mechanistic studies or interventional trials. Given the position of CXCL9 as both an IFN-γ–driven chemokine and a core molecular constituent of inflammaging [19], and given emerging evidence that IL-6-pathway inhibitors are being evaluated in biomarker-selected post-acute cytokine phenotypes [24], a CXCL9-anchored panel may serve not only as a diagnostic enrichment tool but also as a stratification instrument for interventional trials targeting the IL-6 axis, JAK–STAT signaling, or IFN-γ–driven chemokine pathways. Specifically, our clustering results suggest that IL-6-high, CXCL9-high long COVID subgroups may represent the most biologically plausible candidates for enrollment in anti-IL-6 or anti-cytokine therapeutic trials, whereas moderate-inflammatory subgroups may require alternative mechanistic targeting. External validation in independent cohorts will be essential before these findings can be translated into broader clinical use.

4.1. Limitations

This study has several limitations. First, it was a secondary analysis of a de-identified biomarker worksheet and lacked key clinical covariates, including age, sex, comorbidity burden, acute COVID-19 severity, treatment history, vaccination status, symptom duration, and time from infection to sampling. Residual confounding therefore cannot be addressed.
Second, the no-sequelae group was substantially smaller than the long COVID group (33 vs 158), and the dataset represented a single cohort without external validation. Consequently, diagnostic performance estimates may be optimistic and should be interpreted as internal discovery results.
Third, several biomarkers exhibited very strong group separation, which improved single-marker discrimination but constrained multivariable inference because of quasi-complete separation. The stable multivariable model should therefore be regarded as a pragmatic reduced model rather than a definitive etiologic model.
Fourth, values below the lower detection limit were handled by one-half-threshold substitution. Although this is a standard and transparent approach for small biomarker studies, alternative censoring-aware models could be considered in future analyses.
Finally, the present study was cross-sectional and cannot determine whether the observed biomarker profile is causal, consequential, or merely correlative with long COVID symptom persistence.

5. Conclusions

This corrected analysis of 191 post-COVID participants supports a long COVID biomarker profile characterized by elevated IL-6, TNF-α, CXCL9, IP-10, SLAMF1, IL15RA, and IL-18, with especially strong discrimination by CXCL9 and IL-6. The identification of high-inflammatory and moderate-inflammatory long COVID subtypes further supports biological heterogeneity and underscores the need for externally validated biomarker-guided stratification strategies.

Author Contributions

Conceptualization: YY and HM; Methodology: YY, ST, HK, and HM; Investigation: YY, ST, HK, and HM; Data curation: YY and HM; Writing—original draft preparation: YY; Writing—review and editing: YY, and HM; Project administration: YY and HM; Supervision: ST, HK, and HM.

Funding

This research was supported by the 40th Anniversary Commemorative Disease-Specific Research Grant for Fiscal Years 2021 and 2022 from the Public Interest Incorporated Foundation Kenzo Suzuki Memorial Foundation for Medical Science Research.

Institutional Review Board Statement

This study was conducted in accordance with the Declaration of Helsinki and approved by the Ethics Committee of Aichi Medical University (protocol code 2021-095, approved on Oct 6th, 2021).

Data Availability Statement

The data presented in this study are available on request from the corresponding author due to privacy and ethical restrictions concerning patient information.

Acknowledgments

The authors thank the staff of Aichi Medical University Hospital, Kochi Medical University Hospital, Sapporo Medical University Hospital and St. Marianna University Hospital for their assistance in specimen collection and laboratory coordination.

Conflicts of Interest

The authors declare no conflicts of interest.

References

  1. Soriano, J.B.; Murthy, S.; Marshall, J.C.; Relan, P.; Diaz, J.V.; WHO Clinical Case Definition Working Group on Post-COVID-19 Condition. A clinical case definition of post-COVID-19 condition by a Delphi consensus. Lancet Infect Dis 2022, 22, e102–e107. [CrossRef]
  2. Sudre, C.H.; Murray, B.; Varsavsky, T.; Graham, M.S.; Penfold, R.S.; Bowyer, R.C.; Pujol, J.C.; Klaser, K.; Antonelli, M.; Canas, L.S.; et al. Attributes and predictors of long COVID. Nat Med 2021, 27, 626–631. [CrossRef]
  3. Xie, Y.; Bowe, B.; Al-Aly, Z. Burdens of post-acute sequelae of COVID-19 by severity of acute infection, demographics and health status. Nat Commun 2021, 12, 6571. [CrossRef]
  4. Phetsouphanh, C.; Darley, D.R.; Wilson, D.B.; Howe, A.; Munier, C.M.L.; Patel, S.K.; Juno, J.A.; Burrell, L.M.; Kent, S.J.; Dore, G.J.; et al. Immunological dysfunction persists for 8 months following initial mild-to-moderate SARS-CoV-2 infection. Nat Immunol 2022, 23, 210–216. [CrossRef]
  5. Lai, Y.J.; Liu, S.H.; Manachevakul, S.; Lee, T.A.; Kuo, C.T.; Bello, D. Biomarkers in long COVID-19: a systematic review. Front Med (Lausanne) 2023, 10, 1085988. [CrossRef]
  6. Thomas, C.; Faghy, M.A.; Chidley, C.; Phillips, B.E.; Bewick, T.; Ashton, R.E. Blood biomarkers of long COVID: a systematic review. Mol Diagn Ther 2024, 28, 537–574. [CrossRef]
  7. Yin, K.; Peluso, M.J.; Luo, X.; Thomas, R.; Shin, M.G.; Neidleman, J.; Andrew, A.; Young, K.C.; Ma, T.; Hoh, R.; et al. Long COVID manifests with T cell dysregulation, inflammation and an uncoordinated adaptive immune response to SARS-CoV-2. Nat Immunol 2024, 25, 218–225. [CrossRef]
  8. Phetsouphanh, C.; Jacka, B.; Ballouz, S.; Jackson, K.J.L.; Wilson, D.B.; Manandhar, B.; Klemm, V.; Tan, H.X.; Wheatley, A.; Aggarwal, A.; et al. Improvement of immune dysregulation in individuals with long COVID at 24-months following SARS-CoV-2 infection. Nat Commun 2024, 15, 3315. [CrossRef]
  9. Ai, J.; Guo, J.; Lin, K.; Cai, J.; Zhang, H.; Zhu, F.; Sun, G.; Xue, Q.; Zhu, K.; Yang, Y.; et al. Integrated multi-omics characterization across clinically relevant subgroups of long COVID. Natl Sci Rev 2024, 12, nwae410. [CrossRef]
  10. Gao, Y.; Cai, C.; Adamo, S.; Biteus, E.; Kamal, H.; Dager, L.; Miners, K.L.; Llewellyn-Lacey, S.; Ladell, K.; Amratia, P.S.; et al. Identification of soluble biomarkers that associate with distinct manifestations of long COVID. Nat Immunol 2025, 26, 692–705. [CrossRef]
  11. Aid, M.; Boero-Teyssier, V.; McMahan, K.; Dang, R.; Doyle, M.; Belabbaci, N.; Borducchi, E.; Collier, A.Y.; Mullington, J.; Barouch, D.H. Long COVID involves activation of proinflammatory and immune exhaustion pathways. Nat Immunol 2026, 27, 61–71. [CrossRef]
  12. Kumar, S.; Li, C.; Zhou, L.; Zhan, Q.; Alaswad, A.; Volland, S.; Costa, B.; Krooss, S.A.; Klefenz, I.; Schmaus, H.; et al. A distinct monocyte transcriptional state links systemic immune dysregulation to pulmonary impairment in long COVID. Nat Immunol 2026, 27, 200–212. [CrossRef]
  13. Olivarria G, Lane TE. Evaluating the role of chemokines and chemokine receptors involved in coronavirus infection. Expert Rev Clin Immunol. 2022, 18, 57–66. [CrossRef]
  14. Wolszczak-Biedrzycka, B.; Cieślikiewicz, B.; Studniarz, F.; Dąbrowski, Ł.; Fąs, M.; Matyszkiewicz-Suchodolska, K.; Harasimowicz, M.; Dorf, J. Chemokines as potential biomarkers for predicting the course of COVID-19—a review of the literature. Front Immunol 2025, 16, 1662643. [CrossRef]
  15. Talla, A.; Vasaikar, S.V.; Szeto, G.L.; Lemos, M.P.; Czartoski, J.L.; MacMillan, H.; Moodie, Z.; Cohen, K.W.; Fleming, L.B.; Thomson, Z.; et al. Persistent serum protein signatures define an inflammatory subcategory of long COVID. Nat Commun 2023, 14, 3417. [CrossRef]
  16. Quiroga, R.; Sanhueza, S.; Sepúlveda, C.; Antilef, B.; Muñoz, C.; Cabrera, C.; Fraga, M.; Llerena, F.; Lamperti, L.; Barría, M.I.; et al. CXCL9 and CXCL10 support the exacerbated humoral response in recovered COVID-19 patients who developed acute respiratory distress syndrome by promoting plasma cell differentiation, whereas CXCL9 also induces CD40L and CXCR3 upregulation on T helper cells. Front Immunol 2025, 16, 1684704. [CrossRef]
  17. Ruhl, L.; Pink, I.; Kühne, J.F.; Beushausen, K.; Keil, J.; Christoph, S.; Sauer, A.; Boblitz, L.; Schmidt, J.; David, S.; et al. Endothelial dysfunction contributes to severe COVID-19 in combination with dysregulated lymphocyte responses and cytokine networks. Signal Transduct Target Ther 2021, 6, 418. [CrossRef]
  18. Ruhl, L.; Pink, I.; Chichelnitskiy, E.; Drick, N.; Sauer, A.; Boblitz, L.; Beushausen, K.; Keil, J.; Ullrich, A.L.; Schmidt, J.; et al. Post-acute sequelae patients with severe COVID-19 history show a prolonged inflammatory, vascular injury pattern. Eur J Immunol 2026, 56, e70169. [CrossRef]
  19. Wu, F.; Mu, W.C.; Markov, N.T.; Fuentealba, M.; Halaweh, H.; Senchyna, F.; Manwaring-Mueller, M.N.; Winer, D.A.; Furman, D. Immunological biomarkers of aging. J Immunol 2025, 214, 889–902. [CrossRef]
  20. Singh, A.; Schurman, S.H.; Bektas, A.; Kaileh, M.; Roy, R.; Wilson, D.M.; Sen, R.; Ferrucci, L. Aging and inflammation. Cold Spring Harb Perspect Med 2024, 14, a041197. [CrossRef]
  21. Seo, D.H.; Corr, M.; Patel, S.; Lui, L.Y.; Cauley, J.A.; Evans, D.; Mau, T.; Lane, N.E. Chemokine CXCL9, a marker of inflammaging, is associated with changes of muscle strength and mortality in older men. Osteoporos Int 2024, 35, 1789–1796. [CrossRef]
  22. Muri, J.; Cecchinato, V.; Cavalli, A.; Shanbhag, A.A.; Matkovic, M.; Biggiogero, M.; Maida, P.A.; Moritz, J.; Toscano, C.; Ghovehoud, E.; et al. Autoantibodies against chemokines post-SARS-CoV-2 infection correlate with disease course. Nat Immunol 2023, 24, 604–611. [CrossRef]
  23. Yin, J.X.; Agbana, Y.L.; Sun, Z.S.; Fei, S.W.; Zhao, H.Q.; Zhou, X.N.; Chen, J.H.; Kassegne, K. Increased interleukin-6 is associated with long COVID-19: a systematic review and meta-analysis. Infect Dis Poverty 2023, 12, 43. [CrossRef]
  24. Obeagu, E.I. Taming the cytokine storm: therapeutic strategies for post-acute sequelae of SARS-CoV-2 infection. Health Sci Rep 2026, 9, e72174. [CrossRef]
  25. Espín, E.; Yang, C.; Shannon, C.P.; Assadian, S.; He, D.; Tebbutt, S.J. Cellular and molecular biomarkers of long COVID: a scoping review. EBiomedicine 2023, 91, 104552. [CrossRef]
  26. Hein, Z.M.; Thazin, K.S.; Kumar, S.; Che Ramli, M.D.; Che Mohd Nassir, C.M.N. Immunomodulatory mechanisms underlying neurological manifestations in long COVID: implications for immune-mediated neurodegeneration. Int J Mol Sci 2025, 26, 6214. [CrossRef]
  27. Abbas, U.; Laghari, R.N.; Ahmed, I.; Musawwir, U.A.; Riaz, H.; Anwar, K.; Hussain, N.; Mubeen, M.; Khan, M.; Khalid, M.U.; et al. Acute SARS-CoV-2 viral load and systemic inflammation are associated with neuropsychiatric and musculoskeletal symptoms in long COVID. PLoS One 2026, 21, e0346978. [CrossRef]
  28. Bachiller, S.; Vitallé, J.; Camprubí-Ferrer, L.; García, M.; Gallego, I.; López-García, M.; Galvá, M.I.; Cañizares, J.; Rivas-Jeremías, I.; Díaz-Mateos, M.; et al. SARS-CoV-2 post-acute sequelae linked to inflammation via extracellular vesicles. Front Immunol 2025, 16, 1501666. [CrossRef]
  29. Maciel, A.B.S.; Pinto, A.S.; Maia Silva, B.; Goulart, C.L.; Silva, L.F.A.; Chaves, A.S.; Mouta, G.S.; Sato, C.M.S.; Valente, J.; Mwangi, V.I.; et al. Inflammatory discoveries two years after acute severe COVID-19: a longitudinal biomarker profile assessment in long COVID individuals in the Brazilian Amazon. Front Immunol 2024, 15, 1520193. [CrossRef]
  30. Omdal, R.; Lenning, O.B.; Jonsson, G.; Kvaløy, J.T.; Di Molfetta, G.; Tan, K.; Benedet, A.L.; Ashton, N.J.; Braut, G.S.; Zetterberg, H.; et al. Long-COVID: assessment of circulating markers suggests no cerebral neuronal damage, neuroinflammation or systemic inflammation—a controlled study. Sci Rep 2026, 16, 11856. [CrossRef]
  31. Detre, C.; Keszei, M.; Romero, X.; Tsokos, G.C.; Terhorst, C. SLAM family receptors and the SLAM-associated protein (SAP) modulate T cell functions. Semin Immunopathol 2010, 32, 157–171. [CrossRef]
  32. Yigit, B.; Wang, N.; Herzog, R.W.; Terhorst, C. SLAMF receptors: immune regulators in health and disease. Clin Immunol 2018, 204, 3–13. [CrossRef]
  33. Farhangnia, P.; Ghomi, S.M.; Mollazadehghomi, S.; Nickho, H.; Akbarpour, M.; Delbandi, A.A. SLAM-family receptors come of age as a potential molecular target in cancer immunotherapy. Front Immunol 2023, 14, 1174138. [CrossRef]
  34. Mortier, E.; Advincula, R.; Kim, L.; Chmura, S.; Barrera, J.; Reizis, B.; Malynn, B.A.; Ma, A. Macrophage- and dendritic-cell-derived interleukin-15 receptor alpha supports homeostasis of distinct CD8+ T cell subsets. Immunity 2009, 31, 811–822. [CrossRef]
  35. Guo, Y.; Luan, L.; Patil, N.K.; Wang, J.; Bohannon, J.K.; Rabacal, W.; Fensterheim, B.A.; Hernandez, A.; Sherwood, E.R. IL-15 enables septic shock by maintaining NK cell integrity and function. J Immunol 2017, 198, 1320–1333. [CrossRef]
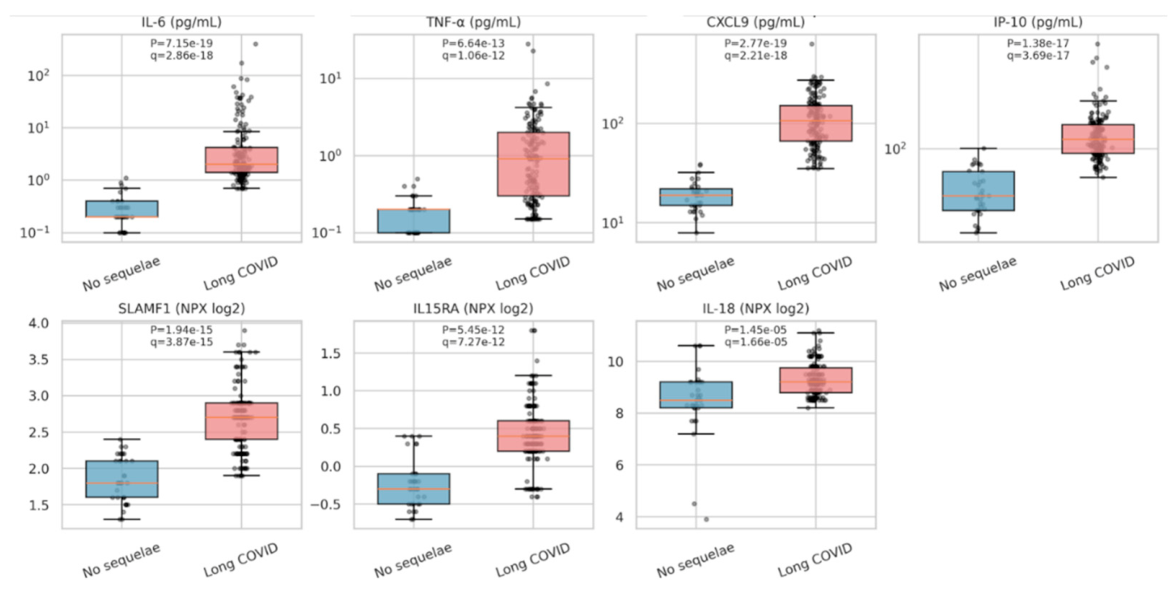
Figure 1. Biomarker distributions in Long COVID vs. post-COVID participants without.
Preprints 233277 g001
Figure 2. Multivariable logistic regression analysis of biomarkers associated with long COVID.
Preprints 233277 g002
Figure 3. Receiver operating characteristic (ROC) curves for discrimination of long COVID from post-COVID participants without sequelae. ROC curves are shown for CXCL9, IL-6, IP-10, and SLAMF1 as single markers and for the stable multivariable logistic regression model (bold black line). The area under the curve (AUC) for each analysis is indicated in the legend; AUC confidence intervals were estimated by stratified bootstrap resampling (B=1,000 iterations). The dashed diagonal line represents the line of no discrimination (AUC = 0.5). The multivariable model included log10-transformed TNF-α, SLAMF1, IL15RA, and IL-18. Abbreviations: AUC, area under the curve; CXCL9, C-X-C motif chemokine ligand 9; IL, interleukin; IL15RA, interleukin-15 receptor subunit alpha; IP-10, interferon gamma-induced protein 10; ROC, receiver operating characteristic; SLAMF1, signaling lymphocyte activation molecule family member 1; TNF, tumor necrosis factor.
Preprints 233277 g003
Figure 4. Cluster-derived long COVID subtypes based on immune biomarker profiles. Heatmap of mean standardized (z-score) biomarker values for the two clusters identified by unsupervised Ward hierarchical clustering (Euclidean distance) within the long COVID cohort (n=158; n=79 per cluster). Concentration-based biomarkers (IL-6, TNF-α, CXCL9, and IP-10) were log10-transformed before standardization; SLAMF1, IL15RA, and IL-18 are presented as NPX (log2) values. Red indicates values above the cohort mean and blue indicates values below the cohort mean (see color scale). The high-inflammatory cluster showed coordinated elevation of CXCL9, TNF-α, IL-6, and IP-10, whereas SLAMF1, IL15RA, and IL-18 showed minimal between-cluster differences. Between-cluster differences for IL-6, TNF-α, CXCL9, and IP-10 remained significant after Benjamini–Hochberg FDR correction (all q ≤ 1.12 × 10⁻⁸). Abbreviations: CXCL9, C-X-C motif chemokine ligand 9; FDR, false discovery rate; IL, interleukin; IL15RA, interleukin-15 receptor subunit alpha; IP-10, interferon gamma-induced protein 10; NPX, Normalized Protein Expression; SLAMF1, signaling lymphocyte activation molecule family member 1; TNF, tumor necrosis factor.
Preprints 233277 g004
Table 1. Univariate comparison of biomarkers between long COVID and post-COVID participants without sequelae.

Marker
Long COVID,
median [IQR]
No sequelae,
median [IQR]

P value

FDR q
Rank-biserial r
AUC
CXCL9 106.00
[65.90–151.00]
19.00
[15.00–22.00]
5.09×10⁻¹⁹ 2.86×10⁻¹⁸ 0.987 0.998
IL-6 2.00
[1.40–4.25]
0.20
[0.20–0.40]
7.15×10⁻¹⁹ 2.86×10⁻¹⁸ 0.983 0.991
IP-10 118.00
[92.22–152.75]
44.00
[34.00–67.00]
1.38×10⁻¹⁷ 3.69×10⁻¹⁷ 0.946 0.973
SLAMF1 2.70
[2.40–2.90]
1.80
[1.60–2.10]
1.94×10⁻¹⁵ 3.87×10⁻¹⁵ 0.875 0.937
IL15RA 0.40
[0.20–0.60]
−0.30
[−0.50–−0.10]
5.45×10⁻¹² 8.73×10⁻¹² 0.760 0.880
TNF-α 0.91
[0.30–2.00]
0.20
[0.10–0.20]
3.99×10⁻¹¹ 5.32×10⁻¹¹ 0.731 0.866
IL-18 9.20
[8.80–9.78]
8.50
[8.20–9.20]
1.49×10⁻⁵ 1.70×10⁻⁵ 0.479 0.739
IFN-λ3 1.50
[1.50–1.50]
1.50
[1.50–1.50]
0.658 0.658 0.006 0.503
IFN-λ3, IL-6, TNF-α, CXCL9, and IP-10 are reported in pg/mL; SLAMF1, IL15RA, and IL-18 are reported as NPX (log2) values. P values are from two-sided Mann–Whitney U tests; FDR q values were obtained by Benjamini–Hochberg correction across all eight biomarkers (threshold q<0.05). Effect size is the rank-biserial correlation, rrb = 1 − (2U)/(n1 × n2), ranging from −1 to +1. AUC values were derived from individual ROC analyses, and 95% CIs were estimated by stratified bootstrap resampling (B=1,000 iterations). Abbreviations: AUC, area under the receiver operating characteristic curve; CI, confidence interval; CXCL9, C-X-C motif chemokine ligand 9; FDR, false discovery rate; IFN, interferon; IL, interleukin; IL15RA, interleukin-15 receptor subunit alpha; IP-10, interferon gamma-induced protein 10; IQR, interquartile range; NPX, Normalized Protein Expression; ROC, receiver operating characteristic; SLAMF1, signaling lymphocyte activation molecule family member 1; TNF, tumor necrosis factor.
Table 2. Stable multivariable logistic regression model for long COVID.
Predictor Adjusted OR (per 1 SD) 95% CI P value Sig.
TNF-α (log10) 10.38 1.25–86.36 0.030 *
SLAMF1 48.30 4.34–537.16 0.002 **
IL15RA 14.45 2.52–82.83 0.003 **
IL-18 2.36 0.62–8.96 0.207 ns
Table 3. Diagnostic performance of individual biomarkers and the stable multivariable model.
Marker/model AUC (95% CI) Optimal cutoff Sensitivity Specificity
CXCL9 (pg/mL) 0.998 (0.989–1.000) 40.3 pg/mL 94.9% 100.0%
Multivariable model 0.995 (0.983–0.999) 0.737 96.8% 97.0%
IL-6 (pg/mL) 0.991 (0.978–0.999) 1.0 pg/mL 91.8% 97.0%
IP-10 (pg/mL) 0.973 (0.948–0.993) 79.5 pg/mL 90.5% 93.9%
SLAMF1 (NPX log2) 0.937 (0.900–0.969) 2.4 NPX 75.9% 97.0%
IL15RA (NPX log2) 0.880 (0.814–0.933) 0.1 NPX 89.2% 81.8%
TNF-α (pg/mL) 0.866 (0.809–0.911) 0.2 pg/mL 88.0% 81.8%
IL-18 (NPX log2) 0.739 (0.630–0.848) 8.5 NPX 99.4% 45.5%
IFN-λ3 (pg/mL) 0.503 (0.500–0.509) 7.1 pg/mL 0.6% 100.0%
IFN-λ3, IL-6, TNF-α, CXCL9, and IP-10 are in pg/mL; SLAMF1, IL15RA, and IL-18 are on the NPX log2 scale. The optimal cutoff for the multivariable model is expressed as a predicted probability (log-odds score). AUC 95% CIs were estimated by stratified bootstrap resampling (B=1,000 iterations). Optimal cutoffs were defined as the threshold maximizing Youden’s index (J = sensitivity + specificity − 1). Sensitivity and specificity are reported at the Youden-optimal threshold. Abbreviations: AUC, area under the curve; CI, confidence interval; CXCL9, C-X-C motif chemokine ligand 9; IL, interleukin; IP-10, interferon gamma-induced protein 10; NPX, Normalized Protein Expression; ROC, receiver operating characteristic; SLAMF1, signaling lymphocyte activation molecule family member 1.
Table 4. Biomarker comparison between the high-inflammatory and moderate-inflammatory long COVID clusters.
Marker High-inflammatory (n=79) Moderate-inflammatory (n=79) P value FDR q
CXCL9 146.00 [104.50–207.00] 72.90 [50.60–106.50] 1.02×10⁻¹² 6.67×10⁻¹²
TNF-α 1.52 [0.89–3.00] 0.32 [0.21–0.97] 2.23×10⁻¹² 6.67×10⁻¹²
IL-6 4.00 [1.90–17.80] 1.50 [1.10–2.05] 2.86×10⁻¹² 6.67×10⁻¹²
IP-10 141.00 [110.50–173.50] 102.00 [84.90–120.00] 6.39×10⁻⁹ 1.12×10⁻⁸
SLAMF1 2.70 [2.20–2.90] 2.70 [2.45–2.90] 0.046 0.064
IL-18 9.20 [8.85–9.80] 9.10 [8.80–9.50] 0.104 0.122
IL15RA 0.40 [0.20–0.60] 0.40 [0.20–0.60] 0.527 0.527
CXCL9, TNF-α, IL-6, and IP-10 are reported in pg/mL; SLAMF1, IL-18, and IL15RA are reported as NPX (log2) values. Data are presented as median [IQR]. Clusters were derived by unsupervised Ward hierarchical clustering with Euclidean distance (k=2) within the long COVID cohort (n=158; n=79 per cluster). All biomarkers were standardized to z-scores prior to clustering, and concentration-based markers were log10-transformed before standardization. IFN-λ3 was excluded from clustering owing to a pronounced floor effect (157 of 158 long COVID samples were below the lower detection limit). P values are from two-sided Mann–Whitney U tests; FDR q values were obtained by Benjamini–Hochberg correction across the seven biomarkers included in the clustering analysis. Abbreviations: CXCL9, C-X-C motif chemokine ligand 9; FDR, false discovery rate; IL, interleukin; IL15RA, interleukin-15 receptor subunit alpha; IP-10, interferon gamma-induced protein 10; IQR, interquartile range; NPX, Normalized Protein Expression; SLAMF1, signaling lymphocyte activation molecule family member 1; TNF, tumor necrosis factor.
Disclaimer/Publisher’s Note: The statements, opinions and data contained in all publications are solely those of the individual author(s) and contributor(s) and not of MDPI and/or the editor(s). MDPI and/or the editor(s) disclaim responsibility for any injury to people or property resulting from any ideas, methods, instructions or products referred to in the content.
Copyright: This open access article is published under a Creative Commons CC BY 4.0 license, which permit the free download, distribution, and reuse, provided that the author and preprint are cited in any reuse.