

Submitted:
14 September 2026
Posted:
15 September 2026
You are already at the latest version
Abstract
In India and across the world, obesity is a serious public health issue, creating an urgent need for accurate predictive models. This research analyzes machine learning algorithms to predict obesity within a statistically optimized framework. The proposed approach compares classical and advanced models: Logistic regression, decision tree, random forest, k-nn, naive bayes, LGBM Classifier, XGBoost Classifier, Gradient Boosting, and DNN.The dataset contains factors such as body height, body weight, dietary behaviour, and physical activities. The preprocessing phase entailed features selection, normaliza-tion, and handling of missing data. Efficiency was calculated using accuracy, recall, precision, F1-score, and AUC.LGBM performed much better than the rest of the algo-rithms with an accuracy rate of 95.74%, followed by XGBoost (95.27%), gradi-entBoost(95.09%), DNN (94.79%), Decision Tree (94.08%), k-nn (91.48%), and naive bayes (82.50%). Accordingtothese findings, tree-based models performed better in forecasting obesity compared to traditional BMI models and can be applied instead of them. This study emphasizes the significance of taking into consideration not only physical activi-ties but also nutritional behaviours while trying to solve the problem of obesity.
Keywords:
computational intelligence applications
; machine learning
; data analysis and decision making
; good health and wellbeing
; dietary habits
; classification accuracy
; gender equality
1. Introduction
Obesity being a major cause of metabolic syndrome, type 2 diabetes, and cardiovascular disease will become the serious issue in the fight against chronic diseases. Despite being extensively adopted, BMI (Body Mass Index) and different conventional methods of estimating obesity do not take into account body composition andmany other factors resulting in erroneous classification [1]. ML (machine learning has come up as a promising technique that uses various kinds of datasets in order to detect subtle connections between different patterns and causalities that result in obesity. Many have shown that it is effective to use machine learning algorithms. to accurately assess the obesity considering number of variables like metabolic indicators, activity level, and food intake. But despite all these advances, there are still few algorithms tested using large amounts of data, which prevents us from determining the algorithm with the highest predictive accuracy. In our work, we examine four machine learning algorithms, namely decision tree, naïve Bayes, random forest, and K-NN (K Nearest Neighbor) using perfect selection data set, which incorporates multiple features connected with obesity. Our main goal is to find the most accurate machine learning algorithm suitable for obesity prediction based on appropriate feature selection and data [5]. This research aims to bridge this gap. Discovering the best algorithm capable of predicting obesity is the main goal of this paper, with the key focus being on the correct selection and processing the features. The results obtained in this research gives the growing literature in applying machine learning in dealing with obesity and provide the foundation for developing evidence-based techniques for dealing with the obesity epidemic. This paper will discuss in detail the methodology of the data set, results, and further research directions. Figure 1 below demonstrates the steps in our research paper [9].
2. Materials and Methods
The research landscape reveals the clear evolutionary trajectory in applying machine learning to obesity risk and body composition analysis. One remarkable achievement created by Ratih, I.D.; Retnaningsih, S.M.; Islahulhaq ml models created by them are satisfactory and predictive performance and well specified [11,12,13], Heterogeneous datasets and methods; limited comparability; need for larger, more standardized databases and more models. S. Rahman, M. Irfan et al.[2,3,4,6] introduced a model and confirms obesity as major global health issue and describes wide use of supervised ml for obesity related prediction tasks, and highlights heterogeneity in features outcomes, definitions and validation. Diwaker, C.; Tomar, P.; Solanki et al. [7]. investigated the data using a number of machine learning methods. These include LightGBM, XGBoost, Random Forest, Decision Tree and logistic regression. The most prominent among the methods was LightGBM, with the highest weighted area under the curve and the accuracy of 97.45%. Kaur, Kumar and Gupta investigated the problem of predicting obesity risks in practical terms and the solution provided by them describes meal recommendations using Ml algorithms. The Gradient boosting classifier was able to achieve an outstanding accuracy of 98.11% with a 90:10 train test ratio, where XGBoost performed extremely well with an accuracy of 97.79% with a 70:30 data ratio. Singh, B.; Tawfik, H et,al.[5] demonstrated the hybrid strategies can enhance classification, performance for obesity risk tested on limited datasets. Du, J.; Yang, S.; Zeng, Y.et al [8]. visualized the risk estimation system depends on different machine learning algorithms and predicted the obesityrisk. Notably broader understanding of the obesity classification. S. K. Keadle, R. McKinnon et al. [10] Discusses the physical exercise that is necessary for physical as well as mental fitness and if it is not done, then it leads to severe diseases. It is by monitoring the activities of daily living that one can maintain good health. Safaei, M.; Sundararajan et al. [14] This study was designed in order to determine the efficacy and safety of the patients that were admitted in hospitals for the treatment of obesity. The aim of their review is to help decision makers that want to know the effects of obesity on health.
3. Research Methodology
This methodological approach is devised to meet five central objectives. Firstly, it intends to build predictive models for obesity using classical and cutting-edge machine learning techniques. Secondly, it intends to enhance predictive accuracy using statistical methods including regularization, feature selection, resampling, and hyperparameter tuning. Thirdly, it aims to compare predictive accuracy using validation measures. Fourthly, it includes interpretability and fairness considerations so that predictions are understandable and trustworthy. Finally, the whole predictive modeling process takes place in the setting of India where socio-economic diversity may significantly influence the performance of the model.
3.1. Data Sources and Study Population
This research study will make use of secondary data sourced from an appropriate obesity-related database which will have variables like anthropometric, demographic, behavioral, and clinical. Databases that represent Indian adults or Indian subpopulations will be preferred because Indian literature suggests that models which are specific to the population increase their external validity and applicability. In case there is no available Indian dataset, then the research study will utilize the benchmark obesity dataset and clearly explain issues relating to transferability and limitations involved along with the importance of Indian contextual validation The target population for this research will comprise those individuals about whom there is adequate data about obesity and associated outcomes like underweight,over weight and obese.
3.2. Materials and Methods
The dataset’s specifics and our methods for processing it for the experiments are first discussed in this section. Next, we discuss the suggested model and experimental context. For our approach, we provide a unique architecture in Figure 1. This graphic shows a Obesity prediction – pipeline for stacking machine learning models. Data pre-processing, model building, model evaluation, and interpretability modules constitute the pipeline.
The proposed methodology starts with dataset preprocessing, including data analysis, mapping, normalization, feature selection, and balancing to improve data quality. The processed data are used for model selection, ensemble learning, cross-validation, hyperparameter tuning, and final model training to achieve robust predictive performance. Finally, LIME is employed to explain the model’s decisions, while Accuracy, Precision, Recall, F1-score, and the Confusion Matrix are used to evaluate its effectiveness. Data Collection: In this case, the obesity data set used comes from the UCI machine learning repository. There are a total of 2111 observations contained in the dataset, all relating to factors involving food, physical appearance, activities, and obesity. The physical appearance data included in the data set includes gender, age, height, and weight. The other variables relate to activities and are as follows.

| Feature | Description |
| Family history of overweight | a categorical variable indicating whether there is an overweight or obese person in the family (Yes/No). |
| Frequency of consumption of vegetables (FCVC) | Categorical variable indicating if the person consumes high-calorie food often (Yes/No) |
| Frequency of consumption of vegetables (FCVC) | Ordinal variable indicating how often the person consumes vegetables (Never = 1, Sometimes = 2, Always = 3). |
| • Number of main meals (NCP): | an ordinal variable denoting the number of major meals that the person has every day (1 = 1–2, 2 = 3, 3 = more than 3, 4 = unknown). |
| Food consumed between meals (CAEC): | An ordinal variable representing the frequency of eating food between meals (1 = Never, 2 = Sometimes, 3 = Often, 4 = Always). |
| SMOKE | categorical variable denoting that the person smokes or not (yes, no). |
| Consumption of water per day (CH2O): | Ordinal variable which explains how much water is being taken by the person per day (1 – less than one liter, 2 – one to two liters, 3 – more than two liters). |
| Calorie monitoring (SCC): | A categorical variable indicating the control of calorie intake by the individual (yes or no) |
| Physical activity frequency (FAF: | An ordinal variable showing the frequency of doing physical exercises by the individual (1 – never, 2 – one to two times a week, 3 – two to three times a week, 4 – four to five times a week). |
| Electronic device usage time (TUE): | Ordinal scale for the amount of hours spent using the electronic devices (0 - none, 1 - less than one hour, 2 - one to three hours, 3 - more than three hours). |
| Use of alcohol (CALC): | Ordinal scale indicating the frequency of alcohol use by the individual (1 – never, 2 – occasionally, 3 – frequently, 4 – constantly). |
| Mode of transport (MTRANS): | Nominal scale indicating the mode of transport used by the individual (car, motorbike, bicycle, public transport, walking). |
| NObeyesdad | Obesity level |
3.3. Data Exploration Analysis:
To obtain pertinent statistics for our investigations, we perform primary data research. There are no null fields in the dataset. The distribution of distinct values for every characteristic in the dataset is shown in Figure 2. The features are listed on the x-axis, and the corresponding number of unique values is shown on the y-axis. While features with a larger count indicate continuous or numerical variables, those with a lesser number of unique values may be used as a possible indication that variables are categorical in nature. Bars show the numerical variables.
Figure 2.
Flowchart demonstrating all stages of the pipeline from data preprocessing to model evaluation and explanation by means of LIME.
Figure 2.
Flowchart demonstrating all stages of the pipeline from data preprocessing to model evaluation and explanation by means of LIME.
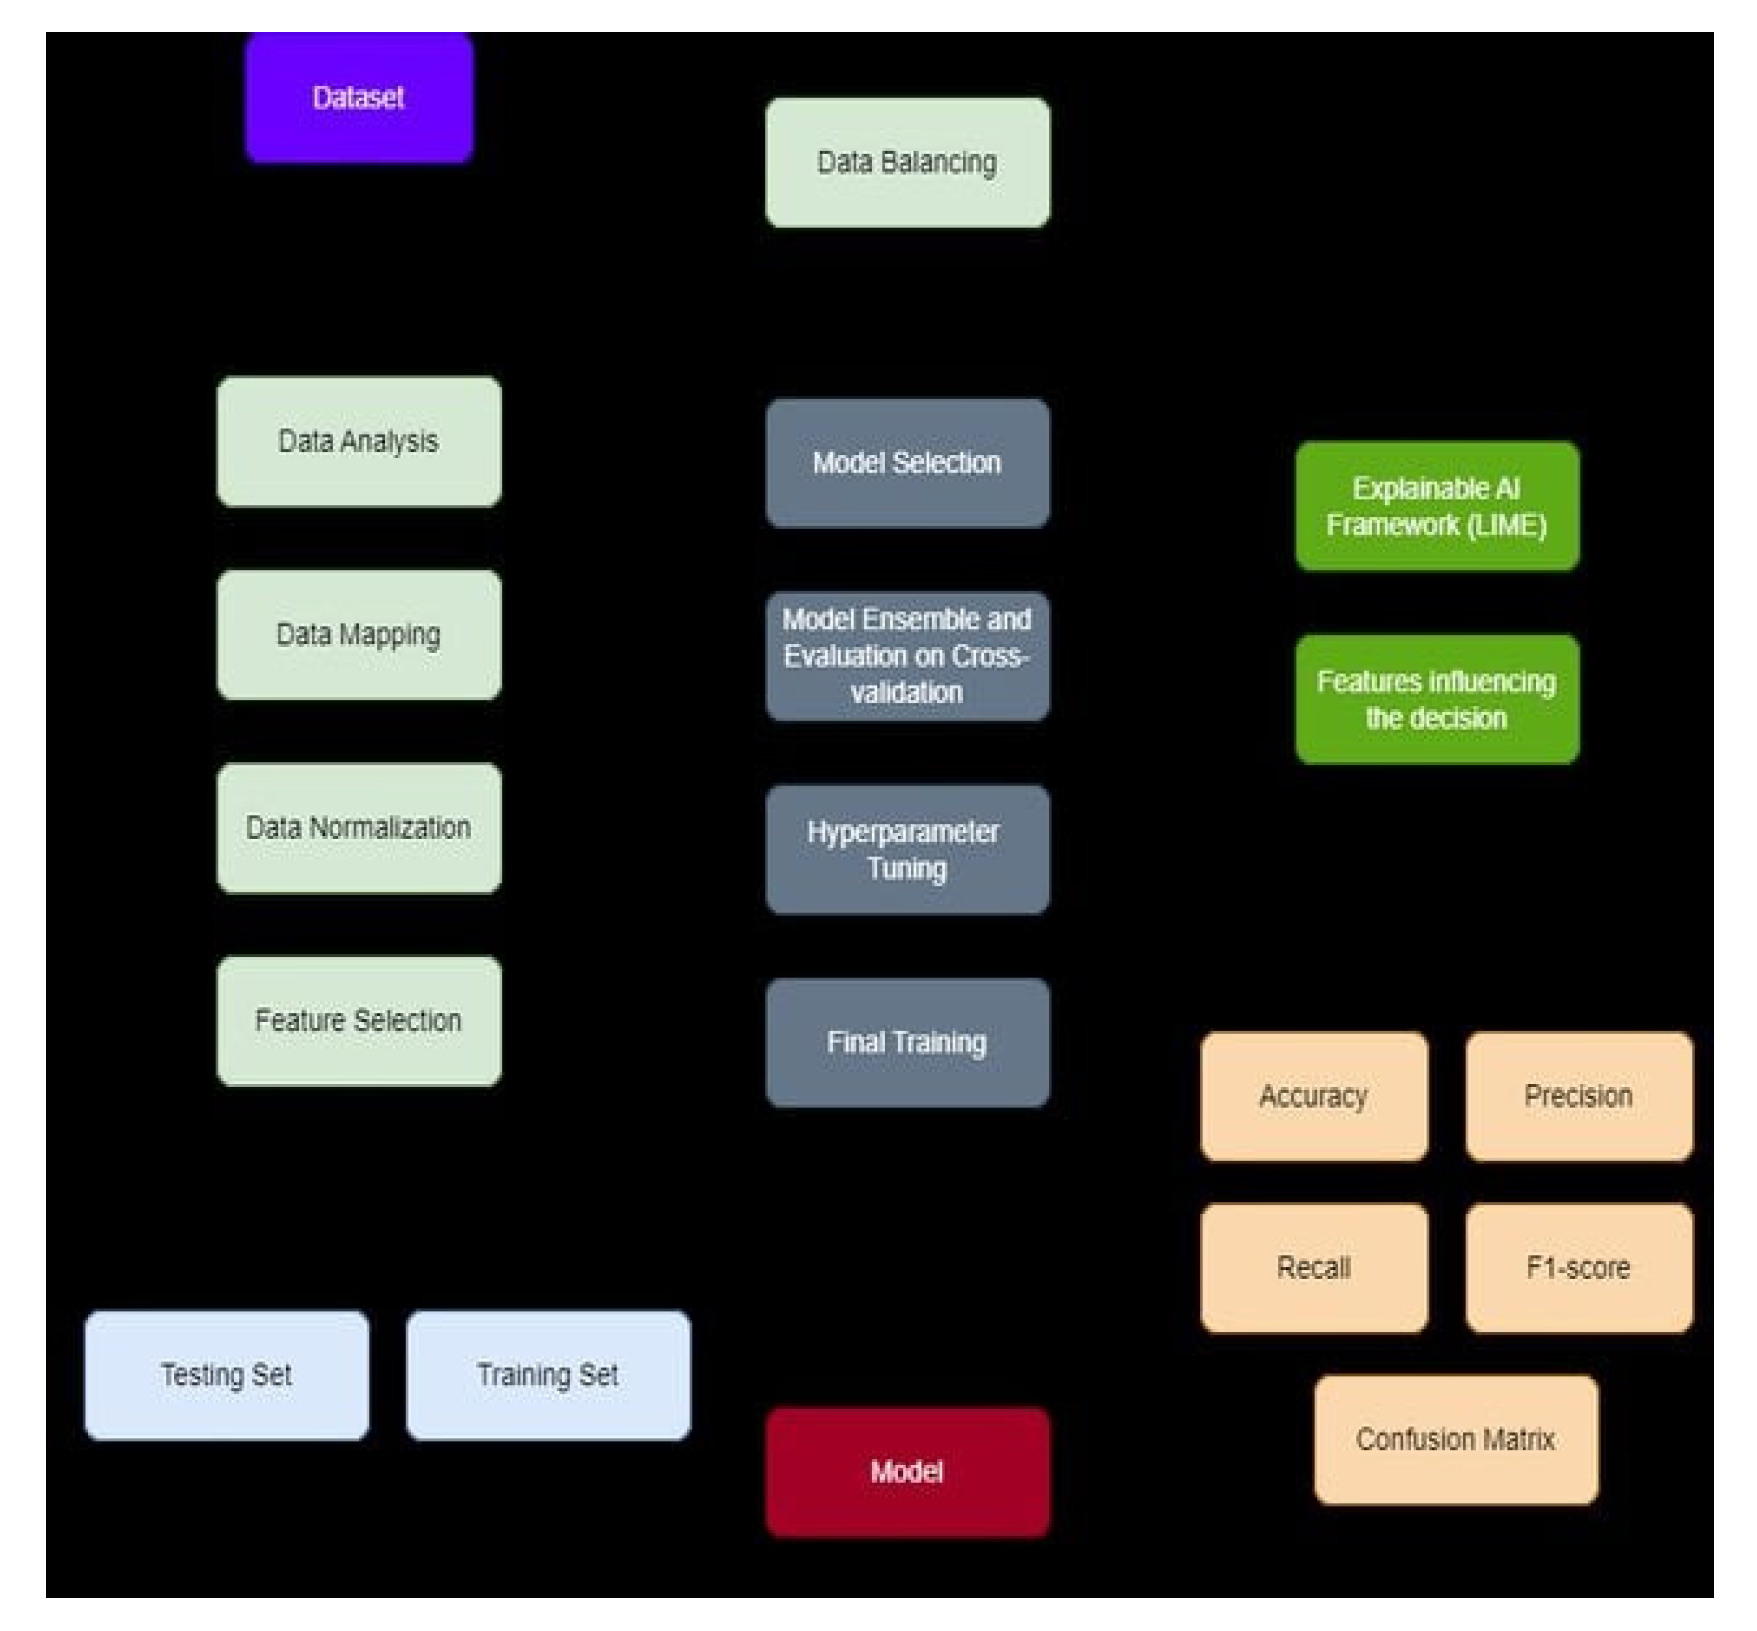
Figure 2.
Uniqueness of data across various features. Bar graphs show continuous data while the rest of the features (Gender, family_history_with_overweight, FAVC, CAEC, SMOKE, SCC, CALC, MTRANS, and NObeyesdad) denote categorical data.
Figure 2.
Uniqueness of data across various features. Bar graphs show continuous data while the rest of the features (Gender, family_history_with_overweight, FAVC, CAEC, SMOKE, SCC, CALC, MTRANS, and NObeyesdad) denote categorical data.
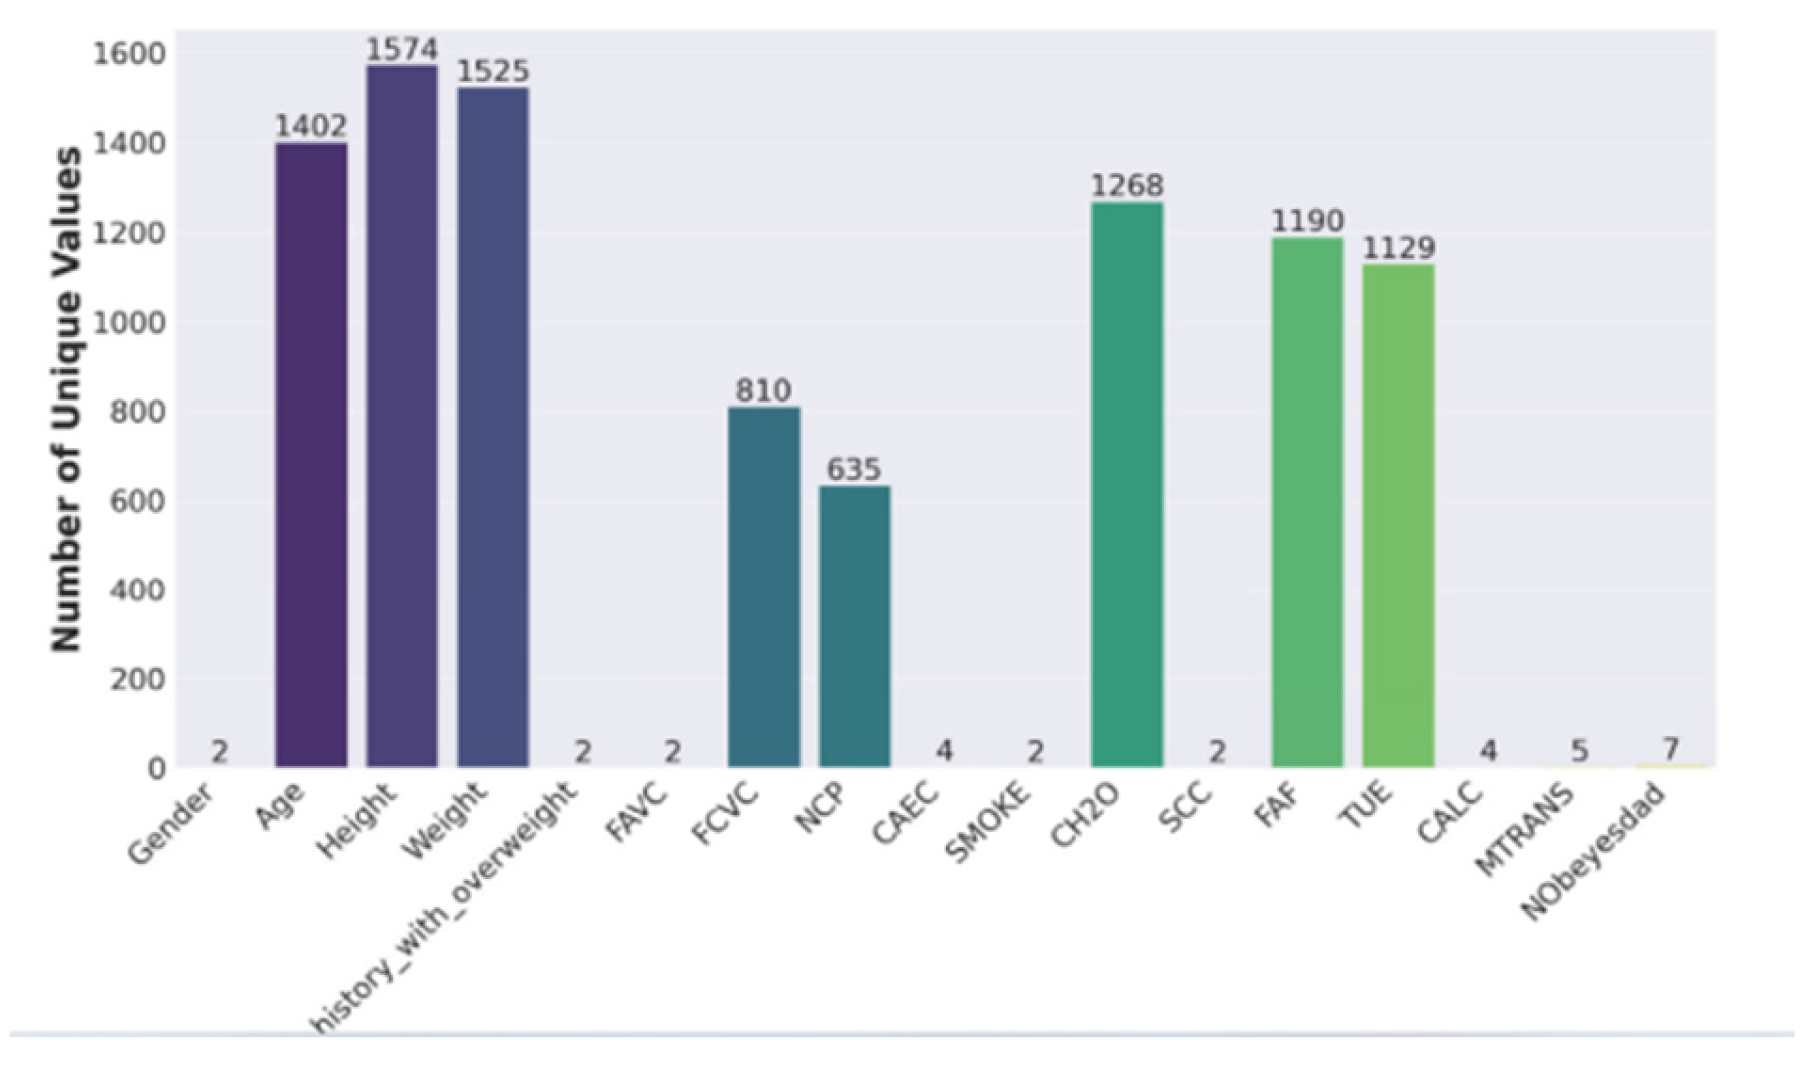
Height” has the most distinctive values among the numerical characteristics, while “NCP,” or the number of main meals, has the fewest. Both numerical and categorical variables are necessary so that the a model will understand the structure, while category variables give the data context. While categorical data contextualizes behaviors, groups, or situations, numerical data quantifies quantifiable traits. Males and females may fall into distinct obesity categories based on the same weight and As such, the experiments need to include both numeric and categorical attributes. “NObeyesdad,” the obesity condition, is the class attribute of this data collection. There are seven types of obesity in this dataset, as indicated in Table 2 below: Obesity Type I, Type II, Type III, Normal Weight, Overweight Level I, Overweight Level II, and Insufficient Weight. The imbalance of classes is visible from the table below. Although the “Insufficient Weight” class has the least records, the class having the largest umber of records is “Obesity_Type_I,” while the “Insufficient Weight” class has the least number of records.
Figure 3 provides the comparison of eight important numerical variables by using the boxplots. The visual graph gives information about the range, center, and dispersion of the variables. The range of Age and Weight is very high when compared to other variables. They also have a relatively larger spread. FCVC, FAF, and TUE denote low variability among these variables. The data points which fall Values that lie outside the whiskers are referred to as outliers, and there are some outliers in the box plots of the variables “Age” and “Number of main meals (NCP).” Outliers in these plots do not depict any error; there are also some outliers in the box plots of “Height” and “Weight”.. As there are many outliers, no outlier is removed from the data set. The variables are normalized during the data preprocessing stage, and it reduces the effect of the outliers on the model.
Positioning Figures and Tables: Figure 4 depicts the correlation matrix for the numerical features of the dataset. Correlation matrix shows the values of Pearson correlation coefficient between eight numerical features, which consist of Age, Height, Weight, Frequency of Vegetable Consumption (FCVC), Number of Meals (NCP), Water Consumption (CH2O), Physical Activity Frequency (FAF), and Technological Devices Time Use (TUE). The darker the color, the more the value of correlation; the lighter the color, the less the value of correlation. The diagonal values show the perfect correlation between the variables through Using the Min-Max Scaling Technique. The equation for min-max scaling is shown below. X scaled = x − min(X)/( max(X) − min(X) (1) In above equation, x represents the feature/input variable, min(X) and max(X) represent minimum and maximum values of each feature in the data set, and X scaled is the final output.
Table for the class name and number of samples.
| Class name | Number of Samples |
| Insufficient_Weight | 272 |
| Normal_Weight | 287 |
| Overweight_Level_I | 290 |
| Overweight_Level_II | 290 |
| Obesity_Type_I | 351 |
| Obesity_Type_II | 297 |
| Obesity_Type_III | 324 |
3.4. Data Splitting
The data was then segregated in such a way that 20% is used for testing while 80% is used for training purposes. 80-20 segregation is the most common approach in machine learning, and in our research paper comparison papers, it is also being followed. While segregating the data, we make sure that the test data is stratified in such a way that its class distribution resembles that of the whole data.
Data Balancing: Based on our study, all the classes do not have an equal number of samples. This problem of imbalance dataset can cause bias towards the majority classes in the machine learning model. Therefore, to solve the above problem, we use the SMOTE approach to make our dataset balanced. The SMOTE approach allows creating synthetic samples from the minority classes through interpolation of the data. SMOTE approach is done on the training dataset only. In our study, we use the “SMOTENC” approach in the Imbalanced Learn Library where both numeric and categorical variables exist in the dataset.
4. Statistical Optimization Framework
One of the key methodological contributions of the project will be the statistical optimization of model performance. It will involve feature selection via filter, wrapper, or embedded approaches; model regularizations via, for example, L1 or L2 penalty for parsimonious model construction; hyperparameter optimization by means of, for instance, grid search, random search, or Bayesian optimization; and optimization of the classification threshold for better trade-off of sensitivity and specificity. Cross-validation with K folds will help to avoid overfitting and estimate the performance more reliably. The proposed approach is consistent with the general idea of the postdoc project by considering obesity prediction a platform for mathematics-based predictive system improvements.
5. Machine Learning Algorithms
Classification of obesity uses machine learning algorithms on a selected dataset for the study. The purpose of this research contributions are the development of an effective and comprehensible machine learning-based system for obesity prediction. The approach utilizes the following steps such as feature selection, model training, data processing, evaluation. The algorithms used are listed below: LGBM, XGBoost, Gradient Boosting, DNN, Random Forest, Decision Tree, Logistic Regression, KNN, Naive Bayes.
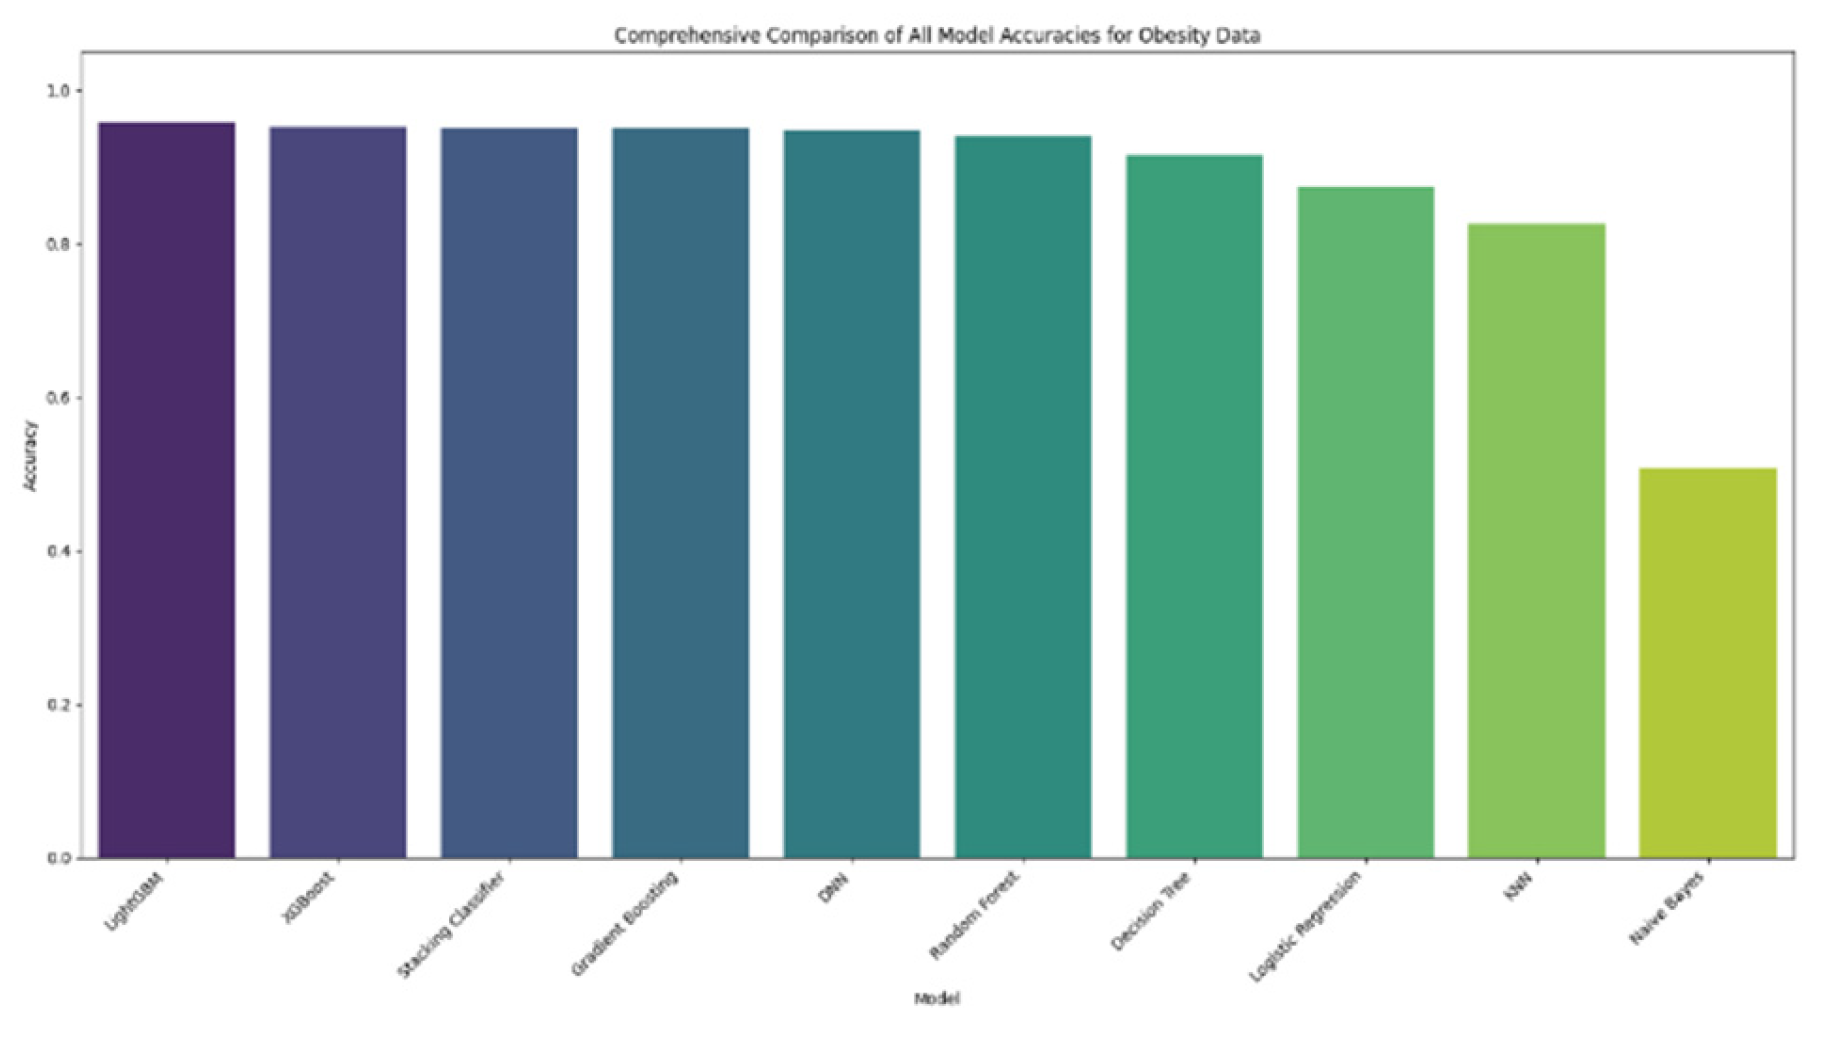
All these algorithms have been implemented using RapidMiner, and the performances of these algorithms have been estimated on the basis of accuracy, as represented in Table 2 below. The highest level of accuracy 95.74% has been obtained for the LightGBM algorithm in which a tree-based structure has been used for the classification of data. Another kind of ensemble learning algorithm is the Decision Tree in where multiple decision trees are aggregated together for obtaining an efficient model; and the accuracy is 91.48%. Accuracy for Logistic Regression is 87.47%. In K-NN algorithm, classification is performed on the basis of majority class of its neighbours, and an accuracy of 82.50% has been obtained. Lastly, the probabilistic classifier algorithm is Naïve Bayes in which Bayes Theorem is applied; accuracy has been obtained as 50.82%, and the reason behind this is the independence of various features.
Figure 5.
Model Accuracies for Obesity Data.
5.1. Result Analysis
Based on the Analysis of outcome, LGBM Classifier, XGBoost Classifier Gradient Boosting, DNN, random forest, K-NN, Naive Bayes, and Decision tree algorithms were used to investigate the performance of machine learning techniques in this experiment. The LGBM algorithm scored the highest, with 95.74%, followed by the XGBoost, Gradient Boost, DNN, Logistic Regression, and K-NN at 95.27%, 95.08%,94.79%,94.08%91.48%,87.47%, and 82.50% respectively. The naive Bayes algorithm, which assumed independence, scored the lowest, at 50.82%. Considering all factors, Random Forest was the best choice.
6. Conclusions of the Future Work
The prevalence of diseases like diabetes, hypertension, stroke, cancer, and others is higher amongst people who are obese. Prevention of such diseases in their later stages depends upon the early detection and preparation against them. This research used machine learning methods to generate an effective model. For the classification of obesity degree The LGBM obtained the maximum accuracy of 95.74%, while the XGBoost, Gradient Boosting, DNN, Random Forest Decision Tree, Logistic Regression, K-NN, Naive Bayes, models came after. The outcomes have proven that the tree methods are usually the most effective in obesity classification. While using more conventional approaches like BMI is possible, future studies might consider exploring other sources of data, for instance, genetic and metabolic markers, as well as implementing the latest techniques like deep learning. Implementation in practice could be facilitated through the development of personalized obesity management systems.
Author Contributions
S.V.: Writing—original draft, Visualization, Validation, Paper administration, Methodology, Investigation, Conceptualization. M.M.: Writing—review and editing, Visualization, Validation, Supervision, Papert administration, Methodology, Investigation. S. R,P C: Writing—review and editing, Visualization, Validation, Supervision, Paper administration, Methodology, Investigation. All authors have read and agreed to the published version of the manuscript.
Funding
The authors declare that they have received no funding.
Institutional Review Board Statement
Not applicable.
Informed Consent Statement
Not applicable.
Data Availability Statement
No new data were created or analyzed in this study. Data sharing is not applicable to this article.
Conflicts of Interest
The authors declare no conflicts of interest.
References
- Kaur, R.; Kumar, R.; Gupta, M. Predicting risk of obesity and meal planning to reduce the obese in adulthood using artificial intelligence. Endocrine 2022, vol. 78(no. 3), 458–469. [Google Scholar] [CrossRef]
- Rahman, S.; Irfan, M.; Raza, M.; Ghori, K. M.; Yaqoob, S.; Awais, M. Performance analysis of boosting classifiers in recognizing activities of daily living. Int. J. Environ. Res. Public Health 2020, vol. 17(no. 3), 1082, [Online]. Available: https://www.mdpi.com/1660-4601/17/3/1082.. [Google Scholar] [CrossRef]
- Hastie, T.; Tibshirani, R.; Friedman, J. The Elements of StatisticalLearning (Springer Series in Statistics); Springer: New York, NY, USA, 2001. [Google Scholar]
- Safaei, M.; Sundararajan, E.A.; Driss, M.; Boulila, W.; Shapi’i, A. A systematic literature review on obesity: Understanding thecauses & consequences of obesity and reviewing various machine learning approaches used to predict obesity. Comput. Biol. Med. 2021, 136, 104754. [Google Scholar] [CrossRef]
- Singh, B.; Tawfik, H. Machine learning approach for the early prediction of the risk of overweight and obesity in young people. In Computational Science—ICCS 2020, Proceedings of the ICCS 2020, Virtual Lecture Notes in Computer Science; Springer: Cham, Switzerland, Virtual, 18-21 September 2020; Volume 12140, pp. 523–535. ISSN 0302-9743.
- Pang, X.; Forrest, C.; Lê-Scherban, F.; Masino, A. Prediction of early childhood obesity with machine learning and electronic health record data. Int. J. Med. Inform. 2021, 150, 104454. [Google Scholar] [CrossRef]
- Diwaker, C.; Tomar, P.; Solanki, A.; Nayyar, A.; Jhanjhi, N.Z.; Abdullah, A.; Supramaniam, M. A new model for predicting component-based software reliability using soft computing. IEEE Access 2019, 7, 147191–147203. [Google Scholar] [CrossRef]
- Du, J.; Yang, S.; Zeng, Y.; Ye, C.; Chang, X.; Wu, S. Visualization obesity risk prediction system based on machine learning. Sci. Rep. 2024, 14, 22424. [Google Scholar] [CrossRef]
- Kaur, R.; Kumar, R.; Gupta, M. Predicting risk of obesity and meal planning to reduce the obese in adulthood using artificial intelligence. Endocrine 2022, 78, 458–469. [Google Scholar] [CrossRef]
- Keadle, S. K.; McKinnon, R.; Graubard, B. I.; Troiano, R. P. Prevalenceand trends in physical activity among older adults in the United States:A comparison across three national surveys. Prev. Med. 2016, vol. 89, 37–43. [Google Scholar] [CrossRef]
- Vasundhara, S.; Tejaswini, S.; Sriyam, A.S. (2025). Machine Learning Algorithms – The Effect of Training and Testing Process. In: Kumar, A., Gunjan, V.K., Senatore, S., Hu, YC. (eds) Proceedings of the 5th International Conference on Data Science, Machine Learning and Applications; Volume 2. ICDSMLA 2023. Lecture Notes in Electrical Engineering, vol 1274. Springer, Singapore. [CrossRef]
- Rush, E.; Yan, M. Evolution not revolution: Nutrition and obesity. Nutrients 2017, 9, 519. [Google Scholar] [CrossRef]
- Ratih, I.D.; Retnaningsih, S.M.; Islahulhaq, I.; Dewi, V.M. Synthetic minority over-sampling technique nominal continous logistic regression for imbalanced data. AIP Conf. Proc. 2022, 2668, 070021. [Google Scholar] [CrossRef]
- Safaei, M.; Sundararajan, E.A.; Driss, M.; Boulila, W.; Shapi’i, A. A systematic literature review on obesity: Understanding the causes & consequences of obesity and reviewing various machine learning approaches used to predict obesity. Comput. Biol. Med. 2021, 136, 104754. [Google Scholar] [CrossRef]
- Miao, J.; Zhu, W. Precision–recall curve (PRC) classification trees. Evol. Intell. 2022, 15, 1545–1569. [Google Scholar] [CrossRef]
Figure 1.

Figure 3.
Boxplot showing the distribution of eight numerical variables. The box plot provides a visual representation of the data of each of these variables.
Figure 3.
Boxplot showing the distribution of eight numerical variables. The box plot provides a visual representation of the data of each of these variables.
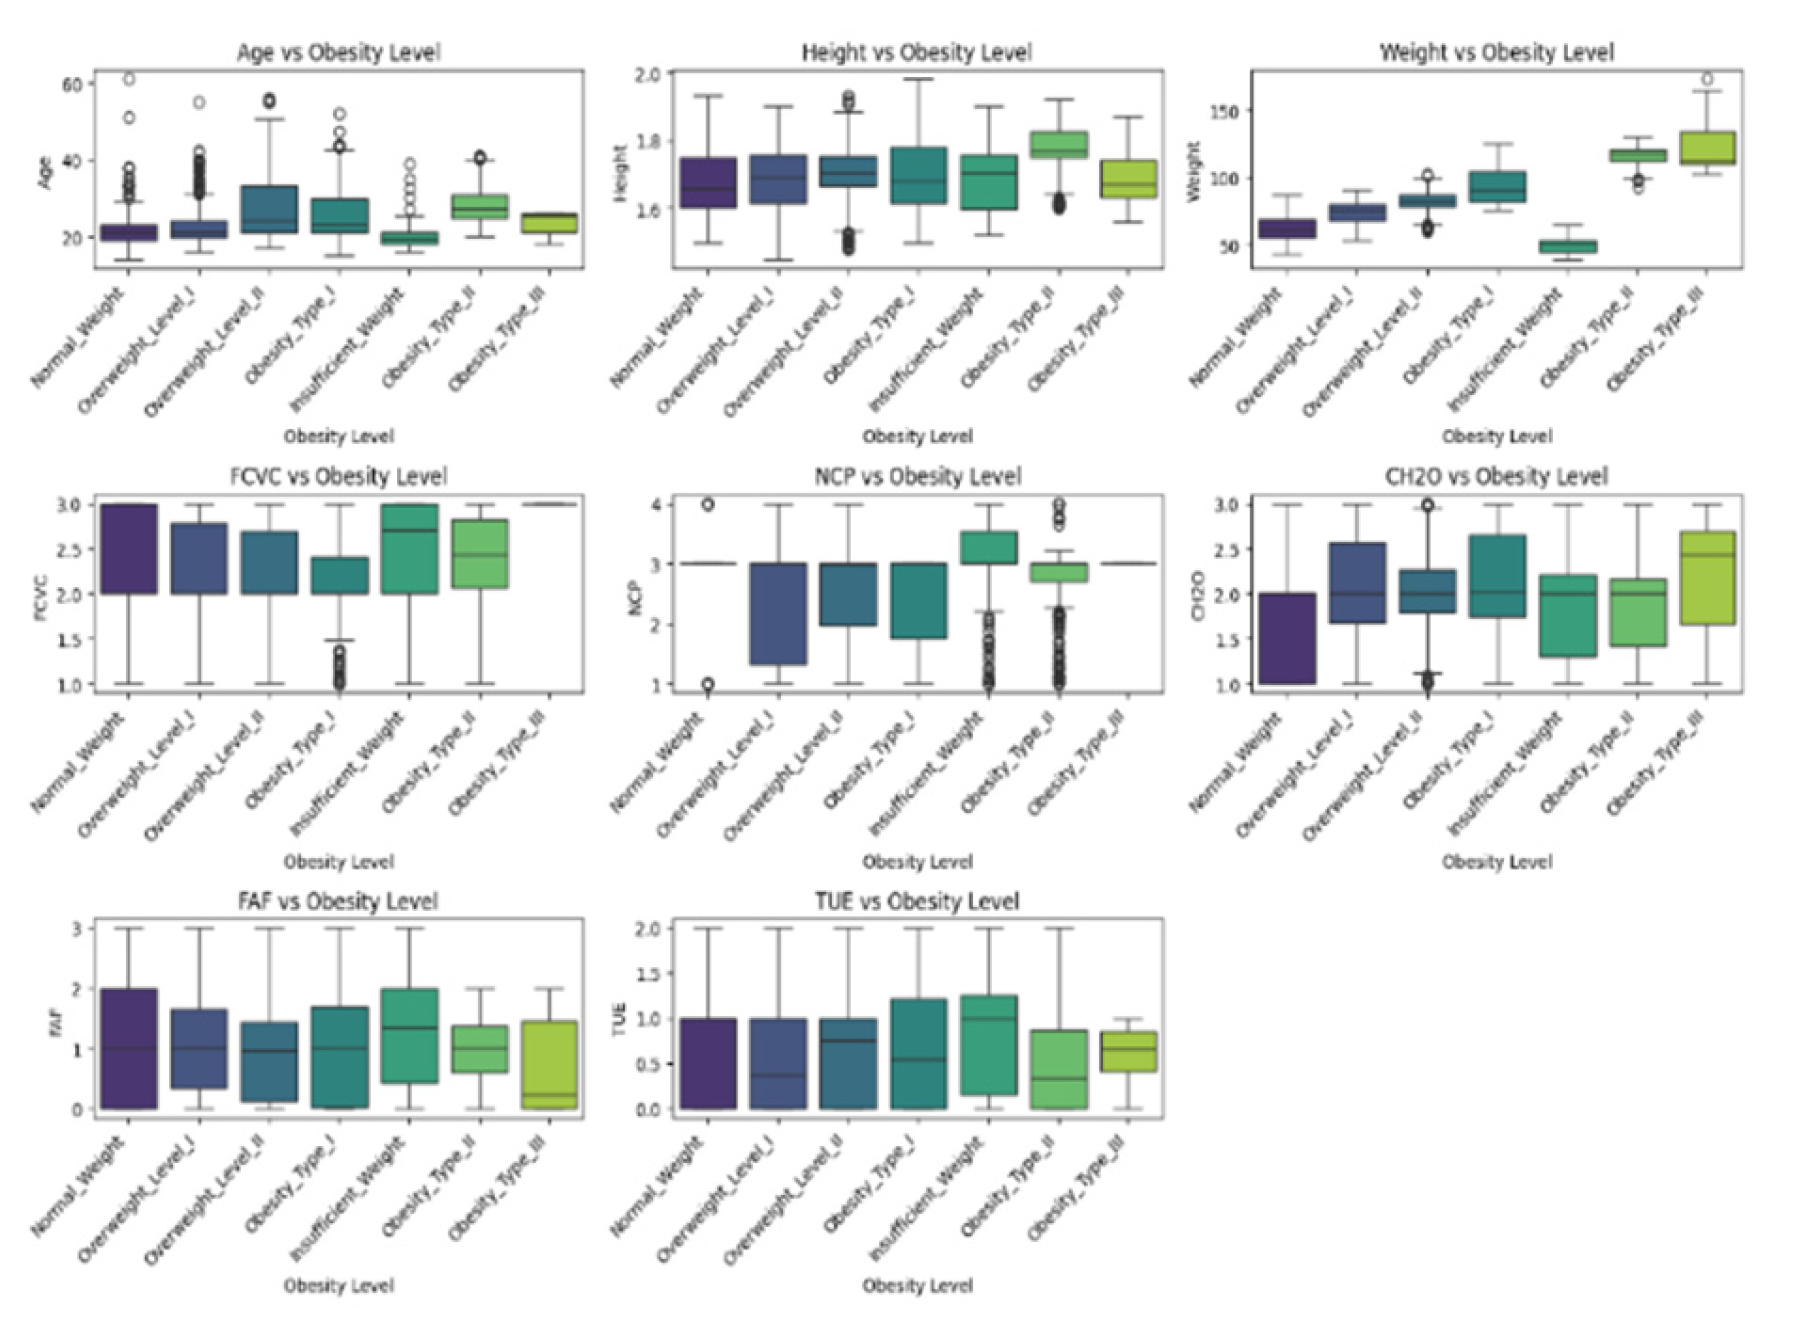
Figure 4.
Correlation matrix of eight quantitative attributes. The darker the color, the more correlated a features; conversely, lighter colors indicate negative correlations.
Figure 4.
Correlation matrix of eight quantitative attributes. The darker the color, the more correlated a features; conversely, lighter colors indicate negative correlations.
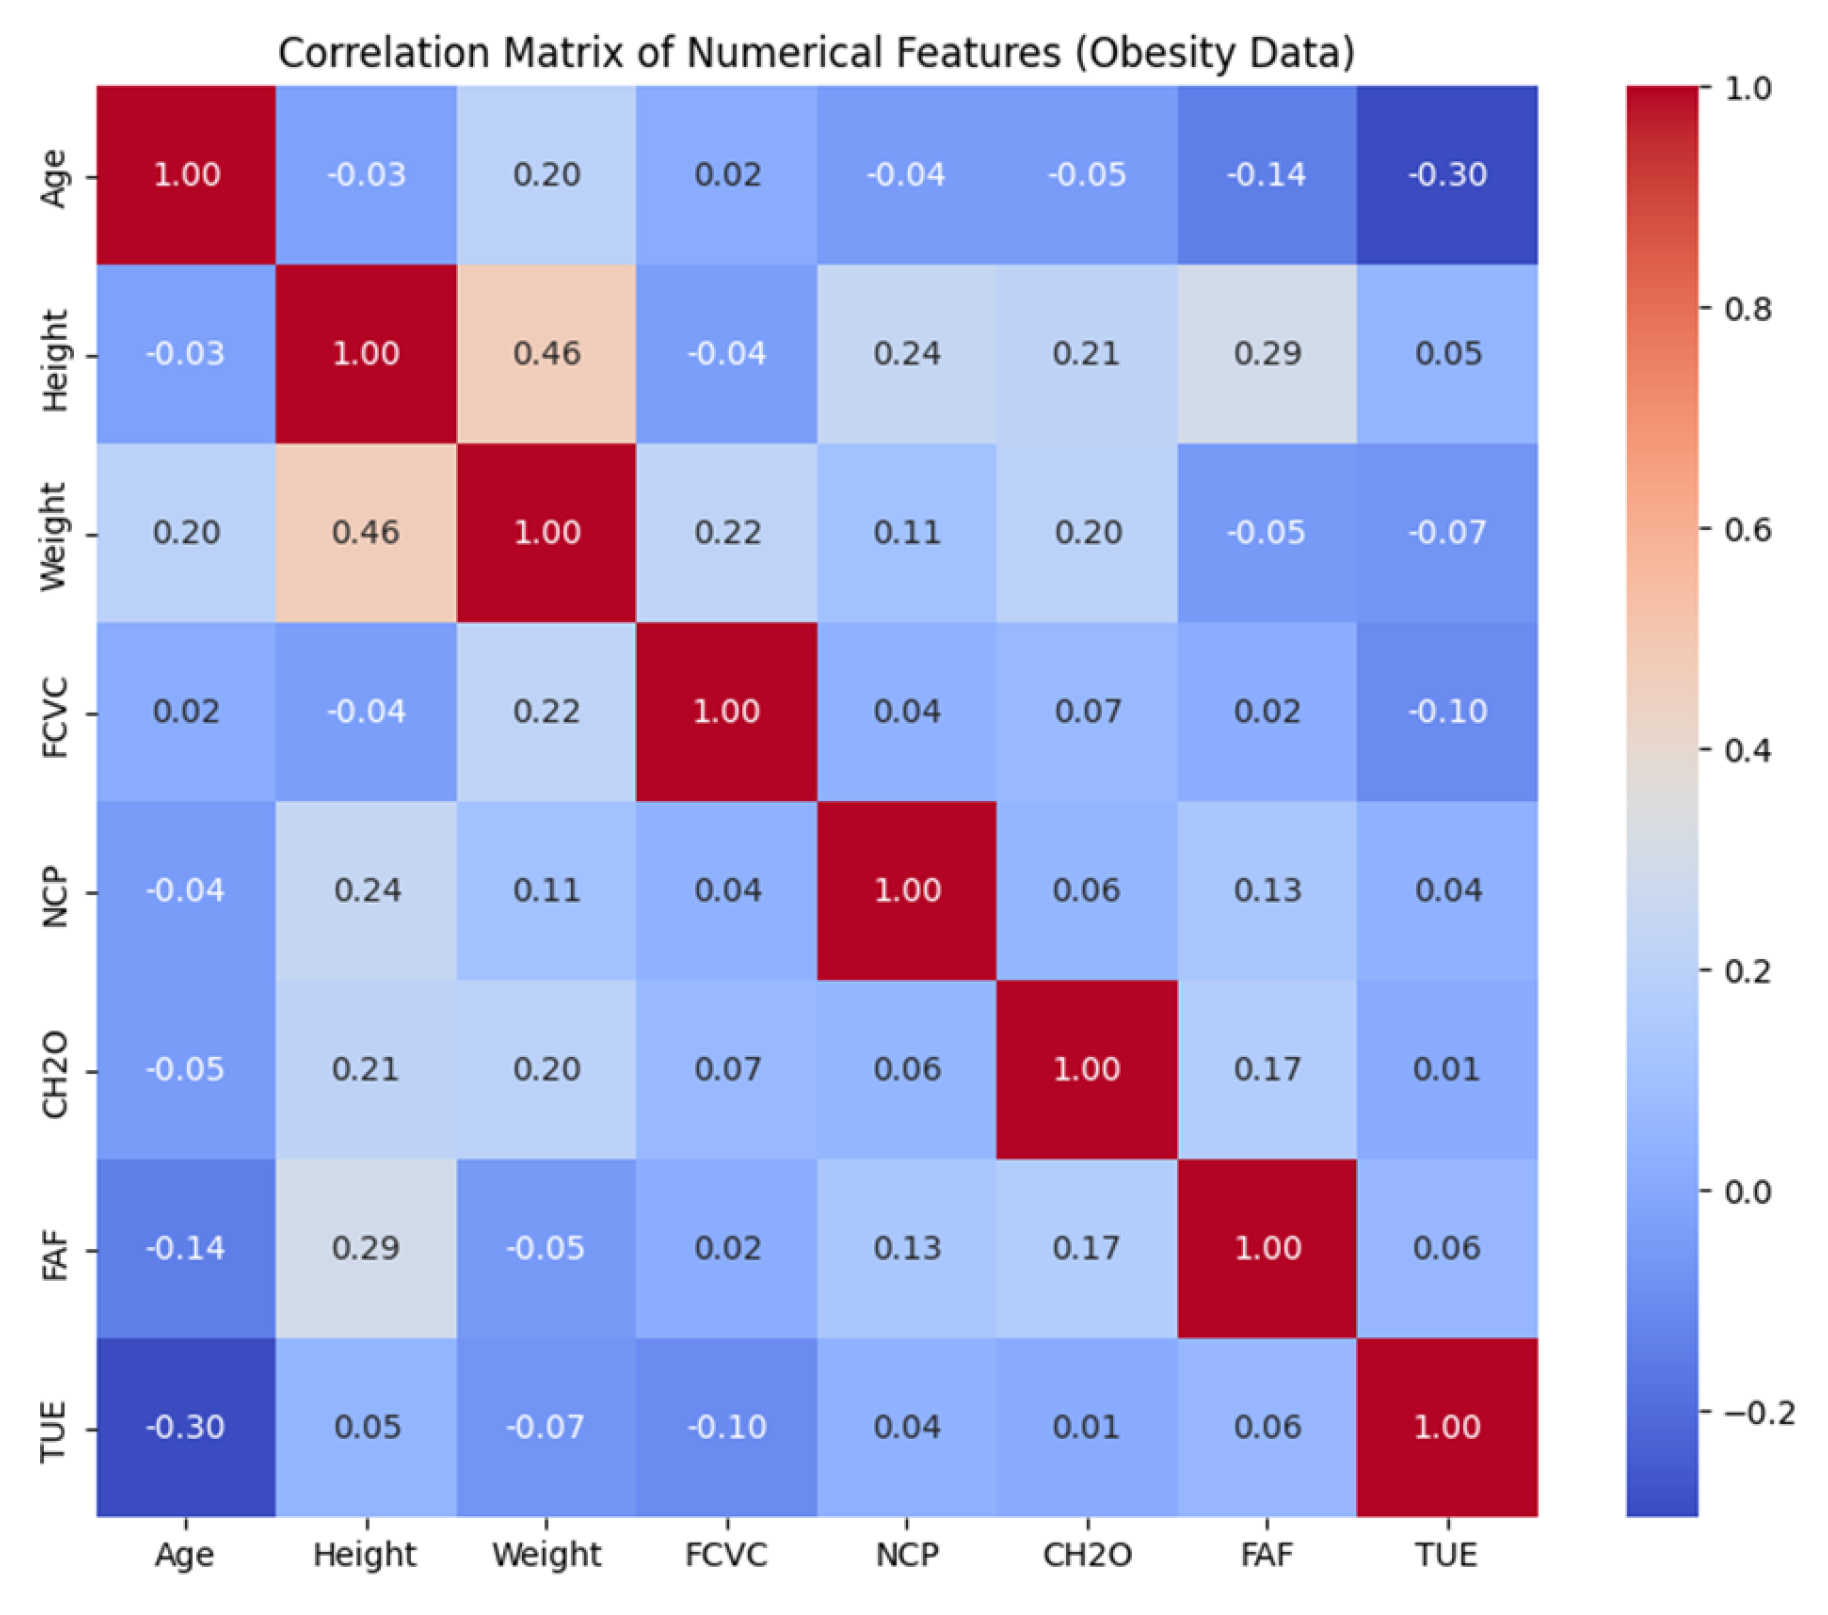
Table 2.
Model Accuracy.
| Model | Accuracy |
| LightGBM | 0.957447 |
| XGBoost | 0.952719 |
| Gradient Boosting | 0.950355 |
| DNN | 0.947991 |
| Random Forest | 0.940898 |
| Decision Tree | 0.914894 |
| Logistic Regression | 0.874704 |
| KNN | 0.825059 |
| Naive Bayes | 0.508274 |
Disclaimer/Publisher’s Note: The statements, opinions and data contained in all publications are solely those of the individual author(s) and contributor(s) and not of MDPI and/or the editor(s). MDPI and/or the editor(s) disclaim responsibility for any injury to people or property resulting from any ideas, methods, instructions or products referred to in the content. |
© 2026 by the authors. Licensee MDPI, Basel, Switzerland. This article is an open access article distributed under the terms and conditions of the Creative Commons Attribution (CC BY) license (http://creativecommons.org/licenses/by/4.0/).
Copyright: This open access article is published under a Creative Commons CC BY 4.0 license, which permit the free download, distribution, and reuse, provided that the author and preprint are cited in any reuse.