

Submitted:
14 September 2026
Posted:
15 September 2026
You are already at the latest version
Abstract
The early and accurate detection of cancer is crucial for improving survival outcomes and reducing treatment costs. Traditional diagnostic tools such as imaging and biopsies are often invasive, expensive, or impractical for widespread screening. Electronic Nose (E-nose) technology, designed to mimic the human olfactory system, has emerged as a promising non-invasive approach for detecting volatile organic compounds (VOCs) associated with cancer metabolism. This review provides a comprehensive overview of E-nose sensor technologies, including metal oxide semiconductors, conducting polymers, quartz crystal microbalance, surface acoustic wave, colorimetric, and electrochemical sensors. We explore the biological mechanisms of VOC production and their diagnostic relevance in exhaled breath, urine, and other bodily fluids. The integration of machine learning (ML) and deep learning (DL) techniques is discussed in detail, highlighting their role in preprocessing, feature extraction, and classification of cancer-related VOC signatures. Case studies in lung, breast, and kidney cancers demonstrate the potential of E-nose systems to achieve high diagnostic accuracy. However, key limitations such as small dataset sizes, sensor variability, environmental interference, and the lack of standardization- remain significant challenges. By summarizing recent advancements and identifying areas for improvement, this review aims to support future research in translating E-nose-based cancer diagnostics into scalable, real-world clinical applications.
Keywords:
electronic nose
; volatile organic compounds (VOCs)
; cancer diagnostics
; breathomics
; machine learning
; deep learning
; biosensors
; non-invasive screening
| BROADER CONTEXT |
| Cancer remains one of the defining healthcare challenges of this century, with growing incidence, persistent inequalities in access to screening, and substantial clinical and economic consequences when disease is detected late. These pressures have intensified the search for diagnostic approaches that are non-invasive, acceptable to patients, repeatable over time, and deployable beyond highly specialized settings. Cancer volatilomics addresses this need from a systems-level perspective by examining volatile organic compounds released through altered metabolism, inflammation, oxidative stress, microbiome activity, and host–tumor interactions. Rather than serving as isolated biomarkers, these chemical patterns may provide accessible physiological readouts that complement imaging, pathology, and molecular testing within precision medicine and early-detection strategies. Electronic nose platforms and artificial intelligence are emerging enabling technologies for capturing and interpreting such complex VOC signatures, offering a route toward portable pattern-based sensing. However, their clinical value is not yet established. Biological heterogeneity, environmental confounding, sensor drift, limited cohort diversity, protocol variability, and insufficient external validation continue to separate promising studies from reliable clinical implementation. Progress will require standardized sampling, transparent algorithms, multicenter prospective evaluation, and clear definitions of clinical use. If these challenges are addressed, VOC-based sensing could contribute to future cancer diagnostics that are more scalable, accessible, and integrated into routine care. |
1. Introduction
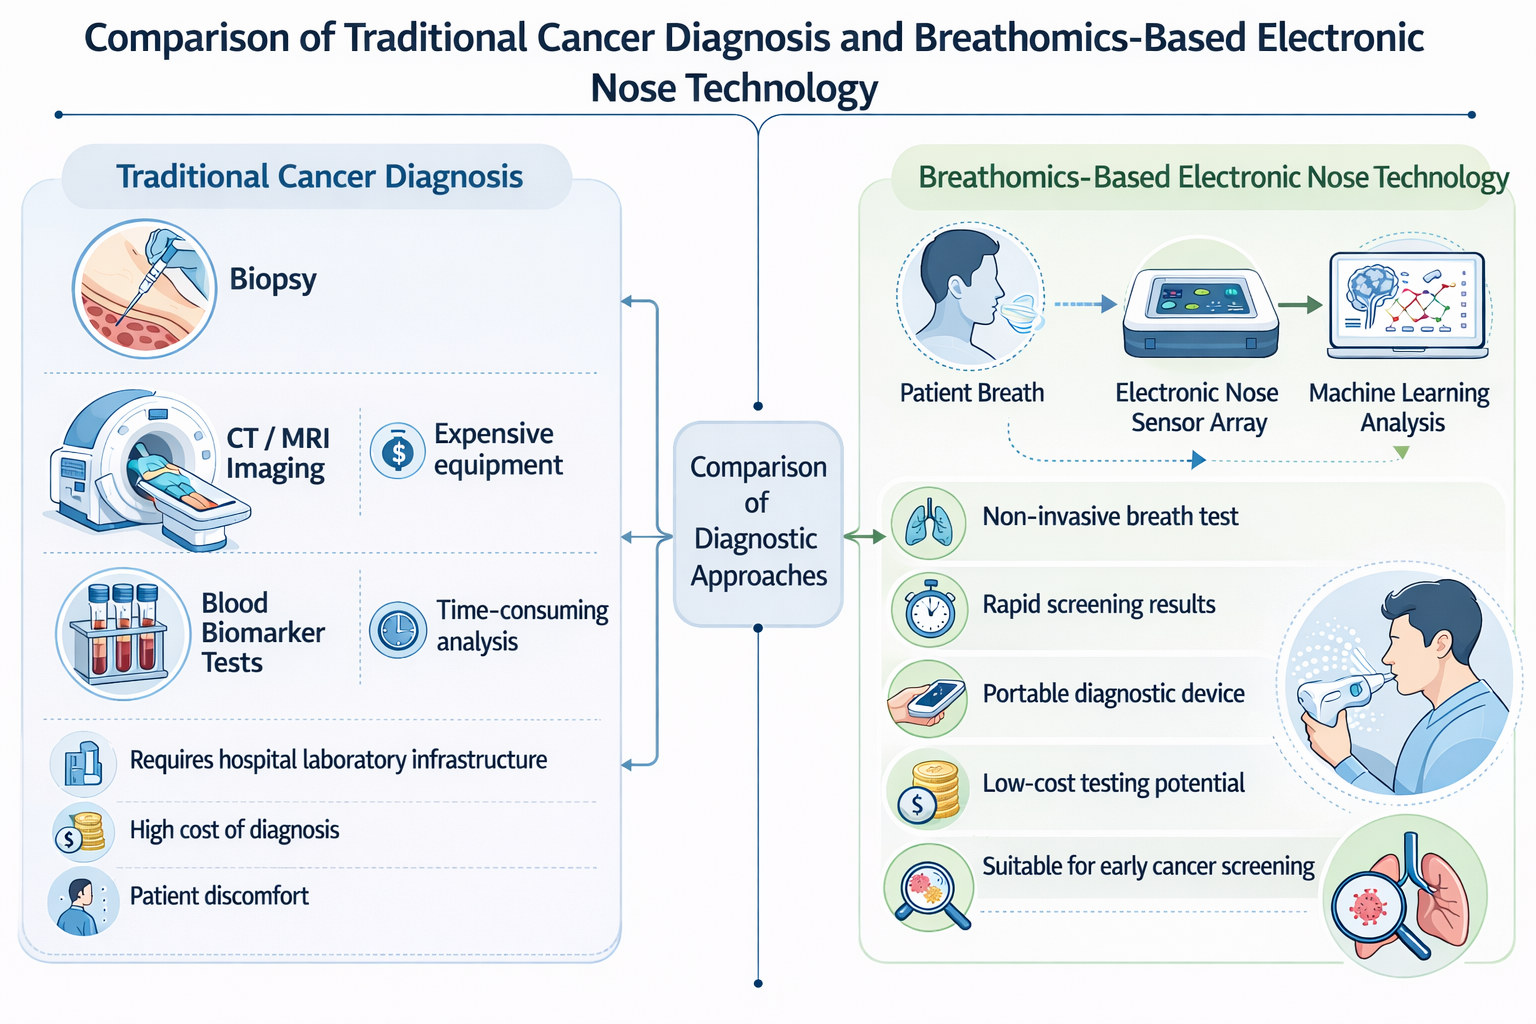
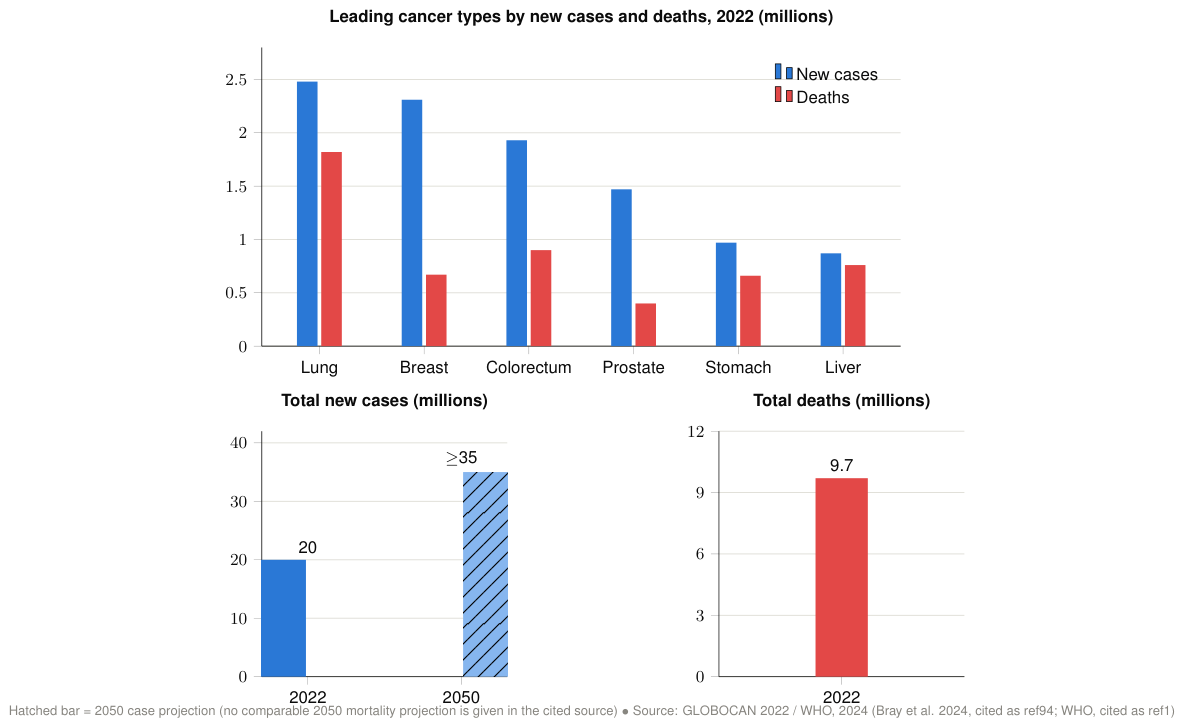
Cancer remains a major global health challenge. According to the WHO, an estimated 20 million new cancer cases and 9.7 million deaths occurred worldwide in 2022, and more than 35 million new cases are projected for 2050 [1]. Early diagnosis is therefore essential for improving survival and reducing treatment burden. However, conventional tools such as biopsy, CT, and MRI are often invasive, expensive, or impractical for widespread screening, motivating the search for non-invasive and rapid alternatives with high sensitivity and specificity [2,3]. Figure 1 compares conventional diagnostic approaches with breathomics-based electronic nose screening.
A promising alternative is the Electronic Nose (E-nose), which detects VOC patterns linked to altered metabolism [4].
2. Volatile Organic Compounds in Cancer Volatilomics
2.1. Definition and Diagnostic Relevance of Volatile Organic Compounds
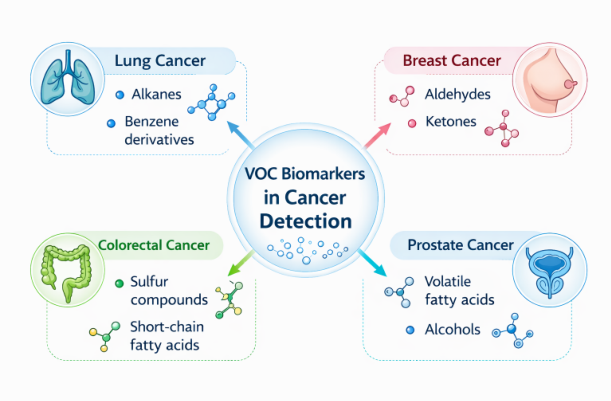
Volatile organic compounds (VOCs) are organic chemicals with high vapor pressure, meaning they readily transition into the gaseous phase at room temperature [5]. In the human body, VOCs can be detected in exhaled breath, skin emissions, urine, feces, and saliva [6]. These compounds may reflect metabolic activity or disease states, making them potential biomarkers for conditions such as lung cancer or diabetes [6,7]. Common examples include acetone, isoprene, and ethane. Figure 6 shows VOC biomarkers associated with different cancer types, while Figure 2 summarizes how these compounds are generated and transported to exhaled breath for detection.
However, the raw data generated by E-nose sensors is often complex, high-dimensional, and subject to noise, making manual interpretation impractical. This is where machine learning (ML) and deep learning (DL) techniques play a crucial role. ML algorithms are effective in handling structured data, identifying patterns, and classifying VOC signatures with high accuracy. DL models, particularly convolutional and recurrent neural networks, are capable of learning abstract features directly from raw sensor signals, thereby improving diagnostic precision and robustness [8]. The convergence of E-nose technology with ML and DL algorithms opens new horizons for early cancer detection. This combination offers a scalable, portable, and intelligent diagnostic approach that could be deployed in clinical settings, primary care, or even at-home screening systems. This review explores the current landscape of E-nose applications in cancer diagnosis, with a special focus on how ML and DL techniques are employed to analyze and interpret VOC data. By examining recent studies, technological advancements, and existing challenges, this paper aims to provide a comprehensive foundation for researchers and clinicians working at the intersection of biosensing and artificial intelligence in cancer diagnostics.
3. Electronic Nose Technologies
3.1. Principles and Definition of Electronic Nose Systems
The electronic nose, commonly referred to as the E-nose, is a device designed to detect and identify odours or flavours in a manner analogous to the human sense of smell. It employs an array of chemical sensors to generate a unique signal pattern, often described as an odour “fingerprint,” for each analyte. These patterns are subsequently analyzed using pattern recognition or machine learning techniques to identify or classify the detected odour.
3.2. Historical Evolution of the E-Nose
The development of the electronic nose dates back to the 1950s, with key milestones including early artificial olfaction prototypes in the 1980s, adoption of the term “electronic nose” by 1988, and commercial systems in the 1990s from companies such as AlphaMOS, Neotronics, and Aromascan. Over time, these platforms evolved from bulky laboratory instruments into more compact and energy-efficient systems used in food quality control, environmental monitoring, and medical diagnostics [4,9].
3.3. Operational Workflow of Electronic Nose Systems
Electronic nose systems generally operate through a three-stage process.
Sensing stage: In this stage, volatile compounds are generated and collected from the sample under controlled conditions. The sample, which may include exhaled breath, food emissions, or environmental air, is introduced into the sensor chamber to ensure consistent exposure for analysis.
Sensor response stage: The sensor array reacts to the presence of volatile compounds by undergoing measurable changes in physical or electrical properties, such as resistance, conductivity, or mass. For example, metal oxide semiconductor (MOS) sensors exhibit changes in conductivity upon gas exposure, while quartz crystal microbalance (QCM) sensors detect variations in mass, enabling the detection of very low concentrations of analytes.
Data analysis stage: Sensor responses are integrated into a characteristic fingerprint, which is analyzed using computational techniques such as artificial neural networks (ANNs), fuzzy logic, chemometrics, and pattern recognition algorithms. These models classify odours by comparing incoming patterns with previously trained datasets, enabling both identification and quantification of target compounds.
The complete detection process typically takes from a few seconds to several minutes, depending on the sensor type, exhalation profile, and environmental conditions. In practice, the software acts as the system’s “brain,” while the sensor array mimics biological olfactory receptors, enabling digital feature extraction and pattern recognition [9,10,11,12]. The overall workflow of an E-nose system for VOC-based diagnosis is illustrated in Figure 3.
The Electronic Nose Data Processing Pipeline is shown in Figure 4.
3.4. Sensor Technologies Used in Electronic Nose Systems
3.4.1. Metal Oxide Semiconductor (MOS)
Metal Oxide Semiconductor sensors constitute a pivotal technology in gas detection, leveraging variations in electrical resistance induced by molecular interactions on a heated metal oxide substrate. Metal Oxide Semiconductor (MOS) sensors function by detecting changes in electrical resistance resulting from interactions between gas molecules and a metal oxide surface, commonly comprising tin dioxide (SnO2), zinc oxide (ZnO), or tungsten trioxide (WO3). The detection mechanism is governed by gas adsorption and electron transfer processes [13].
When exposed to atmospheric oxygen, oxygen species adsorb onto the metal oxide surface and withdraw electrons from the conduction band, forming an electron-depletion layer that increases electrical resistance in n-type semiconductors such as SnO2. Reducing gases such as acetone or ethanol react with these adsorbed oxygen species and release electrons back into the conduction band, producing a measurable decrease in resistance. In contrast, oxidizing gases such as nitrogen dioxide (NO2) or ozone (O3) further withdraw electrons from the sensing material, increasing resistance. MOS sensors therefore require controlled thermal activation, typically from approximately 200∘C to more than 400∘C, to sustain adsorption, desorption, and surface redox reactions that govern gas detection [9,13,14].
Metal Oxide Semiconductor (MOS) sensors are widely used because they combine high VOC sensitivity, rapid response, low cost, and mechanical robustness, making them suitable for environmental, food, and medical sensing applications [15,16,17].
However, MOS sensors also have certain limitations. Their selectivity is often inadequate, as multiple gases can induce similar resistance changes, leading to potential inaccuracies in detection. Moreover, these sensors are highly sensitive to environmental factors such as humidity, which can significantly alter their performance. Another significant drawback is their high power consumption due to the need for elevated operational temperatures (200–500∘C) to ensure proper functionality. Despite these challenges, MOS sensors remain a valuable tool for gas sensing, balancing affordability with effectiveness across various domains [15,17].
3.4.2. Conducting Polymer (CP) Sensors
Conducting polymer sensors offer a versatile and efficient solution for gas detection by monitoring conductivity changes in polymer matrices exposed to gaseous compounds. CP sensors operate by utilizing organic polymers such as polypyrrole and polyaniline, which exhibit changes in electrical conductivity when exposed to gaseous molecules [18,19]. These interactions alter the doping levels or induce swelling within the polymer matrix, leading to measurable variations in electrical resistance. This change is analyzed to identify specific gases and odours.
Gas molecules penetrate the polymer structure, causing physical swelling or facilitating charge transfer processes. These interactions modify the polymer’s electrical resistance, which serves as an indicator for gas detection. Unlike Metal Oxide Semiconductor (MOS) sensors, CP sensors function effectively at ambient temperature because there is no need for a heater. Conductive polymer gas sensors therefore exhibit considerably lower power consumption [20].
CP sensors are attractive because they operate near room temperature, can be chemically tailored for target analytes, and are relatively inexpensive to fabricate, which supports portable E-nose deployment [21,22].
However, CP sensors also have certain limitations. They tend to be sensitive to humidity, which can influence measurement accuracy. Furthermore, long-term stability may be compromised due to gradual performance drift over extended periods of usage [21].
3.4.3. Quartz Crystal Microbalance (QCM) Sensors
Quartz Crystal Microbalance sensors provide an advanced method for gas detection by leveraging frequency shifts induced by mass variations [23]. Their precision, sensitivity, and versatility make them indispensable across multiple scientific and industrial domains.
QCM sensors function by measuring frequency shifts in an oscillating quartz crystal to detect changes in mass. The sensor comprises a quartz crystal vibrating at a specific resonant frequency. When gas molecules adsorb onto a coated surface [24], often made from polymers or zeolites, the additional mass causes a reduction in frequency. This change is analyzed using the Sauerbrey equation [25,26], providing a precise method for gas detection:
where
- = resonant frequency of the fundamental mode (Hz),
- = frequency change (Hz),
- = mass change (g),
- A = piezoelectrically active crystal area (cm2),
- = density of quartz ( g/cm3),
- = shear modulus of quartz for AT-cut crystal ( g·cm−1·s−2).
Gas molecules adhere to the coated crystal surface, increasing its mass. The increased mass leads to a decrease in the resonant frequency, which is then measured to determine the presence and concentration of gases. QCM sensors can detect even nanogram-level mass changes, making them one of the most sensitive analytical techniques available. Unlike other gas sensing methods that require elevated temperatures, QCM sensors function effectively at ambient conditions, making them energy efficient [27].
QCM sensors provide ultra-sensitive, label-free detection with minimal sample preparation and can be customized through selective coatings [28,29], increasing their versatility in applications such as medical diagnostics, food safety assessment, and environmental monitoring. Additionally, their ability to operate at room temperature enhances efficiency and reduces energy consumption. However, certain limitations exist, notably their susceptibility to temperature fluctuations, which can impact measurement stability [30]. Furthermore, consistent and stable coatings are required to maintain long-term accuracy and reliability.
3.4.4. Surface Acoustic Wave (SAW) Sensors
Surface Acoustic Wave sensors provide an advanced method for gas detection by measuring variations in acoustic wave propagation. SAW sensors operate by detecting changes in acoustic wave propagation caused by gas adsorption [16]. These sensors utilize a piezoelectric substrate, such as lithium niobate (LiNbO3), with interdigital transducers that generate surface acoustic waves [31,32]. When gas molecules interact with the sensor’s coated surface, they alter the wave velocity, amplitude, or frequency, leading to measurable frequency or phase shifts. This change is analyzed to determine gas presence and concentration.
The piezoelectric substrate generates acoustic waves that travel across its surface. Gas adsorption modifies the wave velocity or frequency, providing a basis for gas detection. SAW sensors can detect gases at parts-per-million (ppm) or parts-per-billion (ppb) levels, making them highly effective for trace gas analysis. Unlike many other gas sensing technologies that require elevated temperatures, SAW sensors function efficiently at ambient temperature, thereby reducing energy consumption.
SAW sensors are highly sensitive, enabling real-time gas detection with rapid response times. Their low power consumption makes them suitable for continuous monitoring applications such as environmental surveillance and industrial safety [16,32]. Additionally, specialized coatings can be applied to enhance selectivity, allowing for targeted gas detection. However, these sensors also have certain drawbacks. They tend to be expensive due to fabrication complexity and require careful shielding from environmental noise, as external vibrations or temperature fluctuations can interfere with measurements [16].
3.4.5. Colorimetric Sensor Arrays
Colorimetric sensor arrays represent a promising frontier in medical diagnostics, offering rapid, accessible, and cost-effective disease detection through simple colour changes in chemical dyes. These arrays leverage chemically sensitive dyes that change colour upon exposure to specific gases or volatile organic compounds (VOCs). By creating unique colour patterns corresponding to different gases, these sensors enable rapid, non-invasive medical diagnostics, particularly for diseases that alter breath composition, metabolic processes, and bacterial activity [33].
Colorimetric sensor arrays detect gases or disease biomarkers through gas–dye interactions, resulting in measurable optical shifts in light absorption and reflection. These changes are captured using cameras or spectrophotometers and analyzed to identify disease indicators. When exposed to specific VOCs, chemically sensitive dyes undergo structural modifications, leading to a visible colour change [34]. The resulting colour pattern serves as a unique fingerprint for different gases or disease biomarkers, enabling early detection.
Colorimetric responses are captured digitally and processed using machine learning algorithms to match predefined disease profiles. Advanced artificial intelligence (AI) techniques can further improve detection accuracy, making these systems increasingly reliable for real-time medical screening.
Certain cancers, such as lung cancer, produce unique VOCs that can be detected through breath analysis. Colorimetric arrays can identify these biochemical markers by recognizing distinct colour shifts, enabling non-invasive cancer screening [33]. Patients with diabetes often exhale acetone, a metabolic by product of fat oxidation. Colorimetric sensors can detect this biomarker, providing an alternative to invasive blood glucose testing [35]. Respiratory diseases alter the composition of exhaled breath, producing specific VOCs detectable through colorimetric sensors. Conditions such as COVID-19, tuberculosis, and asthma have identifiable volatile markers, enabling rapid screening and diagnosis [36].
3.4.6. Electrochemical Sensors
Electrochemical sensors represent a transformative technology in medical diagnostics, offering high precision, portability, and real-time disease monitoring. Electrochemical sensors are widely recognized for their ability to detect gases and biomolecules through redox reactions occurring at electrodes immersed in an electrolyte [37,38]. These sensors generate a measurable electrical current or potential, which is directly proportional to the concentration of the target gas or analyte. Electrochemical sensors function by facilitating oxidation or reduction reactions between target gases or biomolecules and electrodes [39]. These reactions generate an electrical signal, which is analyzed to determine the presence and concentration of disease related compounds. A target gas (e.g., carbon monoxide (CO), nitric oxide (NO)) undergoes oxidation or reduction at the electrode surface [40]. This reaction produces a current or potential shift, which is proportional to the gas concentration. The sensor consists of working, reference, and counter electrodes submerged in an electrolyte [39]. When a disease biomarker interacts with the electrode, it triggers a redox reaction, altering the electrical signal.
Beyond the canonical sensor families summarized above, the broader E-nose literature also covers environmental MOS deployments, conducting-polymer platforms for chemical and biomedical sensing, QCM interfaces for pharmaceutical and biogas analysis, SAW systems for diabetes and vapor detection, colorimetric and optoelectronic arrays for clinical and food applications, electrochemical platforms for food and environmental monitoring, and several representative commercial instruments such as Cyranose 320, portable Airsense systems, Alpha-MOS FOX devices, EOS 835, Aeonose, and KAMINA [41,42,43,44,45,46,47,48,49,50,51,52,53,54,55,56,57].
A wide range of sensor types has been employed in electronic nose (E-nose) systems. In this review, we have focused on the most commonly utilized and technically significant sensor technologies. While a primary objective of this paper is to examine the working principles and applications of E-nose sensors, the broader aim is to provide a comprehensive review of recent advancements in cancer detection using E-nose systems, particularly those enhanced by machine learning (ML) and deep learning (DL) techniques. Figure 5 presents the major sensor technologies used in electronic nose systems; the main categories are also summarized in Table 1.

Table 1.
Electronic Nose Sensor Types and Diagnostic Applications.
| Sensor Type | Applications | Representative Studies |
|---|---|---|
| Metal Oxide Semiconductor (MOS) | Food quality, medical diagnostics, and environmental monitoring | MOS in food analysis [9,13]; ecological monitoring [9,41]; medical diagnosis [17] |
| Conducting Polymer (CP) | Food quality, e-nose systems, environmental sensing, and medical diagnostics | CP in food analysis [19]; environmental applications [42]; medical applications [43] |
| Quartz Crystal Microbalance (QCM) | VOC detection, environmental monitoring, medical diagnostics, and forensic analysis | QCM in medical analysis [11,26]; ionic-liquid and coated QCM platforms [28,44] |
| Surface Acoustic Wave (SAW) | Environmental monitoring, medical diagnosis, air-quality monitoring, and vapor detection | SAW in medical diagnosis [45]; SAW for BTX vapor monitoring [32]; general SAW sensing principles [31] |
| Colorimetric Sensor Arrays | General chemical sensing, food analysis, breath diagnostics, and respiratory disease screening | Colorimetric fusion arrays [46]; rhinosinusitis diagnosis [47]; optoelectronic nose platforms [48] |
| Electrochemical Sensors | Food quality monitoring, environmental analysis, and portable diagnostics | Portable electrochemical e-nose systems [49]; environmental electrochemical sensing platforms [50] |
Table 2.
Representative Electronic Nose Devices and Platform Characteristics.
| Device | Portability | Sensors | Usage |
|---|---|---|---|
| Cyranose 320 [51] | Hand-held | 32 carbon-black polymer composite sensors | Food quality analysis and medical breath screening |
| PEN3 [52] | Benchtop | Metal oxide sensor array | Food analysis and environmental monitoring |
| FOX 3000 [53] | Lab-based / benchtop | MOS sensor array | Food analysis, environmental assessment, and laboratory diagnosis workflows |
| EOS 835 [54,55] | Benchtop / hand-held | Proprietary sensor array | R&D, environmental analysis, and diagnostic studies |
| Aeonose [56] | Hand-held | Proprietary nanocomposite chemosensor arrays | Breath diagnosis |
| DiagNose [55] | Hand-held | Carbon-polymer / composite sensor array | Breath diagnosis |
| KAMINA Micronose [57] | Prototype | 12 metal-oxide sensors and a thermally modulated SnO2 gas sensor | Disease diagnosis, fire / air monitoring, and food analysis |
With a foundational understanding of E-nose architecture and sensor mechanisms now established, the subsequent sections explore how these sensors detect volatile organic compounds (VOCs) and how data-driven approaches are applied to extract disease-specific patterns for diagnostic purposes.
3.5. Biological Origins and Transport of Endogenous VOCs
VOCs are generated through several endogenous processes, with contributions from exogenous sources [58]. Numerous studies have characterized the volatile organic compounds (VOCs) produced in the human body, and distinct biochemical mechanisms are responsible for different VOC classes.
Metabolic Processes:
Isoprene, a major hydrocarbon in human breath, is produced via the mevalonate pathway in cholesterol biosynthesis. Sukul et al. [59] showed that a homozygous IDI2 stop-gain mutation prevents the conversion of isopentenyl diphosphate to dimethylallyl diphosphate, confirming its origin in muscular lipolytic cholesterol metabolism, especially during physical exertion. Acetone is produced during ketogenesis, where the liver breaks down fatty acids, particularly under ketotic conditions like fasting or diabetes [60].
Oxidative Stress:
Oxidative stress, caused by reactive oxygen species (ROS), damages cellular components, leading to VOC production. Lipid peroxidation, where ROS attacks polyunsaturated fatty acids, produces hydrocarbons like ethane and pentane [6] . In obesity, excess body fat promotes ROS, leading to VOCs through lipid peroxidation, protein oxidation, or DNA damage, serving as biomarkers for metabolic alterations. The VOC profile (GC-MS) revealed a trans-2-hexenol increase, especially in A549 lung cancer cells [61]. This is a novel lipid peroxidation product from animal cells. Based on the absolute quantification data, trans-2-hexenol increased in parallel with the number of A549 cancer cells incubated. The qPCR data imply that ADH1c potentially plays an important role in the conversion into trans-2-hexenol.
Microbial Activity:
Microorganisms in the gut and on the skin significantly contribute to VOC production. The gut microbiome produces volatile fatty acids, indoles, and phenols. Bacteroides ferment carbohydrates to produce ethanoic, propi-onic, butanoic, pentanoic, and hexanoic acids in feces. A total of 549 VOCs have been reported in saliva, of which hydrocarbons make up a significant proportion of these (34%) [62].
Dietary Intake and Exogenous Sources:
Dietary intake contributes to VOCs, with compounds like terpenes absorbed from food and appearing in urine and breath. Phenol and p-cresol increase with higher protein diets due to gut microbiome activity on tyrosine [61]. Exogenous VOCs, absorbed from the environment (e.g., benzene from tobacco smoke), can also be exhaled or emitted, complicating biomarker analysis.
Figure 6.
Examples of volatile organic compound (VOC) biomarkers associated with different cancer types including lung, breast, colorectal, and prostate cancers. Distinct VOC patterns can be detected using breathomics technologies.
Figure 6.
Examples of volatile organic compound (VOC) biomarkers associated with different cancer types including lung, breast, colorectal, and prostate cancers. Distinct VOC patterns can be detected using breathomics technologies.
Many VOC-generating mechanisms remain under investigation, particularly the links between specific VOC signatures, cellular origin, and disease state. The interplay among metabolism, oxidative stress, host microbiology, and environmental exposure still requires further clarification.
4. Electronic Nose Systems for Cancer Diagnosis
4.1. Cancer Detection Principles Using Electronic Nose Systems
An Electronic Nose (E-nose) identifies cancer by detecting VOC patterns produced by cancer cells, found in exhaled breath or blood plasma. These compounds, linked to metabolic changes, create a “breath print” that E-nose analyses to distinguish cancerous from healthy samples. However, e-noses typically do not identify single chemicals but learn patterns across sensors [11,62,63]. The raw sensor voltages (time series) are preprocessed (baseline calibration, filtering, and drift compensation) [64] and then reduced to features (e.g., principal components) before classification.
4.2. Machine Learning Approaches for Cancer Detection
Once an E-nose captures a breath print, statistical and machine learning (ML) methods are used to classify it. The typical workflow is: the preprocessing of raw sensor signals (baseline correction, drift compensation, nor-malization), followed by feature extraction (e.g., computing principal components of the sensor readings). Then, a classifier (SVM, LDA, K-NN, Random Forest, etc.) is trained on labeled cancer versus control breath prints [64,65,66,67,68,69].
Many studies employ dimensionality reduction techniques. Such as PCA [70], LDA, Fisher discriminant, or nonlinear embeddings like t-SNE, to visualize or compress the data, and then feed those features into a classifier [64]. Common classifiers include support vector machines (SVM), logistic regression, k-nearest neighbors, Random Forests, and shallow artificial neural networks (ANNs). For example, Li et al. collected breath samples from 24 lung cancer patients and 28 non-cancer controls with a 14-sensor e-nose (8 MOS, 4 electrochemical, and other gas sensor types) and compared PCA, LDA, Laplacian Eigenmaps, local linear embedding, and t-SNE for feature reduction, then used fuzzy K-NN and SVM for classification; their best-performing combination (LDA with fuzzy 5-NN) reached 91.58% sensitivity, 91.72% specificity, and 91.59% accuracy [67]. Many recent human studies are small to moderate (dozens to a few hundred subjects). Researchers typically use cross-validation (leave-one-out or k-fold) to estimate accuracy. A meta-analysis of 52 studies found pooled sensitivity of 90% (95% CI: 88–92%) and specificity of 87% (95% CI: 81–92%) for E-nose cancer detection across tumor types, although pooled estimates varied considerably by cancer type [71]. For instance, in breast cancer detection, Díaz de León-Martínez et al. applied a 32-sensor Cyranose 320 with PCA, Canonical Discriminant Analysis (CDA), and SVM on 262 breast cancer patients vs 181 healthy controls, achieving 100% sensitivity and specificity (AUC = 1.00) by internal ROC-based cross-validation, with 98.7% accuracy maintained in external validation [72].
4.3. Deep Learning Approaches for Cancer Detection
Deep learning (DL) methods have begun to be applied to e-nose data, especially for lung cancer. These approaches can process raw or minimally processed sensor data, often as time series or images [8]. For example, one study turned each breath sample’s 14-sensor output into a 14×16×16“image” and trained a 3-layer convolutional neural network (CNN) to classify lung cancer [8]. Using data augmentation techniques (adding noise, domain-generalized samples) and fine-tuning, their CNN model achieved ROC AUC up to 0.95 on an independent test set. Deep networks can capture complex non-linear patterns in breath prints. DL strategies include autoencoders (for denoising or feature extraction) and recurrent neural networks for time series, although fewer studies report these [69].
The general trend is that deep models can improve classification if enough data are available and domain shifts (between devices or sites) are handled. For instance, semi-supervised domain generalization and noise-shift augmentation (NSA) improved cross-site validation in the CNN study [8]. As E-nose datasets grow, we may see the emergence of more advanced architectures. For example, LSTM for dynamic sensor signals, transfer learning across devices.
5. Cancer-Specific Diagnostic Applications
The global cancer burden remains high and is projected to keep rising, underscoring the need for rapid and scalable diagnostic tools [73,74,75]. However, the evidence base for electronic nose-based cancer detection remains heterogeneous across tumor types: a PRISMA-guided systematic review of 60 E-nose cancer studies found the strongest and most consistent evidence for lung cancer, with substantially thinner and more variable support for other tumor types [76]. Studies differ substantially in cohort size, control-group composition, sample matrix, sensor platform, preprocessing strategy, and validation design. Therefore, cancer-specific performance estimates should be interpreted as indicators of feasibility rather than as definitive proof of screening readiness.
5.1. Validation Design and Sources of Bias in E-Nose Cancer Studies
The scientific credibility of E-nose cancer diagnostics depends less on the highest reported accuracy and more on whether validation reflects the intended clinical use. Internal validation, including k-fold cross-validation, leave-one-out testing, or random train–test splitting, is useful for early model development but cannot establish clinical generalizability by itself. These approaches often reuse the same recruitment site, operators, sampling materials, storage conditions, and device generation across both training and testing. As a result, the model may learn reproducible study conditions rather than cancer-specific VOC biology. External validation is more demanding because it evaluates a locked model in new participants, ideally from different centers, with prespecified thresholds and clinically realistic control groups. For translational oncology, external validation should be considered essential before claims of screening readiness, particularly because cancer prevalence, tumor stage distribution, smoking status, comorbid disease, and prior treatment can all change model performance.
Data leakage is a major but underreported risk in E-nose studies. Leakage can occur when repeated measurements from the same participant are split across training and test sets, when preprocessing parameters are estimated using the full dataset before splitting, or when feature selection is performed before validation rather than inside the training loop. It can also arise from batch identifiers, collection date, ambient-air background, storage bag type, or device calibration state. Because E-nose signals are high-dimensional and sensitive to environmental conditions, even subtle leakage can produce apparently excellent discrimination that disappears in prospective testing. Study reports should therefore specify patient-level splitting, blinded test-set handling, preprocessing order, feature-selection procedure, and whether replicate samples were kept within the same validation fold.
Figure 7.
Global cancer burden, 2022. Top: new cases and deaths for the six leading cancer types worldwide (lung, breast, colorectum, prostate, stomach, and liver) [77]. Bottom: total new cancer cases are projected to rise from 20 million in 2022 to more than 35 million by 2050, alongside 9.7 million cancer deaths recorded in 2022 [1,77]; a comparable 2050 mortality projection is not reported in the cited sources. These trends underscore the need for scalable, non-invasive screening approaches.
Figure 7.
Global cancer burden, 2022. Top: new cases and deaths for the six leading cancer types worldwide (lung, breast, colorectum, prostate, stomach, and liver) [77]. Bottom: total new cancer cases are projected to rise from 20 million in 2022 to more than 35 million by 2050, alongside 9.7 million cancer deaths recorded in 2022 [1,77]; a comparable 2050 mortality projection is not reported in the cited sources. These trends underscore the need for scalable, non-invasive screening approaches.
Healthy-control bias is another common source of inflated performance. A model that separates advanced cancer patients from young healthy volunteers may not solve the clinical problem faced by oncologists, pulmonologists, radiologists, or primary-care physicians. Screening and triage require discrimination against realistic alternatives: benign pulmonary nodules, COPD, infection, inflammatory disease, benign breast conditions, renal cysts, hematuria, chronic kidney disease, urinary tract infection, medication effects, and post-treatment changes. These conditions can alter VOC profiles through inflammation, oxidative stress, microbiome shifts, renal handling of metabolites, or altered ventilation. Therefore, disease-control cohorts are not optional; they define whether an E-nose test detects cancer or merely detects illness.
Batch effects and sensor drift further complicate interpretation. VOC measurements may vary with humidity, temperature, ambient air, fasting status, sampling flow, storage time, adsorbent materials, and sensor aging. MOS, polymer, QCM, SAW, electrochemical, and colorimetric platforms each have different drift mechanisms, but all can show temporal instability. If all cancer samples are collected in one period and controls in another, a classifier may learn time-dependent drift rather than biology. Robust studies should randomize sample order, record environmental metadata, include calibration checks, use ambient-air correction, report excluded or failed samples, and evaluate performance across time. Small datasets amplify every bias above: they limit stratification by stage, histology, sex, smoking, treatment, and comorbidity, while encouraging overfitting by flexible ML or DL models. Consequently, small single-center accuracy estimates should be treated as feasibility signals, not as evidence of clinical utility.
Table 3.
Evidence Summary of Representative Electronic Nose Cancer Diagnostic Studies.
| Cancer type | Sample type | Cohort size | Sensor platform | AI method | Sensitivity | Specificity | Validation design | Key limitation |
|---|---|---|---|---|---|---|---|---|
| Lung cancer | Exhaled breath | 335 participants: 165 cancer, 170 non-cancer | Cyranose 320 polymer-composite array | Support vector machine (SVM) | 88.9% in 75/25 split | 66.7% in 75/25 split | Internal train–test split with cross-validation; additional comparisons with healthy controls | Specificity decreased in heterogeneous controls; risk of optimistic estimates when healthy controls dominate [78] |
| Lung cancer | Exhaled breath | 475 participants: 252 cancer, 223 non-cancer (smoker and non-smoker subgroups) | Cyranose 320 polymer-composite array | Logistic regression analysis (LRA) | 95.8–96.2% | 90.6–92.3% | Internal model development stratified by smoking status; no independent external test cohort | Higher accuracy than the SVM-based study above despite an overlapping cohort and methodology, illustrating cross-study comparability limits [79] |
| Lung cancer | Exhaled breath sensor signals | Small-to-moderate E-nose datasets assembled across devices/sites | Multi-sensor E-nose array converted to structured signal maps | CNN with noise-shift augmentation and domain generalization | Not consistently comparable across cohorts | Not consistently comparable across cohorts | Independent test evaluation with augmentation and cross-site robustness analysis | Deep learning performance depends strongly on domain shift, sampling protocol, and dataset size [8,80,81] |
| Breast cancer | Exhaled breath | Exploratory clinical cohort | Chemical nose / E-nose platform | Pattern-recognition classifier | Reported as feasible, study-specific | Reported as feasible, study-specific | Exploratory case-control validation | Systemic VOC signal may be confounded by menopausal status, treatment, diet, and metabolic factors [82] |
| Breast cancer | Urine VOCs | 90 participants (case-control) | GC-MS urinary volatilome with electronic-nose-inspired sensor | Machine-learning classification | 100.0% | 85.7% | Internal validation in a single-center urine-based case-control cohort (N = 90) | Small single-center cohort; urinary VOCs may reflect non-cancer metabolic, inflammatory, microbiome, or medication effects [83] |
| Kidney cancer | Urine VOCs | 252 participants: 110 renal cancer, 142 controls | Urinary electronic nose volatilome analysis | PCA with canonical discriminant analysis | 71.8% | 89.4% | Internal model development and validation in a single urine-based cohort | Moderate sensitivity and limited evidence in benign renal disease or clinically realistic differential diagnoses [84] |
| Renal disease context | Exhaled breath / renal VOCs | Review-level synthesis across kidney disease studies | Multiple E-nose and VOC-analysis systems | PCA, SVM, random forest, and related methods | Not applicable | Not applicable | Narrative synthesis of renal-disease E-nose studies | Evidence mainly concerns chronic kidney disease rather than renal malignancy and should not be generalized directly [85,86] |
5.2. Potential Clinical Roles of Electronic Nose Systems
Electronic nose systems should not be framed as direct replacements for imaging, pathology, or molecular diagnostics. Their most plausible near-term value is as a low-burden, non-invasive adjunct that can improve risk stratification when used in a defined clinical pathway. In population screening, an E-nose test would need very high specificity as well as adequate sensitivity, because false positives could generate substantial downstream imaging, biopsy, cost, and anxiety. Screening applications are therefore the most demanding and should be reserved for models validated prospectively in the intended population, with decision thresholds chosen according to disease prevalence and acceptable harm.
Triage is a more realistic early clinical role. In symptomatic patients or high-risk groups, E-nose testing could help prioritize diagnostic imaging, specialist referral, or repeat surveillance when combined with age, smoking history, symptoms, radiologic findings, renal function, or other biomarkers. For lung cancer, this might mean adjunctive risk assessment before or after low-dose computed tomography. For breast cancer, it might support risk stratification after indeterminate imaging rather than replace mammography. For kidney cancer, urine-based VOC analysis may be more appropriate as a biomarker-discovery or adjunctive risk tool than as a stand-alone screen.
Monitoring and treatment response assessment may be especially attractive because each patient can serve as their own longitudinal reference. Serial VOC patterns could potentially identify recurrence, progression, infection, treatment toxicity, or response to systemic therapy before conventional reassessment, but this requires careful separation of tumor biology from treatment-related inflammation, diet, microbiome changes, and medication exposure. Longitudinal studies should therefore use prespecified time points, stable devices, repeatability metrics, and correlation with imaging, pathology, circulating biomarkers, and clinical outcomes. The strongest translational pathway is likely complementary use: E-nose outputs integrated with existing diagnostics rather than interpreted alone. In such multimodal workflows, the test should be judged by whether it changes decisions safely, reduces unnecessary procedures, improves timeliness, or adds independent prognostic or predictive information beyond standard care.
5.3. Electronic Nose-Based Detection of Lung Cancer
Lung cancer is the most extensively investigated indication for E-nose-based cancer diagnostics because exhaled breath provides a direct and clinically accessible matrix for VOC sampling. The biological rationale is credible: tumor metabolism, oxidative stress, inflammation, smoking exposure, and airway remodeling can all alter breath VOC patterns. Nevertheless, this same biological complexity creates a major interpretive challenge. Breath signatures attributed to lung cancer may also reflect smoking status, chronic obstructive pulmonary disease, infection, medication use, diet, occupational exposure, or sampling conditions. Consequently, studies that compare lung cancer patients only with healthy volunteers may overestimate diagnostic performance relative to the more difficult clinical task of distinguishing cancer from benign pulmonary disease.
Current studies suggest that E-nose systems can discriminate lung cancer from non-cancer controls with encouraging sensitivity and specificity, but reported performance varies according to the validation strategy and control population. In a Cyranose 320 study using support vector machine (SVM) analysis, Tirzite and colleagues evaluated 335 participants, including 165 lung cancer patients and 170 non-cancer participants. When all data were used for model training and testing, the cancer versus non-cancer model achieved 87.3% sensitivity and 71.2% specificity. In a 75%/25% training-test split, sensitivity remained similar at 88.9%, but specificity was 66.7%, with cross-validation accuracy of 69.7% and class accuracy of 75.5% [78]. These results are important because they illustrate both the feasibility of breath-based classification and the persistent problem of modest specificity when clinically heterogeneous controls are used. False-positive results would be consequential in screening pathways, potentially increasing unnecessary imaging, follow-up testing, and patient anxiety.
Diagnostic estimates improved when lung cancer patients were compared with healthy volunteers: the same study reported sensitivity of 97.8% and specificity of 68.8% in the 75%/25% split, with class accuracy of 90.2% [78]. This contrast highlights a recurring limitation in E-nose oncology studies. Models can perform well when the classification task is biologically simple, but screening applications require performance against realistic differential diagnoses, including COPD, benign nodules, infection, and inflammatory lung disease.
In a separate, larger cohort, the same research group applied logistic regression analysis (LRA) to Cyranose 320 breath prints from 475 participants (252 lung cancer patients and 223 non-cancer patients, including healthy volunteers and patients with COPD, asthma, pneumonia, and other lung diseases), analyzed as non-smoker and smoker subgroups. Sensitivity and specificity reached 96.2% and 90.6% among non-smokers, and 95.8% and 92.3% among smokers [79]. Although these figures are higher than the SVM-based estimates above, they should not be read as evidence that LRA is a superior method: the two studies used different statistical approaches, different data splits, and only partially overlapping cohorts, illustrating precisely the cross-study comparability problem discussed in Section 5.1. Future lung cancer studies should therefore prioritize prospective recruitment, predefined external validation cohorts, metadata on smoking and comorbidities, and direct comparison with established clinical pathways such as low-dose computed tomography. E-nose testing is most plausibly positioned as a triage or risk-stratification adjunct rather than a replacement for imaging.
5.4. Machine Learning-Integrated Electronic Nose Studies in Lung Cancer
Traditional ML approaches remain appropriate for many lung cancer E-nose studies because available datasets are usually modest and sensor outputs are structured. Support vector machines, discriminant analysis, random forests, and related classifiers can perform well when sensor features are stable and preprocessing is standardized. The key limitation is not algorithmic availability but validation design. Small training-test splits, internal cross-validation, and single-center sampling can produce optimistic estimates if breath-collection conditions, instrument drift, or batch effects are not separated from disease signals.
For lung cancer, ML models should be evaluated against clinically meaningful endpoints: detection of early-stage disease, discrimination of malignant from benign pulmonary nodules, stage recognition, and performance in smokers or patients with COPD. Cohort size is particularly important because VOC profiles are affected by multiple covariates, and small datasets cannot adequately stratify by tumor stage, histology, smoking status, medication use, or comorbid lung disease. The most informative studies are those that report separate training and independent test sets, transparent sample exclusion criteria, and calibration procedures for sensor drift. Without these design elements, high accuracy values may reflect site-specific conditions rather than transferable cancer biology [87].
5.5. Deep Learning-Integrated Electronic Nose Studies in Lung Cancer
Deep learning has potential for lung cancer E-nose analysis because raw sensor time series contain dynamic information, including adsorption, peak response, recovery kinetics, and sensor-to-sensor interactions. CNN-based and domain-generalization approaches may improve robustness when datasets include sufficient variability across subjects, devices, and sampling sites [8,69,80,81]. However, DL is also more vulnerable to overfitting when sample sizes are small or when class labels are confounded by collection site, breath-storage method, or environmental background. Therefore, DL should not be assumed to be superior to traditional ML unless evaluated using external validation and clinically realistic controls.
The strongest near-term role for DL in lung cancer may be in modeling longitudinal or high-dimensional sensor signals, particularly when paired with uncertainty estimation and explainable AI. For screening, clinicians need calibrated risk estimates rather than opaque binary outputs. DL models should therefore report not only sensitivity and specificity but also calibration, decision-curve utility, false-positive rates in benign lung disease, and stability across repeated measurements.
5.6. Electronic Nose-Based Detection of Breast Cancer
Breast cancer differs from lung cancer because breath VOCs are less anatomically direct and may reflect systemic metabolic changes rather than local airway emissions. This does not invalidate breath or biofluid VOC analysis, but it increases the importance of controlling biological confounders such as menopausal status, hormone therapy, diet, medications, microbiome composition, metabolic disease, and treatment history. E-nose studies in breast cancer should therefore be interpreted with caution when control groups are small or when demographic and clinical matching is incomplete [82,83].
Existing studies support the feasibility of VOC-based breast cancer classification, but the evidence remains less mature than for lung cancer. Many reports emphasize diagnostic accuracy without sufficient attention to cohort composition, early-stage detection, external validation, or comparison with mammography-based pathways. A clinically useful E-nose test for breast cancer would need to demonstrate value in a specific role, such as adjunctive risk stratification, follow-up after suspicious imaging, or monitoring in high-risk populations. General claims of non-invasive screening are premature unless supported by large, prospective, independently validated cohorts.
5.7. Machine Learning-Integrated Electronic Nose Studies in Breast Cancer
Traditional ML methods are suitable for breast cancer E-nose studies when sensor features are preprocessed and cohort metadata are carefully controlled. However, model performance may be inflated if algorithms learn differences in sampling procedures, age distribution, or treatment status rather than tumor-associated VOC patterns. For this reason, future ML studies should report cohort size, cancer stage, receptor status when available, menopausal status, prior treatment, and control selection. They should also distinguish between case-control accuracy and screening performance in an intended-use population.
A major limitation is that many breast cancer VOC studies remain retrospective or exploratory. Internal validation can identify promising patterns, but clinical translation requires external validation across sites and devices. Transparent reporting of sensitivity, specificity, AUC, positive predictive value, and negative predictive value is necessary, but insufficient on its own; calibration and decision-threshold analysis are also needed to determine whether the test would reduce or increase unnecessary diagnostic procedures.
5.8. Deep Learning-Integrated Electronic Nose Studies in Breast Cancer
Deep learning is well established in breast imaging, but its application to E-nose-based breast cancer detection remains early. Imaging datasets are typically far larger and more standardized than VOC sensor datasets, so performance expectations from mammography or MRI cannot be directly transferred to E-nose signals [82,88,89]. DL may become useful for breast cancer VOC analysis when multicenter datasets include raw sensor curves, longitudinal measurements, and harmonized clinical metadata. Until then, simpler ML models may provide more transparent and reproducible baselines.
The main research priority is not merely to apply deeper architectures, but to determine whether VOC signatures add independent diagnostic value beyond established risk factors and imaging findings. Multimodal models combining E-nose signals with clinical and imaging variables may be more clinically relevant than stand-alone breath classifiers. Such models should be tested prospectively and should include explainability tools to identify whether predictions are driven by plausible VOC patterns rather than demographic or procedural confounders.
5.9. Electronic Nose-Based Detection of Kidney Cancer
Kidney cancer presents a distinct diagnostic context because urine is a biologically relevant and accessible sample matrix for renal and urinary tract disease. Renal cell carcinoma accounts for a minority of all solid tumors but contributes substantially to health-care burden, and many cases are detected incidentally through imaging performed for unrelated conditions [90,91]. VOC-based urine analysis is therefore best viewed as a potential adjunct for risk stratification or biomarker discovery rather than as a near-term replacement for ultrasound, CT, MRI, or tissue-based diagnosis.
Evidence for kidney cancer E-nose diagnostics is promising but limited. Urinary VOC patterns may reflect tumor metabolism, renal handling of metabolites, inflammation, microbiome effects, diet, medication exposure, and comorbid kidney disease. These overlapping sources make specificity a central challenge. Unlike lung cancer breath studies, where the sample matrix is directly linked to pulmonary emissions, kidney cancer studies must carefully distinguish tumor-related urinary VOC signals from non-malignant renal dysfunction, urinary tract infection, hydration status, and sample-storage effects. Consequently, robust clinical metadata and disease-control groups are essential.
5.10. Machine Learning-Integrated Electronic Nose Studies in Kidney Cancer
The most relevant kidney cancer E-nose evidence involves urine-based VOC analysis in a cohort of 252 participants, including 110 patients and 142 controls. Feature reduction using PCA and classification using canonical discriminant analysis produced 81.7% accuracy, 71.8% sensitivity, 89.4% specificity, and an AUC of 0.85 [84]. These findings support feasibility, but they also show that sensitivity remains moderate, which is important for any screening or early-detection application. A test that misses nearly one in four cases would require careful positioning as an adjunct rather than a stand-alone screening method.
The principal limitations are cohort size, single-study evidence, potential confounding by diet and medications, and uncertainty about performance in clinically relevant controls such as benign renal masses, chronic kidney disease, urinary tract infection, or hematuria. Reviews of E-nose approaches in kidney disease identify PCA, SVM, and random forest as commonly used methods, but much of the broader renal literature focuses on chronic kidney disease rather than renal cancer specifically [85,86]. Therefore, evidence from CKD classification should not be generalized directly to kidney cancer without dedicated validation.
5.11. Deep Learning-Integrated Electronic Nose Studies in Kidney Cancer
Evidence for deep learning-integrated E-nose diagnosis of kidney cancer is currently insufficient for firm conclusions. The limitation is not that kidney cancer lacks VOC relevance; rather, the field lacks large, labeled, externally validated urinary or breath VOC datasets designed specifically for renal malignancy. Deep learning requires substantially larger and more diverse datasets than those currently available, and small single-center cohorts would be at high risk of overfitting to sample handling, device drift, or control-selection artifacts.
Future kidney cancer studies should therefore prioritize prospective urine-based cohorts, standardized collection and storage protocols, benign renal and urinary disease controls, and longitudinal validation. Deep learning may become useful once sufficient raw sensor time-series data are available, particularly for modeling nonlinear sensor dynamics or integrating E-nose data with imaging, urinalysis, renal function, clinical risk factors, and molecular biomarkers. At present, however, traditional ML with transparent feature analysis remains the more realistic approach for early-stage kidney cancer E-nose research.
6. Comparative Analysis of Sensor Technologies and AI Approaches
The diagnostic value of an electronic nose platform is determined not by sensor sensitivity alone, but by the interaction between sensor physics, sampling stability, signal processing, and the learning algorithm used to classify VOC patterns. In cancer screening, the optimal technology must therefore balance analytical performance with cost, portability, calibration burden, and tolerance to biological and environmental variability. Table 4 summarizes the main trade-offs among sensor families commonly used in E-nose systems.
MOS sensors currently appear among the most practical candidates for real-world cancer screening because they are inexpensive, robust, miniaturizable, and capable of rapid responses to broad VOC classes. Their cross-reactive nature is advantageous for pattern-based E-nose classification, where the goal is often to recognize a disease-associated VOC fingerprint rather than quantify a single compound. However, this same non-specificity can also reduce biological interpretability and increase vulnerability to humidity, temperature variation, and sensor drift. MOS platforms are therefore most promising when paired with standardized breath collection, environmental correction, and drift-aware machine learning. They are less suitable as stand-alone biomarker quantification tools, but they offer a strong compromise between performance and scalability for low-cost screening.
Conducting polymer sensors provide room-temperature operation and can be chemically tuned toward selected VOC classes, making them attractive for portable and low-power devices. Their main weakness is long-term stability: polymer aging, swelling, and irreversible adsorption may change the response profile over repeated clinical use. For cancer screening, where small VOC differences may separate cases from controls, these stability limitations are clinically important. QCM and SAW sensors offer higher mass sensitivity and richer physicochemical information, but typically require more controlled operating conditions, more expensive instrumentation, and careful coating selection. They may be valuable in laboratory-grade validation studies or hybrid platforms, but their cost and operational complexity currently limit widespread point-of-care deployment.
Electrochemical sensors have strong potential when diagnostic hypotheses involve specific reactive compounds or well-defined VOC subclasses. Their selectivity, compactness, and relatively low power requirements make them compatible with clinical devices. However, cancer volatilomics usually involves complex mixtures rather than a single target analyte; therefore, limited analyte breadth can reduce their usefulness unless they are combined into multiplexed arrays. Colorimetric arrays provide visually interpretable chemical fingerprints and can be inexpensive, but they may suffer from limited reusability, illumination dependence, reagent aging, and challenges in continuous monitoring. Overall, no single sensor class is universally superior. For near-term cancer screening, hybrid systems that combine the scalability of MOS sensors with selective Electrochemical or optical elements may offer the best balance between cost, diagnostic breadth, and clinical robustness.
In Table 4, “clinical readiness” refers to the relative maturity of each sensing approach for translational cancer screening, considering device robustness, portability, calibration burden, reproducibility, cost, power requirements, and evidence of use in clinically oriented E-nose studies. The ratings are qualitative evidence syntheses rather than regulatory classifications, and they should be interpreted alongside the sensor-specific constraints summarized in prior technical and clinical E-nose literature [4,9,10,11,15,16,17].
The choice of AI method is equally consequential. Traditional machine learning remains highly competitive in many E-nose studies because sensor arrays usually generate structured, low- to medium-dimensional features rather than the very large datasets that justify deep architectures. Algorithms such as support vector machines, random forests, logistic regression, k-nearest neighbors, and gradient-boosted models can perform well when preprocessing, feature extraction, and validation are carefully implemented. Their principal advantage is not only lower computational cost, but also more transparent error analysis. In small clinical cohorts, simpler models often provide a more reliable estimate of real-world performance than deep networks that can memorize site-specific artifacts.
Deep learning offers important advantages when raw temporal sensor signals, high-density arrays, longitudinal measurements, or multimodal inputs are available. Convolutional, recurrent, attention-based, and hybrid architectures can learn hierarchical features without extensive manual engineering. This is valuable for capturing response curves, recovery dynamics, and nonlinear interactions across sensors. However, the clinical promise of DL is currently constrained by data scarcity, class imbalance, poor external validation, and limited interpretability. For cancer screening, where prevalence may be low and false positives can burden diagnostic pathways, marginal gains in retrospective accuracy are insufficient unless accompanied by calibrated uncertainty, explainability, and prospective validation. Table 5 compares the practical implications of traditional ML and DL for E-nose translation.
At present, the most realistic pathway for clinical translation is not a maximally complex sensor-AI combination, but a robust and auditable system optimized for the intended screening context. For population or primary-care screening, MOS-dominant arrays combined with traditional ML or lightweight hybrid models appear most deployable because they offer low cost, fast measurement, portability, and manageable computation. For high-risk surveillance or specialist referral settings, hybrid sensor arrays and DL-based temporal modeling may be justified if they improve specificity and reduce unnecessary imaging or biopsy. In either case, the decisive evidence will come from multicenter prospective validation, not from single-center accuracy estimates. Technologies should therefore be ranked by reproducibility, calibration stability, workflow compatibility, and clinical decision impact rather than by sensitivity alone.
7. Challenges and Limitations
Despite the promising potential of E-nose systems integrated with machine learning (ML) and deep learning (DL) in cancer diagnostics, several critical challenges remain. First, most current studies rely on small, site-specific datasets, which limits the generalizability of trained models across different populations and devices. Deep learning methods, in particular, require large-scale and diverse datasets to avoid overfitting and to learn robust features from complex sensor signals [8].
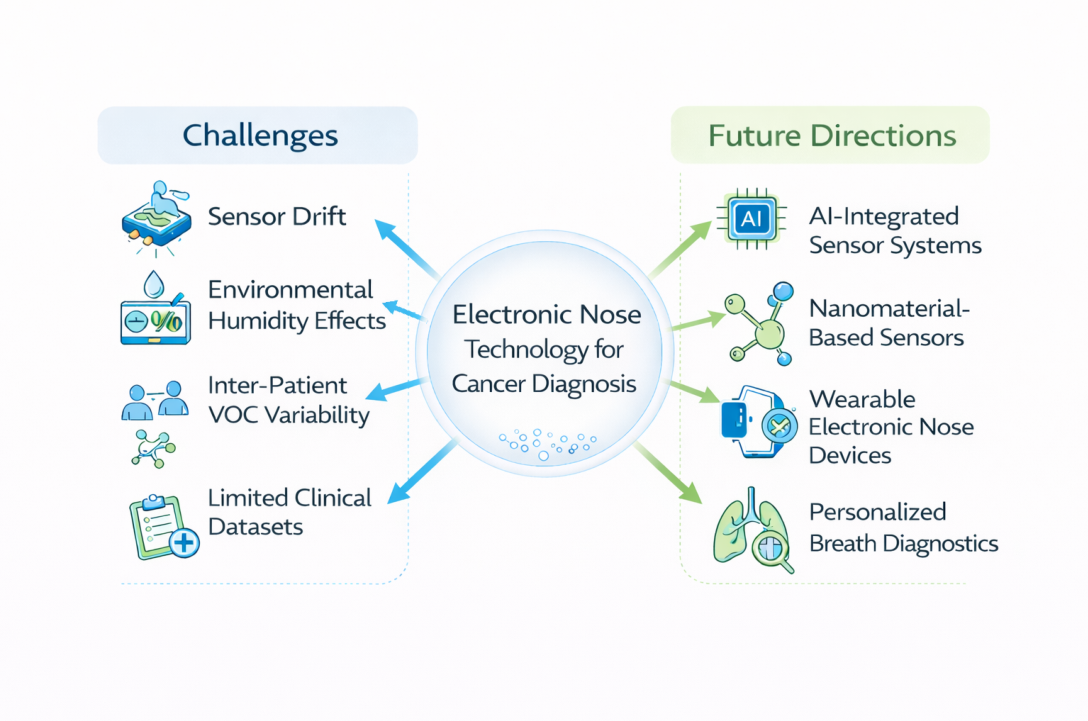
Second, sensor variability and environmental noise remain major concerns. Differences in sensor types, drift over time, humidity, and background VOCs can significantly affect the sensor response, thereby reducing classification performance when deploying models trained in controlled settings to real-world applications [11,16]. Techniques such as transfer learning and domain adaptation have been applied to mitigate these effects, but a universally reliable solution is still lacking [8].
Third, there is currently no universally accepted standard for VOC sample collection, breath analysis protocols, or sensor calibration. This inconsistency makes it difficult to compare results across different studies and devices, and poses a major barrier to clinical adoption [10].
Additionally, biological variability in VOC production complicates the identification of disease-specific biomarkers. Factors such as diet, medication, microbiome composition, and comorbidities can all influence VOC profiles, increasing the risk of false positives or negatives [62].
Finally, beyond technical issues, broader barriers exist: high sensor cost, limited interpretability of DL models, and regulatory hurdles all pose significant obstacles to routine clinical deployment. As the field matures, addressing these limitations through standardized protocols, larger multicenter studies, and improved sensor robustness will be critical to realizing the full diagnostic potential of E-nose technology. Table 6 summarizes the major technical and clinical barriers together with practical mitigation strategies discussed throughout this review.
Figure 8.
Technical barriers and translational priorities for E-nose cancer diagnostics, including drift, humidity effects, patient variability, limited datasets, and AI-enhanced wearable systems.
Figure 8.
Technical barriers and translational priorities for E-nose cancer diagnostics, including drift, humidity effects, patient variability, limited datasets, and AI-enhanced wearable systems.
8. Future Research Directions
Future research on E-nose-based cancer diagnostics should move beyond proof-of-concept classification and focus on clinical interpretability, reproducibility, and deployment readiness. A key priority is explainable AI that links sensor-array responses to biologically plausible VOC patterns rather than only reporting aggregate accuracy. Feature attribution, uncertainty estimation, interpretable baselines, and confounder analysis should be used to test whether predictions reflect cancer-associated signals or artifacts related to smoking, diet, humidity, medication, sampling site, or device drift.
Foundation models and federated learning may help address data scarcity, but both require careful validation. Large self-supervised models trained on heterogeneous sensor signals, breathomics profiles, and clinical metadata could learn reusable representations across devices and cancer types. However, their value will depend on well-curated pretraining data, calibration-aware architectures, harmonized metadata, and external validation. Federated learning may support multicenter model development without centralizing sensitive VOC datasets, but it must handle site-specific differences in sensors, protocols, populations, and calibration routines.
Portable and wearable E-nose systems should be evaluated in real-world prospective settings rather than only under controlled laboratory conditions. Future devices will need automated calibration, ambient-air correction, quality flags, robust drift monitoring, and clear criteria for invalid measurements. These requirements are especially important for longitudinal monitoring, home-based screening, and post-treatment surveillance, where breathing patterns, humidity, motion artifacts, and user-dependent sampling errors may vary substantially.
Finally, E-nose outputs should be integrated with complementary clinical information such as imaging, risk factors, laboratory tests, liquid-biopsy markers, microbiome features, and symptom history. Large multicenter studies should define the intended clinical role of E-nose testing, include realistic control groups, report excluded samples, and measure operational outcomes such as failure rate, turnaround time, training requirements, cost per valid result, and clinical decision impact.
9. Conclusions
This review examined the evolving role of electronic nose systems and AI-driven analysis in cancer volatilomics. The evidence indicates that E-nose platforms can detect disease-associated VOC patterns in breath, urine, and other biofluids, but diagnostic performance is strongly conditioned by sensor type, sample matrix, cohort design, preprocessing, and validation strategy. Lung cancer currently has the strongest biological and clinical rationale because exhaled breath is directly linked to pulmonary emissions; breast and kidney cancer applications are promising but require more rigorous disease-specific validation and better control of systemic and sample-matrix confounders.
Sensor technologies involve clear trade-offs. MOS sensors offer the most practical near-term balance of cost, portability, rapid response, and scalability, but their limited selectivity, humidity sensitivity, thermal requirements, and drift must be actively managed. Conducting polymer, QCM, SAW, electrochemical, and colorimetric platforms provide useful complementary strengths, including tunability, mass sensitivity, selective detection, or low-cost visual readout, yet each introduces limitations in stability, instrumentation complexity, analyte breadth, or clinical robustness. The most clinically plausible future systems may therefore be hybrid arrays that combine broad cross-reactive VOC fingerprinting with selected higher-specificity sensing elements.
AI methods show similar trade-offs. Traditional ML remains highly relevant for current E-nose datasets because it can perform well with structured features, smaller cohorts, lower computational cost, and better interpretability. Deep learning may add value for raw temporal sensor signals, multimodal datasets, and large multicenter cohorts, but it is not inherently superior when data are limited or confounded. For clinical translation, model transparency, calibration, uncertainty estimation, and external validation are as important as retrospective accuracy.
Overall, E-nose-based cancer diagnostics should be viewed as an emerging risk-stratification and screening-adjunct technology rather than a replacement for established imaging, pathology, or molecular diagnostics. Progress toward clinical adoption will require standardized sampling, drift compensation, multicenter prospective validation, clinically realistic control groups, explainable AI, health-economic assessment, and clearly defined intended-use pathways. If these requirements are met, portable E-nose systems integrated with robust AI may become valuable components of non-invasive cancer screening, surveillance, and triage workflows.
Author Contributions
Md. Mahbubul Islam: Conceptualization, methodology, literature search, writing – original draft, visualization, and revision. Ainur Yerkos: Supervision, conceptual guidance, validation, writing – review and editing. Zholdas Buribayev: Supervision, project administration, critical review, and writing – review and editing.
Funding
This research received no specific grant from any funding agency in the public, commercial, or not-for-profit sectors.
Data Availability Statement
No new data were created or analyzed in this study. Data sharing is not applicable to this review article.
Acknowledgments
The authors acknowledge Al-Farabi Kazakh National University for providing the academic environment that supported preparation of this review.
Conflicts of Interest
The authors declare that they have no known competing financial interests or personal relationships that could have appeared to influence the work reported in this paper.
Declaration of Generative AI Use
During preparation of this work, the authors used ChatGPT (OpenAI) and Canva (including its AI-assisted design features) to help generate the schematic and conceptual illustrations, which were then arranged using Microsoft PowerPoint (Figure 1, Figure 2, Figure 3, Figure 4, Figure 5 and Figure 6, and Figure 8). These figures are conceptual/illustrative summaries of information already described and cited in the main text; they do not depict original experimental data, images, or measurements. Figure 7 was generated directly from the cited primary sources using standard plotting software, without generative AI involvement. After using the tools listed above, the authors reviewed and edited the output as needed and take full responsibility for the content of this publication.
References
- World Health Organization. Global cancer burden growing, amidst mounting need for services. 2024. [Google Scholar]
- Chacko, N.; Ankri, R. Non-invasive early-stage cancer detection: Current methods and future perspectives. Clin. Exp. Med. 2024, 25, 17. [Google Scholar] [CrossRef] [PubMed]
- Qi, C.; Zhao, X. Spectroscopic liquid biopsy: A novel promising method for early cancer screening. J. Transl. Med. 2025, 23, 33. [Google Scholar] [CrossRef] [PubMed]
- Moshayedi, A.J.; Khan, A.S.; Chen, M.; Piccaluga, P.P. Enose: A new frontier for non-invasive cancer detection and monitoring. J. Cancer Metastasis Treat. 2025, 11. [Google Scholar] [CrossRef]
- U.S. Environmental Protection Agency. What Are Volatile Organic Compounds (VOCs)? Accessed. 2025. (accessed on 18 June 2025).
- Oyerinde, A.S.; Selvaraju, V.; Babu, J.R.; Geetha, T. Potential role of oxidative stress in the production of volatile organic compounds in obesity. Antioxidants 2023, 12. [Google Scholar] [CrossRef] [PubMed]
- Owlstone Medical. Non-Invasive VOC Biomarkers. Accessed. 2025. (accessed on 18 June 2025).
- Lee, M.R.; et al. Cross-site validation of lung cancer diagnosis by electronic nose with deep learning: A multicenter prospective study. Respir. Res. 2024, 25, 203. [Google Scholar] [CrossRef] [PubMed]
- Rabehi, A.; Helal, H.; Zappa, D.; Comini, E. Advancements and prospects of electronic nose in various applications: A comprehensive review. Appl. Sci. 2024, 14. [Google Scholar] [CrossRef]
- Cipriano, D.; Capelli, L. Evolution of electronic noses from research objects to engineered environmental odour monitoring systems: A review of standardization approaches. Biosensors 2019, 9, 75. [Google Scholar] [CrossRef] [PubMed]
- Li, Y.; Wei, X.; Zhou, Y.; Wang, J.; You, R. Research progress of electronic nose technology in exhaled breath disease analysis. Microsyst. Nanoeng. 2023, 9, 129. [Google Scholar] [CrossRef] [PubMed]
- Ye, Z.; Liu, Y.; Li, Q. Recent progress in smart electronic nose technologies enabled with machine learning methods. Sensors 2021, 21. [Google Scholar] [CrossRef] [PubMed]
- Berna, A. Metal oxide sensors for electronic noses and their application to food analysis. Sensors 2010, 10. [Google Scholar] [CrossRef] [PubMed]
- Tonezzer, M.; et al. Electronic noses based on metal oxide nanowires: A review. Nanotechnol. Rev. 2022, 11, 897–925. [Google Scholar] [CrossRef]
- Zhang, Y.; Zhao, Y.; Jiang, F.; Lai, R. Design of electronic nose based on MOS gas sensors and its application in juice identification. Sensors 2025, 25. [Google Scholar] [CrossRef] [PubMed]
- Wilson, A.D.; Baietto, M. Applications and advances in electronic-nose technologies. Sensors 2009, 9, 5099–5148. [Google Scholar] [CrossRef] [PubMed]
- Zhang, Z.; et al. Electronic nose based on metal oxide semiconductor sensors for medical diagnosis. Prog. Nat. Sci. Mater. Int. 2024, 34, 74–88. [Google Scholar] [CrossRef]
- Encyclopedia. E-tongues/noses based on conducting polymers and composite materials. 2025. [Google Scholar] [CrossRef]
- Sierra-Padilla, A.; García-Guzmán, J.J.; López-Iglesias, D.; Palacios-Santander, J.M.; Cubillana-Aguilera, L. E-tongues/noses based on conducting polymers and composite materials: Expanding the possibilities in complex analytical sensing. Sensors 2021, 21. [Google Scholar] [CrossRef] [PubMed]
- Chiu, S.W.; Tang, K.T. Towards a chemiresistive sensor-integrated electronic nose: A review. Sensors 2013, 13, 14214–14247. [Google Scholar] [CrossRef] [PubMed]
- Le, C.V.; Yoon, H. Advances in the use of conducting polymers for healthcare monitoring. Int. J. Mol. Sci. 2024, 25. [Google Scholar] [CrossRef] [PubMed]
- Dong, R.; et al. Conducting polymers-based gas sensors: Principles, materials, and applications. Sensors 2025, 25. [Google Scholar] [CrossRef] [PubMed]
- Huang, X.; Chen, Q.; Pan, W.; Yao, Y. Advances in the mass sensitivity distribution of quartz crystal microbalances: A review. Sensors 2022, 22. [Google Scholar] [CrossRef] [PubMed]
- Songkhla, Sawit Na. Overview of quartz crystal microbalance behavior analysis and measurement. Chemosensors 2025. [Google Scholar] [CrossRef]
- Wikipedia contributors. Sauerbrey equation. 2025.
- Torad, N.L.; Minisy, I.M.; Sharaf, H.M.; Stejskal, J.; Yamauchi, Y.; Ayad, M.M. Gas sensing properties of polypyrrole/poly(n-vinylpyrrolidone) nanorods/nanotubes-coated quartz-crystal microbalance sensor. Synth. Met. 2021, 282, 116935. [Google Scholar] [CrossRef]
- Julian, T.; Hidayat, S.N.; Rianjanu, A.; Dharmawan, A.B.; Wasisto, H.S.; Triyana, K. Intelligent mobile electronic nose system comprising a hybrid polymer functionalized quartz crystal microbalance sensor array. ACS Omega 2020, 5, 29492–29503. [Google Scholar] [CrossRef] [PubMed]
- Regmi, B.P.; Adhikari, P.L.; Dangi, B.B. Ionic liquid-based quartz crystal microbalance sensors for organic vapors: A tutorial review. Chemosensors 2021, 9. [Google Scholar] [CrossRef]
- ResearchGate. Ultrasensitive wireless quartz-crystal-microbalance (QCM) bio/gas sensors. 2025. [Google Scholar] [PubMed]
- Johannsmann, D.; Langhoff, A.; Leppin, C. Studying soft interfaces with shear waves: Principles and applications of the quartz crystal microbalance (QCM). Sensors 2021, 21. [Google Scholar] [CrossRef] [PubMed]
- Mandal, D.; Banerjee, S. Surface acoustic wave (SAW) sensors: Physics, materials, and applications. Sensors 2022, 22. [Google Scholar] [CrossRef] [PubMed]
- Matatagui, D.; Bahos, F.A.; Gràcia, I.; Horrillo, M.d.C. Portable low-cost electronic nose based on surface acoustic wave sensors for the detection of BTX vapors in air. Sensors 2019, 19. [Google Scholar] [CrossRef] [PubMed]
- Mazzone, P.J.; et al. Exhaled breath analysis with a colorimetric sensor array for the identification and characterization of lung cancer. J. Thorac. Oncol. 2012, 7, 137–142. [Google Scholar] [CrossRef] [PubMed]
- Yang, F.Q.; Ge, L. Colorimetric sensors: Methods and applications. Sensors 2023, 23. [Google Scholar] [CrossRef] [PubMed]
- Faura, G.; et al. Colorimetric and electrochemical screening for early detection of diabetes mellitus and diabetic retinopathy—application of sensor arrays and machine learning. Sensors 2022, 22. [Google Scholar] [CrossRef] [PubMed]
- Zhang, Y.; et al. Rapid molecular detection of SARS-CoV-2 (COVID-19) virus RNA using colorimetric LAMP. medRxiv 2020. [Google Scholar] [CrossRef]
- Jalalvand, A.R.; Karami, M.M. Roles of nanotechnology in electrochemical sensors for medical diagnostic purposes: A review. Sens. Bio-Sens. Res. 2025, 47, 100733. [Google Scholar] [CrossRef]
- Bounegru, A.V.; Dinu Iacob, A.; Iticescu, C.; Georgescu, P.L. Electrochemical sensors and biosensors for the detection of pharmaceutical contaminants in natural waters—a comprehensive review. Chemosensors 2025, 13. [Google Scholar] [CrossRef]
- ScienceDirect Topics. Electrochemical Sensor—An Overview. Accessed. 2025. (accessed on 11 June 2025).
- Honeywell. How Do Electrochemical Sensors Work? Accessed. 2025. (accessed on 11 June 2025).
- Fine, G.F.; Cavanagh, L.M.; Afonja, A.; Binions, R. Metal oxide semi-conductor gas sensors in environmental monitoring. Sensors 2010, 10, 5469–5502. [Google Scholar] [CrossRef] [PubMed]
- Ibanez, J.G.; Rincón, M.E.; Gutierrez-Granados, S.; Chahma, M.; Jaramillo Quintero, O.A.; Frontana-Uribe, B.A. Conducting polymers in the fields of energy, environmental remediation, and chemical–chiral sensors. Chem. Rev. 2018, 118, 4731–4816. [Google Scholar] [CrossRef] [PubMed]
- Sazcı, O.; Uğraşkan, V.; Yoruç Hazar, A.B. Conductive polymers for medical applications. In Handbook of Polymers in Medicine; Mozafari, M., Singh Chauhan, N.P., Eds.; Woodhead Publishing, 2023; pp. 305–325. [Google Scholar] [CrossRef]
- Weidman, J.; Mathews, L.; Gokhale, K. Quartz crystal microbalance as a predictive tool for drug-material of construction interactions in intravenous protein drug administration. J. Pharm. Sci. 2023, 112, 3154–3163. [Google Scholar] [CrossRef] [PubMed]
- Bahos, F.A.; et al. ZIF nanocrystal-based surface acoustic wave (SAW) electronic nose to detect diabetes in human breath. Biosensors 2019, 9. [Google Scholar] [CrossRef] [PubMed]
- Li, L.; et al. E-nose and colorimetric sensor array combining homologous data fusion strategy discriminating the roasting degree of large-leaf yellow tea. Food Chem. X 2024, 21, 101124. [Google Scholar] [CrossRef] [PubMed]
- PubMed. Diagnosis of rhinosinusitis with a colorimetric sensor array, 2011. Accessed. (accessed on 11 June 2025).
- Li, Z.; Askim, J.R.; Suslick, K.S. The optoelectronic nose: Colorimetric and fluorometric sensor arrays. Chem. Rev. 2019, 119, 231–292. [Google Scholar] [CrossRef] [PubMed]
- Wojnowski, W.; Majchrzak, T.; Dymerski, T.; Gębicki, J.; Namieśnik, J. Portable electronic nose based on electrochemical sensors for food quality assessment. Sensors 2017, 17, 2715. [Google Scholar] [CrossRef] [PubMed]
- Barhoum, A.; Hamimed, S.; Slimi, H.; Othmani, A.; Abdel-Haleem, F.M.; Bechelany, M. Modern designs of electrochemical sensor platforms for environmental analyses: Principles, nanofabrication opportunities, and challenges. Trends Environ. Anal. Chem. 2023, 38, e00199. [Google Scholar] [CrossRef]
- Sensigent. Cyranose 320 Electronic Nose. Accessed. 2025. (accessed on 13 June 2025).
- Airsense Analytics. Portable Electronic Nose. Accessed. 2025. (accessed on 13 June 2025).
- Alpha, M.O.S. Alpha-MOS FOX Electronic Noses. Accessed. 2025. (accessed on 13 June 2025).
- Falasconi, M.; Pardo, M.; Sberveglieri, G.; Riccò, I.; Bresciani, A. The novel EOS 835 electronic nose and data analysis for evaluating coffee ripening. Sens. Actuators B Chem. 2005, 110, 73–80. [Google Scholar] [CrossRef]
- Bruins, M.; Rahim, Z.; Bos, A.; van de Sande, W.W.J.; Endtz, H.P.; van Belkum, A. Diagnosis of active tuberculosis by e-nose analysis of exhaled air. Tuberculosis 2013, 93, 232–238. [Google Scholar] [CrossRef] [PubMed]
- The eNose Company. Lung Cancer Detection with Aeonose, 2025. Accessed. (accessed on 13 June 2025).
- Arnold, C.; Harms, M.; Goschnick, J. Air quality monitoring and fire detection with the Karlsruhe electronic micronose KAMINA. IEEE Sens. J. 2002, 2, 179–188. [Google Scholar] [CrossRef]
- Gallagher, M.; Wysocki, C.J.; Leyden, J.J.; Spielman, A.I.; Sun, X.; Preti, G. Analyses of volatile organic compounds from human skin. Br. J. Dermatol. 2008, 159, 780–791. [Google Scholar] [CrossRef] [PubMed]
- Sukul, P.; Richter, A.; Junghanss, C.; Schubert, J.K.; Miekisch, W. Origin of breath isoprene in humans is revealed via multi-omic investigations. Commun. Biol. 2023, 6, 999. [Google Scholar] [CrossRef] [PubMed]
- Kalapos, M.P. On the mammalian acetone metabolism: From chemistry to clinical implications. Biochim. Et. Biophys. Acta-General. Subj. 2003, 1621, 122–139. [Google Scholar] [CrossRef] [PubMed]
- Furuhashi, T.; Ishii, R.; Onishi, H.; Ota, S. Elucidation of biochemical pathways underlying VOCs production in A549 cells. Front. Mol. Biosci. 2020, 7. [Google Scholar] [CrossRef] [PubMed]
- Owlstone Medical. Breath to Bodily Fluids: The Role of VOCs in Health and Disease. Accessed. 2024. (accessed on 21 June 2025).
- Rocco, G.; et al. Breathprinting and early diagnosis of lung cancer. J. Thorac. Oncol. 2018, 13, 883–894. [Google Scholar] [CrossRef] [PubMed]
- Vadalaa, R.; et al. A review on electronic nose for diagnosis and monitoring treatment response in lung cancer. J. Breath Res. 2023, 17, 024002. [Google Scholar] [CrossRef] [PubMed]
- Zhao, L.; et al. A weighted discriminative extreme learning machine design for lung cancer detection by an electronic nose system. IEEE Trans. Instrum. Meas. 2021, 70, 1–9. [Google Scholar] [CrossRef]
- Yang, H.Y.; Wang, Y.C.; Peng, H.Y.; Huang, C.H. Breath biopsy of breast cancer using sensor array signals and machine learning analysis. Sci. Rep. 2021, 11, 103. [Google Scholar] [CrossRef] [PubMed]
- Li, W.; Liu, H.; Xie, D.; He, Z.; Pi, X. Lung cancer screening based on type different sensor arrays. Sci. Rep. 2017, 7, 1969. [Google Scholar] [CrossRef] [PubMed]
- Liu, L.; Li, W.; He, Z.; Chen, W.; Liu, H.; Chen, K.; Pi, X. Detection of lung cancer with electronic nose using a novel ensemble learning framework. J. Breath Res. 2021, 15, 026014. [Google Scholar] [CrossRef] [PubMed]
- Tyagi, H.; Daulton, E.; Bannaga, A.S.; Arasaradnam, R.P.; Covington, J.A. Non-invasive detection and staging of colorectal cancer using a portable electronic nose. Sensors 2021, 21. [Google Scholar] [CrossRef] [PubMed]
- Schuermans, V.N.E.; Li, Z.; Jongen, A.C.H.M.; Wu, Z.; Shi, J.; Ji, J.; Bouvy, N.D. Pilot study: Detection of gastric cancer from exhaled air analyzed with an electronic nose in Chinese patients. Surg. Innov. 2018, 25, 429–434. [Google Scholar] [CrossRef] [PubMed]
- Scheepers, M.H.M.C.; Al-Difaie, Z.; Brandts, L.; Peeters, A.; van Grinsven, B.; Bouvy, N.D. Diagnostic performance of electronic noses in cancer diagnoses using exhaled breath. JAMA Netw. Open 2022, 5, e2219372. [Google Scholar] [CrossRef] [PubMed]
- Díaz de León-Martínez, L.; Rodríguez-Aguilar, M.; Gorocica-Rosete, P.; Domínguez-Reyes, C.A.; Martínez-Bustos, V.; Tenorio-Torres, J.A.; Ornelas-Rebolledo, O.; Cruz-Ramos, J.A.; Balderas-Segura, B.; Flores-Ramírez, R. Identification of profiles of volatile organic compounds in exhaled breath by means of an electronic nose as a proposal for a screening method for breast cancer: a case-control study. J. Breath Res. 2020, 14, 046009. [Google Scholar] [CrossRef] [PubMed]
- Thanoon, Mohammad A. A review of deep learning techniques for lung cancer screening and diagnosis based on CT images. Diagnostics 2023, 13, 2617. [Google Scholar] [CrossRef] [PubMed]
- International Agency for Research on Cancer. Cancer Today. Accessed. 2025. (accessed on 2 July 2025).
- International Agency for Research on Cancer. Cancer Tomorrow. Accessed. 2025. (accessed on 2 July 2025).
- Baldini, C.; Billeci, L.; Sansone, F.; Conte, R.; Domenici, C.; Tonacci, A. Electronic nose as a novel method for diagnosing cancer: A systematic review. Biosensors 2020, 10. [Google Scholar] [CrossRef] [PubMed]
- Bray, F.; Laversanne, M.; Sung, H.; Ferlay, J.; Siegel, R.L.; Soerjomataram, I.; Jemal, A. Global cancer statistics 2022: GLOBOCAN estimates of incidence and mortality worldwide for 36 cancers in 185 countries. CA A Cancer J. Clin. 2024, 74, 229–263. [Google Scholar] [CrossRef] [PubMed]
- Tirzīte, M.; Bukovskis, M.; Strazda, G.; Jurka, N.; Taivans, I. Detection of lung cancer in exhaled breath with an electronic nose using support vector machine analysis. J. Breath Res. 2017, 11, 036009. [Google Scholar] [CrossRef] [PubMed]
- Tirzīte, M.; Bukovskis, M.; Strazda, G.; Jurka, N.; Taivans, I. Detection of lung cancer with electronic nose and logistic regression analysis. J. Breath Res. 2018, 13, 016006. [Google Scholar] [CrossRef] [PubMed]
- Kao, M.H.; Chiu, S.W.; Lee, M.R.; Sun, M.; Tang, K.T. Deep neural network of e-nose sensor for lung cancer classification. In Proceedings of the 2023 IEEE BioSensors Conference (BioSensors), 2023; pp. 1–4. [Google Scholar] [CrossRef]
- Lee, J.M.; et al. A DNA-derived phage nose using machine learning and artificial neural processing for diagnosing lung cancer. Biosens. Bioelectron. 2021, 194, 113567. [Google Scholar] [CrossRef] [PubMed]
- Matana, Y.; et al. Chemical nose-based non-invasive detection of breast cancer using exhaled breath. Sensors 2025, 25. [Google Scholar] [CrossRef] [PubMed]
- Giró Benet, J.; Seo, M.; Khine, M.; et al. Breast cancer detection by analyzing the volatile organic compound (VOC) signature in human urine. Sci. Rep. 2022, 12, 14873. [Google Scholar] [CrossRef] [PubMed]
- Costantini, M.; et al. Human urinary volatilome analysis in renal cancer by electronic nose. Biosensors 2023, 13. [Google Scholar] [CrossRef] [PubMed]
- Sansone, Francesco. Non-invasive diagnostic approaches for kidney disease: The role of electronic nose systems. Sensors 2024, 24, 6475. [Google Scholar] [CrossRef] [PubMed]
- Saidi, T.; Zaim, O.; Moufid, M.; El Bari, N.; Ionescu, R.; Bouchikhi, B. Exhaled breath analysis using electronic nose and gas chromatography–mass spectrometry for non-invasive diagnosis of chronic kidney disease, diabetes mellitus and healthy subjects. Sens. Actuators B Chem. 2018, 257, 178. [Google Scholar] [CrossRef]
- Chen, K.; et al. Recognizing lung cancer and stages using a self-developed electronic nose system. Comput. Biol. Med. 2021, 131, 104294. [Google Scholar] [CrossRef] [PubMed]
- Nasser, Maged. Deep learning based methods for breast cancer diagnosis: A systematic review and future direction, 2023. Accessed. (accessed on 3 July 2025).
- Kumar, K.K.; et al. A convolutional neural network approach for deep learning based breast cancer detection. J. Neonatal Surg. 2025, 14. [Google Scholar] [CrossRef]
- Manalı, D.; Demirel, H.; Eleyan, A. Deep learning based breast cancer detection using decision fusion. Computers 2024, 13. [Google Scholar] [CrossRef]
- World Cancer Research Fund. Kidney Cancer Statistics. Accessed. 2025. (accessed on 5 July 2025).
Figure 1.
Comparison between traditional cancer diagnostic approaches and breathomics-based electronic nose detection. Conventional methods such as biopsy and imaging are invasive and expensive, whereas electronic nose breath analysis offers a rapid, non-invasive, and potentially low-cost alternative. As discussed in Section 5.1 and Section 5.2, this potential has not yet been validated for population screening and is currently better supported as a triage or risk-stratification adjunct.
Figure 1.
Comparison between traditional cancer diagnostic approaches and breathomics-based electronic nose detection. Conventional methods such as biopsy and imaging are invasive and expensive, whereas electronic nose breath analysis offers a rapid, non-invasive, and potentially low-cost alternative. As discussed in Section 5.1 and Section 5.2, this potential has not yet been validated for population screening and is currently better supported as a triage or risk-stratification adjunct.
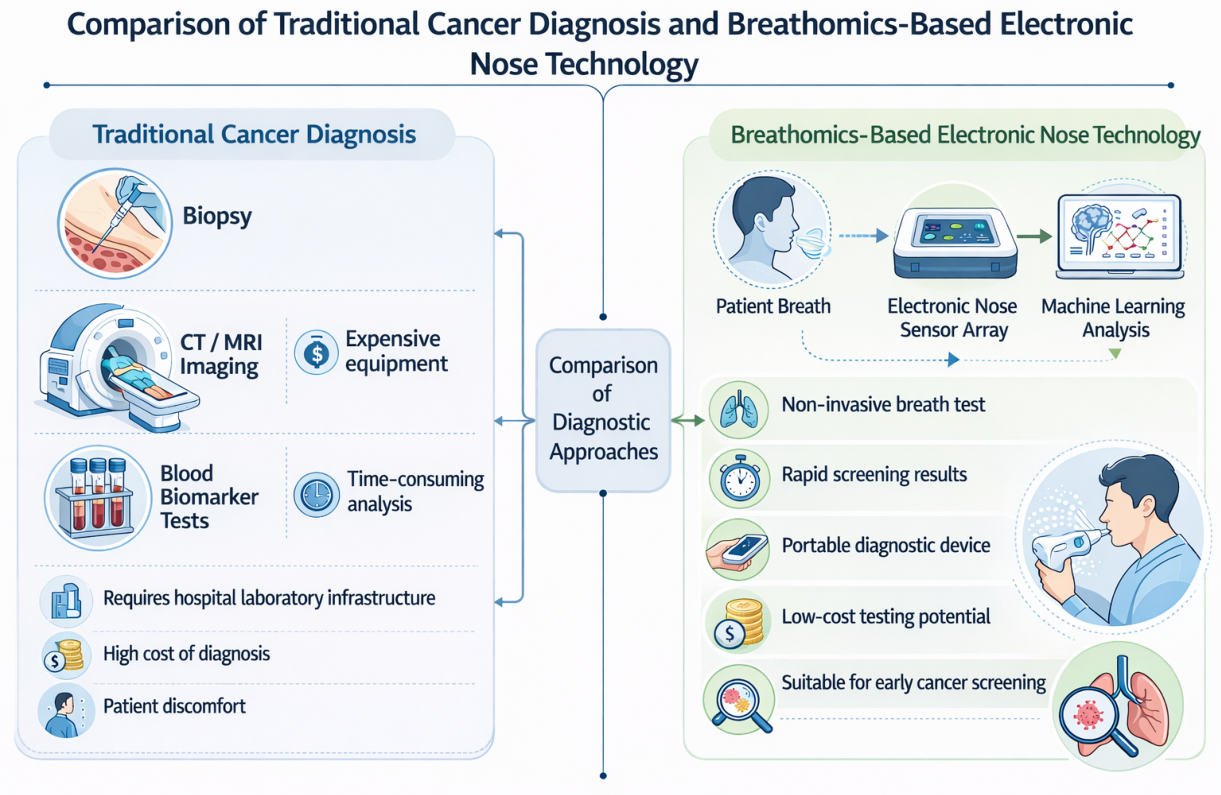
Figure 2.
Biological pathway of volatile organic compound (VOC) generation in cancer. Altered cancer metabolism produces VOCs that enter the bloodstream and are released through exhaled breath, where they can be detected using electronic nose sensor arrays. The specific molecules shown are illustrative examples of VOC classes rather than a validated, citation-linked list; see Section 3.5 for literature-supported VOC–disease associations.
Figure 2.
Biological pathway of volatile organic compound (VOC) generation in cancer. Altered cancer metabolism produces VOCs that enter the bloodstream and are released through exhaled breath, where they can be detected using electronic nose sensor arrays. The specific molecules shown are illustrative examples of VOC classes rather than a validated, citation-linked list; see Section 3.5 for literature-supported VOC–disease associations.
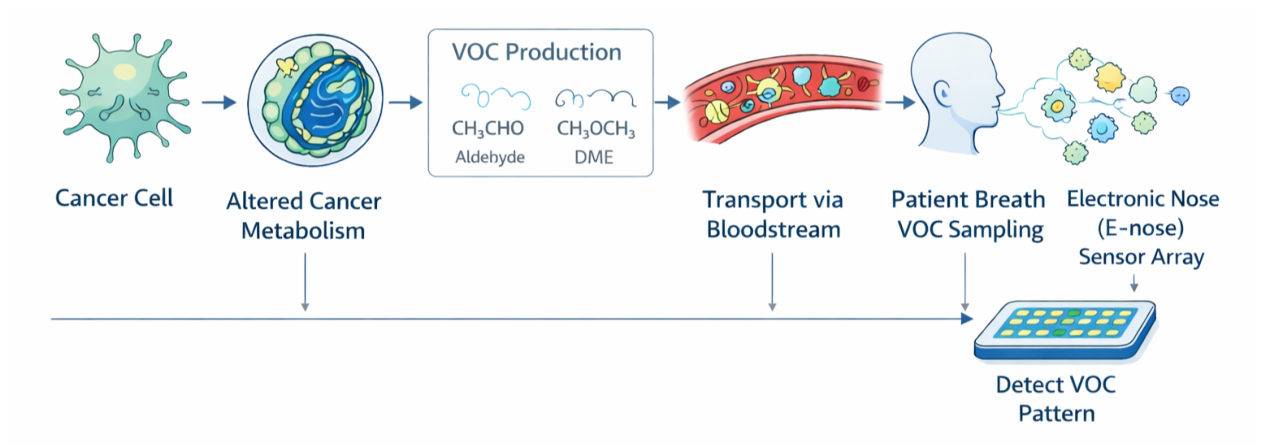
Figure 3.
Workflow of an electronic nose system for breath VOC analysis in cancer detection, including sampling chamber, sensor array (SAW, MOS, QCM), signal conditioning, data acquisition, and machine learning–based classification.
Figure 3.
Workflow of an electronic nose system for breath VOC analysis in cancer detection, including sampling chamber, sensor array (SAW, MOS, QCM), signal conditioning, data acquisition, and machine learning–based classification.
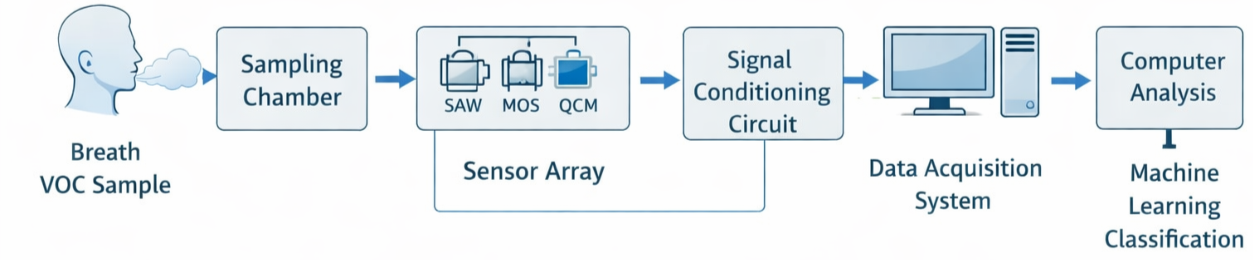
Figure 4.
Data Processing Pipeline for Electronic Nose-Based VOC Classification
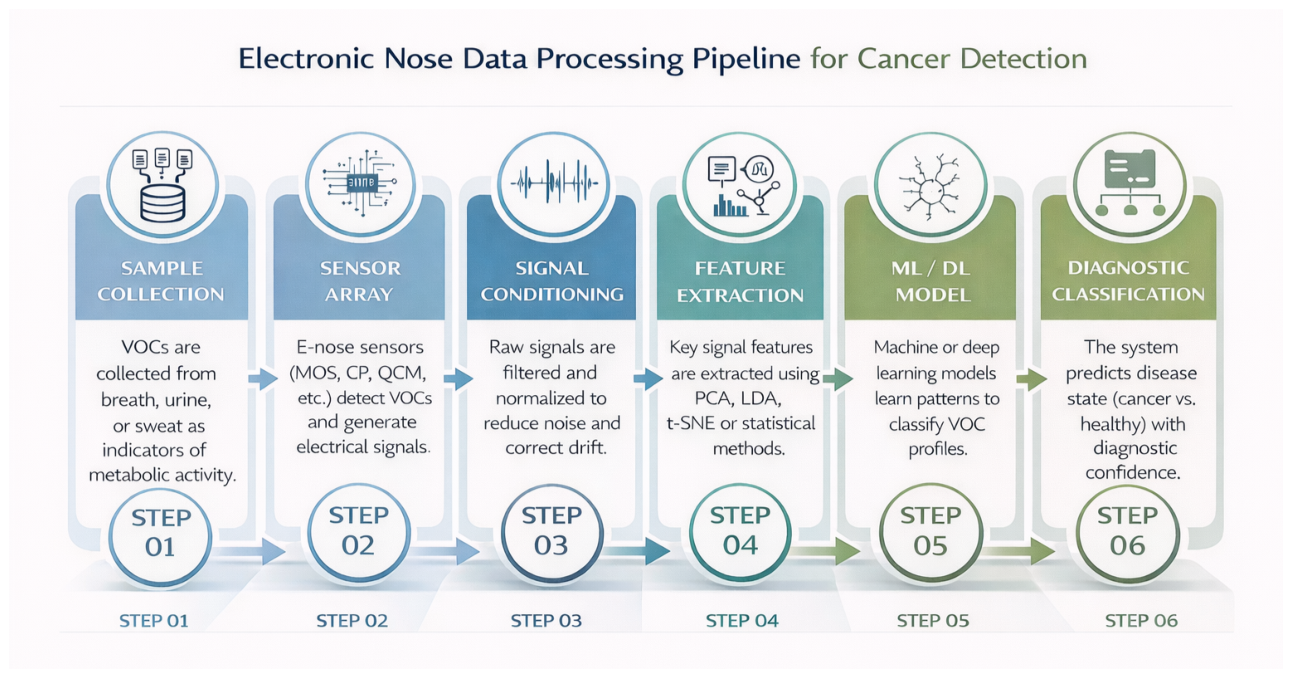
Figure 5.
Major sensor technologies used in electronic nose systems, including MOS, conductive polymer, QCM, SAW, electrochemical, and colorimetric sensor arrays.
Figure 5.
Major sensor technologies used in electronic nose systems, including MOS, conductive polymer, QCM, SAW, electrochemical, and colorimetric sensor arrays.
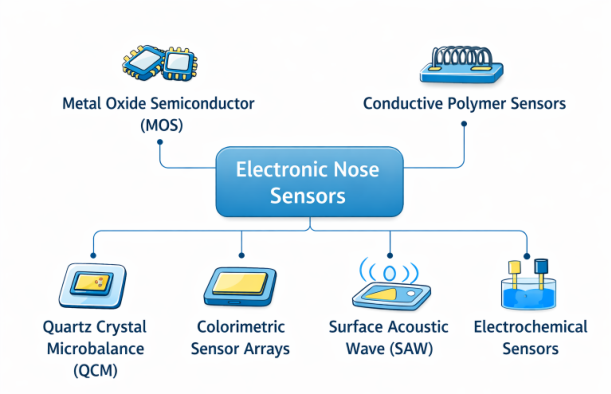
Table 4.
Comparative Performance of Sensor Technologies for Electronic Nose-Based Cancer Diagnostics.
Table 4.
Comparative Performance of Sensor Technologies for Electronic Nose-Based Cancer Diagnostics.
| Sensor type | Sensitivity | Selectivity | Response time | Cost | Power consumption | Clinical readiness | Major advantages | Major limitations |
|---|---|---|---|---|---|---|---|---|
| MOS | Moderate to high for many reducing and oxidizing VOCs | Low to moderate; pattern recognition required | Seconds to minutes | Low | Moderate to high because of heating | High among E-nose platforms | Robust, low-cost, compact, scalable, and suitable for cross-reactive arrays | Humidity sensitivity, thermal demand, baseline drift, limited compound specificity |
| Conducting polymer | Moderate; tunable through polymer chemistry | Moderate for selected VOC families | Seconds to minutes | Low to moderate | Low; room-temp. operation | Moderate | Flexible materials, chemical tunability, miniaturization potential, low-power operation | Aging, swelling, irreversible adsorption, weaker reproducibility across long deployments |
| QCM | High mass sensitivity with coated crystals | Moderate to high depending on coating | Seconds to minutes | Moderate | Low to moderate | Moderate for controlled settings | Label-free mass detection, coating flexibility, useful for laboratory validation | Sensitive to humidity and temperature, coating degradation, more complex instrumentation |
| SAW | Very high surface-mass sensitivity | Moderate to high depending on coating | Fast, often seconds | Moderate to high | Moderate | Moderate but less mature for routine screening | High sensitivity, rapid kinetics, compatibility with microfabrication | Cost, signal complexity, environmental sensitivity, coating and calibration dependence |
| Electrochemical | High for electroactive targets | High for selected analytes but narrower VOC coverage | Seconds to minutes | Low to moderate | Low | Moderate to high for targeted sensing | Compact, low-power, potentially selective, compatible with multiplexing | Limited breadth for complex VOC mixtures, electrode fouling, dependence on target chemistry |
| Colorimetric | Moderate; depends on dye chemistry and imaging quality | Moderate to high for chemically reactive VOC classes | Minutes in many formats | Low | Very low for passive arrays; imaging adds demand | Low to moderate | Low-cost visual fingerprints, simple readout, useful for disposable formats | Limited reusability, illumination dependence, reagent aging, weaker continuous-monitoring capability |
Table 5.
Comparison of Traditional Machine Learning and Deep Learning for Electronic Nose Cancer Diagnostics.
Table 5.
Comparison of Traditional Machine Learning and Deep Learning for Electronic Nose Cancer Diagnostics.
| Criterion | Traditional machine learning | Deep learning |
|---|---|---|
| Data requirements | Performs well with smaller curated datasets when features are stable and validation is rigorous | Requires large, diverse, and preferably multicenter datasets to avoid overfitting |
| Feature representation | Relies on engineered features such as peak response, area under curve, recovery slope, and normalized sensor ratios | Learns representations directly from raw or minimally processed temporal and multidimensional signals |
| Interpretability | Generally stronger; feature importance, decision boundaries, and error sources are easier to audit | Often weaker unless explainable AI, uncertainty estimation, or attention analysis is built into the workflow |
| Computational cost | Low to moderate; suitable for embedded or point-of-care deployment | Moderate to high; training can be expensive, although inference may be optimized |
| Clinical deployment readiness | Higher near-term readiness for small-to-medium E-nose datasets and regulated screening pathways | Promising but less mature; strongest when large-scale external validation and monitoring infrastructure exist |
| Main risk | Underfitting complex temporal patterns or depending on manually selected features | Learning confounders, batch effects, or site-specific artifacts without sufficient external validation |
Table 6.
Key Challenges and Mitigation Strategies for Electronic Nose-Based Cancer Diagnostics.
| Challenge | Cause | Proposed Solution |
|---|---|---|
| Sensor drift | Aging, poisoning, and repeated exposure shift sensor response over time, weakening reproducibility across sessions and devices | Use scheduled recalibration, drift compensation, adaptive / transfer-learning models, and more stable sensor materials |
| Environmental sensitivity | Humidity, temperature, and background air alter sensor outputs and reduce performance outside controlled settings | Standardize sampling conditions, add environmental compensation, and validate models across sites and devices |
| Protocol variability | Differences in collection, storage, calibration, preprocessing, and reporting limit reproducibility and comparison across studies | Adopt shared guidelines for sampling, calibration, preprocessing, validation, and reporting |
| Biological confounders | Diet, smoking, medication, microbiome, comorbidities, and tumor heterogeneity can distort VOC patterns | Use larger diverse cohorts, collect metadata, control confounders, and combine E-nose signals with complementary biomarkers |
| Limited datasets | Many studies use small single-center cohorts that encourage overfitting and weak external generalization | Run multicenter prospective studies and build benchmark datasets with external and longitudinal validation |
| Model interpretability | High-performing deep models may be difficult for clinicians and regulators to interpret or trust | Apply explainable AI, feature-attribution methods, and simpler transparent baselines where possible |
| Cost and translation | Device cost, maintenance, replacement, workflow integration, and regulation slow clinical adoption | Develop lower-cost durable systems and design point-of-care workflows aligned with regulatory requirements |
Disclaimer/Publisher’s Note: The statements, opinions and data contained in all publications are solely those of the individual author(s) and contributor(s) and not of MDPI and/or the editor(s). MDPI and/or the editor(s) disclaim responsibility for any injury to people or property resulting from any ideas, methods, instructions or products referred to in the content. |
© 2026 by the authors. Licensee MDPI, Basel, Switzerland. This article is an open access article distributed under the terms and conditions of the Creative Commons Attribution (CC BY) license (http://creativecommons.org/licenses/by/4.0/).
Copyright: This open access article is published under a Creative Commons CC BY 4.0 license, which permit the free download, distribution, and reuse, provided that the author and preprint are cited in any reuse.