

Submitted:
12 September 2026
Posted:
14 September 2026
You are already at the latest version
Abstract
In Mozambique, mining is one of the main drivers of the economy, boosting investment and contributing significantly to public revenue generation. This study aims to evaluate the concentration of tantalum, niobium, and associated elements in tantalite ore. The country hosts significant occurrences of tantalite, the primary source of metals such as tantalum, niobium, iron, oxygen, and manganese. Tantalum is a metal of high technological relevance, widely used in the manufacture of electronic devices. For this investigation, tantalite samples from two distinct references (Reference I and II), as well as from tantaliferous pegmatites, were analyzed. Morphological and elemental characterization was performed using Scanning Electron Microscopy (SEM) coupled with Energy Dispersive X-ray Spectroscopy (EDS), enabling the observation of surface morphology, roughness, and chemical heterogeneity through atomic contrast between different mineral phases. The results were complemented by calculations of sample standard deviation and relative standard deviation to assess the precision of the measurements. EDS spectra confirmed the presence of predominant elements such as tantalum, iron, oxygen, aluminum, titanium, silicon, and manganese, consistent with the typical composition of tantalite and associated minerals.
Keywords:
tantalite
; SEM-EDS
; Zambézia
; mineral heterogeneity
; tantalum concentration
1. Introduction
Tantalum is a transition metal of high economic relevance, driven by the continuous expansion of its technological applications [1,2]. Owing to its physicochemical properties such as a high dielectric constant, exceptional corrosion resistance, and the ability to form stable oxides — tantalum stands out as a strategic material in a wide range of industries, including electronics, aerospace, nuclear, automotive, military, and biomedical sectors [3,4,5,6,7]. It typically occurs in association with niobium, and both elements are predominantly recovered from minerals of the tantalite–columbite group. In smaller quantities, they may also be found in primary granites, granitic pegmatites, greisen-type rocks, and in deposits associated with tin ore [8,9].
Together with tin, tungsten, and gold, tantalum is considered one of the most strategically important mineral resources worldwide. However, in several African countries, the lack of adequate technologies for exploration, extraction, and efficient mineral processing limits the contribution of these resources to local economic development [5,10]. Moreover, tantalum, tin, tungsten, and gold are often linked to conflict-affected areas and are classified as “conflict minerals” (3TG), according to international regulations [11]. These metals are commonly traded together as concentrates, whose commercial value is largely determined by their tantalum pentoxide (Ta₂O₅) content. Their prices are not regulated by metal commodity exchanges and instead result from direct negotiations between buyers and sellers [5,12]. Central African countries play a particularly important role in the global supply of tantalum concentrates, with Rwanda standing out for its policies promoting responsible and conflict-free mining [13]. Despite this, most African countries with tantalum occurrences still possess under-evaluated reserves. Figure 1 Presents the annual production of tantalum ore.
The increasing demand for strategic minerals has further intensified interest in deposits of rare and technologically valuable elements, such as tantalum and niobium. The global market for these metals moves hundreds of millions of dollars annually, largely driven by the electronics industry, particularly for the manufacturing of mobile phones, laptops, digital cameras, and other electronic devices. Niobium also plays a critical role in the production of superalloys, biomedical implants, electrolytic and ceramic capacitors, superconductors, and thin films [15,16,17,18].
Mozambique is widely recognized for its geological richness, hosting mineral resources such as tantalite, gold, gemstones, coal, and natural gas. Within the country, the Zambézia Province stands out as one of the most promising regions for the occurrence and exploitation of tantalite deposits. The locality of Mutala, located in this province, contains confirmed tantalite occurrences, although these remain insufficiently studied in a systematic and comprehensive manner. The absence of consolidated data regarding the elemental grades of the ore particularly the concentration of tantalum poses significant challenges to the evaluation of its economic viability. Therefore, determining the content of tantalum and associated elements such as niobium (Nb), tin (Sn), titanium (Ti), and rare-earth elements (REEs) is essential for assessing the economic potential of the ore, establishing effective beneficiation strategies, and supporting the development of sustainable mining projects in the region [1].
2. Materials and Methods
This section presents the materials used in the study, followed by a description of the analytical methods applied for sample characterization.
2.1. Materials
The materials analyzed in this study consist of tantalite and tantaliferous pegmatites collected from an active mine located within granitic pegmatitic rocks in Mutala, Zambézia Province, Mozambique. The sampling was conducted in collaboration with local miners.The tantalite samples were 100% manually extracted, exhibiting a dark-brown color and irregular to subconchoidal morphology. The granitic pegmatite samples consisted predominantly of isolated, coarse crystals, also manually extracted, with additional fine-grained zones containing particles with a maximum size of approximately 1 mm [19].
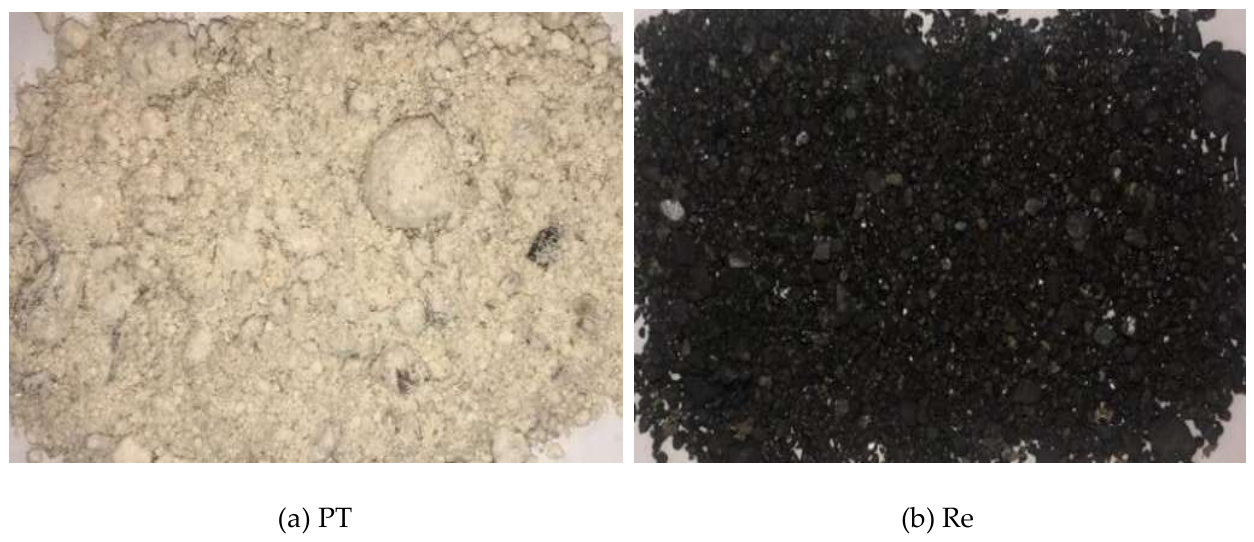
Figure 2.
Materials used in this study: (a) granitic pegmatites and (b) tantalite.
2.1.1. Sample Preparation
The tantalite sample was first processed using a manual crusher and then ground with a mortar and pestle. Subsequently, the material was sieved to separate the particles into suitable size fractions, facilitating the cleaning process. The final particle size used for analysis was <125 μm [20]. To remove dust and residual impurities, the samples were washed with deionized water, ensuring that they were thoroughly cleaned prior to analysis [21]. After washing, the samples were placed in a drying oven for degassing at 80 °C for 24 hours. This step was necessary to remove moisture from the material and ensure optimal conditions for subsequent analytical procedures.
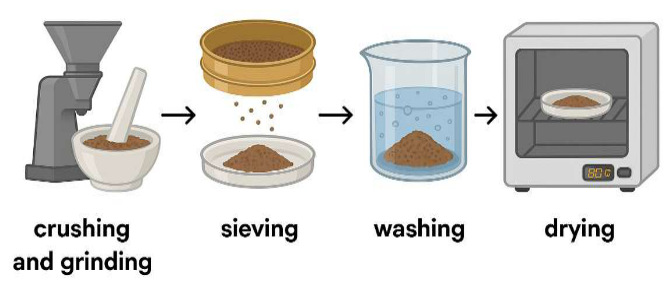
Figure 3.
Schematic representation of the tantalite sample preparation procedure.
2.2. Methods
2.2.1. Scanning Electron Microscopy (SEM)
The morphological characterization of the tantalite and tantaliferous pegmatite samples was performed using a field-emission gun ultra-high-resolution scanning electron microscope (FEG-SEM), model NOVA 200 NanoSEM (FEI Company).For the tantalite samples, imaging was carried out using a Low Vacuum Detector (LVD) under an accelerating voltage of 10 kV, with magnifications of 1000×, 5000×, and 15000×, and a working distance (WD) between 7.1 and 7.2 mm. Atomic contrast images were acquired using a Gaseous Analytical Detector (GAD) at accelerating voltages of 15 kV, magnifications of 1000× and 10000×, and working distances of 6.2–6.7 mm.For the tantaliferous pegmatite samples, imaging was performed using the LVD at an accelerating voltage of 10 kV. Additional atomic-contrast imaging using the GAD detector was conducted at accelerating voltages ranging from 10 to 15 kV.
2.2.2. X-ray Energy-Dispersive Spectroscopy (EDS)
The chemical composition of the samples was analyzed using X-ray Energy-Dispersive Spectroscopy (EDS), integrated into the SEM system. The measurements were performed at an accelerating voltage of 15 kV using an EDAX Si(Li) detector equipped with an ultrathin window (SUTW). Qualitative and quantitative acquisition and processing of the X-ray spectra (B and U peaks) were conducted using ZAF matrix correction for elemental quantification.
3. Results and Discussion
3.1. Microstructural Analysis
Figure 4 presents the micrographs obtained by Scanning Electron Microscopy (SEM) for the tantalite and tantaliferous pegmatite samples, acquired using the Low Vacuum Detector (LVD) and the Gaseous Analytical Detector (GAD), at a magnification of 1000× and accelerating voltages of 10 kV and 15 kV. The objective of this analysis was to examine the surface characteristics of the samples [22]. The SEM microstructural observations were employed for qualitative assessment. Images (a) and (b) correspond to the tantalite samples analyzed with different detectors. Both reveal the presence of distinct mineral phases with well-defined boundaries, indicating clear chemical and structural heterogeneity. A strong brightness contrast is observed, with regions ranging from light gray to dark gray. This contrast variation is primarily related to the atomic number of the constituent elements and is also influenced by surface topography and roughness [23,24].
In images (c) and (d), corresponding to the tantaliferous pegmatites, a partially homogeneous distribution is observed, with zones appearing in light gray, dark gray, and uniform gray. These micrographs reveal irregular and fragmented morphological structures, as well as the presence of aggregates of smaller particles. These textural features suggest variations related to crystallization processes or mechanical fragmentation during the geological cycle.
3.2. Energy-Dispersive X-ray Spectroscopy (EDS)
Figure 5 and Figure 6, Show the EDS spectra obtained from the surface of the tantalite sample prior to the removal of gangue minerals. These results were used to quantitatively assess the chemical and structural composition of the material, revealing a variable elemental composition. Across all analyzed regions (Ref. Z1, Ref. Z2, and Ref. Z3), the spectra exhibited the same set of elements, indicating the presence of tantalum (Ta), titanium (Ti), iron (Fe), oxygen (O), silicon (Si), aluminum (Al), magnesium (Mg), carbon (C), and manganese (Mn). However, the intensity of the peaks varied among the analyzed areas, reflecting differences in the relative mass percentages of the detected elements. The results for the tantaliferous pegmatite samples were also obtained through EDS spectral analysis. (Figure 7) presents the spectra acquired from different regions of the pegmatite surfaces, highlighting the elemental distribution across distinct zones.
In zones PT1 and PT2, the EDS spectra revealed the presence of several elements, with oxygen (O), silicon (Si), and aluminum (Al) showing the highest concentrations. Additionally, carbon (C), potassium (K), and iron (Fe) were detected with lower peak intensities, indicating their comparatively lower abundance in these regions.
In contrast, zones PT3 and PT4 also exhibited a wide variety of elements, including silicon (Si), oxygen (O), aluminum (Al), carbon (C), potassium (K), phosphorus (P), bismuth (Bi), and iron (Fe). These elements are commonly associated with pegmatitic rocks, reflecting the presence of minerals typically found in such lithologies [25]. The detection of carbon suggests the possible presence of carbonate minerals, such as calcite or dolomite. Silicon is indicative of silicate phases such as quartz or feldspar [26,27]. The remaining elements, although present in smaller quantities, are likely associated with accessory minerals characteristic of tantaliferous pegmatites.
Across all EDS analyses, metals, nonmetals, and metalloids were quantified. The metals detected include tantalum (Ta), iron (Fe), manganese (Mn), titanium (Ti), and aluminum (Al); the nonmetals correspond to oxygen (O) and carbon (C); and the metalloid identified was silicon (Si). The results reveal significant variability in the concentrations of these elements across the analyzed regions.
Tantalum (Ta), the primary element of economic interest, was detected in very low concentrations (0.10 wt% to 1.23 wt%), and niobium (Nb) was not detected in any of the analyzed zones. Conversely, other elements typically associated with the crystal structure of tantalite were identified in higher concentrations, particularly iron (Fe) (26.36 wt% to 31.84 wt%) and oxygen (O) (29.71 wt% to 41.73 wt%). The relatively low concentration of manganese (Mn) (1.64 wt% to 1.84 wt%), combined with the predominance of iron, supports the classification of the sample as Tantalite-(Fe).
The concentration levels identified in this study are consistent with those reported by [28], who also observed high concentrations of oxygen (O), silicon (Si), and aluminum (Al), as well as low levels of economically relevant elements such as tantalum (Ta) and niobium (Nb) prior to gangue mineral removal. The results obtained here align with the literature describing samples analyzed before gangue separation. However, they diverge from the findings reported in [29,30,31,32], which document significantly higher concentrations of Ta and Nb using leaching-based separation techniques.
3.3. Evaluation of Tantalite and Tantaliferous Pegmatite
Table 1 presents the quantitative concentration levels of the elements identified in the tantalite sample, expressed in weight percentage (wt%) and atomic percentage (at%). The low concentrations of tantalum (Ta) and niobium (Nb) detected in the elemental composition analyses may be attributed to several geological and technical factors. From a geological perspective, Ta- and Nb-bearing minerals such as Tantalite-(Fe) and Tantalite-(Mn) may occur heterogeneously within the mineralized body. This uneven distribution affects localized or point-based analytical techniques, especially when the sampling area is small relative to the mineral’s overall heterogeneity [33,34]. Surface weathering processes may also contribute to partial leaching of Ta and Nb, reducing their concentrations in the outermost zones of the deposit [35].
From an analytical standpoint, it is important to consider the limitations of the EDS technique. EDS has restricted detection limits for certain metals and associated oxides, which may lead to underestimation of elements present in low concentrations [33]. In this context, the low Ta and Nb contents observed in this study may partially reflect the inherent constraints of the technique rather than solely the true geological composition.
Table 2 shows the quantitative results obtained for the tantaliferous pegmatite samples, determined using EDAX ZAF quantification. These results reveal high concentrations of oxygen (O), silicon (Si), and aluminum (Al), along with lower concentrations of iron (Fe), bismuth (Bi), carbon (C), and potassium (K). This elemental distribution is consistent with mineral assemblages characteristic of pegmatitic environments and reflects the presence of accessory minerals that indirectly contribute to the genesis and mineralogical evolution of tantalite-bearing pegmatites [35].
In contrast to the results obtained in this study, recent works have reported significantly higher concentrations of tantalum and niobium oxides. The study conducted by [36] identified substantial oxide contents in tantalum-bearing samples, with 41.72% Ta₂O₅, 11.96% Nb₂O₅, 17.94% MgO, 6.00% SiO₂, 4.66% MnO₂ and 2.75% Al₂O₃, in addition to minor amounts of other impurities. Similar findings were reported by [31,37], whose tantalite concentrates exhibited high levels of Ta (ranging from 48.47 wt% to 6.72 wt%) and Nb (between 4.03 wt% and 4.37 wt%), primarily obtained through separation and chemical leaching processes.
In particular, an average concentration of 31.99 wt% ± 0.83 wt% Ta₂O₅ and 11.98 wt% Nb₂O₅ was determined, demonstrating the effectiveness of purification and beneficiation techniques. These discrepancies highlight the fact that the recovery of tantalum and niobium oxides varies considerably depending on the mineral purity and the processing method employed. Pure tantalite is extremely rare; elements such as Fe, Mn, Ti, W, Th, and Al are common impurities whose proportions vary widely according to the geological characteristics of the deposit [38,39]. These findings are supported by additional studies, such as those reported in [40,41], which also describe elevated Ta₂O₅ and Nb₂O₅ levels in samples analyzed after mineral concentration procedures.
3.4. Evaluation of SSD and RDS of Tantalite and Tantaliferous Pegmatites
Figure 8 and Figure 9 present the sample standard deviation (SSD) and the relative standard deviation (RSD) of the tantalite sample. Arithmetic calculations were applied to quantify and express the reliability and precision of the measurements relative to the arithmetic mean. The viability of the mean values was assessed in percentage terms by comparing the dispersion across the different detected elements. Higher SSD and RSD values indicate greater heterogeneity or greater variation in elemental concentrations [42].
Figure 8a Shows the mean concentration and standard deviation of the elements detected in the tantalite sample, highlighting the predominance of oxygen (34.99 wt%), iron (29.5 wt%), and titanium (27.24 wt%), with moderate-to-high variations among the analyzed points. Tantalum (0.65 wt%) was detected at very low levels, which may be attributed to mineralogical heterogeneity, weathering processes, or limitations of the EDS technique. Figure 8b Presents the calculated relative standard deviation. The evaluation of RSD revealed high variability in the concentration of some elements, such as magnesium (155.15%), tantalum (86.81%), and manganese (87.03%), indicating significant uncertainties arising from low elemental concentrations or strong sample heterogeneity. In contrast, elements such as iron (9.6%) and titanium (14.5%) exhibited low relative variability, reflecting higher measurement precision and suggesting a more homogeneous distribution of these oxides within the sample.
Figure 9c Shows the sample standard deviation relative to the mean for the tantaliferous pegmatite samples. Figure 9d reveals elements with high relative standard deviations—including K (200%), Fe (200%), Bi (126.7%), P (122%), C (122.2%), and Si (36.3%)—indicating extremely high uncertainty or very low concentrations approaching detection limits. Therefore, the elements present in higher concentrations and showing more reliable measurements in these samples are O (4.53%), Al (18.78%), and Fe (200%).
4. Conclusions
In this study, it was possible to evaluate the concentration levels of tantalum and associated elements, both directly in the tantalite ore and indirectly through the tantaliferous pegmatite from Alto Molocué, Mutala, Zambézia Province, Mozambique. The surface morphology and elemental composition of the samples were analyzed using Scanning Electron Microscopy (SEM) for morphological characterization and Energy-Dispersive X-ray Spectroscopy (EDS) for quantitative elemental analysis.
- SEM results of the tantaliferous pegmatite revealed a rough and heterogeneous surface texture, with distinct mineral phases observed at different magnifications. These features are essential for supporting the interpretation of elemental composition.
- SEM micrographs of the tantalite showed well-defined mineral phase boundaries, confirming the chemical and structural heterogeneity of the sample. Bright regions correspond to heavy-element phases, whereas darker regions represent areas dominated by low–atomic number elements.
- EDS elemental analysis of the tantalite identified a variable chemical composition across all analyzed regions (Ref. 1, Ref. 2 and Ref. 3). The spectra consistently revealed the presence of tantalum (Ta), titanium (Ti), iron (Fe), oxygen (O), silicon (Si), aluminum (Al), magnesium (Mg), carbon (C), and manganese (Mn). Oxygen (O), iron (Fe) and titanium (Ti) were the dominant elements, while tantalum (Ta) and niobium (Nb), were detected only in very low concentrations.
- EDS analysis of the tantaliferous pegmatite samples showed the presence of several elements, with oxygen (O), silicon (Si) and aluminum (Al) presenting the highest concentrations, as indicated by their intense peaks.
The concentrations of tantalum observed in this study are comparable to those reported in recent works analyzing samples before the removal of gangue minerals. However, the results differ from studies that employ leaching-based concentration techniques, such as Inductively Coupled Plasma Mass Spectrometry (ICP-MS) and X-ray Fluorescence (XRF), which typically report significantly higher Ta and Nb contents after mineral processing.
The low concentrations of tantalum and niobium may be attributed to several factors, including: (i) analytical limitations of EDS, which has higher detection limits and may underestimate certain metal oxides; (ii) geological factors, such as heterogeneous mineral distribution; (iii) weathering processes, which may have contributed to partial leaching of Ta and Nb from the outer zones of the deposit. Overall, the results obtained in this study are consistent with literature describing samples analyzed prior to gangue mineral separation. The findings highlight the need for complementary mineral processing steps and more sensitive analytical techniques to accurately quantify economically relevant oxides in tantalum-bearing deposits.
Author Contributions Ramadane Rasse
Conceptualization, Methodology, Formal Analysis, Investigation, Writing – Original Draft, Writing – Review & Editing. Sérgio L. Nhapulo: Methodology, Formal Analysis, Writing – Review & Editing. Joaquim Carneiro: Methodology, Formal Analysis, Writing – Review & Editing. Edson F. Raso: Writing – Review & Editing. Manuel F. M. Costa: Conceptualization, Methodology, Formal Analysis, Investigation, Writing – Review & Editing.
Funding
This work was partially funded by the Erasmus+ Programme through the ERASMUS+ International Credit Mobility UMove (ME) 2023 project, reference AK171. This work was supported by the Portuguese Foundation for Science and Technology (FCT) in the framework of the Strategic Funding UID/04650/2025.
Acknowledgments
The authors sincerely thank the financial support and the opportunity provided by the ERASMUS+ and Portuguese Foundation for Science and Technology (FCT) program.
References
- Melcher, F., et al., Tantalum-(niobium-tin) mineralisation in African pegmatites and rare metal granites: Constraints from Ta–Nb oxide mineralogy, geochemistry and U–Pb geochronology, Ore Geol. Rev. 64 (2015) 667–719. [CrossRef]
- Klaus, J.F.P., Schulz, J., Piatak, N.M., Niobium and Tantalum, U.S. Geological Survey, 2017.
- >Espinoza, L.A.T., Case Study: Tantalum in the World Economy – History, Uses and Demand, University of Dundee, 2012.
- >Toure, M., Arrachart, G., Duhamet, J., Pellet-Rostaing, S., Tantalum and niobium selective extraction by alkyl-acetophenone, Metals 8(9) (2018) 654. [CrossRef]
- Bleiwas, D., Papp, J., Yager, T., Shift in global tantalum mine production, 2000–2014, USGS Fact Sheet (2015). [CrossRef]
- P., N.H., Muchez, D.S., Geological mapping and implications for Nb–Ta, Sn and W prospection in Rwanda, Bull. Séances Acad. R. Sci. Outre-Mer 60(3) (2014) 515–530.
- >Amuda, M.O.H., Esezobor, D.E., Lawal, G.I., Adaptable technologies for life-cycle processing of tantalum bearing minerals, J. Miner. Mater. Char. Eng. 6(1) (2007) 69–77. [CrossRef]
- Ryznar, J., Pršek, J., Włodek, A., & Uher, P. (2023). Mineralogy and chemistry of columbite-tantalite from Bugarura-Kuluti area, Karagwe-Ankole Belt, Rwanda: Indicators of pegmatite and granite evolution. Ore Geology Reviews, 159, 105574. [CrossRef]
- Parker, R. L., & Fleischer, M. (1968). Geochemistry of niobium and tantalum (U.S. Geological Survey Professional Paper 612). U.S. Geological Survey. [CrossRef]
- Wolfe, L., How Dodd-Frank is failing Congo, Foreign Policy, 2015. https://foreignpolicy.com/2015/02/02/how-dodd-frank-is-failing-congo-mining-conflict-minerals/.
- Parlamento Europeu & Conselho da União Europeia, Regulamento (UE) 2017/821. 2017; >11. Parlamento Europeu & Conselho da União Europeia, Regulamento (UE) 2017/821, 2017.
- 2020. Available online: https://www.tanb.org/about.
- >Tkachev, A.V., Rundqvist, D.V., Vishnevskaya, N.A., Global metallogeny of tantalum through geological time, Geol. Ore Depos. 61(6) (2019) 512–529. [CrossRef]
- Alves, A., Rodrigues, A., Life cycle assessment of niobium, Miner. Eng., 2019. [CrossRef]
- Schulz, K. J., Piatak, N. M., & Papp, J. F. (2017). Niobium and tantalum. In K. J. Schulz, J. H. DeYoung Jr., R. R. Seal II, & D. C. Bradley (Eds.), Critical mineral resources of the United States—Economic and environmental geology and prospects for future supply (U.S. Geological Survey Professional Paper 1802-M). U.S. Geological Survey. [CrossRef]
- Fleck, J. (1995). Tantalum and its alloys. International Journal of Refractory Metals and Hard Materials, 13(4), 187–191, 193–194. [CrossRef]
- Belz, L. H. (1984). Tantalum and niobium in some electronic applications. ASTM Special Technical Publication, 70–81. [CrossRef]
- Liu, Z., Zhao, M.-C., Yin, D., Zhao, Y.-C., & Atrens, A. (2025). Bio-functional niobium-based metallic biomaterials: Exploring their physicomechanical properties, biological significance, and implant applications. Acta Biomaterialia, 192, 1–27. [CrossRef]
- Silva, J.P.P., Meira, L.D.A.S., Silva, R.P., Caracterização mineralógica de minério de tântalo e nióbio, Holos 3 (2014) 378–385. [CrossRef]
- Jordens, A., Cheng, Y. P., & Waters, K. E. (2017). A process mineralogy approach to gravity concentration of tantalum bearing minerals. Minerals, 7(10), 194. [CrossRef]
- Araujo Pacelly, C. P. B., Barbosa, C. M., Souto, M. V. M., Vital, A. B., Ramalho, T. E. B., de Souza, C. P., & Gomes, U. U. (2021). Evaluation of the effect of the fluxing agent over the purification of columbite-tantalite ore for the synthesis of Nb,Ta mixed oxides. Minerals Engineering, 170, 107073. [CrossRef]
- Pereira Lessa, F., et al., Application of nano-TiO₂ and micro-ZnO on cementitious surfaces, J. Build. Pathol. Rehabil. 10(1) (2025). [CrossRef]
- Lloyd, G. E. (1987). Atomic number and crystallographic contrast images with the SEM: A review of backscattered electron techniques. Mineralogical Magazine, 51(359), 3–19. [CrossRef]
- Goldstein, J. I., Newbury, D. E., Joy, D. C., Lyman, C. E., Echlin, P., Lifshin, E., Sawyer, L., & Michael, J. R. (2017). Scanning Electron Microscopy and X-Ray Microanalysis (4th ed.). Springer. [CrossRef]
- Phelps-Barber, Z., Trench, A., Groves, D.I., Recent pegmatite-hosted spodumene discoveries in Western Australia, Appl. Earth Sci. 131(2) (2022) 100–113. [CrossRef]
- Mitchell, R.H., Gittins, J., Carbonatites and carbothermalites: A revised classification, Lithos 430–431 (2022) 106861. [CrossRef]
- Harris, D.C., Quantitative Chemical Analysis, 9th ed., W.H. Freeman, 2015.
- >Habinshuti, J.B., et al., Mineralogical and physical studies of low-grade tantalum–tin ores from Rwanda, Results Eng. 11 (2021) 100248. [CrossRef]
- Dampare, S.B., et al., Determination of Ta, Nb, Th, U in placer columbite-tantalite deposits, Ghana, 2005.
- >Alhassan, Y., et al., EDXRF analysis of Nigerian tantalite ore, J. Environ. Chem. Ecotoxicol. 2(3) (2010) 4.
- >Berhe, G.G., Cheru, M.S., Hydrometallurgical assessment of oxides of Nb, Ta, Th and U from Ethiopian tantalite ore, Heliyon 10 (2024) e24870. [CrossRef]
- Hassan, E. S. R. E., Chen, Y., Abdel-Khalek, N. A., & Elbendari, A. M. (2025). Enhanced tantalum and niobium recovery from fine-grained low-grade Abu Dabbab ore using Falcon concentration and magnetic separation. Scientific Reports, 15, 16316. [CrossRef]
- Goldstein, J.I., Newbury, D.E., Joy, D.C., Lyman, C.E., Echlin, P., Lifshin, E., Sawyer, L., Michael, J.R., Scanning Electron Microscopy and X-ray Microanalysis, 4th ed., Springer, 2017.
- >Dittrich, T., Seifert, T., Schulz, B., Hagemann, S., Geochemistry of LCT Pegmatites, Springer, 2019. [CrossRef]
- Černý, P., Ercit, T.S., The classification of granitic pegmatites revisited, Can. Mineral. (2005). [CrossRef]
- Agho, T.I., Okuu, J.M., Optimization of tantalite dissolution via HF–H₂SO₄ acid, Asian J. Appl. Chem. Res. 15(4) (2024) 172–193. [CrossRef]
- Jackson, A.A., Mulaba-Bafubiandi, A.F., Makondo, C., Analytical constraints of SEM-EDS for low-concentration elements, J. Anal. Methods Geosci. 12(1) (2024) 33–45.
- >Černý, P., Ercit, T.S., The classification of granitic pegmatites revisited, Can. Mineral. 30(3) (1992) 645–652.
- >Magdalena, G.D., Geochemical variations in Ta-bearing minerals from LCT pegmatites, Ore Geol. Rev. 144 (2022) 104913. [CrossRef]
- Hassan, E.R.E., et al., Beneficiation and separation of Egyptian tantalite ore, Key Eng. Mater. 835 (2020) 208–213. [CrossRef]
- Silva, J.P.P., Meira, L.D.A.S., Silva, R.P., Caracterização mineralógica de minério de tântalo e nióbio, Holos 3 (2014) 378–385. [CrossRef]
- >Montgomery, D.C., Runger, G.C., Applied Statistics and Probability for Engineers, 6th ed., Wiley, 2014.
Figure 1.
Global tantalum mines production (A) 2023 and (B) 2024 [14].
Figure 1.
Global tantalum mines production (A) 2023 and (B) 2024 [14].
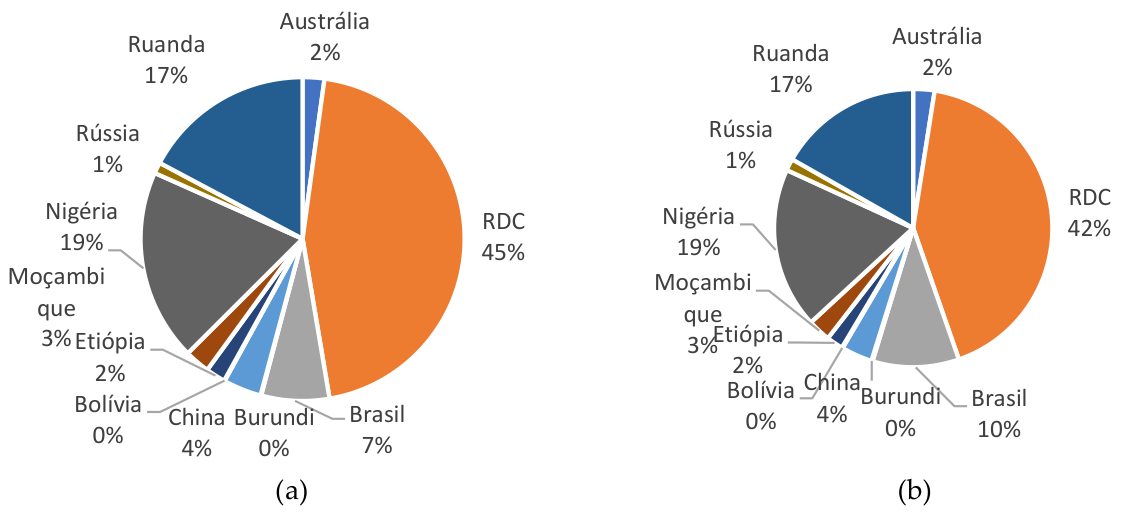
Figure 4.
SEM images of the surfaces of tantalite and tantaliferous pegmatites: (a) ref. Z1, (b) ref. Z2, (c) PT1, and (d) PT2.
Figure 4.
SEM images of the surfaces of tantalite and tantaliferous pegmatites: (a) ref. Z1, (b) ref. Z2, (c) PT1, and (d) PT2.
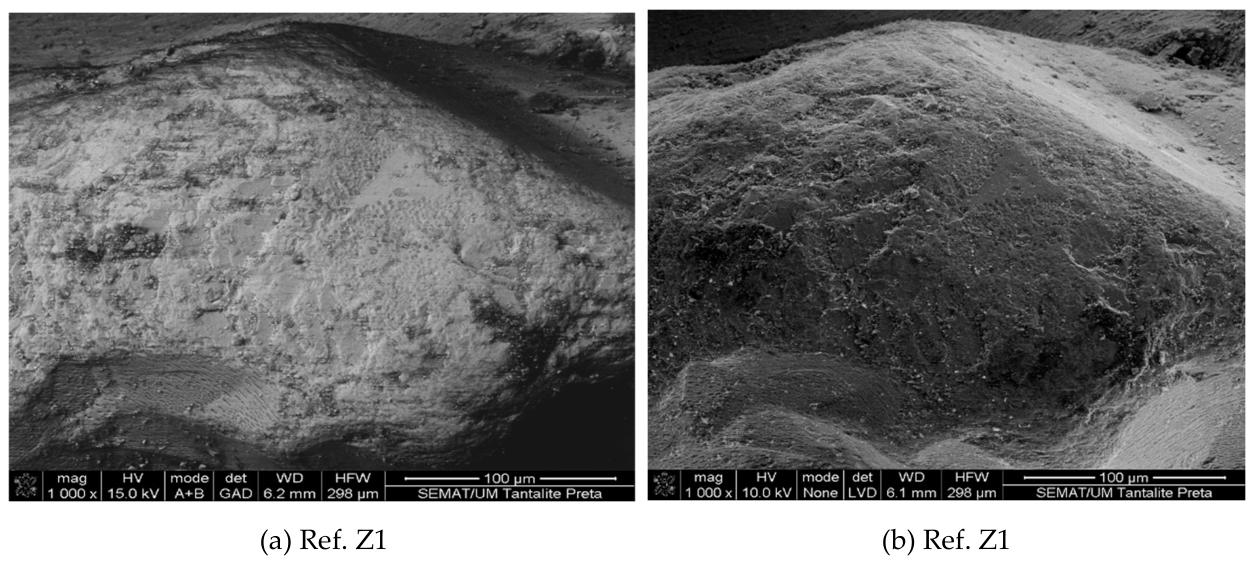
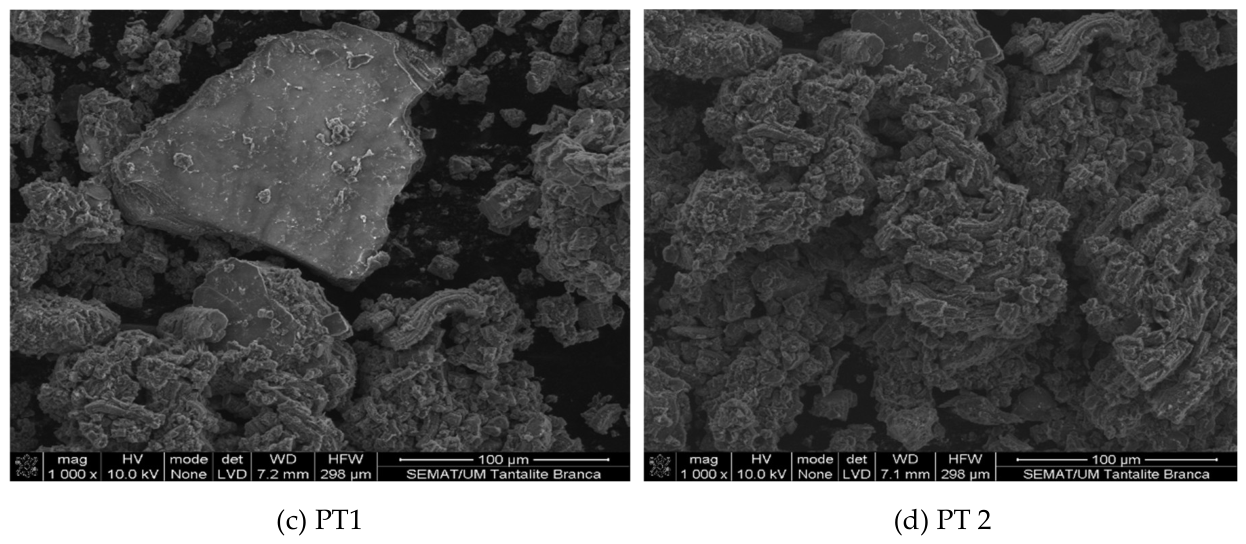
Figure 5.
SEM-EDS analysis of the surface of the tantalite sample, Ref. Z1.
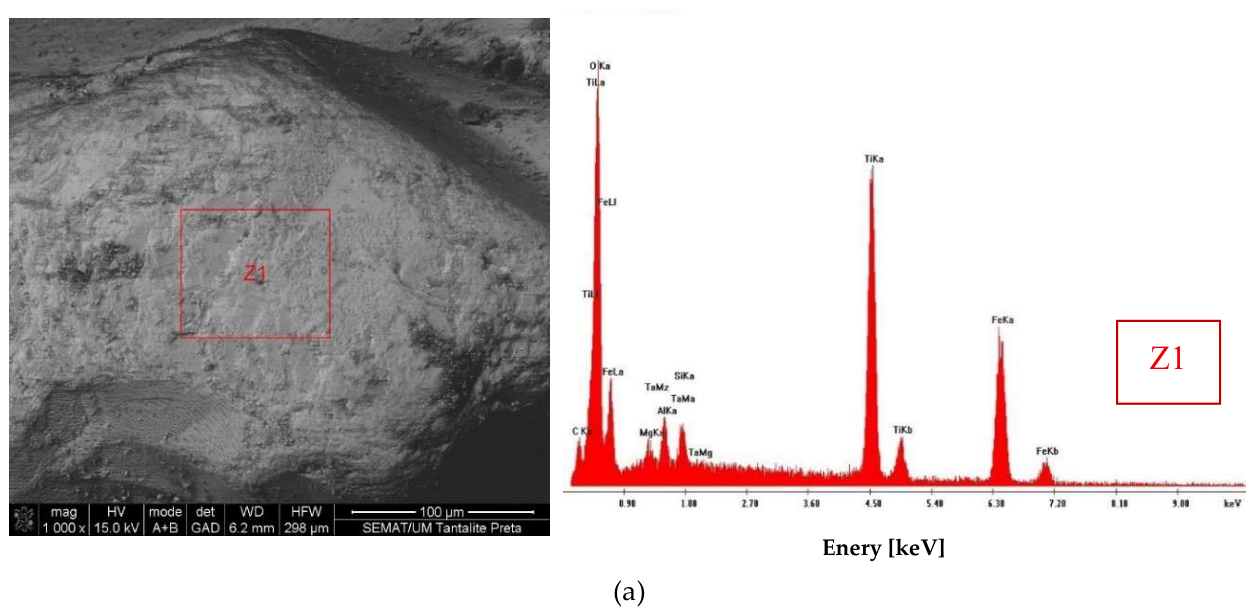
Figure 6.
SEM-EDS analysis of the surface of tantalite, Ref. Z2 e Z3.
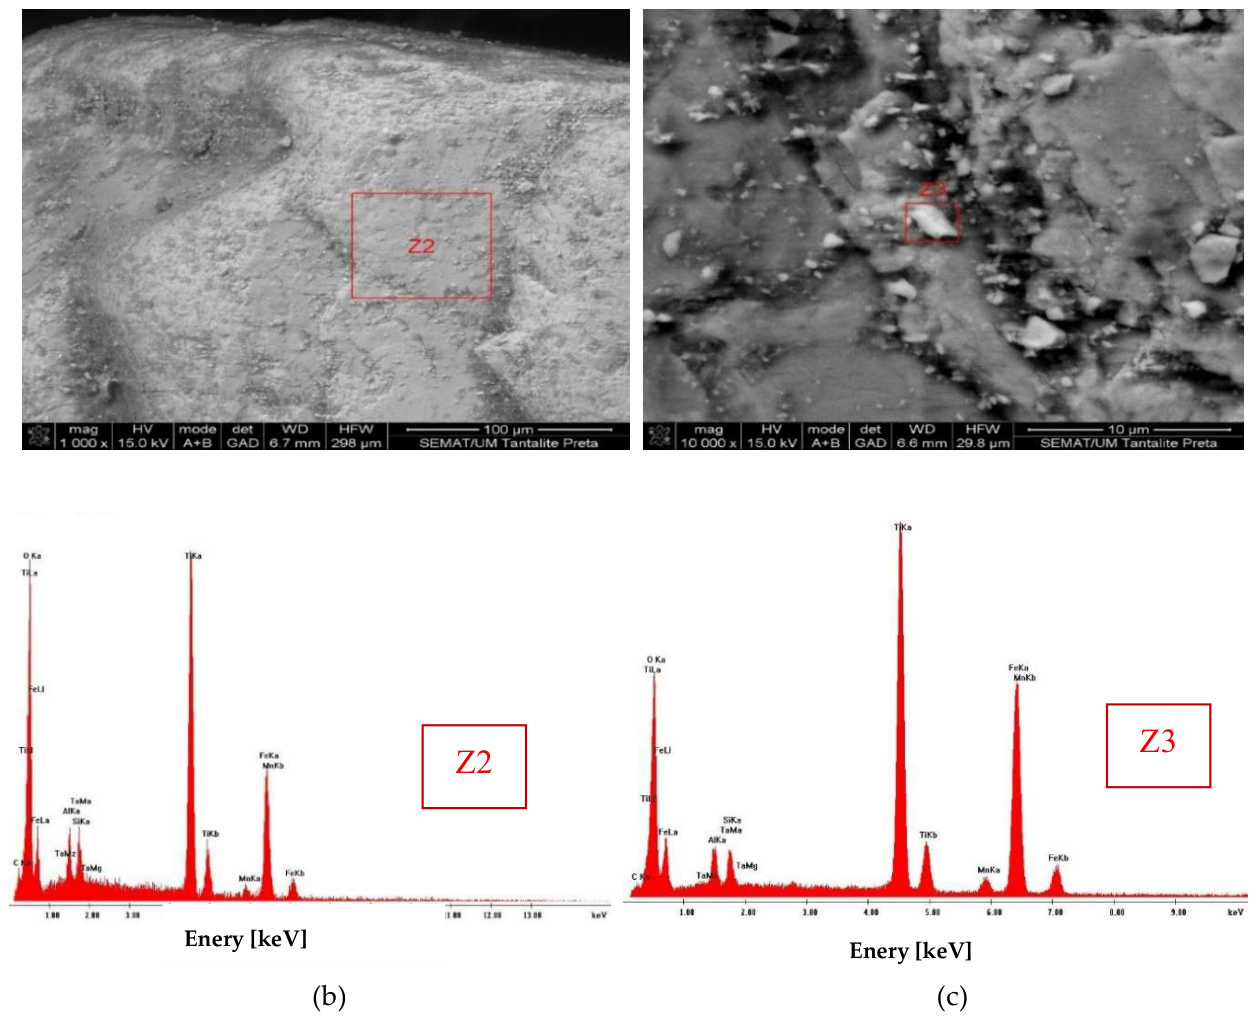
Figure 7.
SEM-EDS analysis of the surface of tantaliferous pegmatites, examined in zones PT1, PT2, PT3, and PT4.
Figure 7.
SEM-EDS analysis of the surface of tantaliferous pegmatites, examined in zones PT1, PT2, PT3, and PT4.
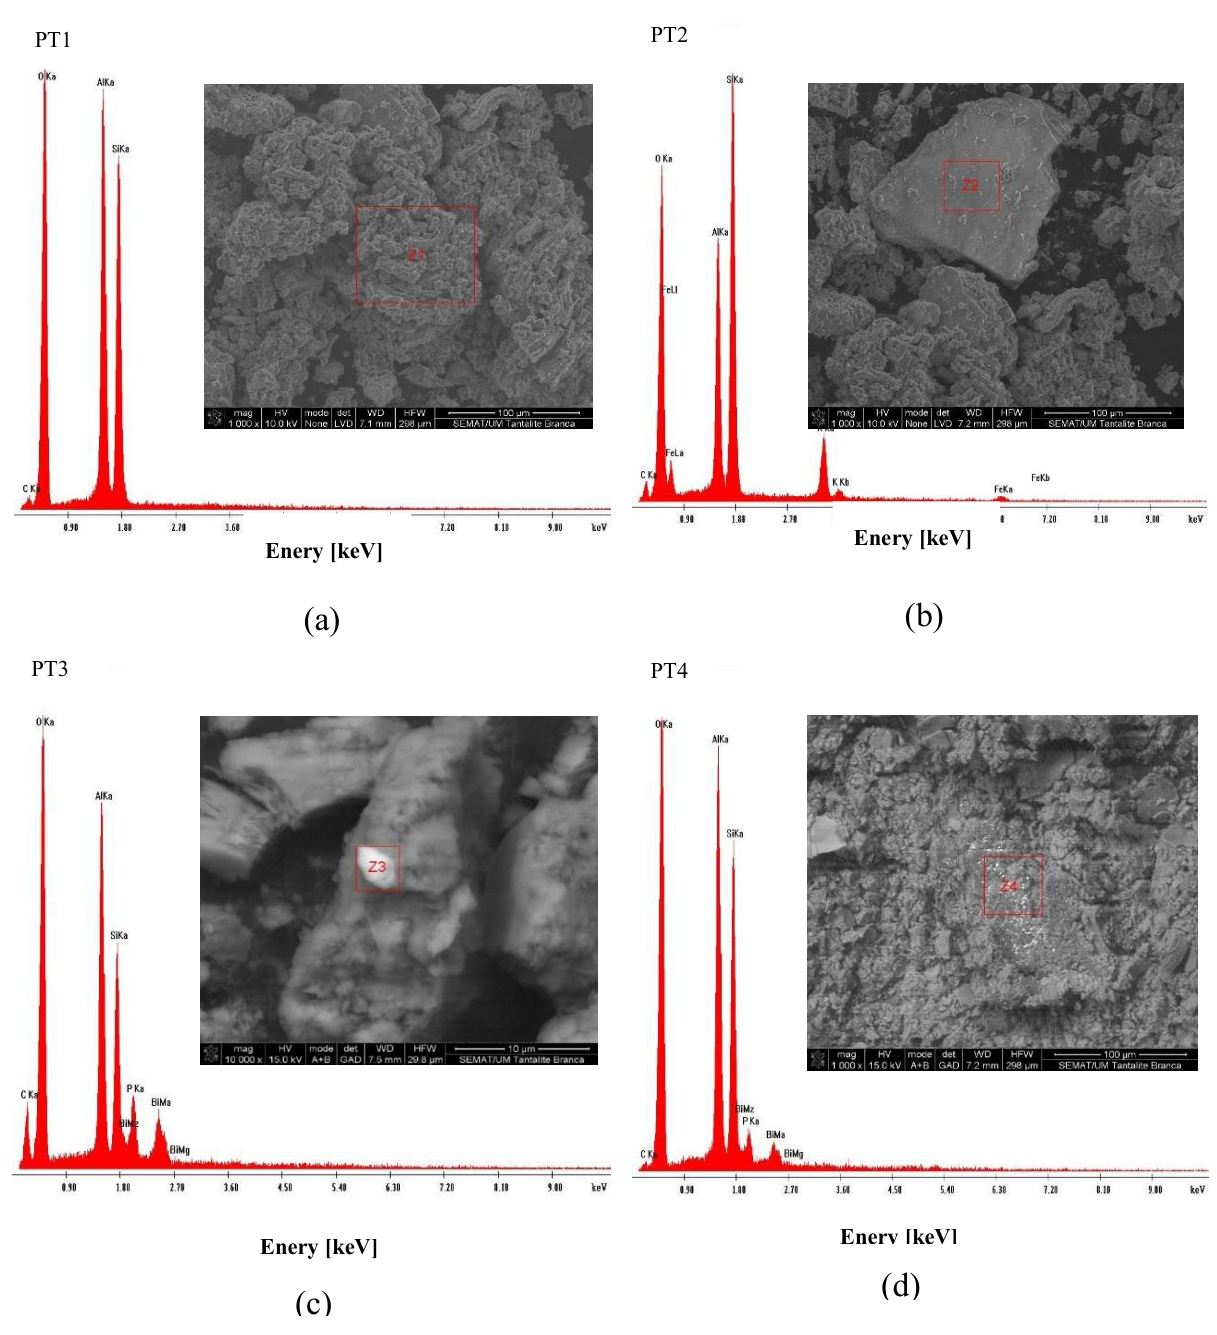
Figure 8.
Mean, Sample Standard Deviation (SSD), and Relative Standard Deviation (RSD) of Elemental Concentrations (W%) in Tantalite Samples.
Figure 8.
Mean, Sample Standard Deviation (SSD), and Relative Standard Deviation (RSD) of Elemental Concentrations (W%) in Tantalite Samples.
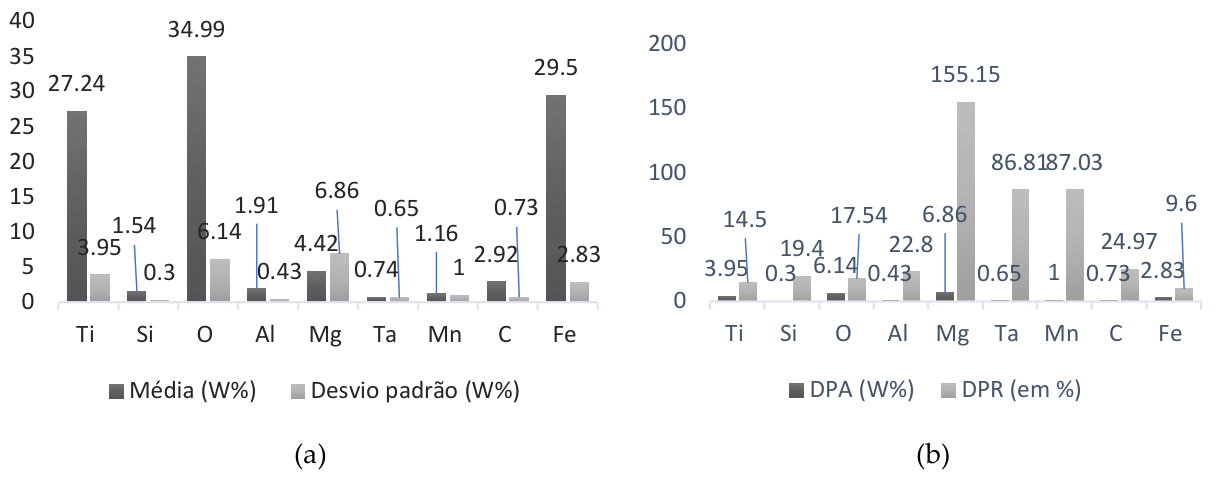
Figure 9.
Mean, Sample Standard Deviation (SSD), and Relative Standard Deviation (RSD) of Elemental Concentrations (W%) in Tantaliferous Pegmatite Samples.
Figure 9.
Mean, Sample Standard Deviation (SSD), and Relative Standard Deviation (RSD) of Elemental Concentrations (W%) in Tantaliferous Pegmatite Samples.
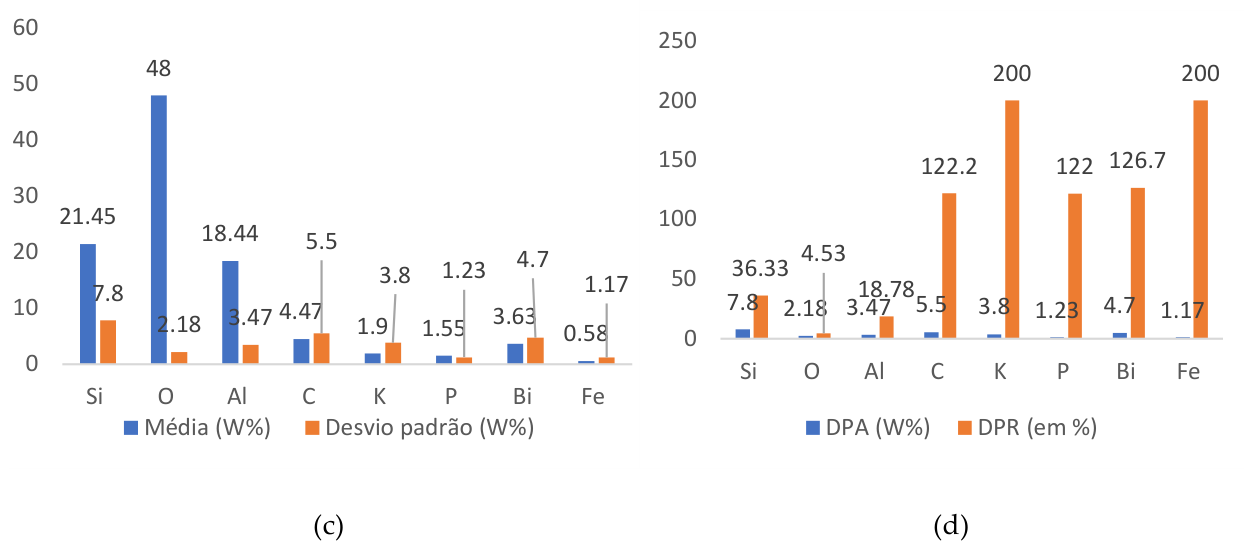

Table 1.
- Classification of Weight Percentages (wt%) and Atomic Percentages (at%) from EDS Spectra of the Tantalite Sample (Reference).
Table 1.
- Classification of Weight Percentages (wt%) and Atomic Percentages (at%) from EDS Spectra of the Tantalite Sample (Reference).
| Elements | Chemical Composition of the Sample | |||||
| Weight Percentage (wt%) and Atomic Percentage (at%) | ||||||
| Ref.1 | Ref.2 | Ref.3 | ||||
| Wt % | At % | Wt % | At % | Wt % | At % | |
| Ti | 26.92 | 15.23 | 31.34 | 19.16 | 23.46 | 12.35 |
| Si | 1.42 | 1.37 | 1.32 | 1.37 | 1.88 | 1.69 |
| O | 33.55 | 56.83 | 29.71 | 54.39 | 41.73 | 65.76 |
| Al | 1.54 | 1.55 | 1.80 | 1.95 | 2.39 | 2.23 |
| Mg | 0.94 | 1.05 | 12.32 | 20.04 | ||
| Ta | 0.01 | 0.10 | 1.23 | 0.20 | 1.00 | 0.20 |
| Mn | 1.84 | 0.98 | 1.65 | 0.76 | ||
| C | 3.77 | 8.51 | 2.48 | 6.06 | 2.53 | 5.31 |
| Fe | 31.86 | 15.46 | 30.28 | 15.88 | 26.36 | 11.90 |
Table 2.
- Classification of Weight Percentages (wt%) and Atomic Percentages (at%) from EDS Spectra of the Tantaliferous Pegmatite Sample (PGT).
Table 2.
- Classification of Weight Percentages (wt%) and Atomic Percentages (at%) from EDS Spectra of the Tantaliferous Pegmatite Sample (PGT).
| Elements | Chemical Composition of the Sample | |||||||
| Weight Percentage (wt%) and Atomic Percentage (at%) | ||||||||
| PT.1 | PT.2 | PT.3 | PT.4 | |||||
| Wt % | At % | Wt % | At % | Wt % | At % | Wt % | At % | |
| Si | 24.51 | 17.08 | 29.61 | 22.49 | 11.19 | 7.78 | 20.49 | 14.99 |
| O | 49.58 | 60.66 | 45.47 | 60.63 | 46.92 | 57.30 | 50.03 | 64.29 |
| Al | 22.08 | 16.02 | 14.99 | 11.85 | 15.91 | 11.52 | 20.67 | 15.75 |
| C | 3.83 | 6.24 | 12.32 | 20.04 | 1.73 | 2.97 | ||
| K | 7.57 | 4.13 | ||||||
| P | 3.88 | 2.45 | 2.32 | 1.54 | ||||
| Bi | 9.78 | 0.91 | 4.76 | 0.47 | ||||
| Fe | 2.35 | 0.90 | ||||||
Disclaimer/Publisher’s Note: The statements, opinions and data contained in all publications are solely those of the individual author(s) and contributor(s) and not of MDPI and/or the editor(s). MDPI and/or the editor(s) disclaim responsibility for any injury to people or property resulting from any ideas, methods, instructions or products referred to in the content. |
© 2026 by the authors. Licensee MDPI, Basel, Switzerland. This article is an open access article distributed under the terms and conditions of the Creative Commons Attribution (CC BY) license (http://creativecommons.org/licenses/by/4.0/).
Copyright: This open access article is published under a Creative Commons CC BY 4.0 license, which permit the free download, distribution, and reuse, provided that the author and preprint are cited in any reuse.