

Submitted:
11 September 2026
Posted:
14 September 2026
You are already at the latest version
Abstract
The prediction of the draping and folding behavior of textiles is important for thermoforming of lightweight components. By assessment and control of the fabric’s wrinkling, curved surfaces of components can be digitally optimized to ensure minimized folds and improved mechanical strength. A mechanical model for the folding behavior of woven fabrics is presented and exemplified for the shear-frame test and a deep-drawing application. The presented multiscale model considers the fabric on the yarn scale, from which effective material parameters in the form of homogenized stiffness tensors are derived for a 2D sheet model on the macroscale. The experimental acquisition of the force-elongation behavior of individual rovings and the calibration of the mechanical model by comparison with shear tests is presented for four woven samples, which vary in areal density and weave type. Laser scanning is employed to attain a digital 3D scan of the displaced fabrics after deep-drawing. Attained simulation results show a good agreement with physical measurements as well as the displacement fields, highlighting the practical applicability of the presented model. Another main output of the paper is a modeling based design optimization for the wrinkling reduction. It is explained, which parameters on the yarn and weaving level influence the wrinkles and how to modify the textile structure or yarns to reduce them.
Keywords:
multiscale modeling
; mechanical simulation
; homogenization
; woven fabrics
; draping
; folding
1. Introduction
Textiles are geometrically multi-scale thin plates with a periodic structure of thin continuous cylinders in a multiple contact and are macroscopically thin plates. We would like to mention some simulation and modelling works with preforming textiles, [1,2]. One of the important modelling issues of textiles is the contact between yarns, that changes the macroscopic behavior of the pre-forming textiles, see e.g., [1,3]. They show that second order derivatives in one or both directions join the constitutive equations, which is not included in any commercial tools at the moment. Contact issues between yarns are properly modelled in papers of Damian Durville, [4]. Philippe Boisse’s group developed phenomenological models based on the mechanical modelling and integrate them into the finite element approach, [5].
Under loading, all thin structures pass from the infinitesimal strain regime [6] through wrinkling regime [7] to large bending regime [8] and finally to the large membrane or tensile regime [9]. The transition from one regime to another is governed by the magnitude of the applied forces relative to the material stiffness and thickness [10]. This small strain regime is a special case of the next one, the wrinkling, or the Karman-plate behavior [7], in which the non-linear terms are too small and can be neglected in the Green-Lagrange strain tensor . This tensor can be rewritten in terms of the linearized strain tensor and displacement vector as follows:
The following convergence was proven as the thickness of the yarn, , tends to zero:
where
In this regime, see Figure 1, the applied distributed forces are in terms of the textile thickness . The homogenized energy is
where
The homogenized coefficients are computed from the unit corresponding mechanical perturbations (tension-shear-bending-torsion) on the unit periodicity cell by own software TexMath, [12], see Figure 2.
In this regime, fabric wrinkling can be the result of the non-linear behavior, see [7], or arise due to the frictional coupling of yarns in a combination of the structure, as discussed in [13,14,15,16,17,18,19,20]. If we now increase the transversally applied forces (remove one power of ), the textile comes into the large bending regime, see [8]. The difference to the linear bending model, i.e., the Koiter or Kirchhoff plate, are rotations, . Note, the effective textile-plate coefficients are the same, as was mentioned before.
Usually, the 2D plates in this regime must satisfy an isometry constraint, a condition on the preserving of the surface measure of the material. This constraint provides a coupling between the in-plane compression and the outer-plane deflection. This model is used for draping simulations [21]. The bending energy can be seen as a mean curvature energy (MCE) of the deformed 2D plane with the isometry constraint.
where the mean surface curvature vector is defined as the mean of principal curvatures and as .
The last regime is the 2D membrane one, see Figure 3. This behavior is expected when the applied tension forces, normalized by the yarn’s stiffness, are of the order of the yarn thickness, see [9] for the modelling and analysis.
In case of the strong contact, one can claim that the effective fabric is a stretchable membrane, coinciding with the 1D approximation on a yarn network and coinciding with it in the nodes. We can adopt the Saint Venant Kirchhoff (StVK) membrane (2D) model with energy density , where is an orthotropic stiffness tensor and is the planar Green-Lagrange strain tensor.
We augment the large-bending curvature energy with a 2D membrane term that penalizes changes in the in-plane surface measure, thereby enforcing the isometry constraint approximately. This combined energy is used for the draping simulation.
The aim of this paper is to demostrate the homogenization and dimension reduction for textiles especially in the shear and draping tests and to investigate the influence of the woven pattern and yarn thickness on the textile wrikling behavior. For these reasons three different weaving kinds and different yarn thicknesses were considered, simulated and experimentally validated in this paper.
2. Materials and Methods
Seven woven samples (labeled A–G) of varying areal weight are investigated. The samples can be grouped into low weight (A, B), medium weight (C, D) and high weight fabrics (E, F, G) of varying weave types. All wovens are produced from glass fiber rovings. The respective fabric specifications are provided in Table 1.
The listed geometric specifications of the samples and dimensions of individual rovings were determined from micrographs and through microscopic examinations using a scanning electron microscope (SEM) and a light microscope (LM). The resulting top and cross-sectional views are provided in Figure 4.
The tensile behavior and breaking force of rovings are determined from force-elongation measurements performed with a Textechno STATIMAT 4U at a test speed of 200 mm/min. The tests are conducted as standard tensile tests using a 500 N load cell and a gauge length of 250 mm. The specimens are clamped pneumatically at a clamping pressure of 5 bar to minimize slippage during loading. The experiments are repeated for 10 roving samples, respectively. The attained force-elongation diagrams are presented in Figure 5. For better comparison, the presented forces are scaled by the respective titer. As can be observed, the lighter rovings with titer of 33 tex possess the highest stiffness and strength with a linear slope of approximately 3,000 cN/tex. The linear slopes of the remaining samples are close to 2,400 cN/tex.
In-plane shear behavior is characterized using shear-frame tests for all fabric samples. The tests are conducted using a Type 1455 universal testing machine manufactured by Zwick-Roell, Ulm, Germany. The textiles are cut to squares of edge length 400 mm using a CNC cutter and clamped into a shear frame lined with emery paper. The frame and the textile were sheared by the testing machine’s mechanism. The geometric setup is shown in Figure 6. The experiments are repeated five times per sample.
To assess the folding behavior of the samples, a draping test into a double-curved and complex spherical geometry with a spherical diameter of 200 mm is performed. The geometry molds are shown on the left-hand side of Figure 7. To this end, the samples are cut into squares of edge length 450 mm with a CNC cutter and placed on the negative mold with hole perforations. A six-arm robot moves the positive mold into the negative mold in a linear motion. In the process, the textile is reshaped and draped. Before opening of the mold, a vacuum is applied beneath the negative mold to fix the folded and distorted textile in place. The experimental setup is shown on the right-hand side of Figure 7. Once the mold is fully opened, a 3D scan is carried out whilst the vacuum is maintained, using a Revo Trackit line laser scanner. The resulting point cloud in space is used to digitally recreate the fold geometry, the precision of the shaping and the dimensional accuracy of the textile. The described draping test is performed with the two low weight samples (A,B) and one of the high weight samples (F).
Based on the experimentally determined specifications, a digital mechanical twin for the respective samples is created in the textile FEM software TexMath, v. 1.6.2 [12]. In addition to the geometric and mechanical parameterization of rovings in weft- and warp direction, the employed model incorporates the yarn density and yarn prestrain. Individual rovings are represented by effective 1-dimensional elements with elliptical cross-section. The contact between individual rovings is modeled as an effective 1D contact of Robin-type as derived in [13]. The generated periodic units of the samples are illustrated in Figure 8.
3. Results
In the following sections, the employed simulation chain from the yarn scale to the assessment of the folding behavior on the macroscale and comparative results with experimental measurements are presented.
3.1. Simulation and Experimental Results on the Yarn Scale
3.1.1. Model Investigation on the Periodic Unit Cell
Following the analytical derivations in [6,7,22], the extensional stiffness of the woven samples is computed by solving three auxiliary PDE on digital replicas of periodic units shown in
Figure 8. The auxiliary problems correspond to unit macroscopic strain states in the two principal fabric directions and to in-plane shear, see [7]. Based on the force-elongation curves of individual rovings in Figure 5, a linear elastic material law is employed. The stiffness is represented by the 2D extensional stiffness tensor . By exploiting the usual symmetry conditions
and orthotropy of the tensor under warp and weft alignment with the main coordinate axes [7], the number of independent tensor entries can be reduced to the axial stiffness components , the shearing stiffness component and the normal-coupling component . All computed values are provided in Table 2. The remaining computed values are zero to working precision.
The influence of weave type is assessed by comparing the nominally matched plain-weave and 2/2-twill pairs A–B, C–D, and E–F. For all three pairs, the axial stiffness components and differ by less than 0.3%, indicating that the axial response is predominantly governed by the roving properties and thread densities. In contrast, the shear stiffness of the twill fabrics is 0.3%, 9.3%, and 4.7% lower for samples B, C, and F relative to the corresponding plain-weave fabrics, respectively. This indicates that the weave type primarily affects the in-plane shear response through changes in interlacing geometry and roving contact conditions. Moreover, the normal-coupling component is substantially higher for the twill fabrics. Its absolute magnitude however remains small compared with the axial stiffness components.
Sample G exhibits the highest axial and shear stiffnesses. This behavior can be attributed to the combination of high thread density, high yarn linear density in the warp direction, and the resulting increased number of inter-roving contact surface per unit fabric area. Compared to sample A, the axial stiffness is increased by approximately 112%, while the shearing stiffness is increased by approximately 284%.
The variation in thread density in weft and warp direction for samples C to G is captured by the difference between the stiffness tensor entries and . The relative differences are close to the relative differences in the thread densities, respectively. To compare the stiffness tensors in-between the samples, the directional extensional stiffness
in the warp-weft plane is plotted in Figure 9. A characteristic petal-like directional stiffness is observed, which further highlights the low shearing stiffness of the samples compared to their tensile stiffness along the warp and weft directions.
The employed mechanical model from [13] prescribes a friction parameter for contact between rovings which cannot be attained from physical measurement directly. It is therefore inversely calibrated for each fabric by fitting the simulated shear-force response to the corresponding experimental shear-frame results described in Section 2. The fitted force-displacement curves are compared to the simulation results on the macroscale for the stiffness tensors provided in Table 2. Since the shear-test data are used for parameter calibration, the comparison in Figure 10 demonstrates the quality of the calibration. The simulated responses reproduce the measured shear behavior within the experimental variation for all investigated fabrics. The largest experimental variations are observed for sample B, which may be associated with specimen orientation during clamping and local fabric inhomogeneity. Based on the fabric specifications in Table 2, representative shearing results for sample B are expected to be similar to sample A.
To further illustrate the influence of structure parameterization and material choice on the computational results, a sensitivity study is provided in Figure 11.
While keeping the remaining model parameters fixed, distance between adjacent crossover points (denoted as weave distance), cross-sectional radius and Young’s modulus for rovings in warp direction as well as the friction parameter are varied for Sample B. The variation is performed by increasing and decreasing fixed reference values in the range of ±50%, respectively. An increase of 0% represents the reference value. The corresponding stiffness tensor value coincides with the value provided in Table 2.
Regarding changes of weave distance, yarn radius and Young’s modulus, the expected monotonic dependence on the tensile stiffness in warp direction, , is observed. The influence of the yarn radius on the shearing stiffness and tensile stiffness in weft direction, and , are non-trivial. Increasing the yarn radius in warp direction increases the fluctuation of yarns in weft direction, thereby slightly decreasing the tensile stiffness in weft direction. The most significant influence is observed when changing the friction parameter for roving-roving contact. While the tensile stiffness does not change, the computed shearing stiffness varies by several orders of magnitude. A limit value is reached for further increasing the friction parameter, representing the regime in which glued-like rovings that remain perpendicular at crossing points. The corresponding rigorous analysis for the weak contact can be found in [22] and for the strong in [6].
3.1.2. Theoretical Observations for the Full Shear Frame Experiment
The unit-cell simulations presented in the previous section describe the in-plane response of the woven fabrics. During the full shear-frame experiment, however, the initially planar fabric configuration may lose stability and develop out-of-plane wrinkles. This transition cannot be described by a purely planar membrane model and requires a subsequent macroscopic shell-based analysis.
Error! Reference source not found. shows the measured shear force-displacement response of sample B together with images of the specimen at representative deformation states. The displacement corresponds to the travel of the shear frame indicated in Figure 6. Three principal deformation stages can be identified. During the initial pre-buckling stage, the warp and weft rovings re-orient and slide relative to each other, resulting in a comparatively low macroscopic shear stiffness. With increasing shear displacement, the geometric constraints imposed by the shear frame induce axial tension in the rovings. Consequently, the measured force increases more strongly. A theoretical treatment of this in-plane regime is provided in [22].
At a critical shear displacement, the planar configuration loses stability and out-of-plane wrinkling is observed. In an idealized model, this instability corresponds to a bifurcation point, at which multiple post-buckling configurations may become admissible. In the experiment, the selected wrinkle pattern is influenced by unavoidable geometrical imperfections, local fabric inhomogeneities, and the boundary conditions imposed by the shear frame. The onset of wrinkling coincides with a plateau-like region in the measured force-deformation response. This response should not be interpreted as material plasticity. Instead, additional deformation is accommodated predominantly by out-of-plane bending and wrinkle formation, requiring comparatively little additional in-plane energy.
At larger shear deformations, the measured force increases again. This final stiffening is attributed to the progressive interaction of neighboring wrinkles, including self-contact and through-thickness compaction of the folded fabric layers. Since this compaction regime is not represented in the present simulation framework, this interpretation remains qualitative and is supported by the observed specimen configurations.
Figure 12.
Measured shear force-displacement response of sample B with corresponding specimen configurations. The response is divided into the pre-buckling in-plane regime, wrinkle initiation and post-buckling plateau, and the final stiffening regime associated with wrinkle interaction and compaction.
Figure 12.
Measured shear force-displacement response of sample B with corresponding specimen configurations. The response is divided into the pre-buckling in-plane regime, wrinkle initiation and post-buckling plateau, and the final stiffening regime associated with wrinkle interaction and compaction.
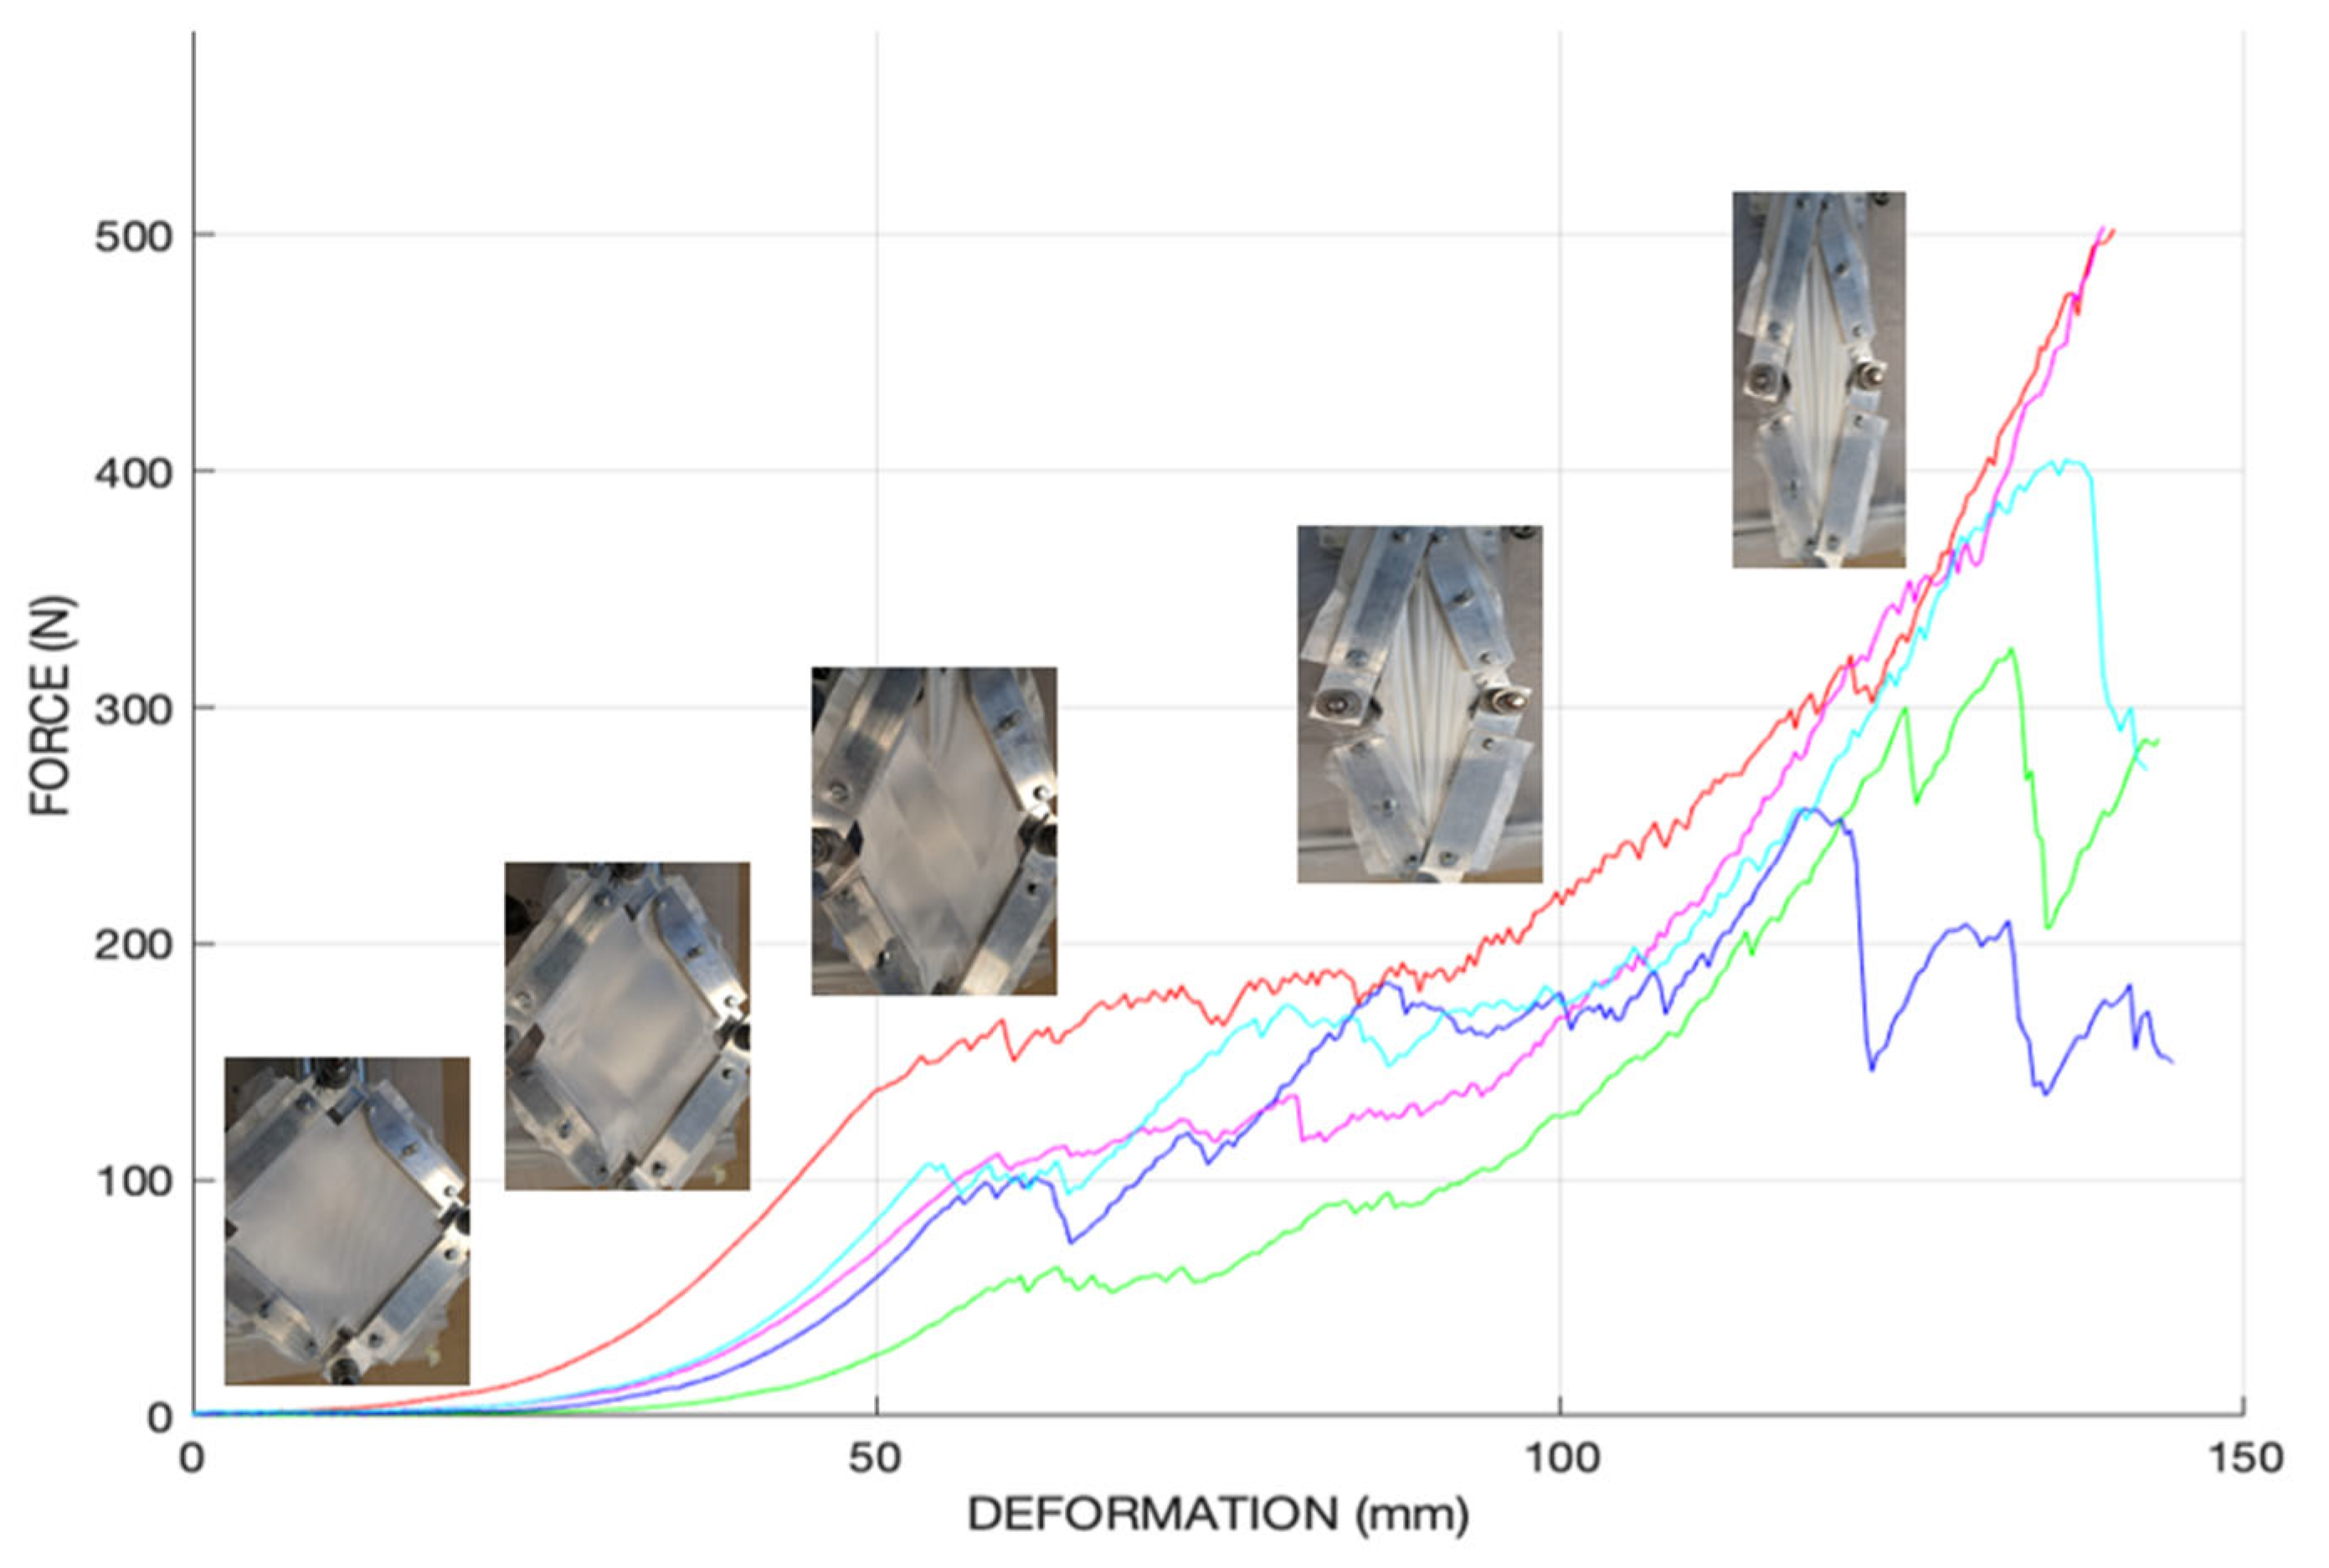
Figure 13 illustrates the employed multiscale simulation strategy. The yarn-scale model is used to describe the pre-buckling in-plane deformation until the onset of instability. The resulting deformation state is subsequently transferred to a macroscopic shell model to represent the out-of-plane post-buckling response. The shell model captures the initiation and development of wrinkles, whereas the final self-contact and compaction regime is outside the scope of the current model.
3.2. Simulation and Experimental Results for Draping
3.2.1. Draping Simulation on the Yarn Scale and Influence of Frictional Sliding
Here we first consider the case with sliding on the contact surfaces, [22] and study the influence of the contact parameters. The frictional contact problem is in general a 3-dimensional and non-linear because of the presence of the non-penetration condition and the non-linear dissipative frictional energy term. For computational purposes, the non-penetration condition can be penalized, by adding a quadratic energy term, penalizing the overlapping and then linearized, see, e.g., [23] and the frictional energy term can be regularized, i.e., replaced by the stick-sliding condition, where the stick condition means a penalization of some tangential jumps in displacements. However, we deal with contact of long and thin yarns and can reduce the dimension of this regularized an linearized contact problems for beams, [24]. The rigorous asymptotic derivation can be found in [13], where the exact expressions are given for the computation of 1D contact coefficients from the given friction, elastic properties of the contacting materials, the thickness of the contacting beams and the contact surface between them, which can be estimated from the shape and the size of the beams. For a pair of the contacting elements, belonging to the long rovings or yarns in two different directions, dimension reduction yields more degrees of freedom (tension along beams, two bending deflections and one torsion) and more frictional components. Whereas in the 3D case the friction force acts in the tangential plane only, here frictional bending moments and forces acting across the beam also arise, preventing some certain rotations of one beam w.r.t. another at the contact. The computational algorithm was given in [25].
Figure 14 demonstrates, that the large sliding between yarns allows to drape a hemisphere without folds. For flexural fibers it is possible only if the rovings have a flat and very smooth cross section that prevents torsion and friction. In this numerical experiment we removed the friction of yarns, only non-penetration contact conditions are preserved and the yarns can slide and rotate freely relative to each other. This is the case of the loose contact, modeled in [22], which also corresponds to the experiment shown on the second figure of Figure 14. In this case, the effective in-plane textile behaviour is additively decomposed onto the elastic tension and in-plane bending of two strips, spanned on the yarns in warp and weft directions separately (see also [3]) and the in-plane curl (difference between the deformations of these two warp-weft strips, reasoned by microscopic sliding at the contact areas, that is irreversible and results into the macroscopic in-plane plasticity). The macroscopic models, considered in the next section are applicable only for small sliding regime and do not cover this case of the macroscopic in-plane elasto-plasticity.
3.2.2. Simulation and Experimental Results on the Fabric Scale
For the fabric-scale draping simulations, a dynamic finite-element formulation based on linear Lagrange and non-conforming Crouzeix–Raviart elements on triangular meshes was implemented following the approach proposed in [21]. Time-integration is performed with the first-order backward differentiation formula (BDF1). For contact modeling with the volumetric molds in the draping test, the standard penalty method with a quadratic penalty energy is employed [23]. Due to their regular shape, the molds are described as analytical objects in simulation. The underlying computational mesh for the textile is centrally symmetric with respect to the sample’s center. For geometrically symmetric cases, the computational domain could in principle be reduced by applying symmetry boundary conditions and simulating only one half or one quarter of the textile. However, the full textile geometry is simulated in all cases to maintain consistency with the subsequent sensitivity studies involving rotated material directions. An illustration of the draping simulation setup and time-dependent fold formation is provided in Figure 15.
For comparison with the 3D scans attained from the draping experiments, the maximal deformation state in simulation is used. For the investigated sample B, the reflecting glass-fiber surfaces resulted in measurement artefacts in the scanned geometry. Nevertheless, all measured samples exhibited a qualitatively similar global fold topology, with comparable numbers and characteristic sizes of folds despite their different areal weights. Figure 16 resents the reconstructed height maps of the experimental draping configurations. The observed similarity in the overall fold pattern indicates that the mold geometry and boundary conditions strongly influence the global deformation mode, whereas the fabric properties of the considered samples primarily affect the local fold orientation and amplitude.
Figure 17 compares the experimental height maps with the corresponding simulated configurations for samples A, B, and F. The simulations reproduce the main qualitative characteristics of the experimentally observed folding patterns, including the number and approximate spatial distribution of folds. A direct pointwise quantitative comparison was not performed because the experimental configurations show substantial asymmetries and because scan artefacts are present for sample B. These deviations may result from small specimen-placement errors, local fabric inhomogeneity, boundary-condition variations, or imperfections introduced during the forming process.
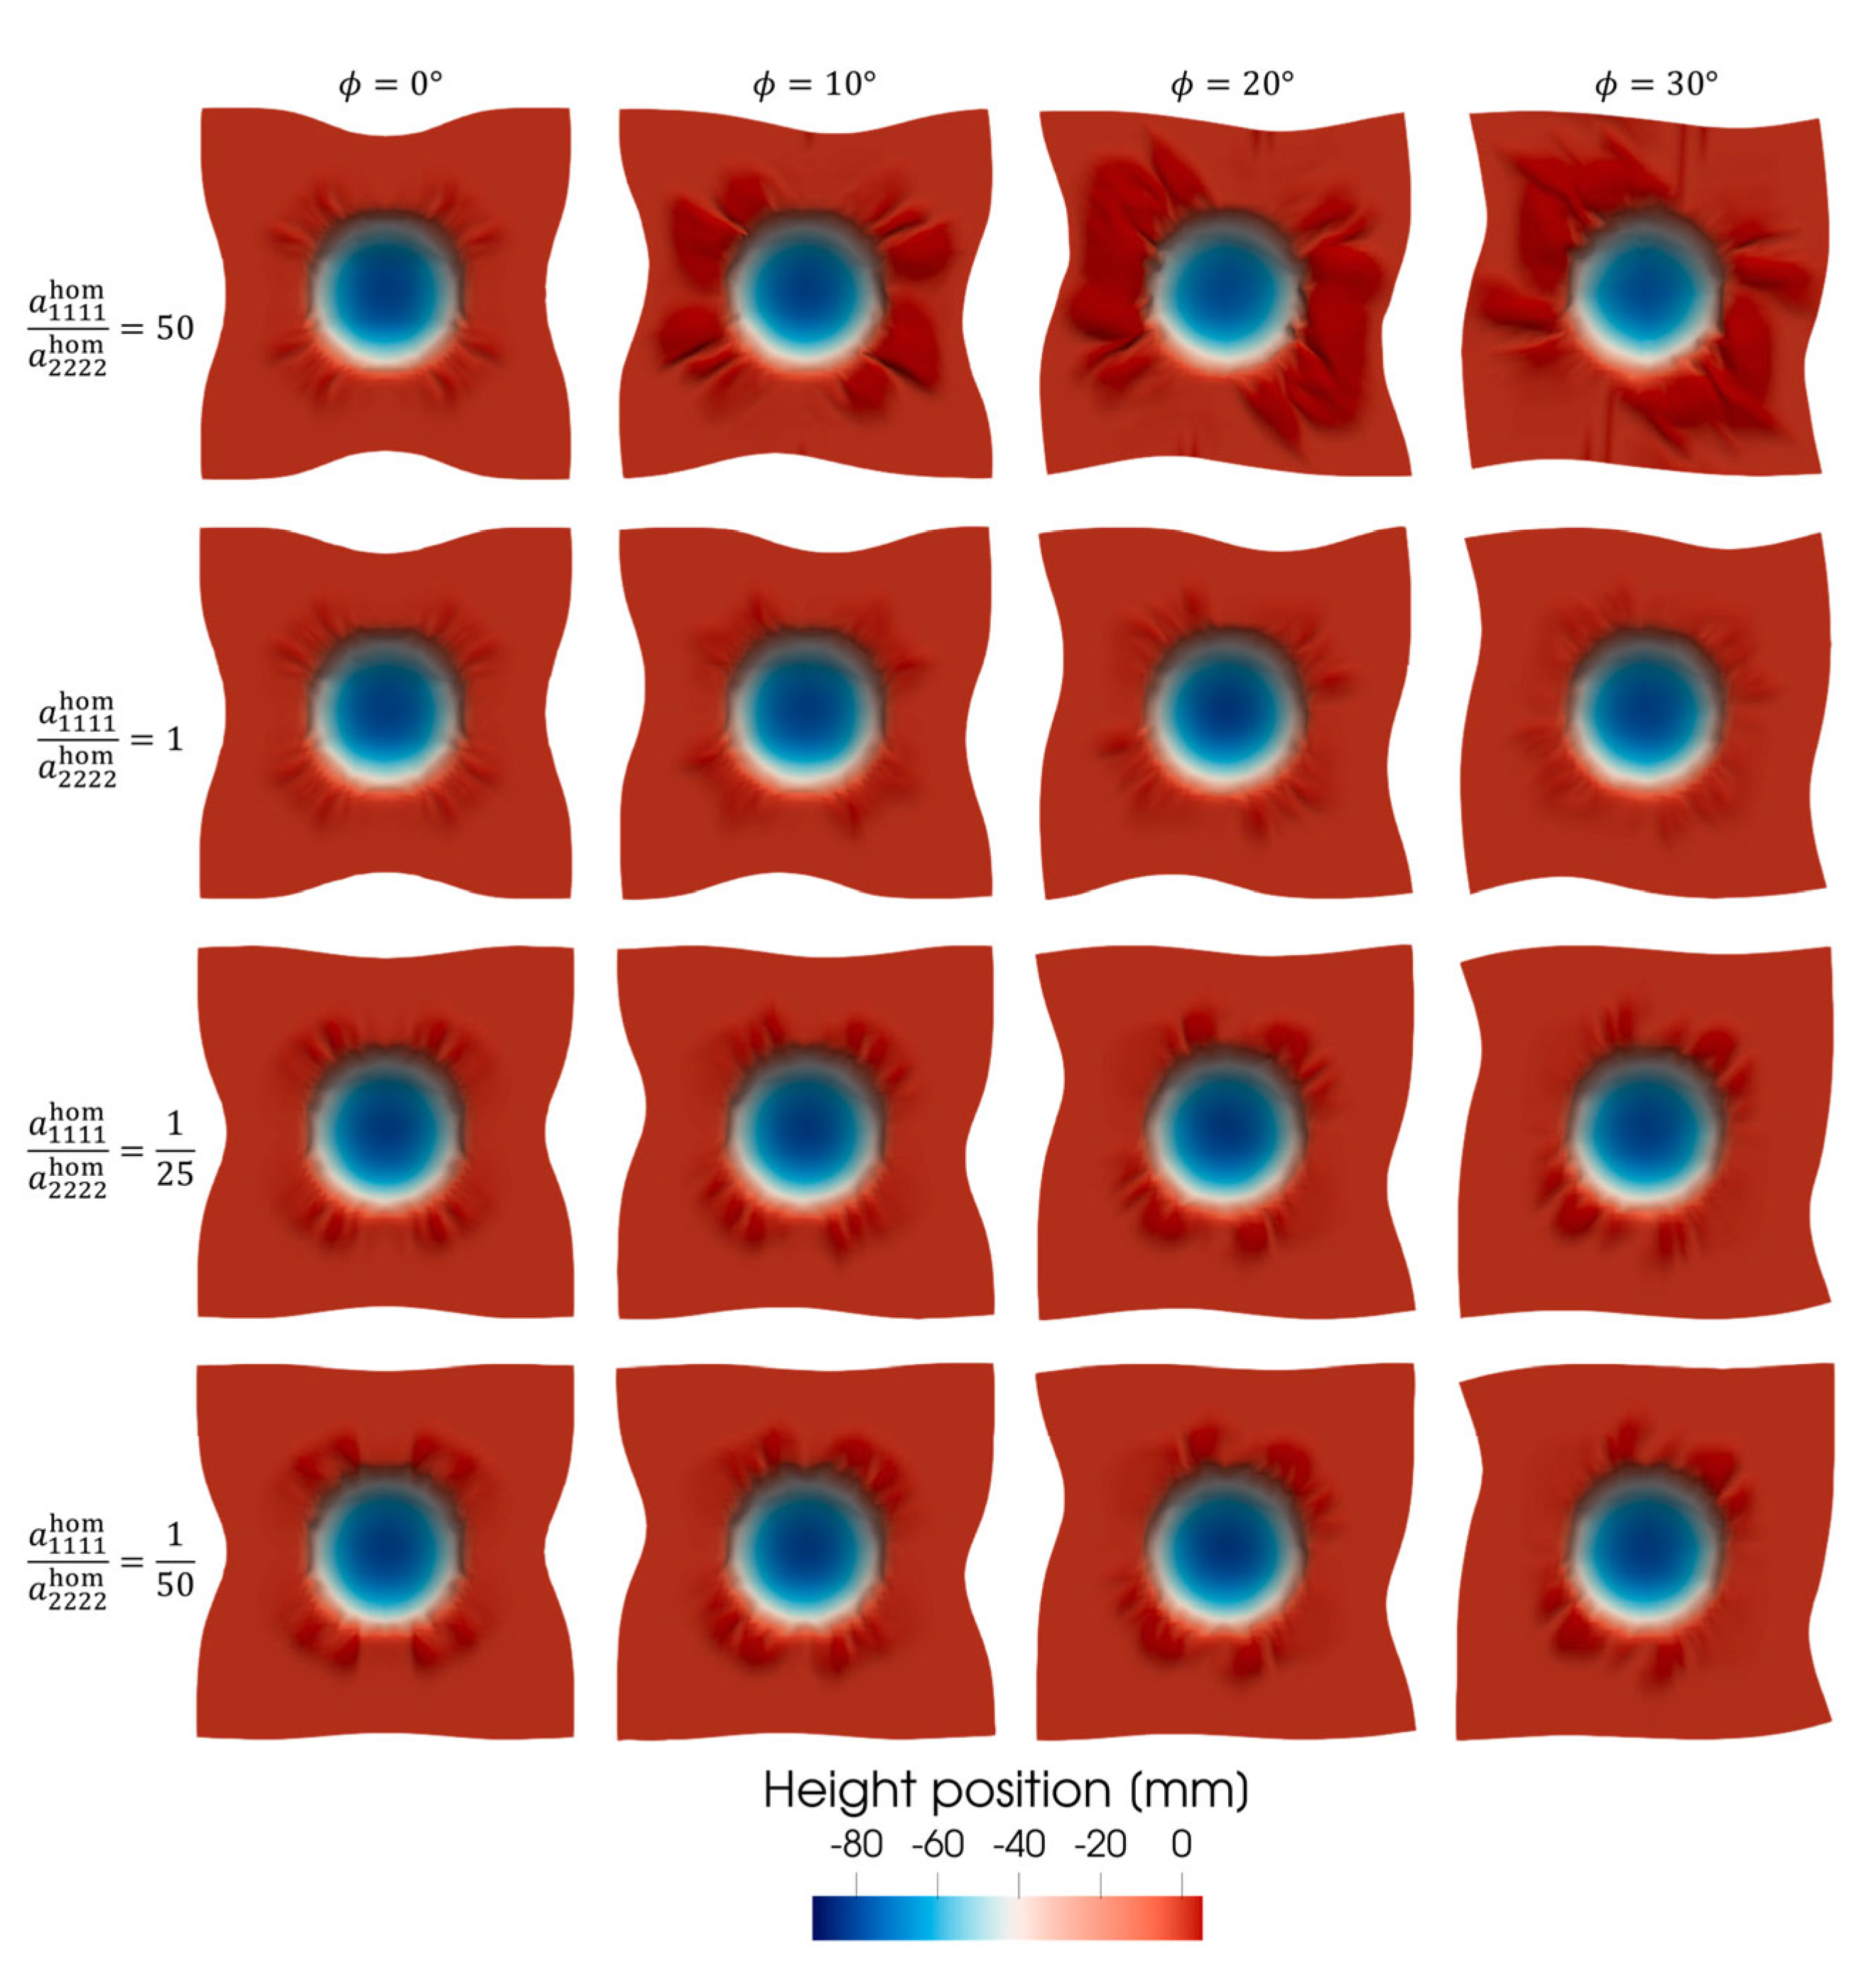
To investigate the sensitivity of the fold pattern to material properties and specimen orientation, two fabric-scale parameter studies are performed. The first study examines the combined influence of the effective in-plane shear stiffness and the in-plane rotation angle of the textile cut relative to the warp and weft directions. Values of shear stiffness were varied by decreasing the ratio of shearing to tensile stiffness , while the textile orientation was varied by 0°, 10°, 20° and 30°. The reference configuration corresponds to the stiffnesses ratio and .
The variation of is motivated by yarn-scale sensitivity study shown in Figure 11, in which the roving friction parameter was found to affect the shear stiffness significantly while leaving the remaining homogenized parameters essentially unaffected. It should be noted that directly scaling represents a sensitivity analysis of the effective fabric property; it does not imply that an identical scaling applies directly to the physical friction coefficient. As shown in Figure 18, both shear stiffness and textile orientation significantly affect the number, orientation, and amplitude of the resulting folds.
In the second sensitivity study, the influence of axial in-plane anisotropy and textile orientation is investigated. The degree of anisotropy is characterized by the ratio . Because the homogenized warp- and weft-direction stiffnesses of the investigated fabrics are of comparable magnitude, the anisotropy was introduced artificially by scaling while keeping fixed. The reference configuration corresponds to the unit ratio. All remaining model parameters were retained at their reference values. The resulting simulations are shown in
Figure 19.
The results demonstrate that the fold pattern is sensitive to the ratio of axial stiffnesses, particularly in combination with a rotated textile orientation. The study therefore indicates that even moderate deviations from balanced warp-weft stiffness may alter the preferred fold orientation and fold amplitude during draping.
3.3. Further Fabric-Scale Design Studies Using Effective Anisotropic Sheet Properties
The sample-specific draping simulations are complemented by idealized fabric-scale numerical studies to investigate the influence of effective material properties and structural reinforcement on fold formation. The textile is represented by a two-dimensional effective sheet model embedded in three-dimensional space. Its in-plane mechanical response is described by the homogenized extensional stiffness tensor , obtained from the periodic textile topology in Section 3.1, while the out-of-plane response is governed by the effective bending stiffness. The studies presented in this section are intended to decompose individual mechanical mechanisms and to identify qualitative design trends.
Figure 19.
Change of fold pattern for sample A under variation of in-plane anisotropy (rows) and the in-plane rotation of the textile cut-out (columns) at maximum deformation.
Figure 19.
Change of fold pattern for sample A under variation of in-plane anisotropy (rows) and the in-plane rotation of the textile cut-out (columns) at maximum deformation.
In the draping simulations below, a 2D textile sheet is draped over a rigid sphere. The results illustrate the sensitivity of the draping behavior w.r.t. the effective shear and bending parameters computed on the textile structure.
Figure 20 shows the effect of varying the shear coefficient , while keeping the rest of the entries constant. The coefficient is varied by decreasing the ratio of shear to tensile stiffness , with . As can be seen, a lower shear stiffness reduces the wrinkling.
A second study, shown in Figure 21, illustrates how wrinkling can also be reduced by increasing the bending stiffness—for example, by replacing the elastane yarns with glass fibers.
3.4. Structural aspects and their influence on the draping and shear (theoretical observation and illustrative simulation)
To investigate the potential of structural reinforcement for controlling fold formation, an idealized mosaic textile architecture is considered. The structure consists of nearly rigid square inclusions arranged in rows and columns and connected by narrow compliant textile ligaments. The effective behavior of such reinforced plates has been analyzed theoretically in [26].
Under the assumptions considered in [26], the limiting rigid-inclusion model favors a single dominant cylindrical folding mode, see
Figure 22 that shows draping simulations for increasing numbers of stiff inclusions. The direction of this fold depends on the spatial distribution of the reinforced regions overlapping with the contact surface.
These results suggest that patterned reinforcement can be used to guide the location and orientation of folds. Such architectures may therefore provide a possible basis for future structural, or topology optimization approaches aimed at controlling wrinkle formation during draping.
The shear response of the reinforced architecture is investigated on the yarn scale in Figure 23. The stiff inclusions are represented by regions with a substantially higher stiffness than the surrounding textile. An equivalent stable rod structure is employed to represent the reinforcement. The lower-left corner is clamped, with all displacements and rotations constrained. A prescribed shear displacement is applied at a reduced upper-right boundary region, while rotations remain unconstrained.
With increasing reinforcement density, the simulated structure increasingly develops out-of-plane deformation under shear loading. This response illustrates the coupling between in-plane shear, bending, and the rigidity constraints induced by the stiff inclusions.
4. Discussion
The presented multiscale simulation approach links the geometric and mechanical characteristics of individual rovings to the effective in-plane response and draping behavior of woven fabrics. The yarn scale homogenization results show that the axial stiffness components in the model are primarily governed by roving properties and thread densities, whereas the effective shear stiffness is strongly affected by the contact behavior at roving crossover points. The fabric-scale simulations further demonstrate that effective shear stiffness, axial anisotropy, bending stiffness, and the orientation of the textile cut relative to the warp and weft directions are relevant parameters governing fold formation during draping. The influence of weave types in the model is reflected mainly in the effective shear and coupling components of the homogenized stiffness tensor. For the nominally matched canvas and twill pairs A–B, C–D, and E–F, the computed axial stiffness components differ by less than , while the shearing stiffness of the twill weaves is lower by approximately , , and , respectively. Consequently, for comparable roving properties and thread densities, the weave type affects the in-plane shear response more strongly than the axial tensile response.
The pronounced sensitivity of the predicted shear stiffness and draping behavior to the effective roving-contact parameter indicates that inter-roving sliding is a key mechanism governing the in-plane shear response of woven fabrics. Within the present model, the contact parameter provides a means of selectively modifying the predicted effective shear stiffness while leaving the axial stiffness components nearly unchanged. In contrast, changes in weave distance, roving cross-sectional dimensions, and Young’s modulus influence several homogenized stiffness components simultaneously. These parameters therefore can generally not be considered as independent design variables for wrinkle control. This interpretation is consistent with the deformation mechanisms associated with different weave types. Fabrics with longer float lengths and larger weave repeats, such as twill wovens, may provide a greater available sliding distance at roving crossover points than canvas fabrics. Furthermore, modified roving sizing or surface treatments may alter the effective resistance to sliding by changing surface roughness, contact area, and local contact conditions. Reduced inter-roving sliding resistance may improve the ability of a textile to conform to double-curved geometries. However, such modifications may also affect fabric stability, handling behavior, permeability, and the reproducibility of the forming process. Consequently, reducing shear resistance should not be regarded as an unconditional design objective, but rather as one component of a balanced textile design.
The comparison between the simulated and experimentally measured draping configurations showed qualitative agreement in terms of the global fold topology, including the approximate number, size, and spatial distribution of folds. A pointwise quantitative prediction of individual fold locations is more challenging. The selected fold pattern can be highly sensitive to small imperfections. Relevant sources of variation include local fabric inhomogeneity, specimen positioning, cut orientation, boundary conditions and surface-measurement artefacts. The observed asymmetries in the experimental scans, as well as the sensitivity of the simulated fold patterns to material orientation, support this interpretation.
The sensitivity studies demonstrate that the orientation of the textile cut relative to the warp and weft directions is a practically relevant process parameter. Even moderate rotations of the material axes relative to the mold geometry changed the number, orientation, and amplitude of the predicted folds. This effect becomes particularly important for fabrics with unequal warp- and weft-direction stiffnesses. Consequently, the cut orientation may be used as a process-design parameter to influence preferred fold directions. Conversely, small unintended rotations during specimen placement may reduce the repeatability of the draping process and contribute to deviations between nominally identical experiments. The idealized fabric-scale studies additionally indicate that wrinkle morphology is governed by the interplay between in-plane shear and bending resistance, see also [1]. Within the considered parameter range, reducing the effective shear stiffness enabled larger in-plane deformation and reduced the observed fold amplitude. Increasing the bending stiffness suppressed fine-scale wrinkling and promoted fewer, smoother, and more pronounced large-scale folds. Thus, bending stiffness does not necessarily eliminate wrinkles but changes their characteristic length scale and morphology. The simulations involving patterned stiff inclusions further suggest that local stiffness distributions may be used to guide or localize folding. Such structures could provide a basis for future structural or topology-optimization approaches aimed at controlling fold formation during draping.
Limitations of the present approach is the inverse identification of effective roving-contact friction parameter from shear-frame experiments. Hence, this parameter does not directly correspond to an independently measured physical friction coefficient. The agreement between simulated and experimental shear-force curves therefore primarily demonstrates the quality of the calibration rather than an independent validation of the contact model. Furthermore, the draping experiments were performed only for samples A, B, and F, and the comparison with simulation remains qualitative because of scan artefacts and the imperfection-sensitive post-buckling response. For large shearing deformation, the present simulation framework does not fully represent the final compaction regime, in which neighboring folds come into contact and are compressed through the thickness.
Future work should focus on independently characterizing inter-roving contact properties, for example by dedicated sliding or pull-through experiments at roving crossover points. Repeated draping experiments combined with quantitative measures of fold amplitude, fold orientation, surface deviation from the target mold, and forming repeatability would enable a more rigorous validation of the fabric-scale model. Extending the simulation framework to include textile self-contact, fold compaction, and process-dependent boundary conditions would further improve its predictive capability for complex forming operations.
5. Conclusions
This paper is devoted to the analysis and simulation of draping behavior and its dependence on textile structure and yarn properties. The study builds on numerous previous rigorous analytical results and contributes to the understanding of textile deformation phenomena through the comparison of theoretical predictions with simulations using in-house numerical tools and experiments.
In addition to the exemplary investigation of glass-fiber woven textiles with different yarn thicknesses and weave patterns, which were examined in shear and draping tests and compared with experimental results, this paper provides general recommendations and relationships for modifying textile structures or yarn properties to decrease or increase folding. Furthermore, it discusses how textiles may be reinforced, for example by printed patterns, to obtain specific folding shapes. Mosaic-reinforced textiles are analyzed with respect to their draping behavior.
It was demonstrated that the membrane and bending stiffnesses of woven textiles depend continuously and monotonically on yarn thickness and the spacing between weft and warp yarns within the weave repeat. However, the weave type (plain, twill, etc.) influences local sliding and, consequently, the effective shear stiffness, which determines the intensity of wrinkling.
Author Contributions
Conceptualization, J.O. and T.G.; methodology, J.O. and S.B.; software, M.K. and P.S.; validation, S.B., M.K. and P.S.; formal analysis, J.O.; investigation, J.O. and S.B.; resources, J.O.; data curation, S.B. and M.K.; writing—original draft preparation, J.O. and S.B.; writing—review and editing, M.K. and P.S.; visualization, M.K. and P.S.; supervision, J.O. and T.G.; project administration, J.O. and T.G.; funding acquisition, J.O. and T.G. All authors have read and agreed to the published version of the manuscript.
Funding
This research was funded by the German Research Foundation DFG, grant numbers GR 1311/128-1 and OR 190/10-1 as well as OR 190/17-1.
Data Availability Statement
Data is provided on reasonable request.
Acknowledgments
During the preparation of this manuscript, the author(s) used Claude Sonnet 4.6 (Anthropic) for the purposes of grammar and spell checking. The authors have reviewed and edited the output and take full responsibility for the content of this publication.
Conflicts of Interest
The authors declare no conflicts of interest. The funders had no role in the design of the study; in the collection, analyses, or interpretation of data; in the writing of the manuscript; or in the decision to publish the results.
References
- Boisse, P.; Hamila, N.; Madeo, A. The Difficulties in Modeling the Mechanical Behavior of Textile Composite Reinforcements with Standard Continuum Mechanics of Cauchy. Some Possible Remedies. Int. J. Solids Struct. 2018, 154, 55–65. [Google Scholar] [CrossRef]
- Iwata, A.; Inoue, T.; Naouar, N.; Boisse, P.; Lomov, S. Coupled Meso-Macro Simulation of Woven Fabric Local Deformation during Draping. Compos. Part Appl. Sci. Manuf. 2019, 118, 267–280. [Google Scholar] [CrossRef]
- Barbagallo, G.; Madeo, A.; Azehaf, I. Bias Extension Test on an Unbalanced Woven Composite Reinforcement: Experiments and Modeling via a Second Gradient Continuum Approach. J. Compos. Mater. 2016. [Google Scholar] [CrossRef]
- Durville, D. Modeling Frictional Contact Interactions in Fibre Assemblies. 3rd International Conference on Computational Contact Mechanics (ICCCM 2013), 2013. [Google Scholar]
- Boisse, P.; Borr, M.; Buet, K.; Cherouat, A. Finite Element Simulations of Textile Composite Forming Including the Biaxial Fabric Behavior. Compos. Part B Eng. 1997, 28, 453–464. [Google Scholar] [CrossRef]
- Griso, G.; Orlik, J.; Wackerle, S. Asymptotic Behavior for Textiles. SIAM J. Math. Anal. 2020, 52, 1639–1689. [Google Scholar] [CrossRef]
- Griso, G.; Orlik, J.; Wackerle, S. Asymptotic Behavior for Textiles in Von-Kármán Regime. J. Mathématiques Pures Appliquées 2020, 144, 164–193. [Google Scholar] [CrossRef]
- Falconi, R.; Griso, G.; Orlik, J. Asymptotic Behavior for Nonlinear Textiles with Glued Yarns. Anal. Appl. 2025, 23, 359–399. [Google Scholar] [CrossRef]
- Shiryaev, V.; Orlik, J. A One-Dimensional Computational Model for Hyperelastic String Structures with Coulomb Friction. Math. Methods Appl. Sci. 2017, 40, 741–756. [Google Scholar] [CrossRef]
- Orlik, J.; Neusius, D.; Krier, M.; Steiner, K.; Backes, S.; Bhat, S.; Gries, T. Wrinkling Controlled Shear and Draping, Based on Hierarchical Textile Models, Weaving Kind and Yarn Properties. Textiles 2024, 4, 582–595. [Google Scholar] [CrossRef]
- Cerda, E.; Mahadevan, L. Geometry and Physics of Wrinkling. Phys. Rev. Lett. 2003, 90, 074302. [Google Scholar] [CrossRef] [PubMed]
- Orlik, J.; Neusius, D.; Steiner, K. Modelling and Simulation of Technical Textiles by TexMath. Available online: https://www.itwm.fraunhofer.de/de/abteilungen/sms/produkte-und-leistungen/texmath.html.
- Bare, D.Z.; Orlik, J.; Panasenko, G. Asymptotic Dimension Reduction of a Robin-Type Elasticity Boundary Value Problem in Thin Beams. Appl. Anal. 2014, 93, 1217–1238. [Google Scholar] [CrossRef]
- Orlik, J.; Andrä, H.; Argatov, I.; Staub, S. Does the Weaving and Knitting Pattern of a Fabric Determine Its Relaxation Time? Q. J. Mech. Appl. Math. 2017, 70, 337–361. [Google Scholar] [CrossRef]
- Shiryaev, V.; Neusius, D.; Orlik, J. Extension of One-Dimensional Models for Hyperelastic String Structures under Coulomb Friction with Adhesion. Lubricants 2018, 6, 33. [Google Scholar] [CrossRef]
- Cioranescu, D.; Damlamian, A.; Orlik, J. Two-Scale Analysis for Homogenization of Multi-Scale Contact Problems in Elasticity. Asymptot. Anal. 2013, 82. [Google Scholar]
- Fillep, S.; Orlik, J.; Bare, Z.; Steinmann, P. Homogenization in Periodically Heterogeneous Elastic Bodies with Multiple Micro-Contact. Math. Mech. Solids 2014, 19, 1011–1021. [Google Scholar] [CrossRef]
- Hauck, M.; Klar, A.; Orlik, J. Design Optimization in Periodic Structural Plates under the Constraint of Anisotropy. ZAMM—J. Appl. Math. Mech. 2017, 97, 1220–1235. [Google Scholar] [CrossRef]
- Wackerle, S.; Orlik, J.; Hauck, M.; Lykhachova, O.; Steiner, K. The Way to Design a Textile with Required Critical Folding Deformation. Procedia Manuf. 2020, 47, 174–181. [Google Scholar] [CrossRef]
- Krier, M.; Orlik, J.; Panasenko, G.; Steiner, K. Asymptotically Proved Numerical Coupling of a 2D Flexural Porous Plate with the 3D Stokes Fluid. arXiv 2024. [Google Scholar]
- Wardetzky, M.; Bergou, M.; Harmon, D.; Zorin, D.; Grinspun, E. Discrete Quadratic Curvature Energies. Comput. Aided Geom. Des. 2007, 24, 499–518. [Google Scholar] [CrossRef]
- Orlik, J.; Falconi, R.; Griso, G.; Wackerle, S. Asymptotic Behavior for Textiles with Loose Contact. Math. Methods Appl. Sci. 2023, 46, 17082–17127. [Google Scholar] [CrossRef]
- Wriggers, P. Computational Contact Mechanics; Springer, 2006. [Google Scholar]
- Zavarise, G.; Wriggers, P. Contact with Friction between Beams in 3-D Space. Int. J. Numer. Methods Eng. 2000, 49, 977–1006. [Google Scholar] [CrossRef]
- Orlik, J.; Panasenko, G.; Shiryaev, V. Optimization of Textile-like Materials via Homogenization and Beam Approximations. Multiscale Model. Simul. 2016, 14, 637–667. [Google Scholar] [CrossRef]
- Chakrabortty, A.; Griso, G.; Orlik, J. Dimension Reduction and Homogenization for Thin Plates with Disconnected Rigid Inclusions. Proc. R. Soc. Edinb. Sect. Math. 2026, 1–60. [Google Scholar] [CrossRef]
Figure 1.
Tensile test, rising the wrinkling. The experiment for the Karman wrinkling regime from [11] and simulation of hyperelastic yarns in a contact with TexMath.
Figure 1.
Tensile test, rising the wrinkling. The experiment for the Karman wrinkling regime from [11] and simulation of hyperelastic yarns in a contact with TexMath.
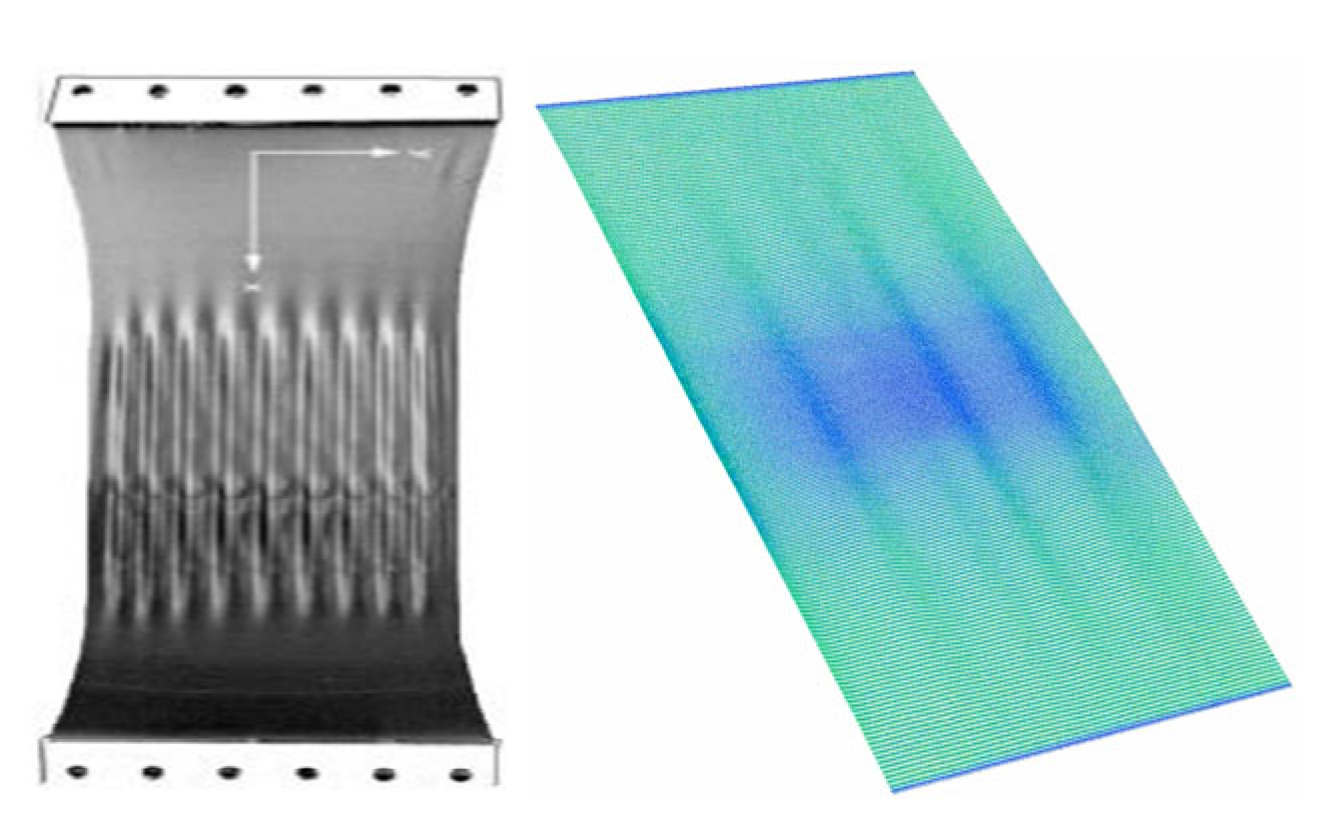
Figure 2.
Effective membrane, bending and coupling coefficients are the averaged stresses and moments obtained by the solving the corresponding perturbation problems on the unit cell with the textile pattern.
Figure 2.
Effective membrane, bending and coupling coefficients are the averaged stresses and moments obtained by the solving the corresponding perturbation problems on the unit cell with the textile pattern.
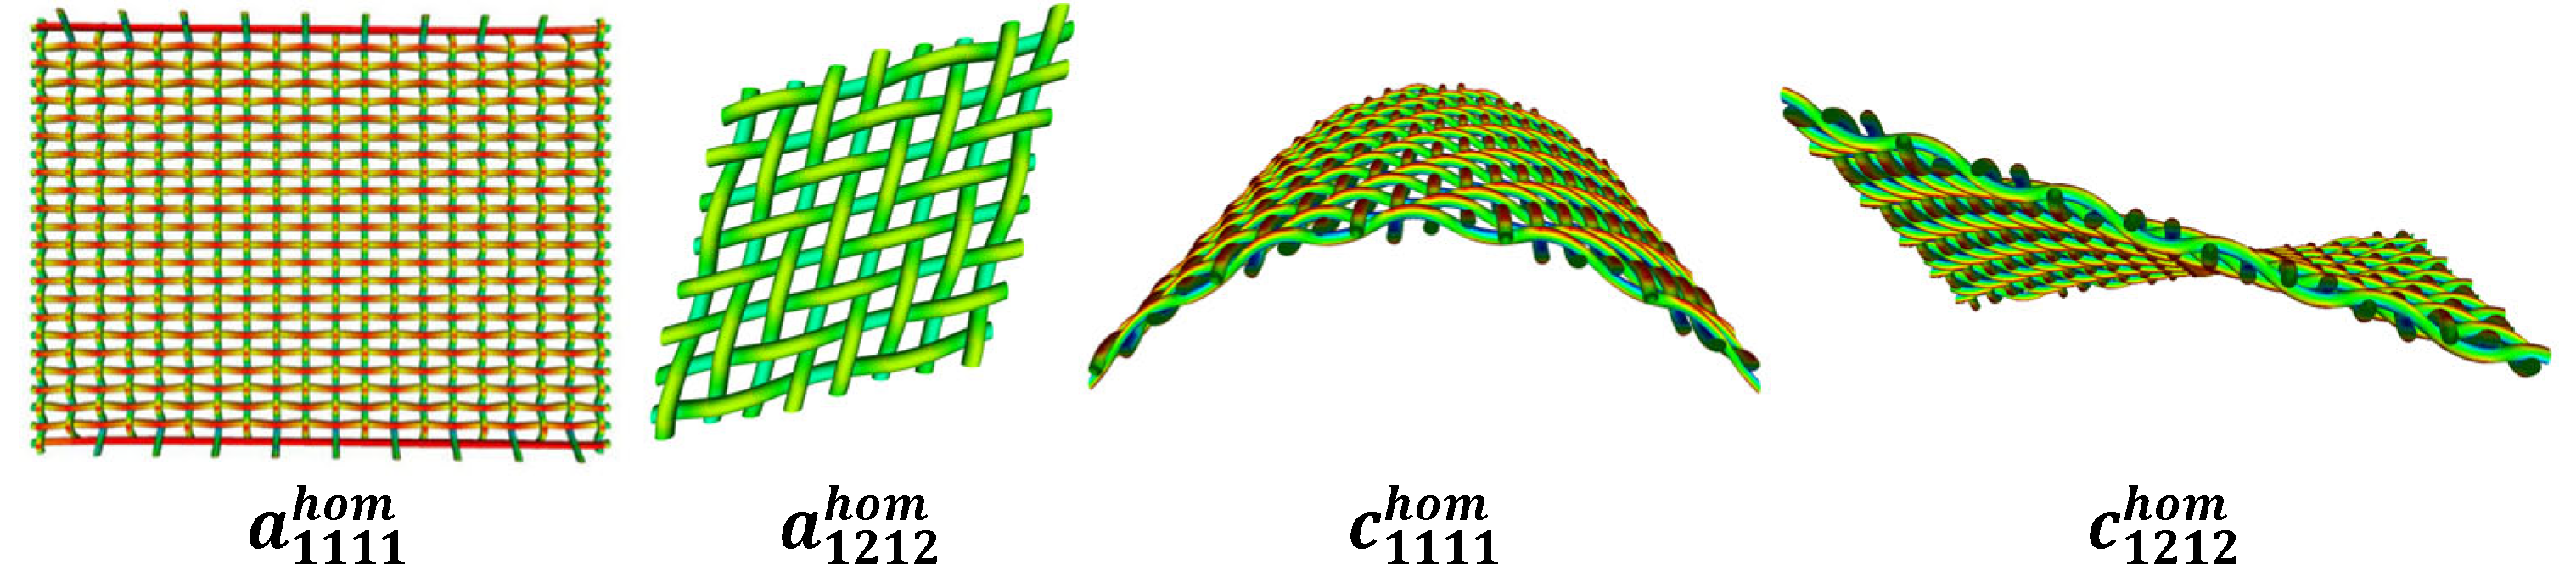
Figure 3.
Myand mask and a draping simulation of a knitted fabric made of hyperelastic yarns in a frictional contact with Capstan model.
Figure 3.
Myand mask and a draping simulation of a knitted fabric made of hyperelastic yarns in a frictional contact with Capstan model.
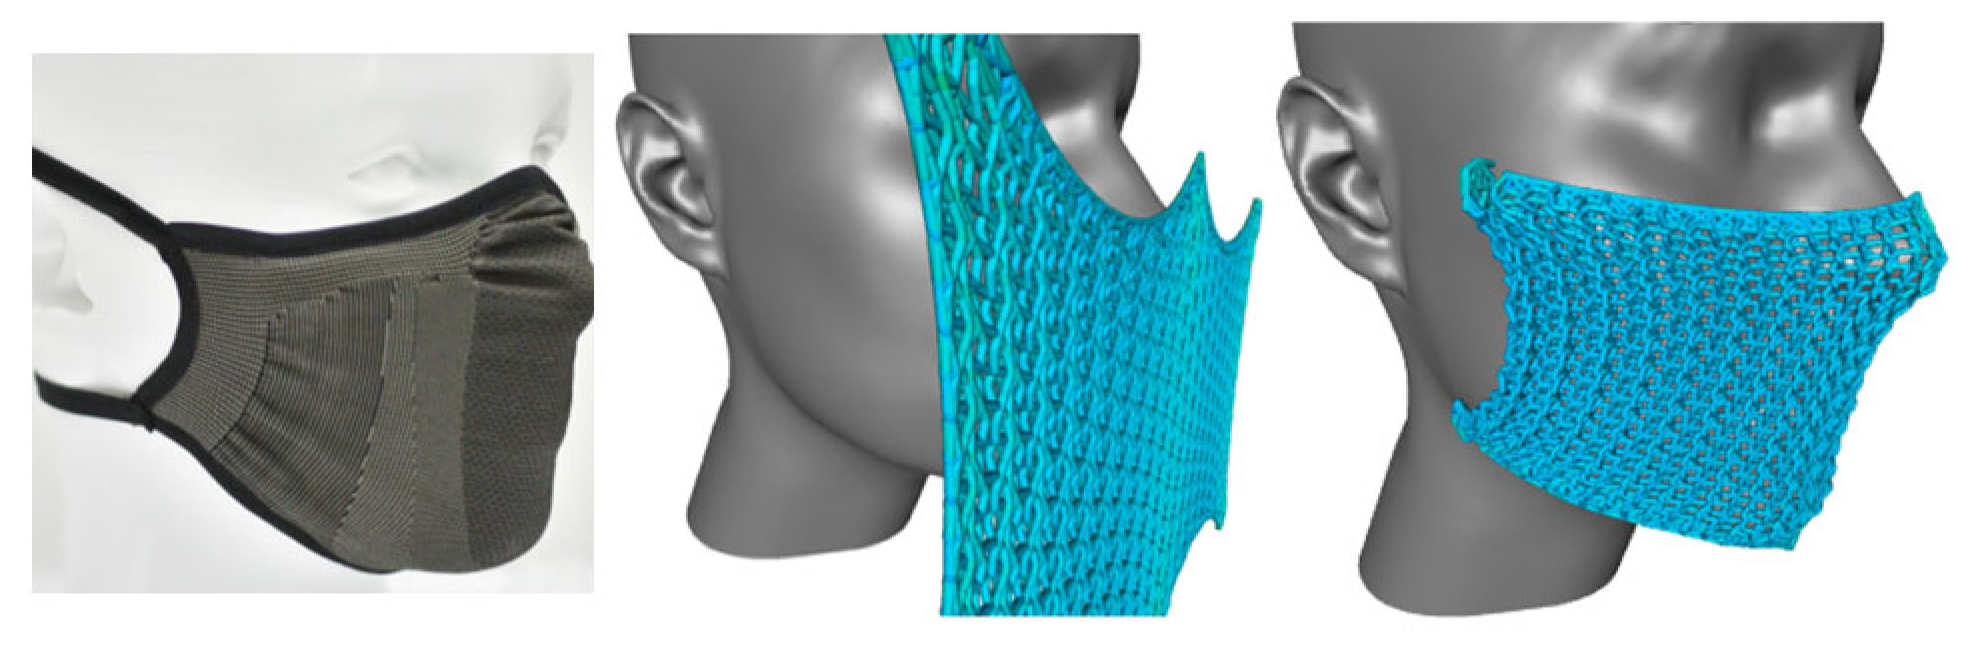
Figure 4.
SEM images of woven samples at the same resolution with view from the top (top) and from the side (bottom), respectively.
Figure 4.
SEM images of woven samples at the same resolution with view from the top (top) and from the side (bottom), respectively.
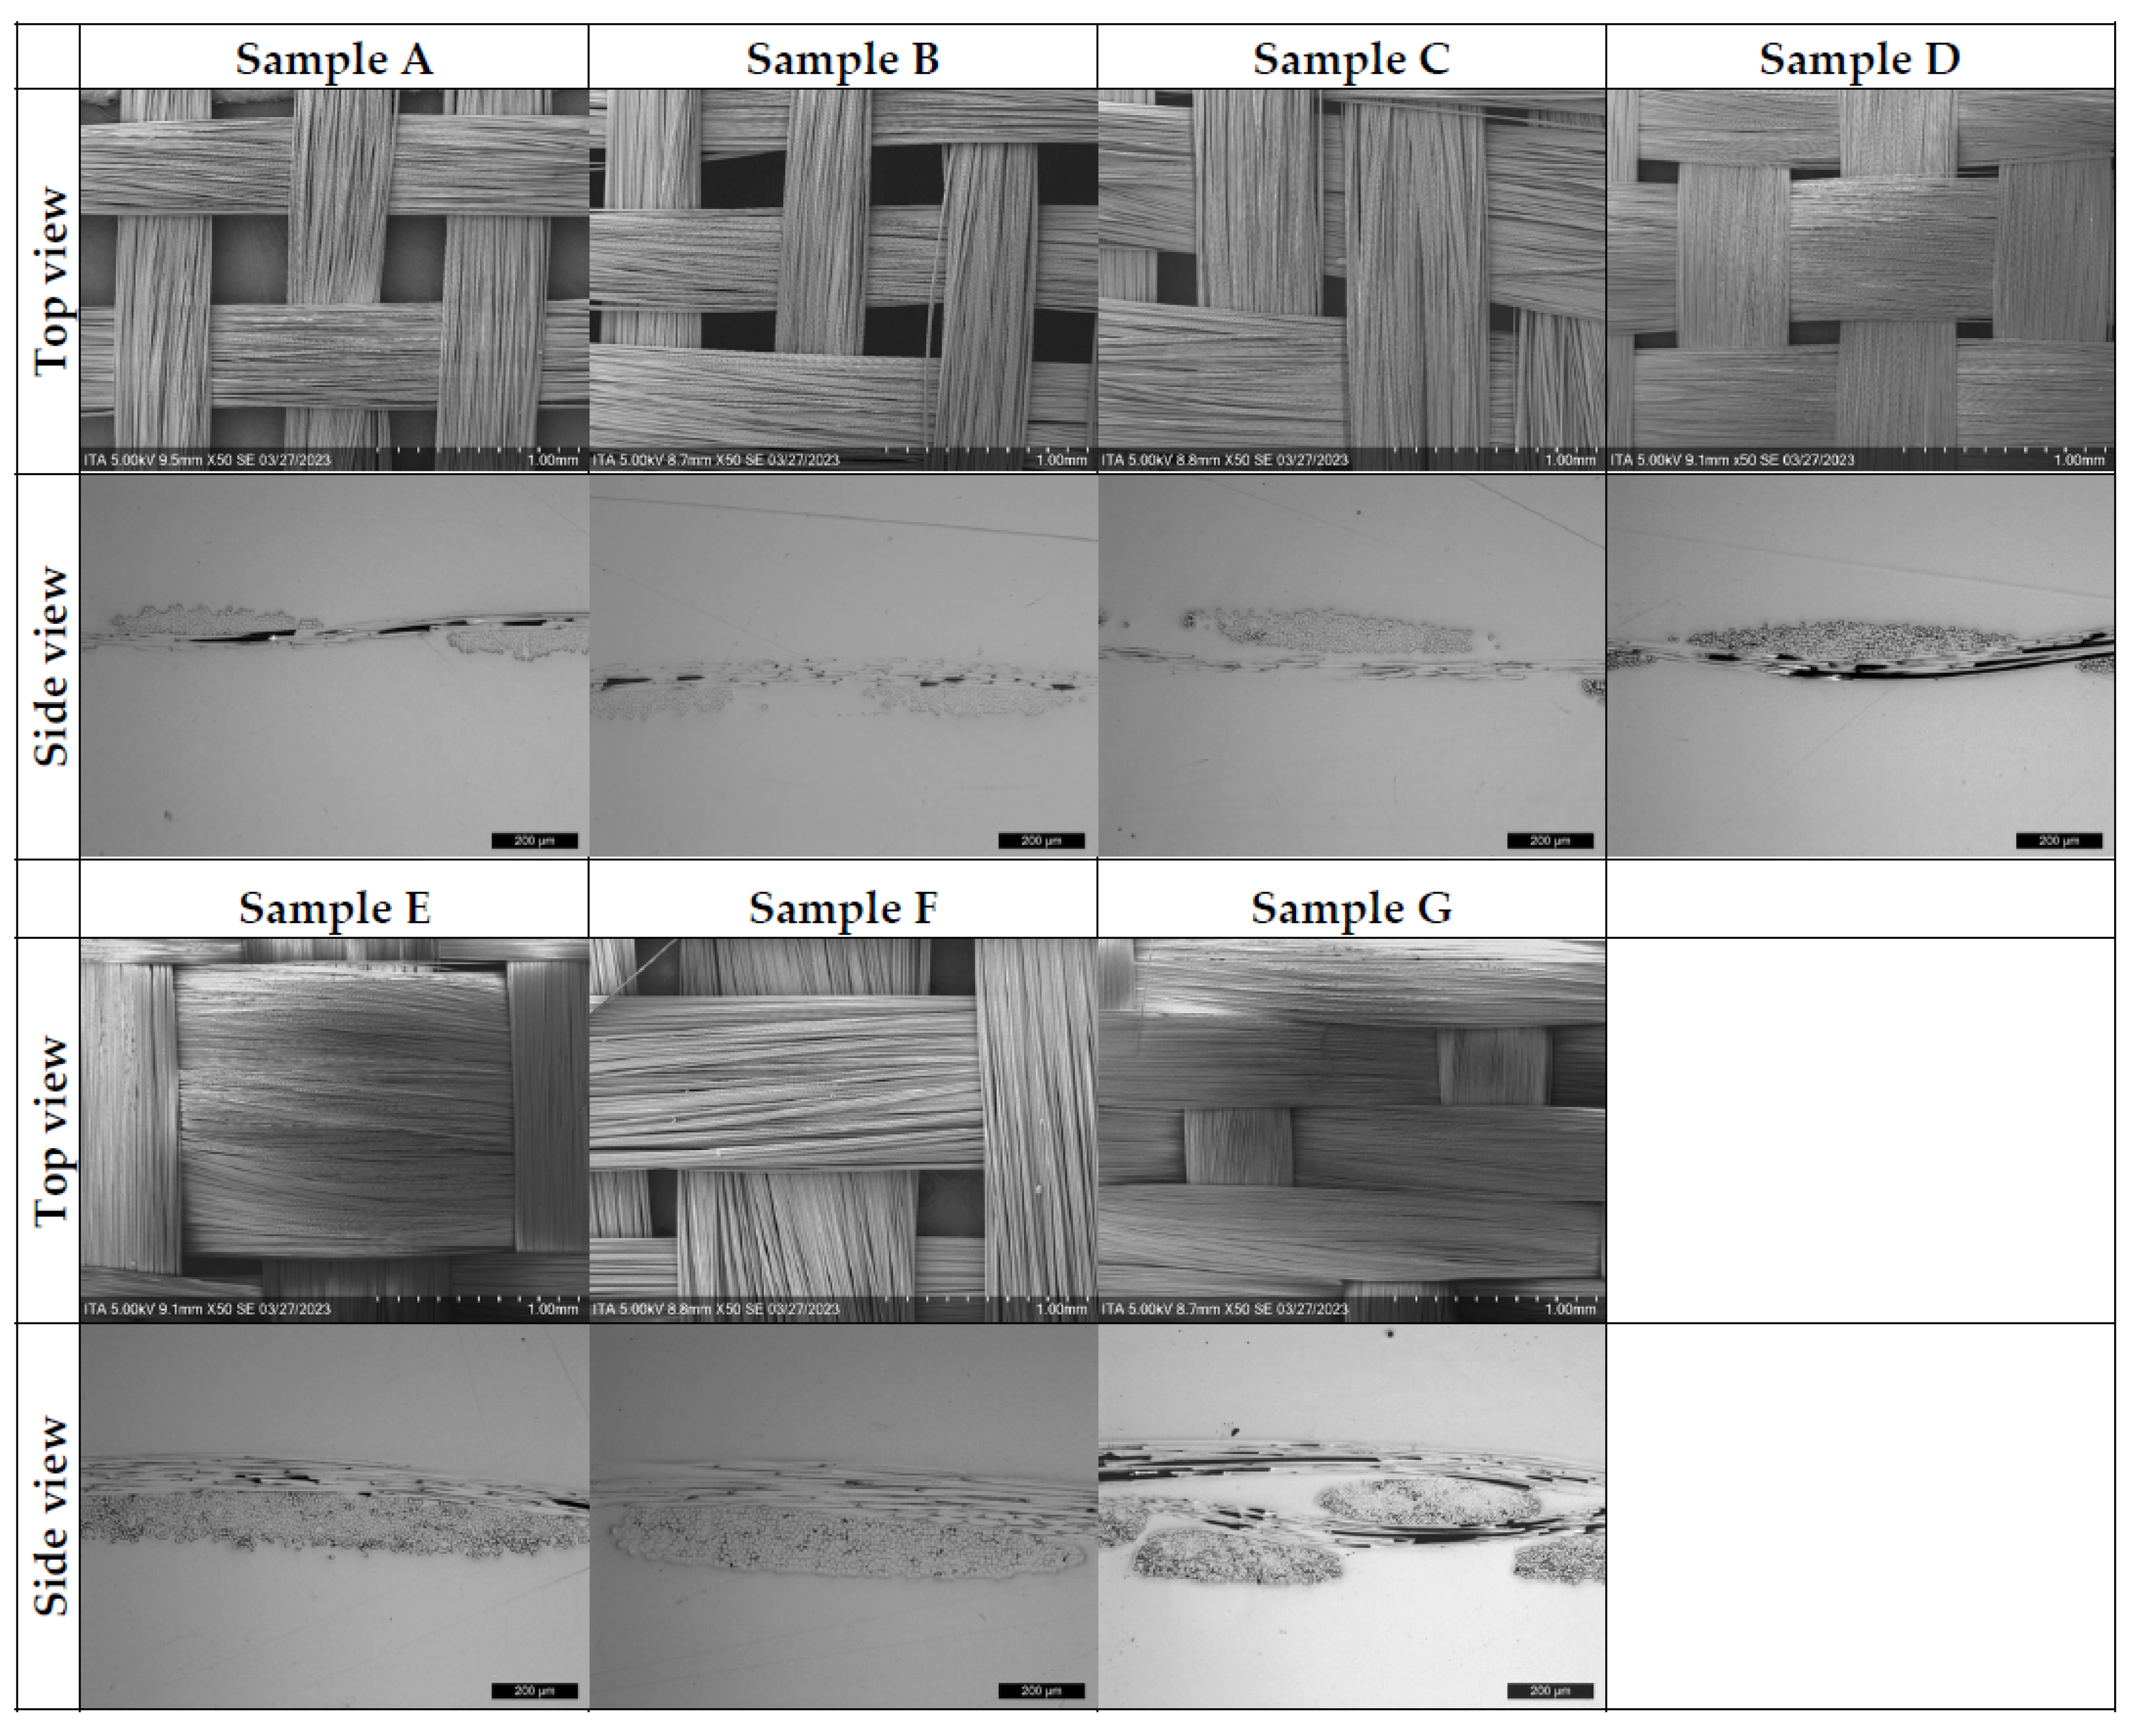
Figure 5.
Force-elongation diagram for glass fiber rovings of varying titer.
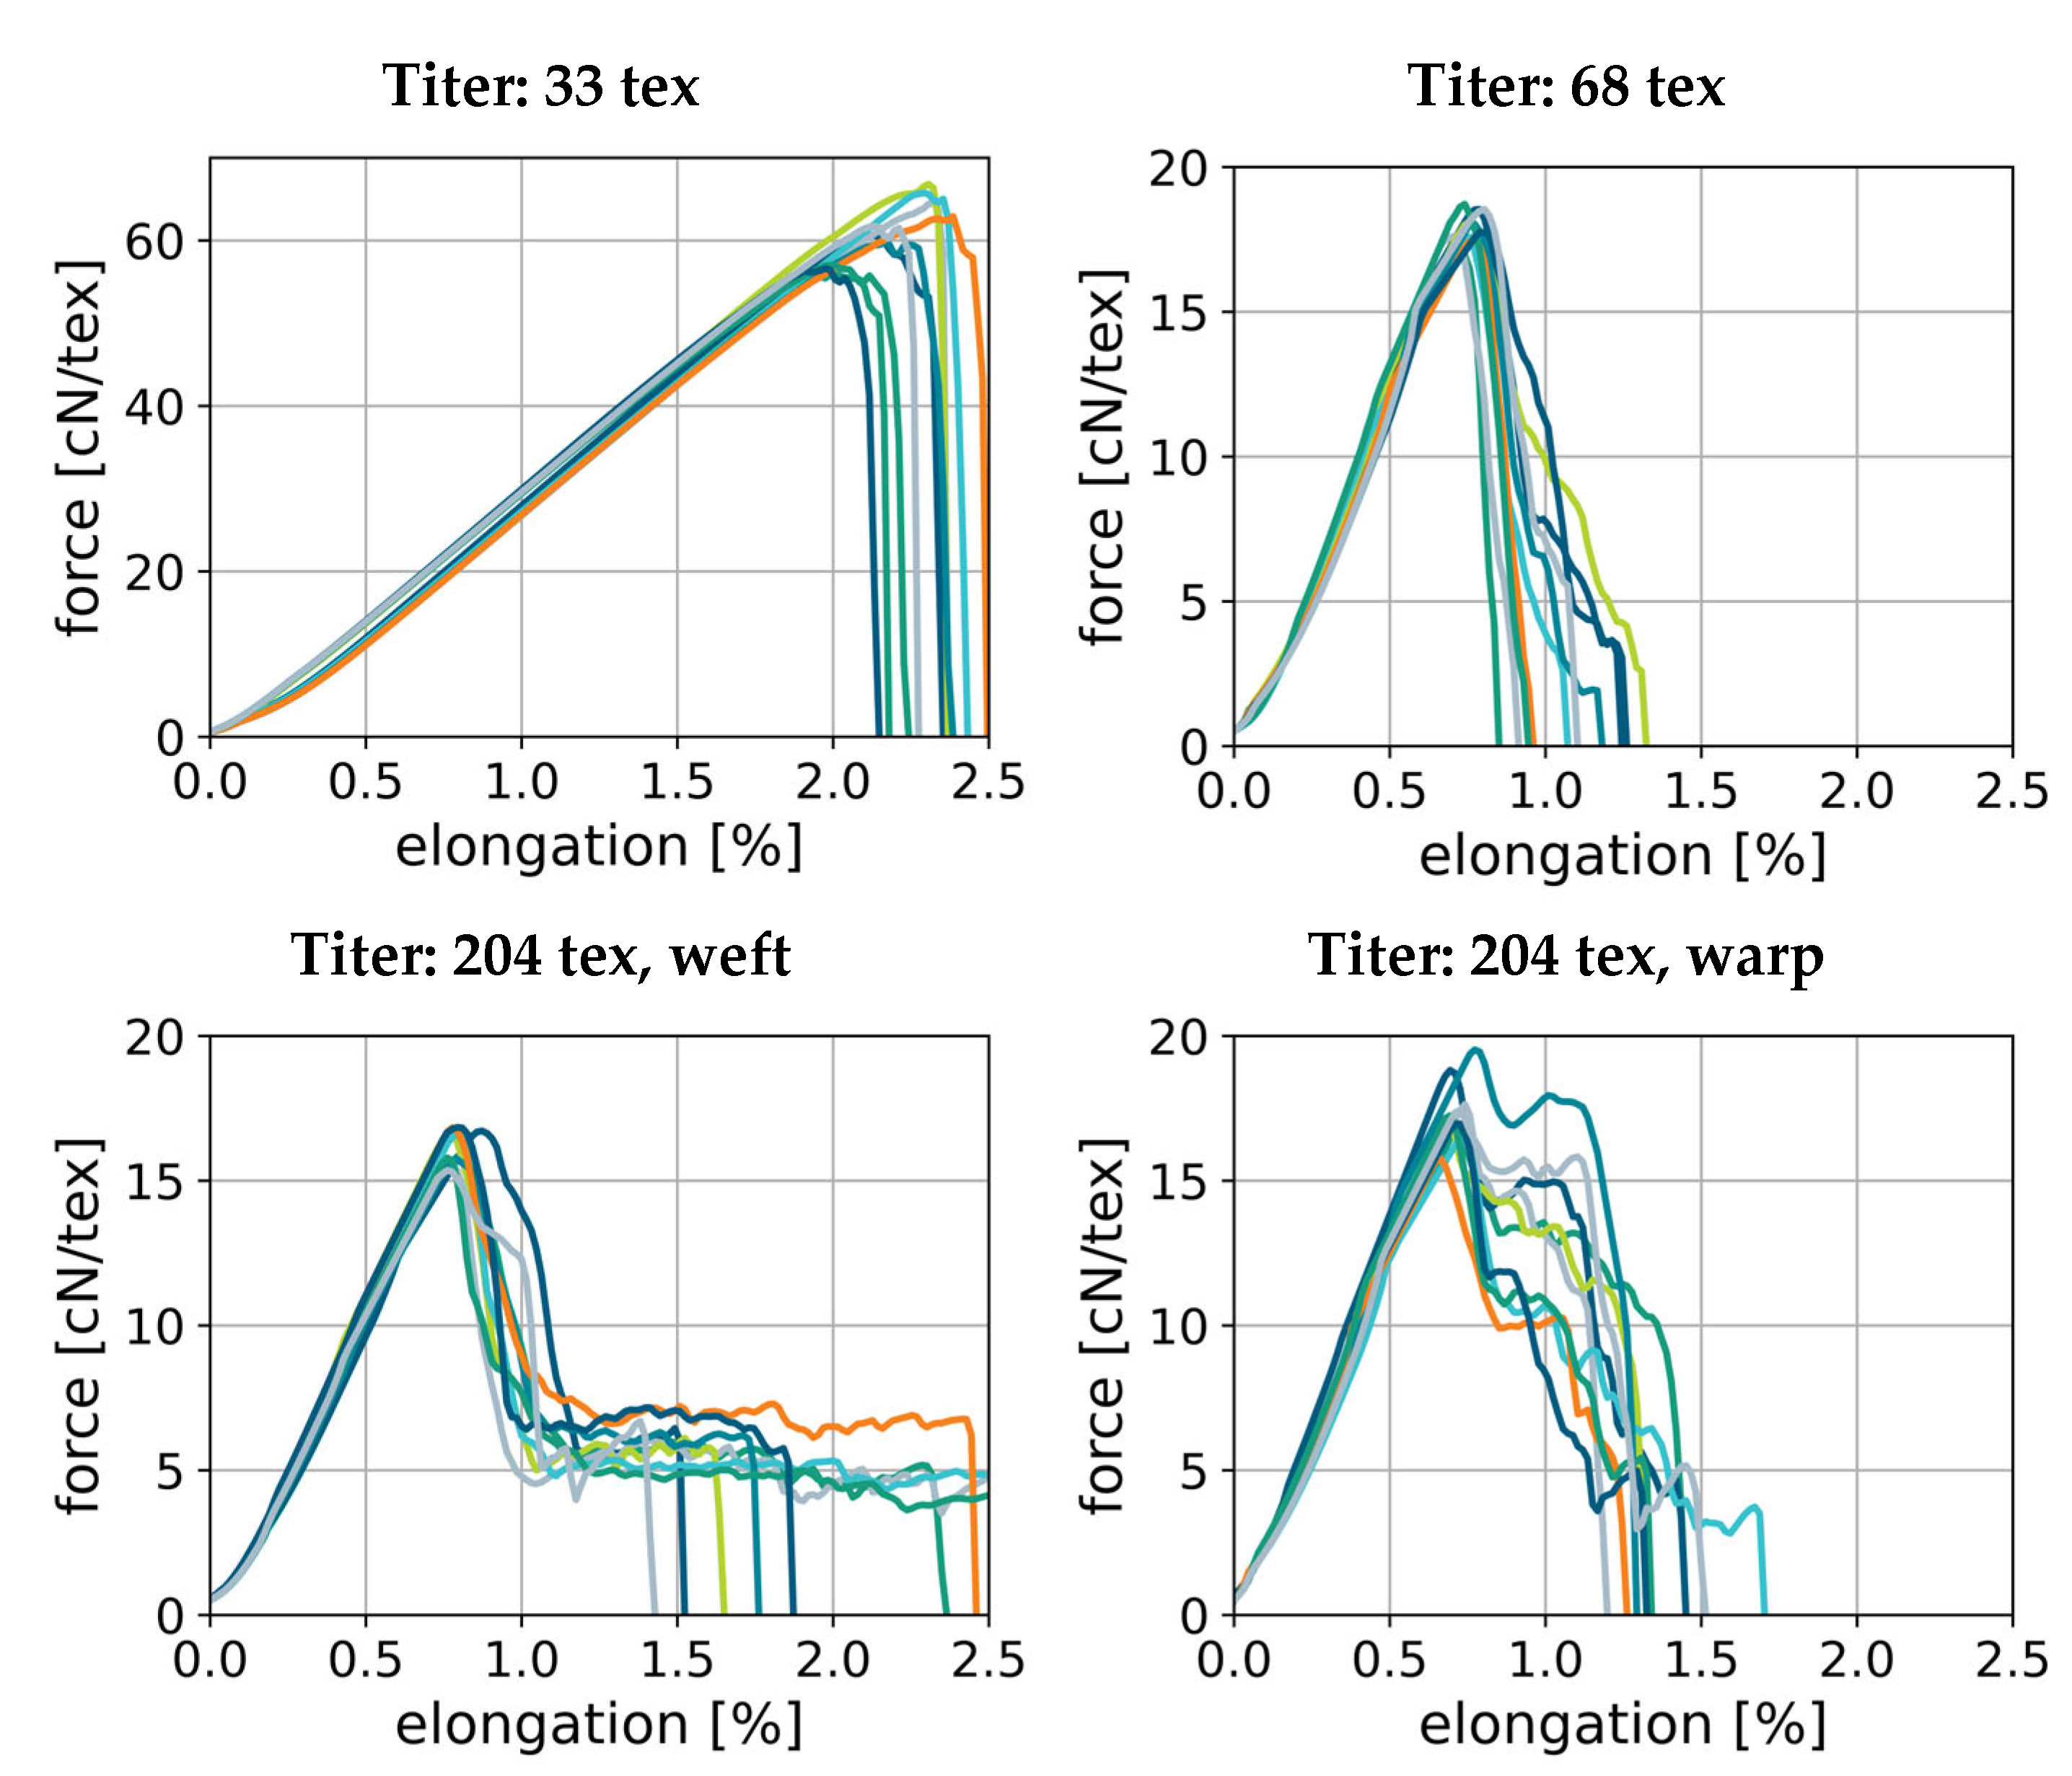
Figure 6.
Geometric setup for shear test and photograph of experimental setup with sample structure.
Figure 6.
Geometric setup for shear test and photograph of experimental setup with sample structure.
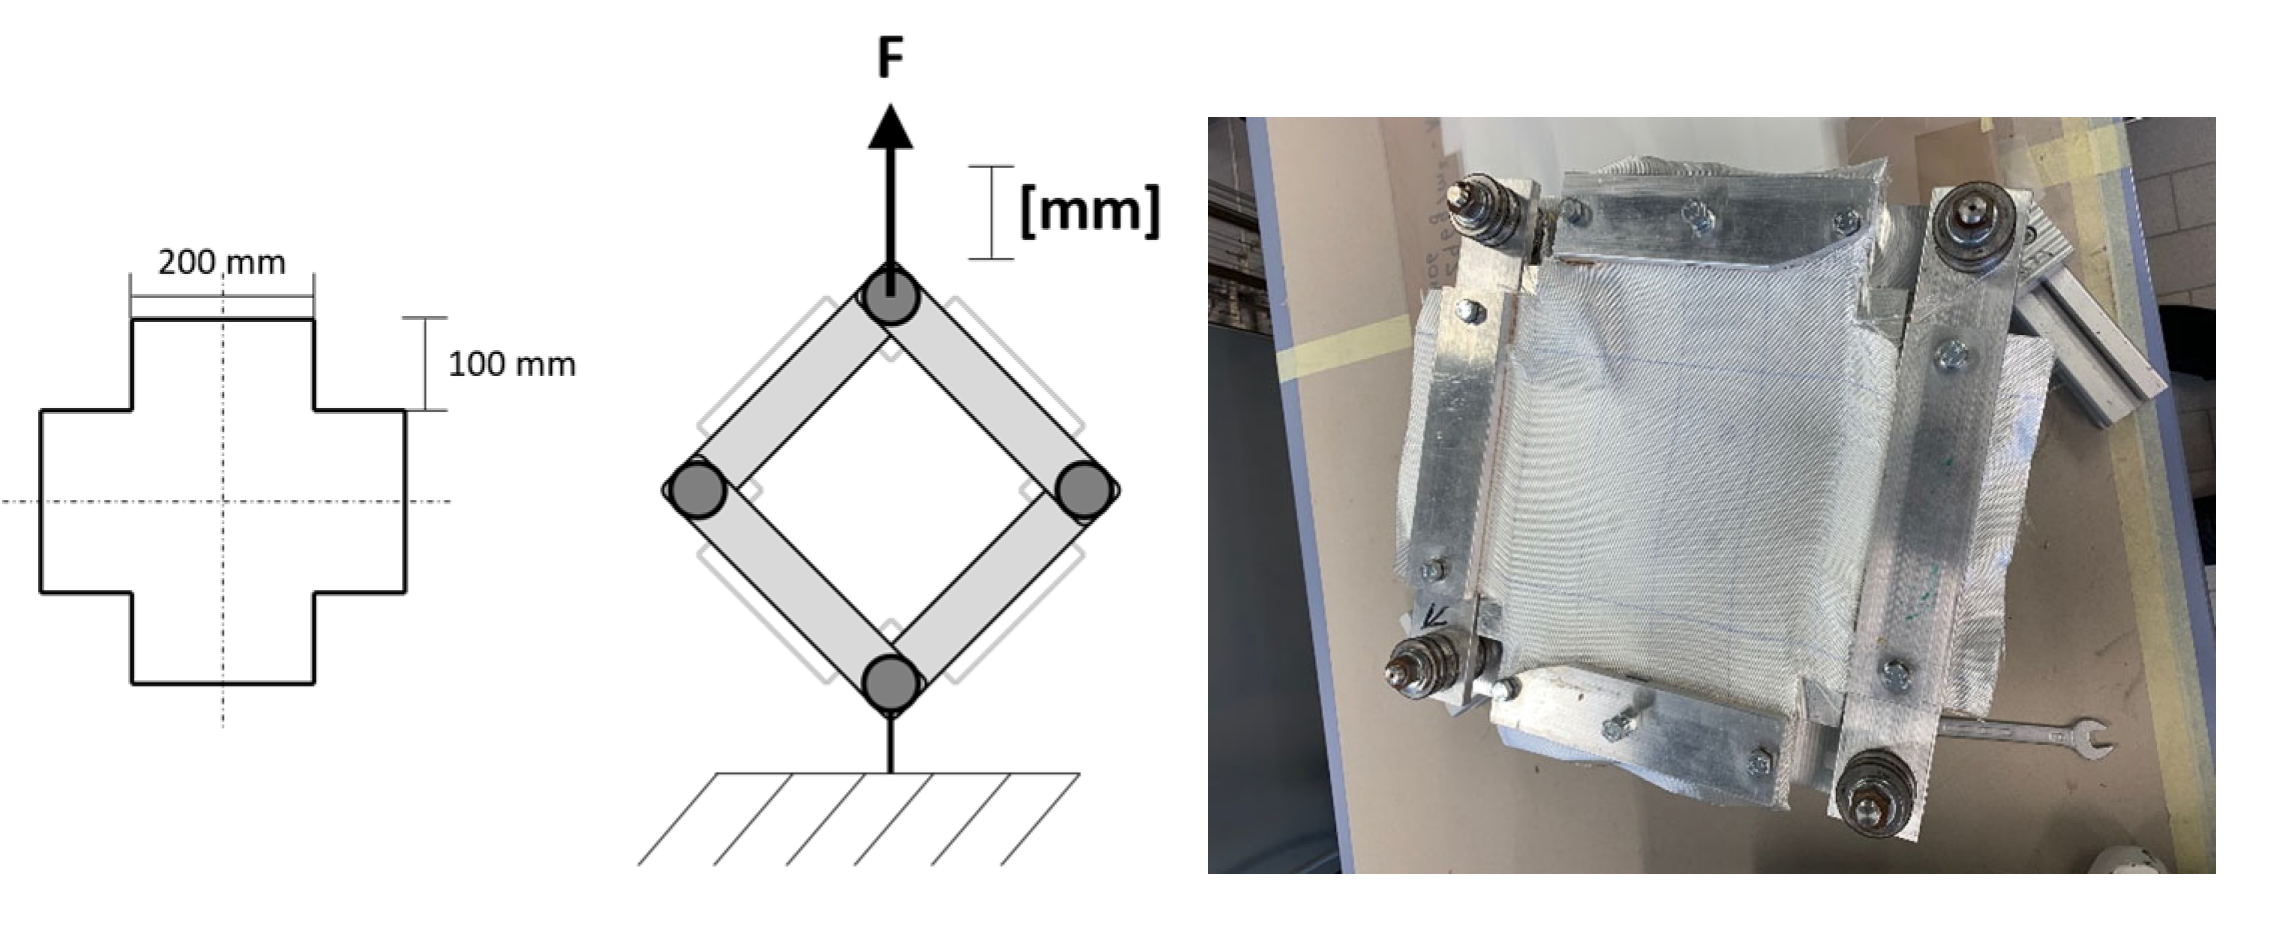
Figure 7.
Negative and positive mold geometries for draping experiment (left) and six-arm robot setup of experiment (right).
Figure 7.
Negative and positive mold geometries for draping experiment (left) and six-arm robot setup of experiment (right).
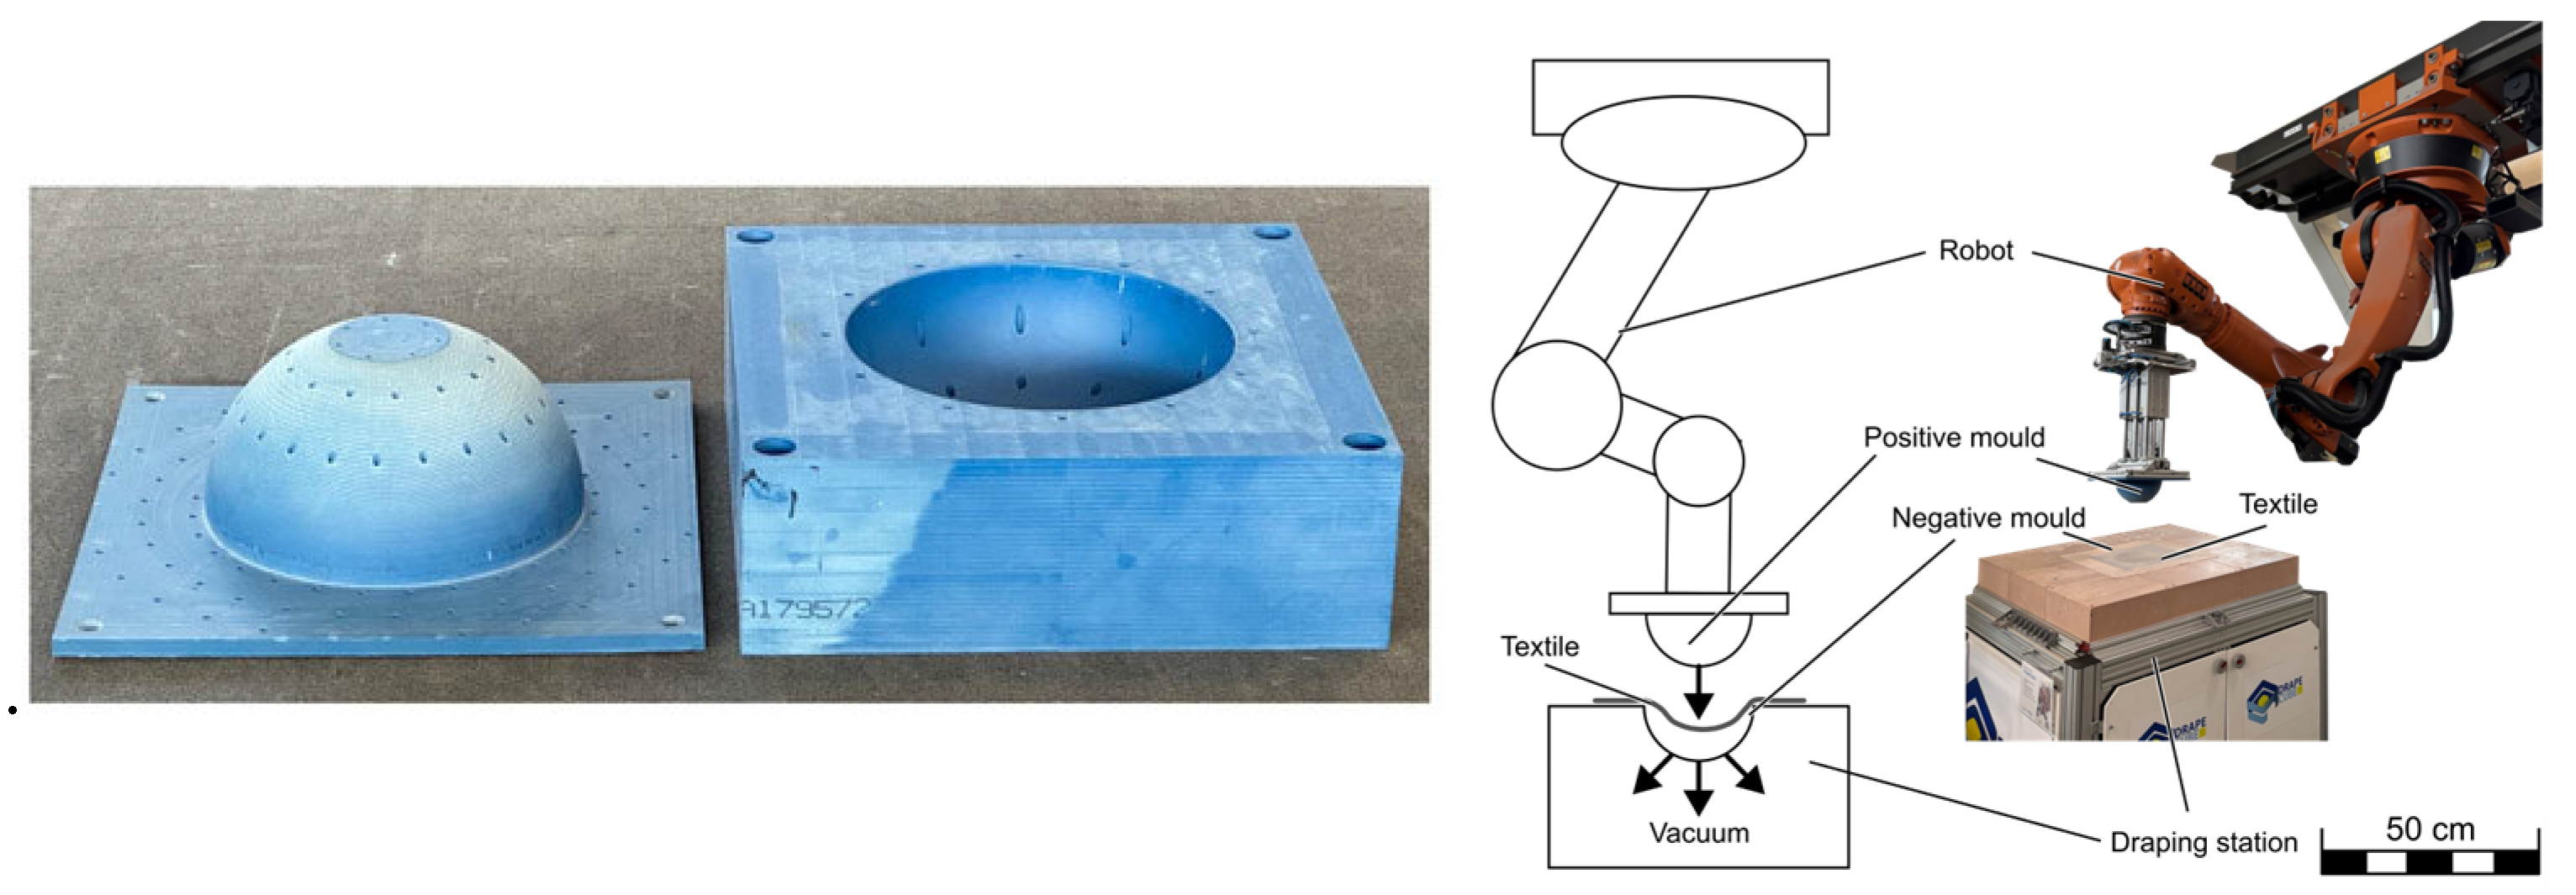
Figure 8.
Digital replicas of periodic units of investigated woven samples with proper length scaling. Colors indicate the relative position in thickness direction.
Figure 8.
Digital replicas of periodic units of investigated woven samples with proper length scaling. Colors indicate the relative position in thickness direction.
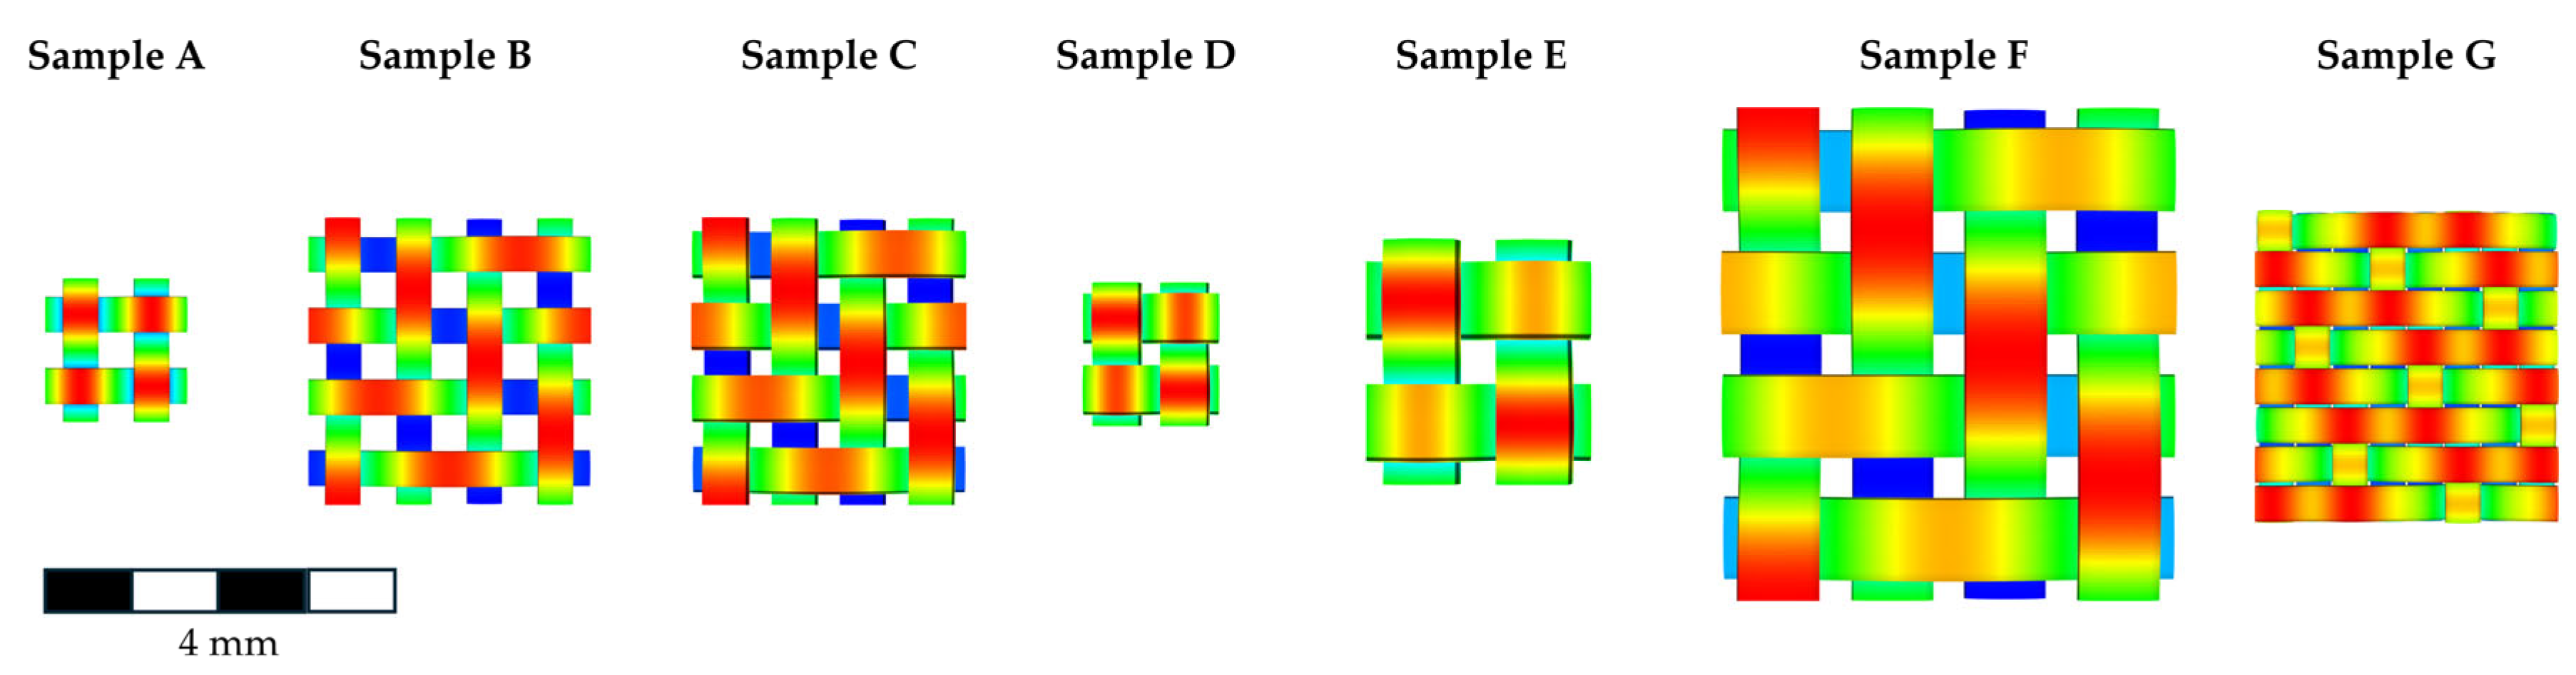
Figure 9.
Polar plot of directional extensional stiffness of woven samples.
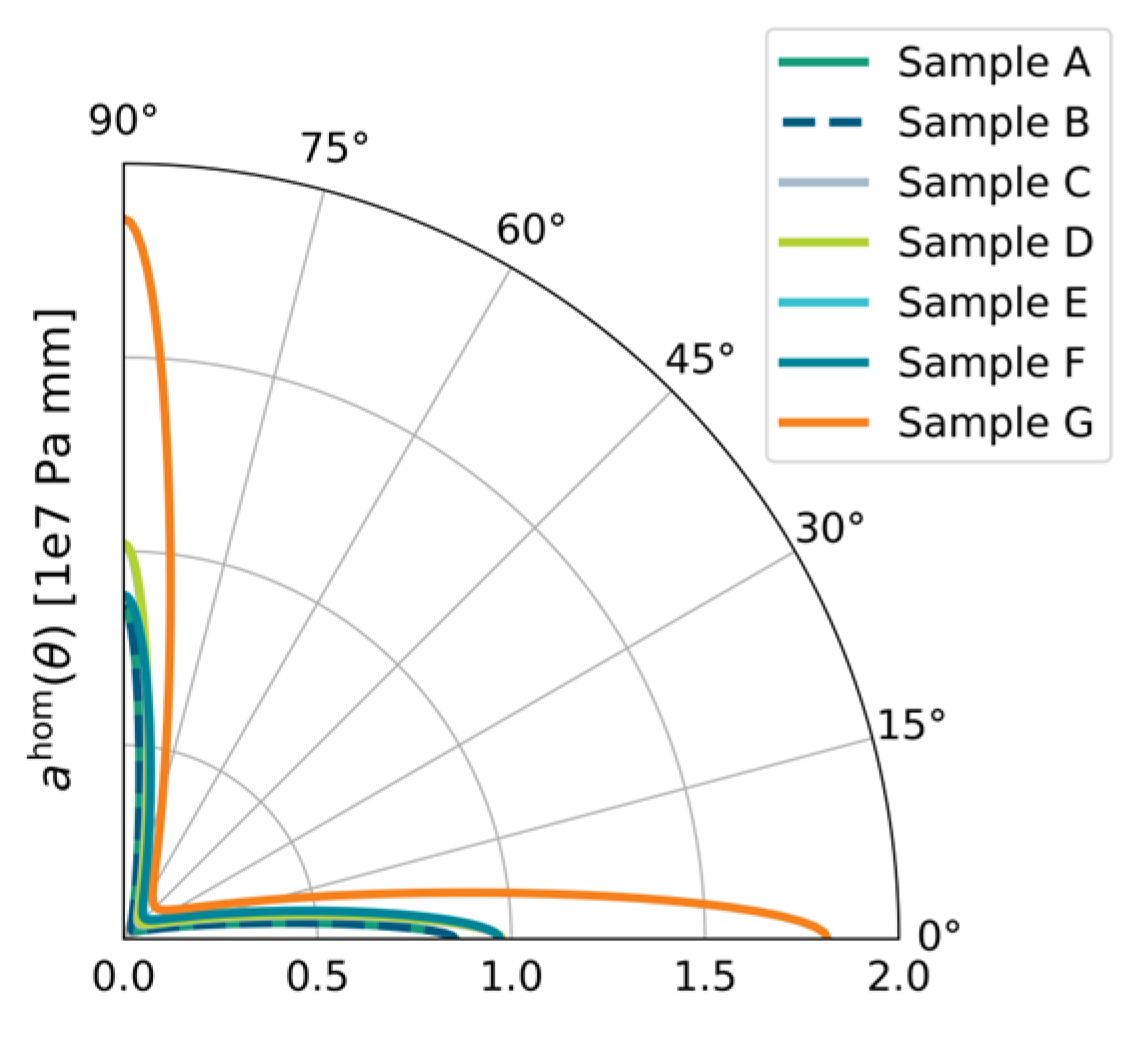
Figure 10.
Comparison of results from shear test with respective macroscopic simulation for model parameterization given in Table 2.
Figure 10.
Comparison of results from shear test with respective macroscopic simulation for model parameterization given in Table 2.
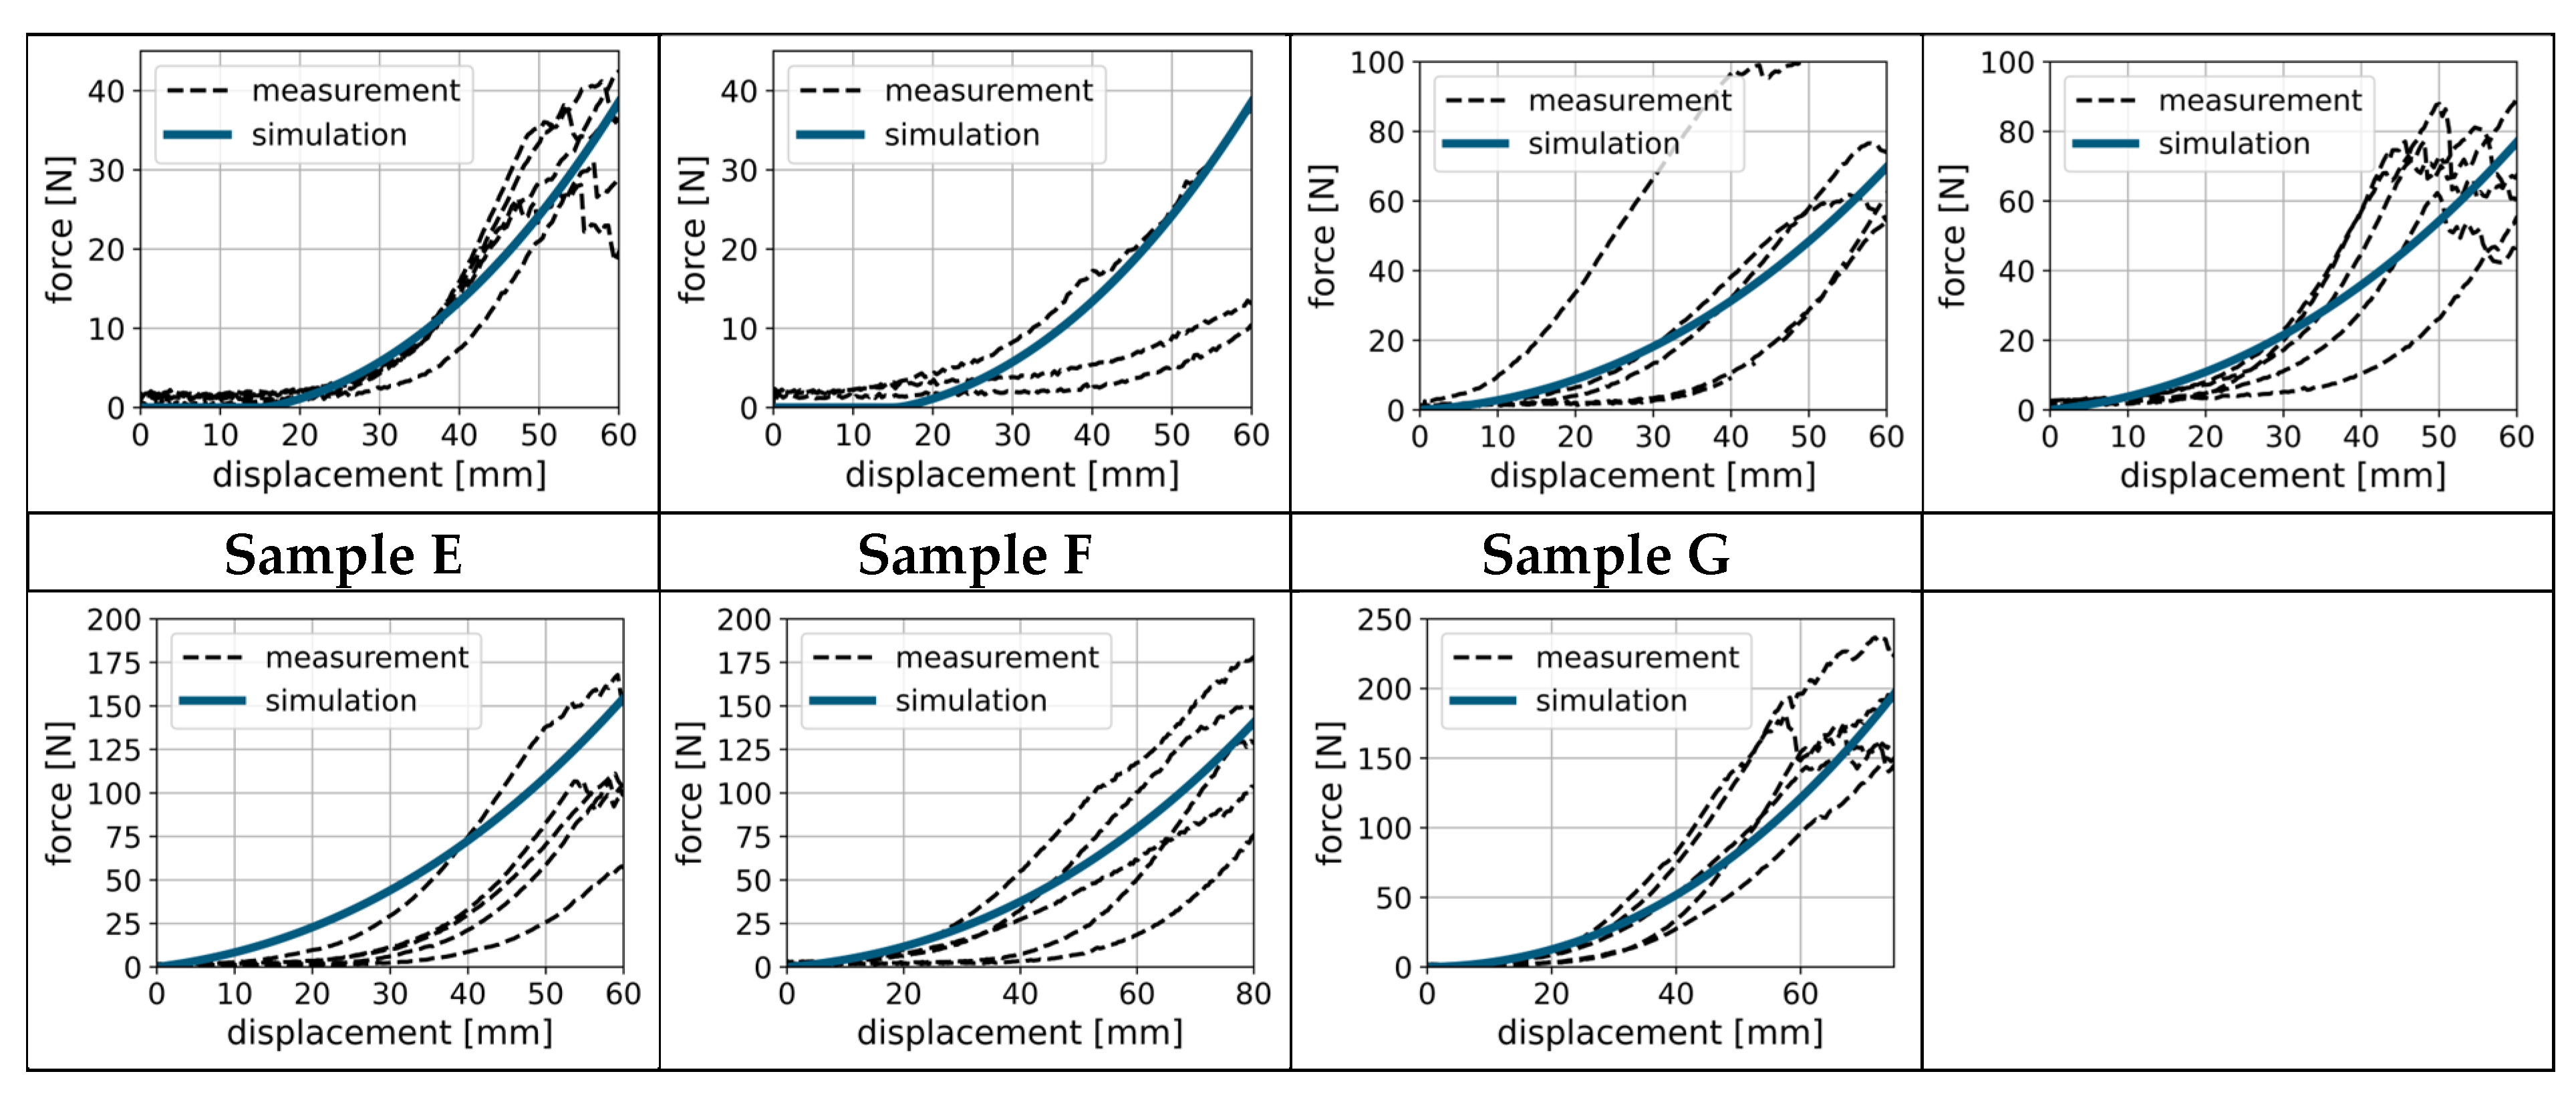
Figure 11.
Sensitivity study for sample B showcasing the influence of the model parameterization on the entries of the extensional stiffness tensor.
Figure 11.
Sensitivity study for sample B showcasing the influence of the model parameterization on the entries of the extensional stiffness tensor.

Figure 13.
Multiscale simulation strategy for the shear-frame experiment: yarn-scale simulation of the pre-buckling in-plane response up to the loss of stability, followed by macroscale shell simulation of the out-of-plane wrinkling behavior.
Figure 13.
Multiscale simulation strategy for the shear-frame experiment: yarn-scale simulation of the pre-buckling in-plane response up to the loss of stability, followed by macroscale shell simulation of the out-of-plane wrinkling behavior.
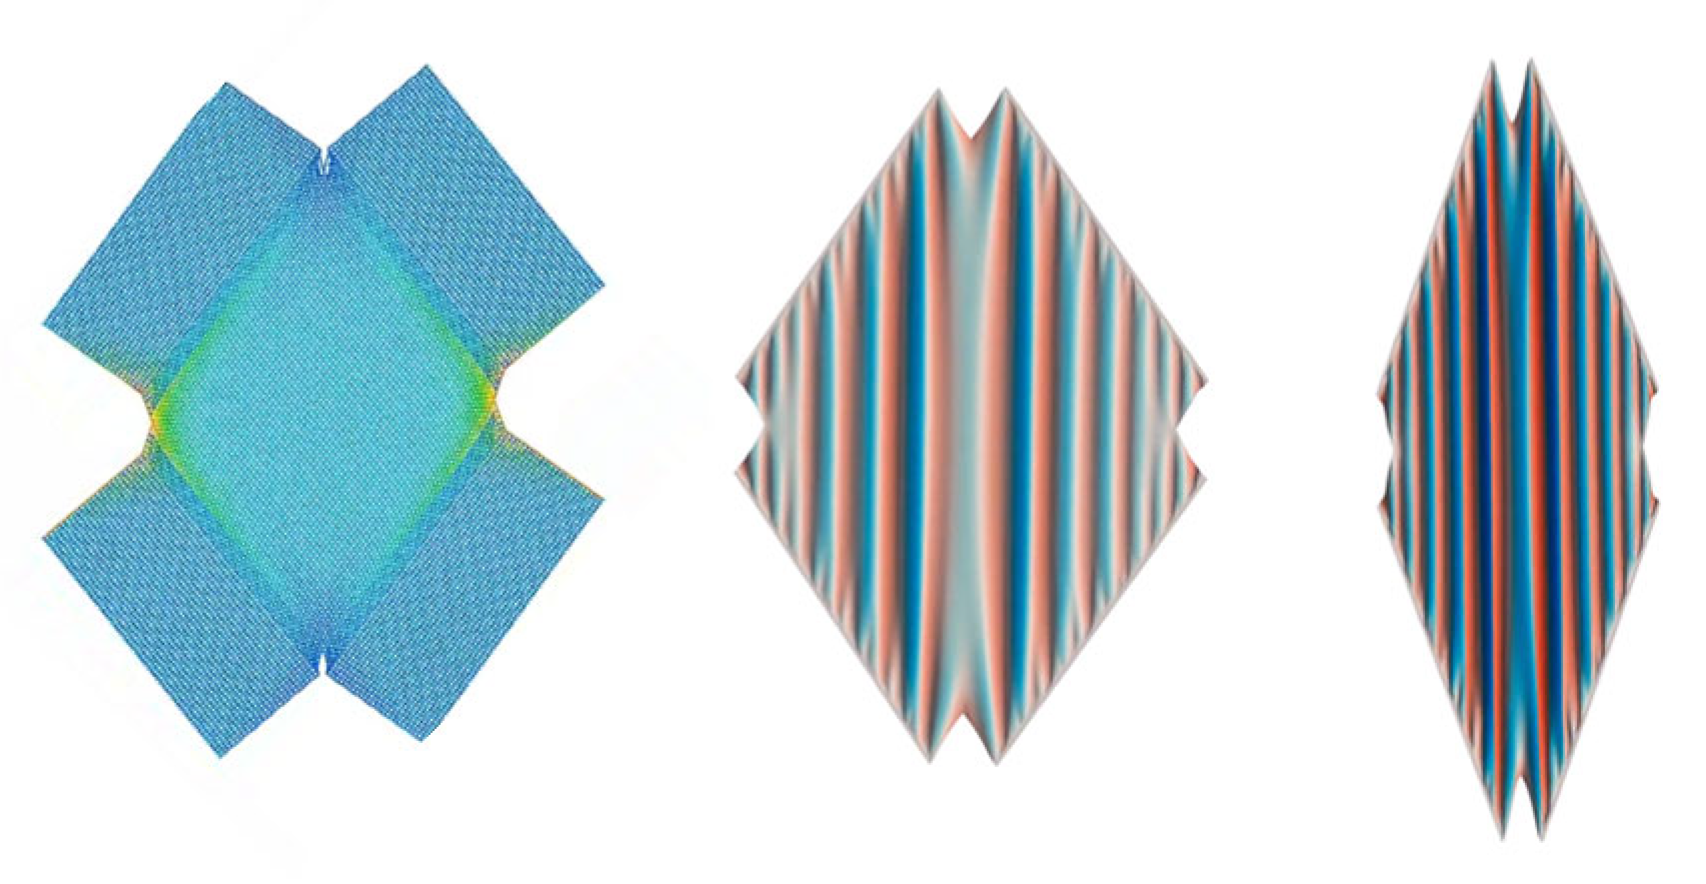
Figure 14.
From left to right: (2) simulation with no friction, free sliding on contacts, (2) experiment with a woven made of well-sliding glass fibers.
Figure 14.
From left to right: (2) simulation with no friction, free sliding on contacts, (2) experiment with a woven made of well-sliding glass fibers.
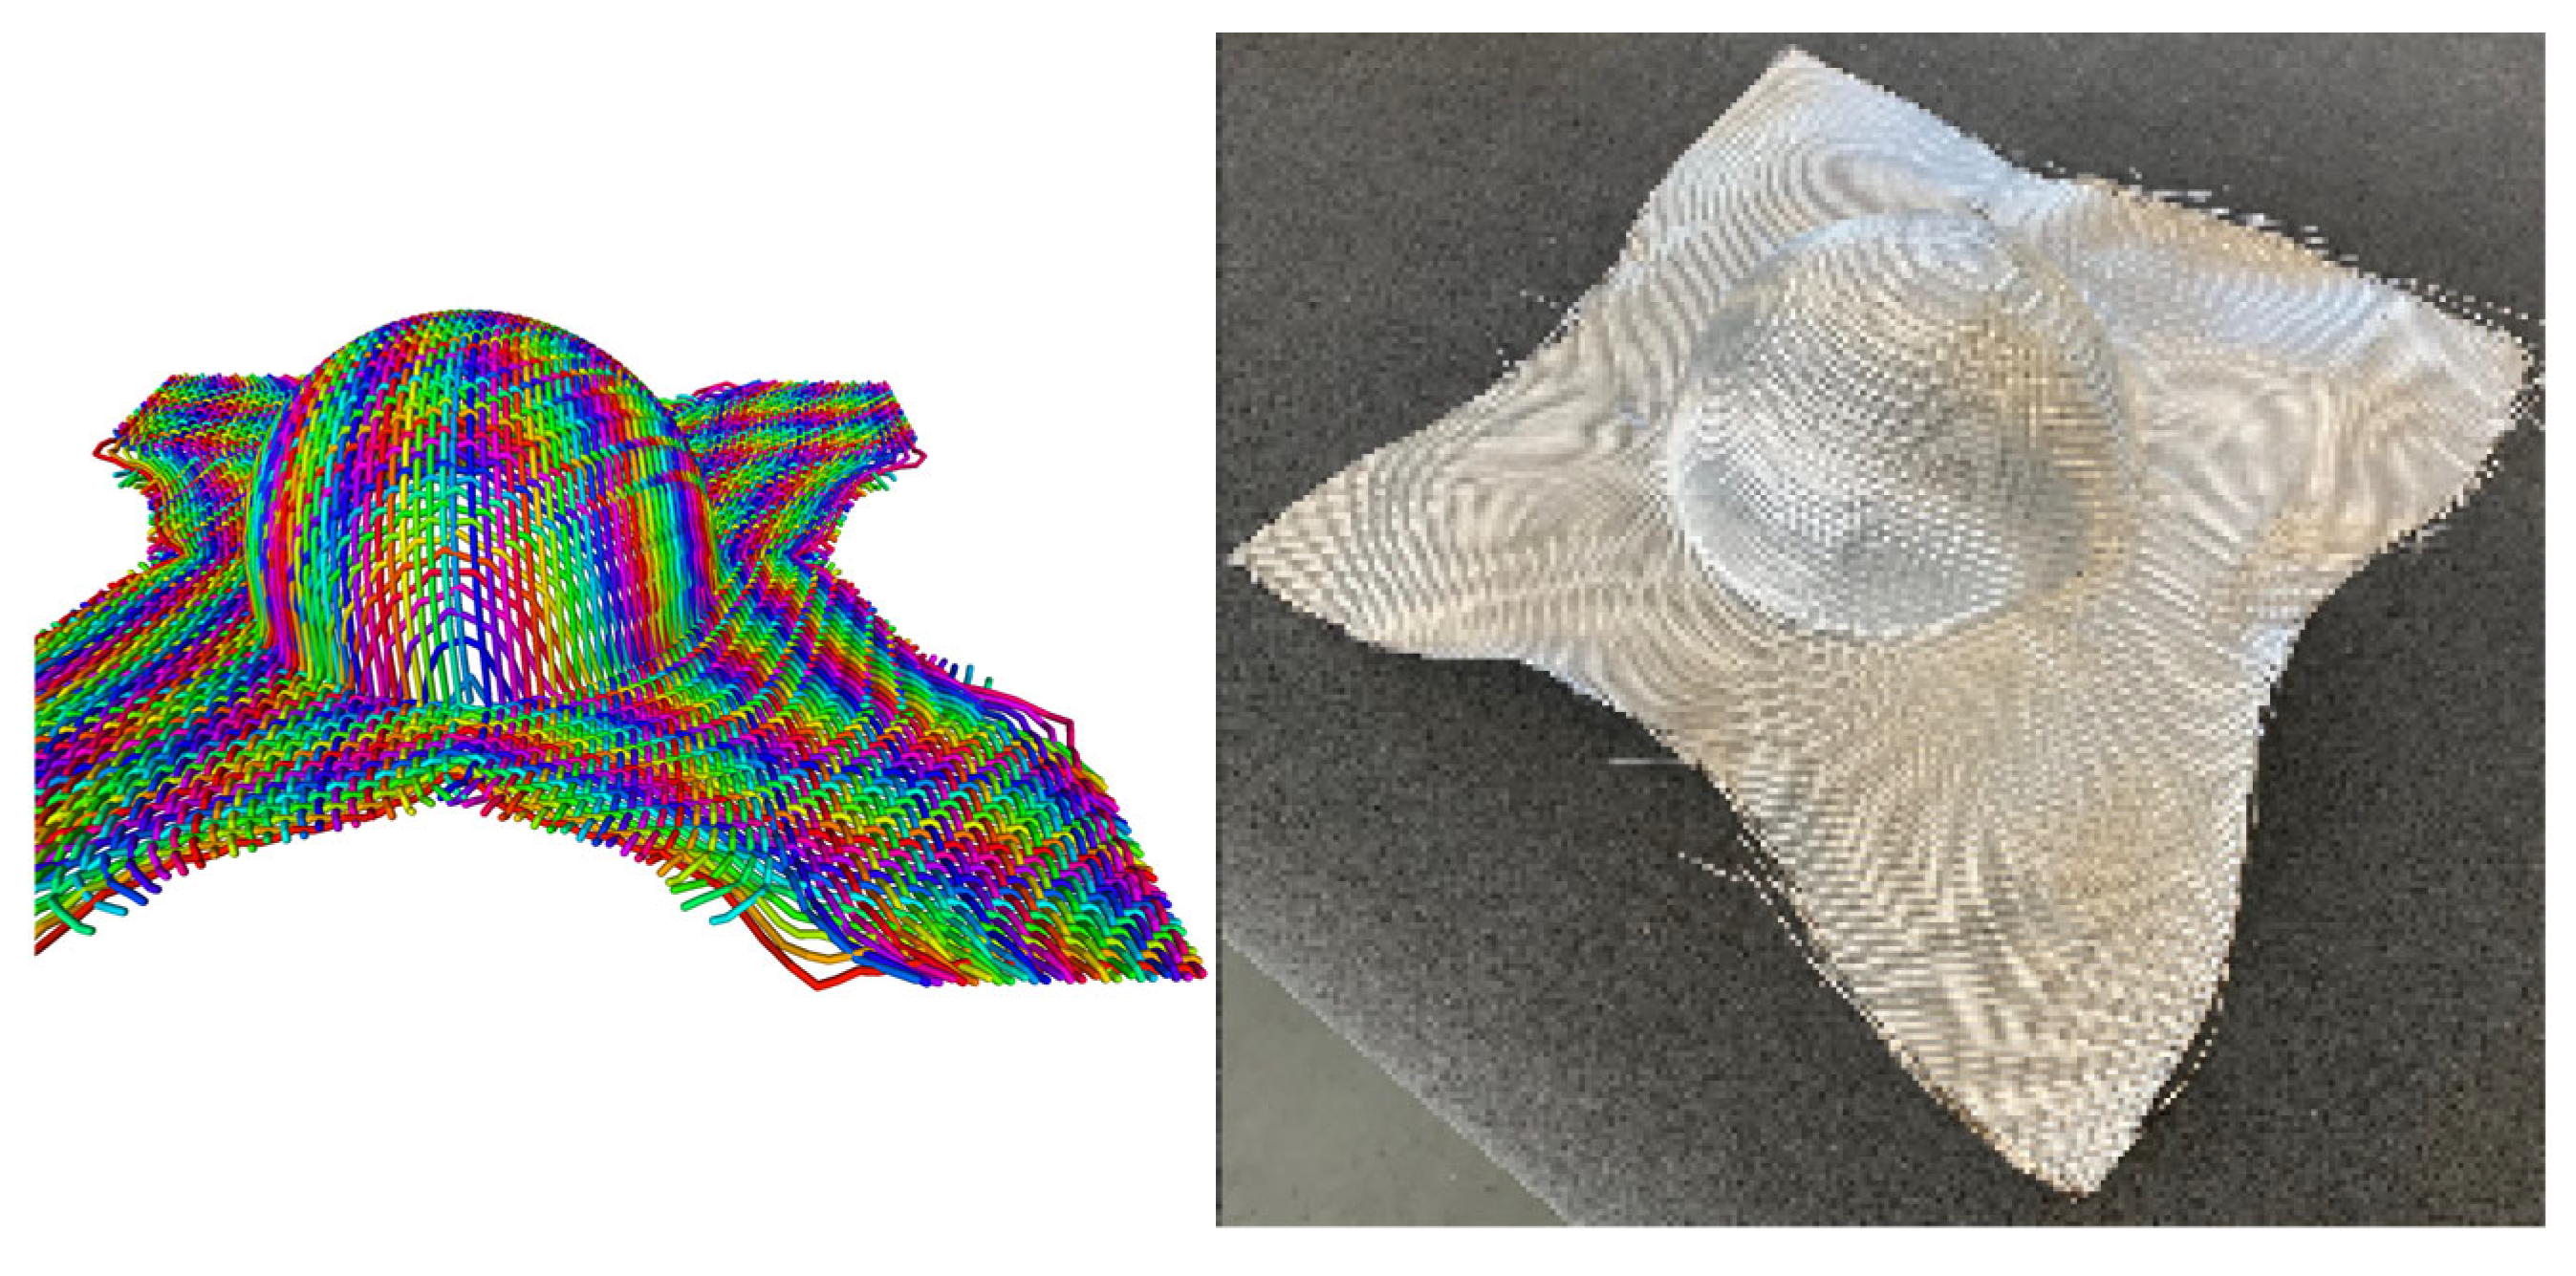
Figure 15.
. Geometric setup of draping simulation with molds represented by analytical volumetric objects (left) and draped macroscopic textile at varying simulation steps (right) with colors indicating the height position.
Figure 15.
. Geometric setup of draping simulation with molds represented by analytical volumetric objects (left) and draped macroscopic textile at varying simulation steps (right) with colors indicating the height position.

Figure 16.
3D laser scans of physical samples at maximal deformation with colors indicating the height position.
Figure 16.
3D laser scans of physical samples at maximal deformation with colors indicating the height position.
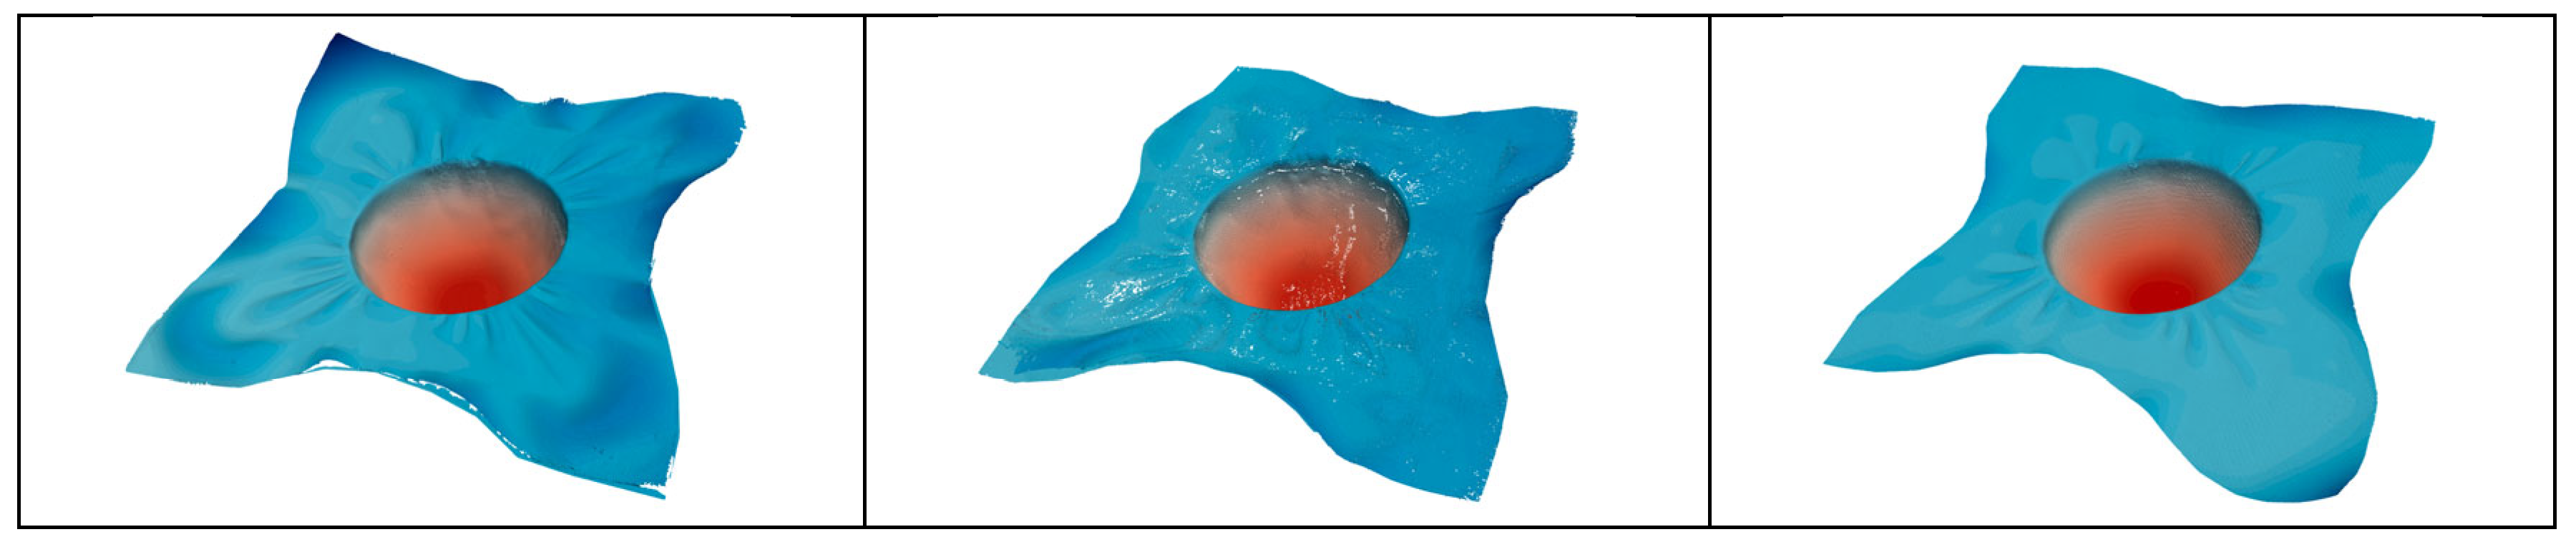
Figure 17.
Qualitative comparison of the laser scans (top row) with simulated maximal deformation state (bottom row) results for sample A, B and F.
Figure 17.
Qualitative comparison of the laser scans (top row) with simulated maximal deformation state (bottom row) results for sample A, B and F.
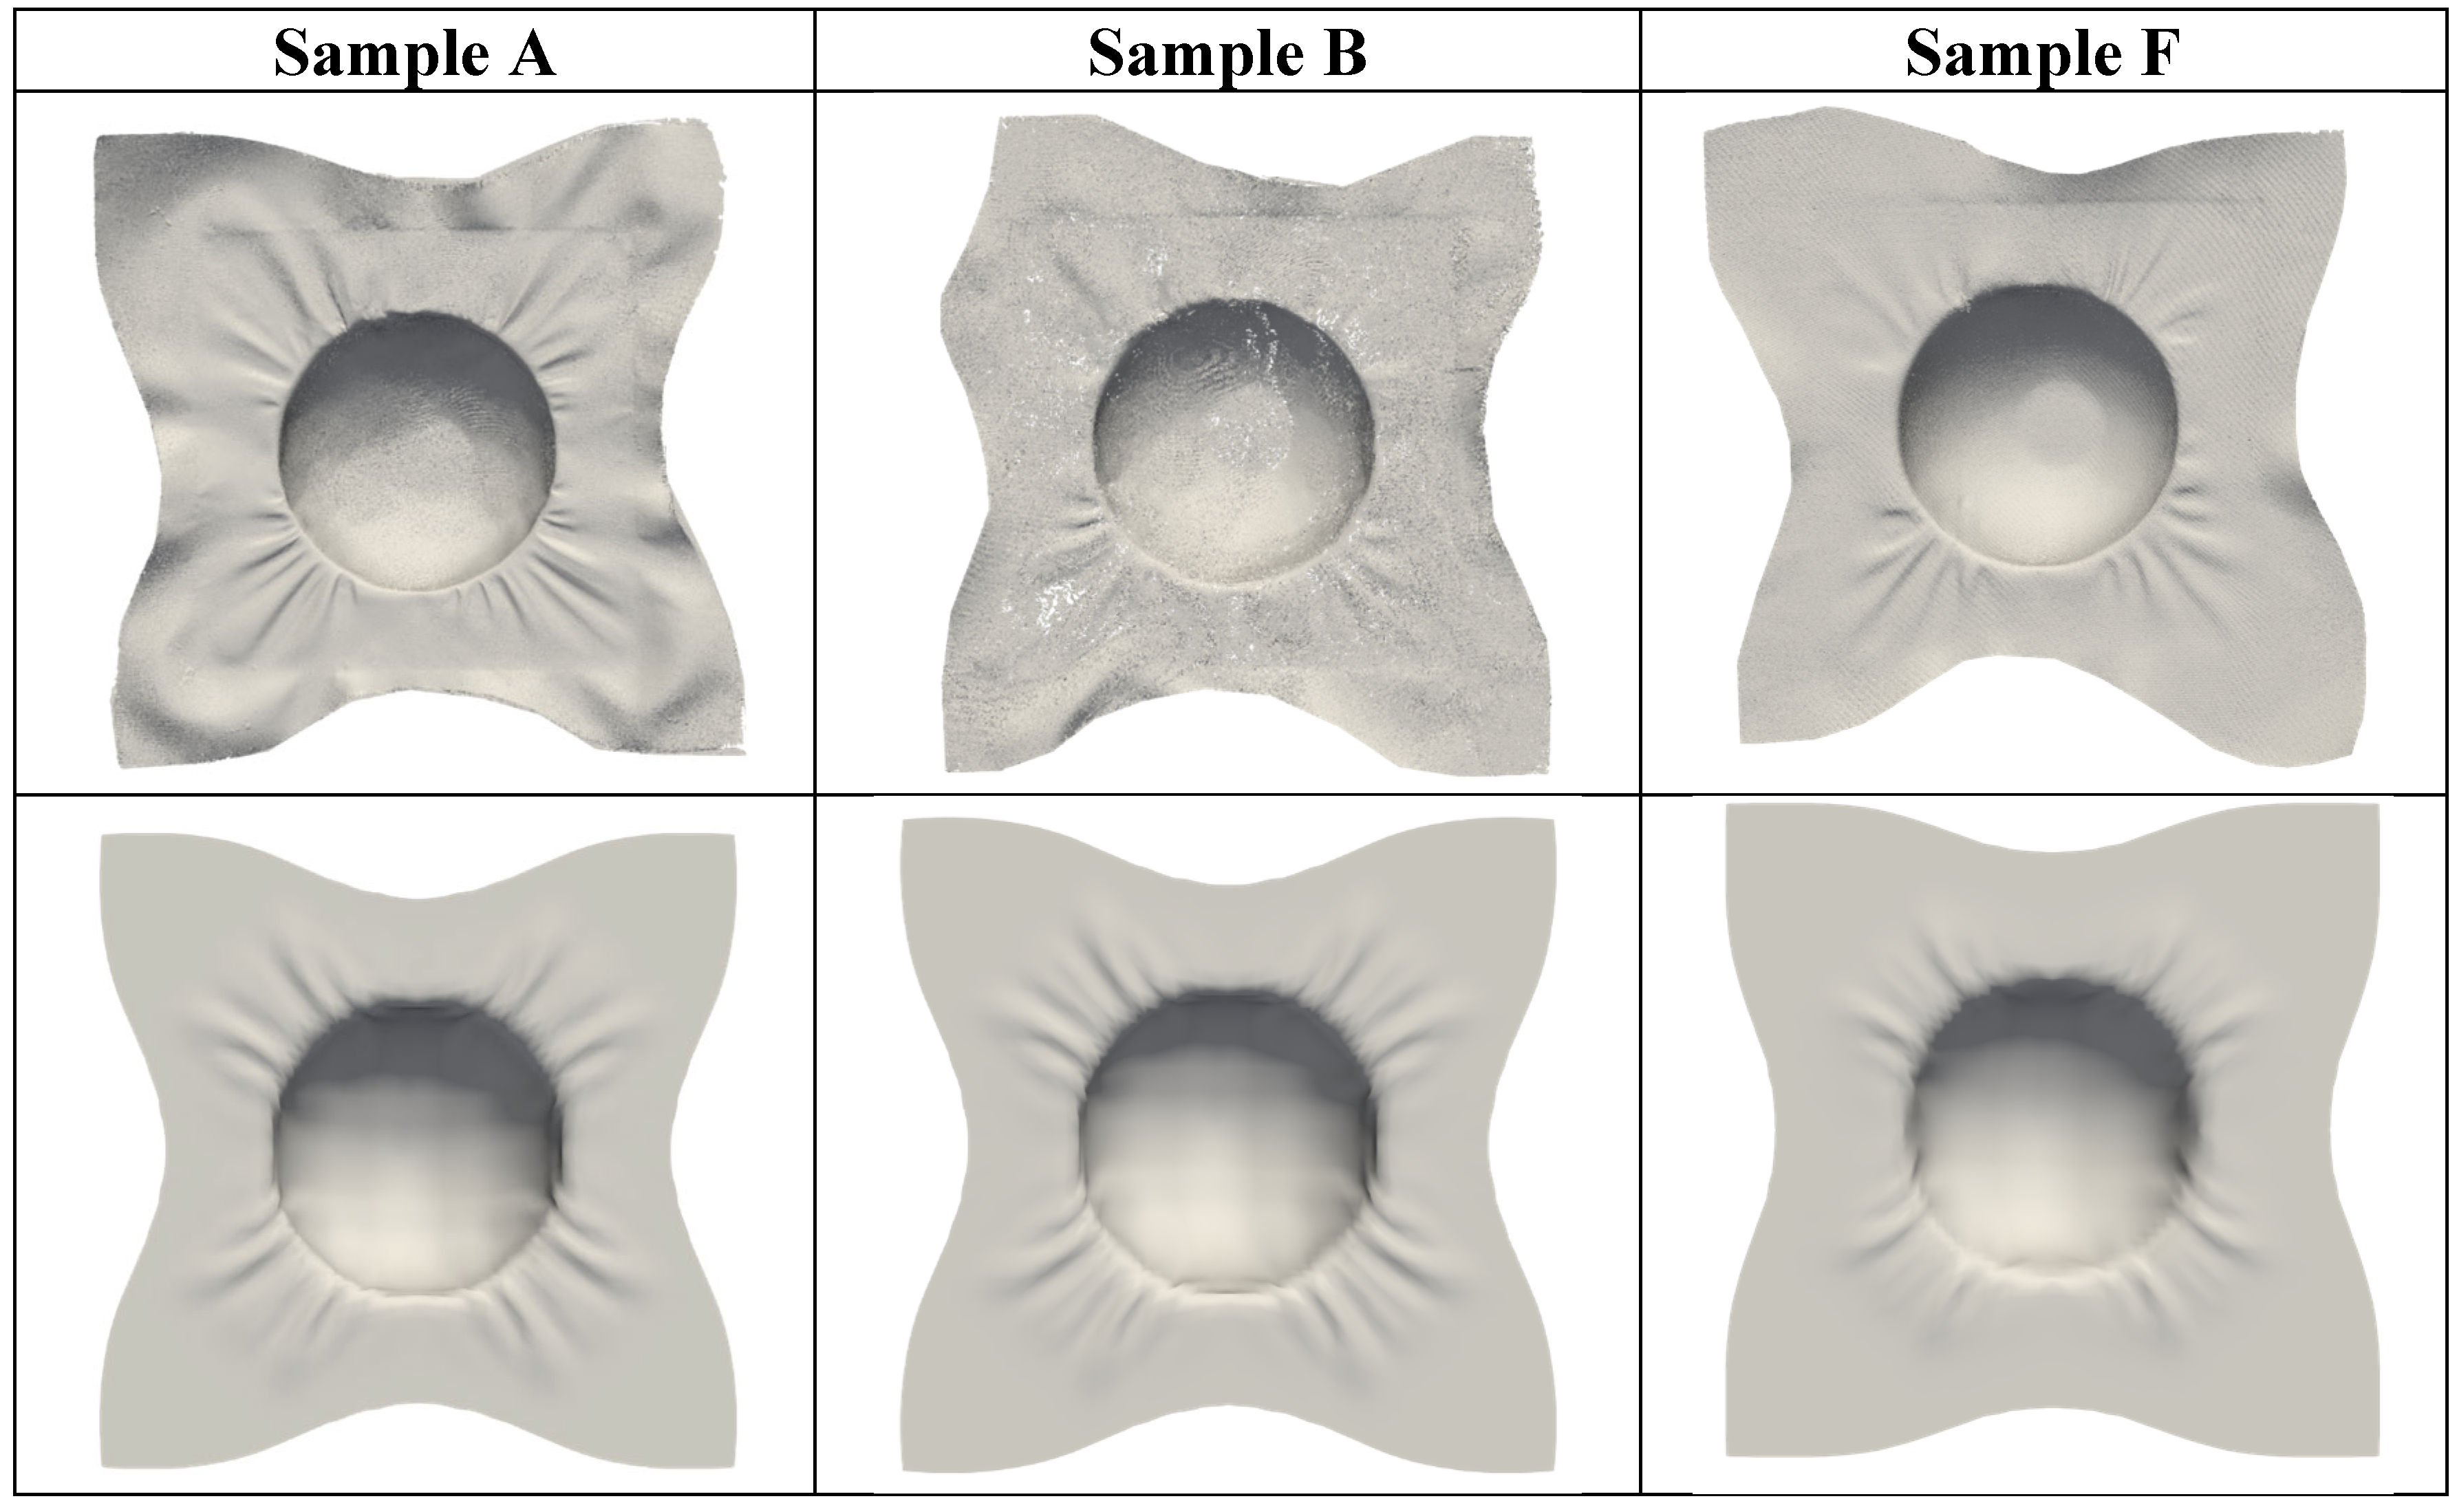
Figure 18.
Change of fold pattern for sample A under variation of the in-plane shear stiffness (rows) and the in-plane rotation of the textile cut-out (columns) at maximum deformation.
Figure 18.
Change of fold pattern for sample A under variation of the in-plane shear stiffness (rows) and the in-plane rotation of the textile cut-out (columns) at maximum deformation.
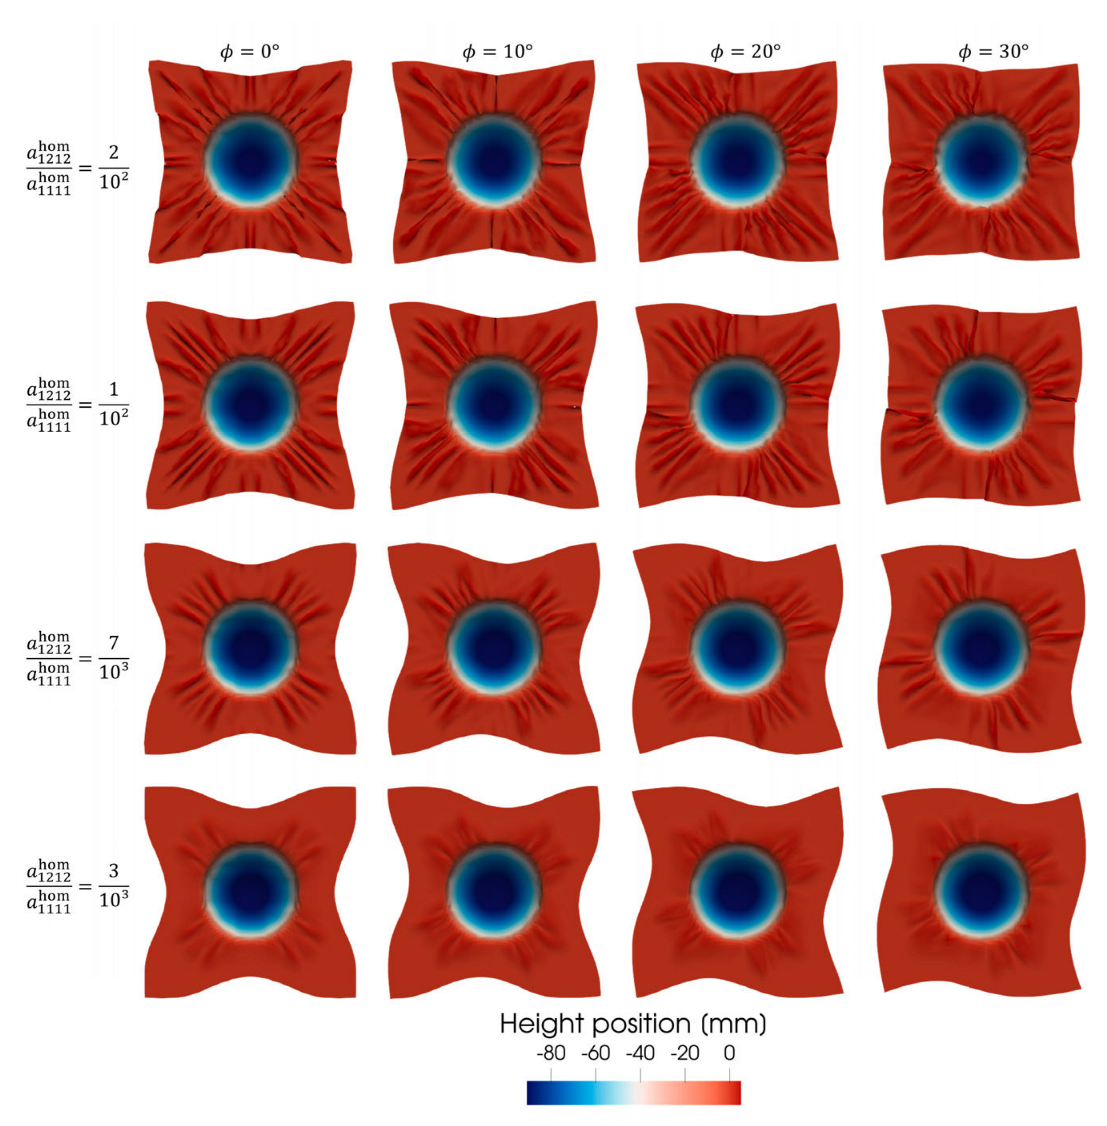
Figure 20.
Influence of the shear coefficient on the draping behavior of a 2D textile sheet over a rigid sphere with decreasing ratio
Figure 20.
Influence of the shear coefficient on the draping behavior of a 2D textile sheet over a rigid sphere with decreasing ratio
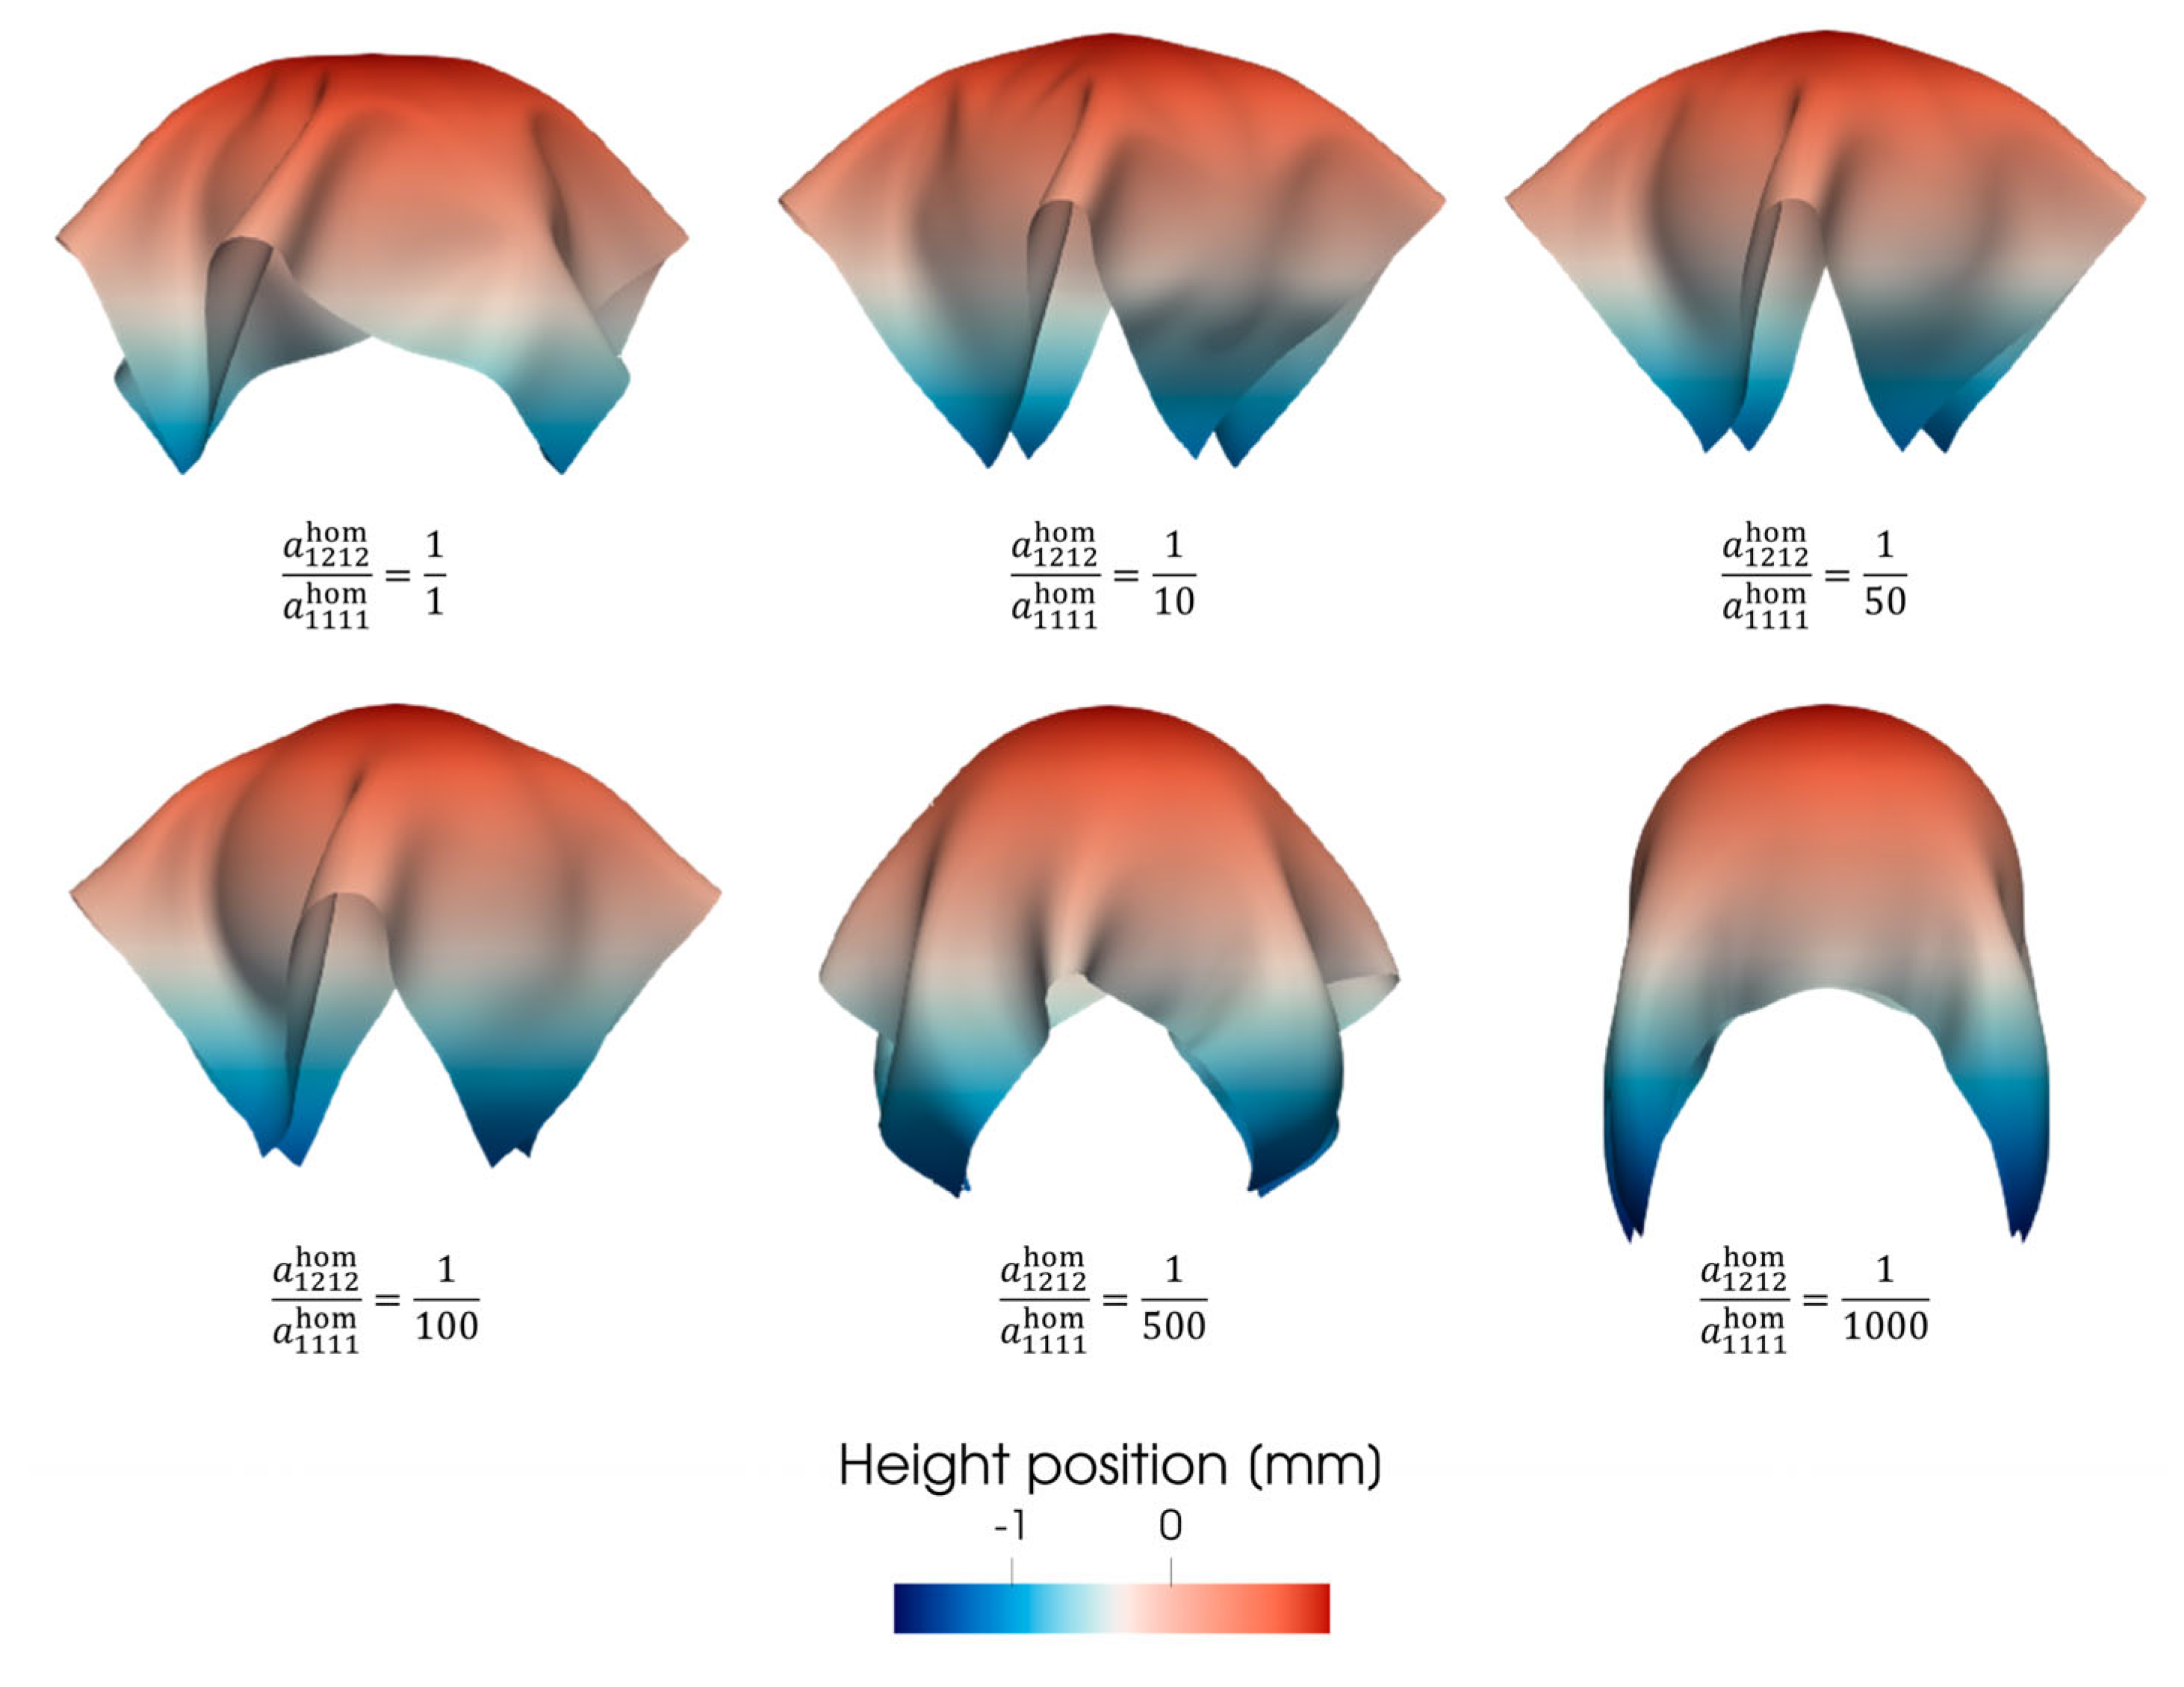
Figure 21.
Influence of the bending stiffness on the draping behavior of a 2D textile sheet over a rigid sphere. The bending stiffness increases from left to right; the results are shown in top view (top row) and side view (bottom row).
Figure 21.
Influence of the bending stiffness on the draping behavior of a 2D textile sheet over a rigid sphere. The bending stiffness increases from left to right; the results are shown in top view (top row) and side view (bottom row).
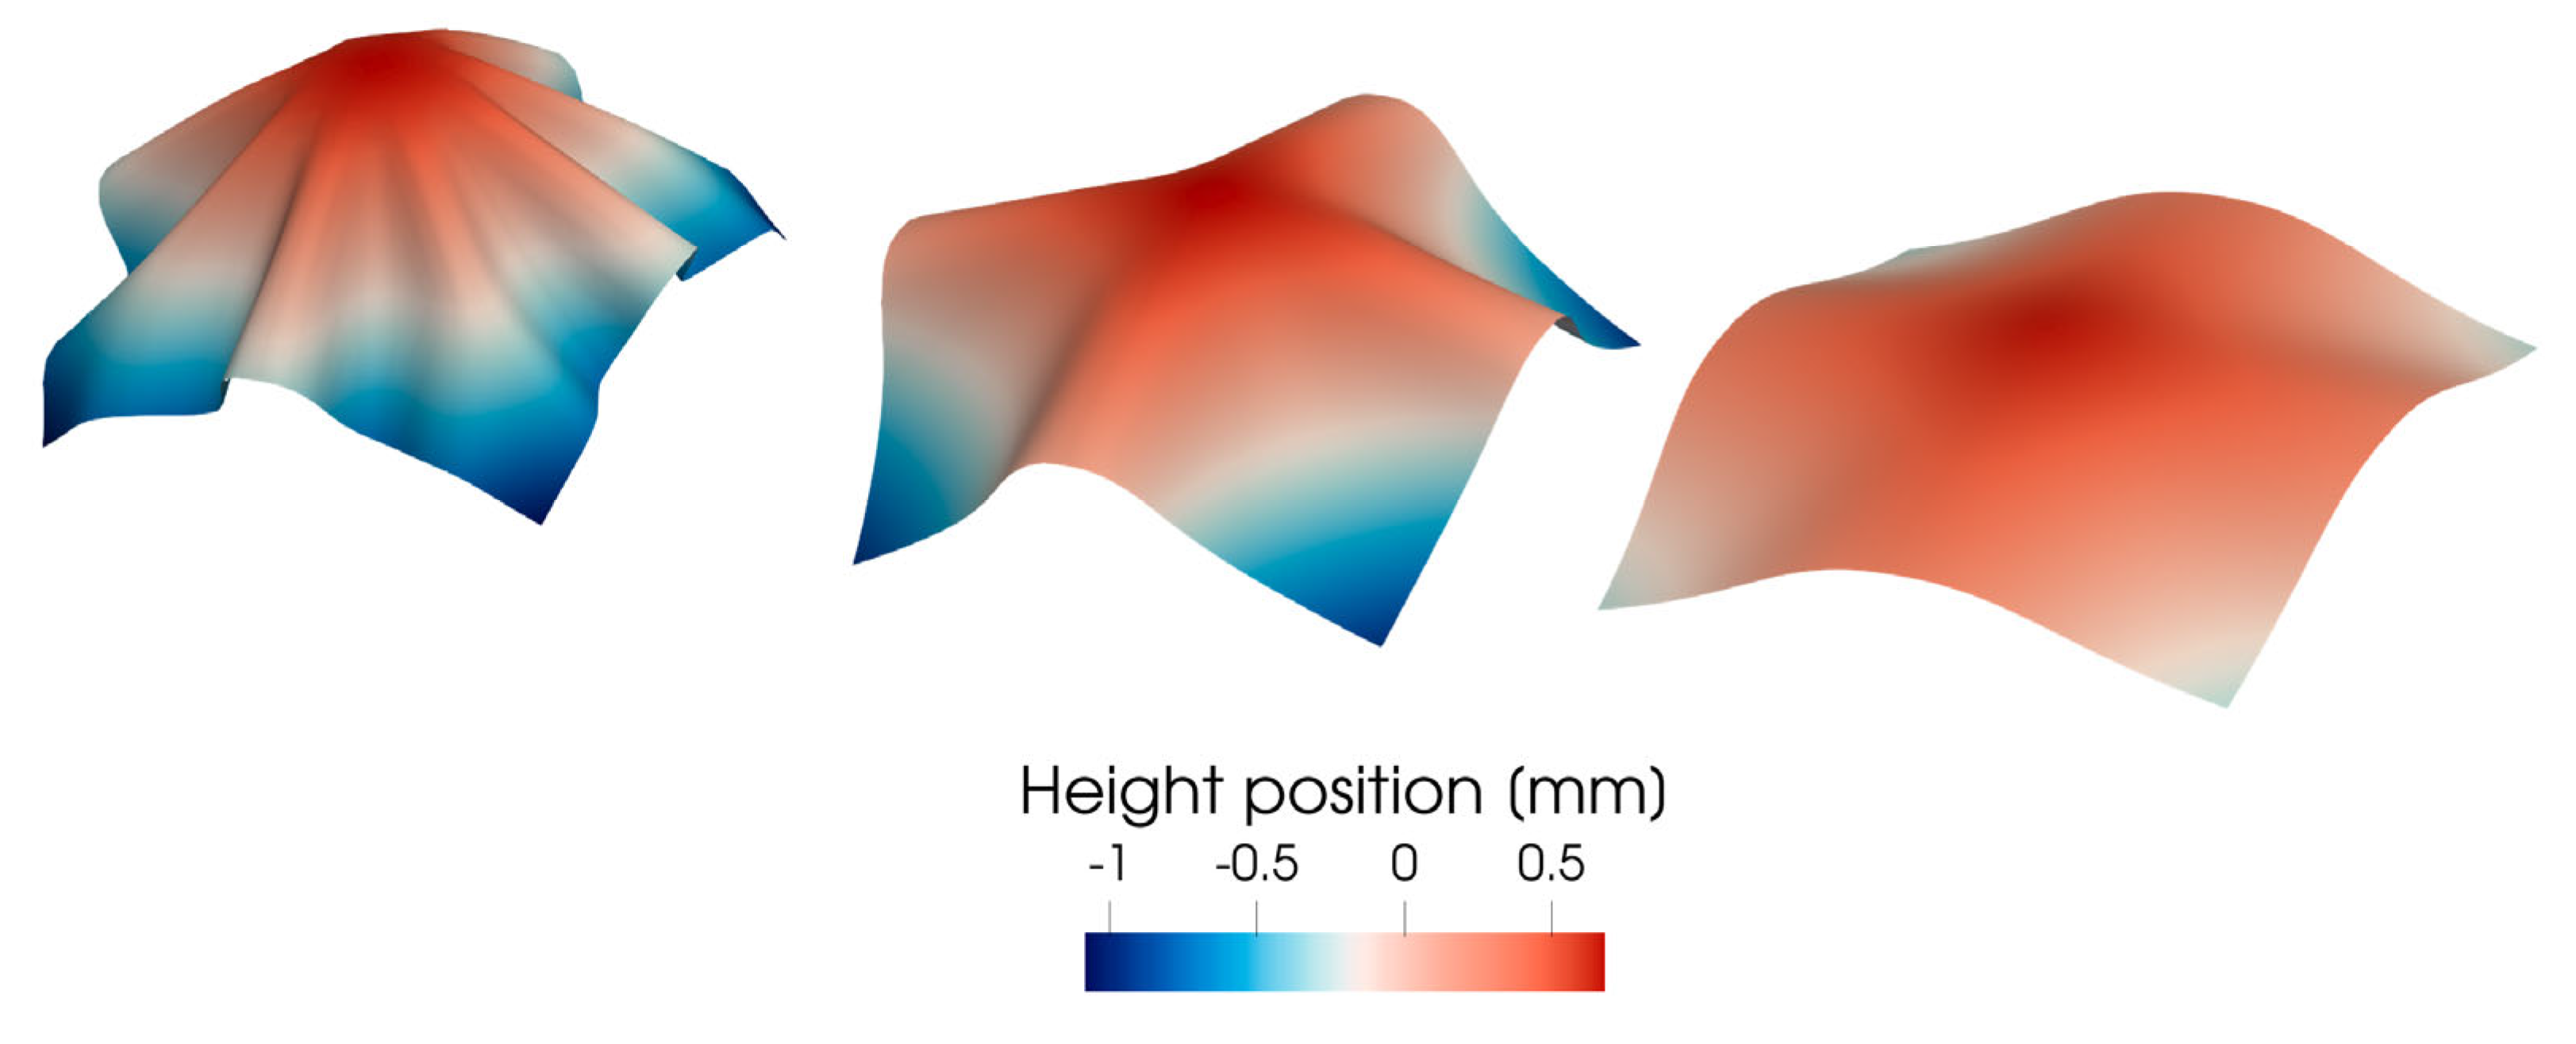
Figure 22.
Alternating stabilizing to one fold by increasing the number of inclusions. Colors indicate the height position.
Figure 22.
Alternating stabilizing to one fold by increasing the number of inclusions. Colors indicate the height position.

Figure 23.
Shear simulation with increasing number of stiff inclusions as in [26].
Figure 23.
Shear simulation with increasing number of stiff inclusions as in [26].
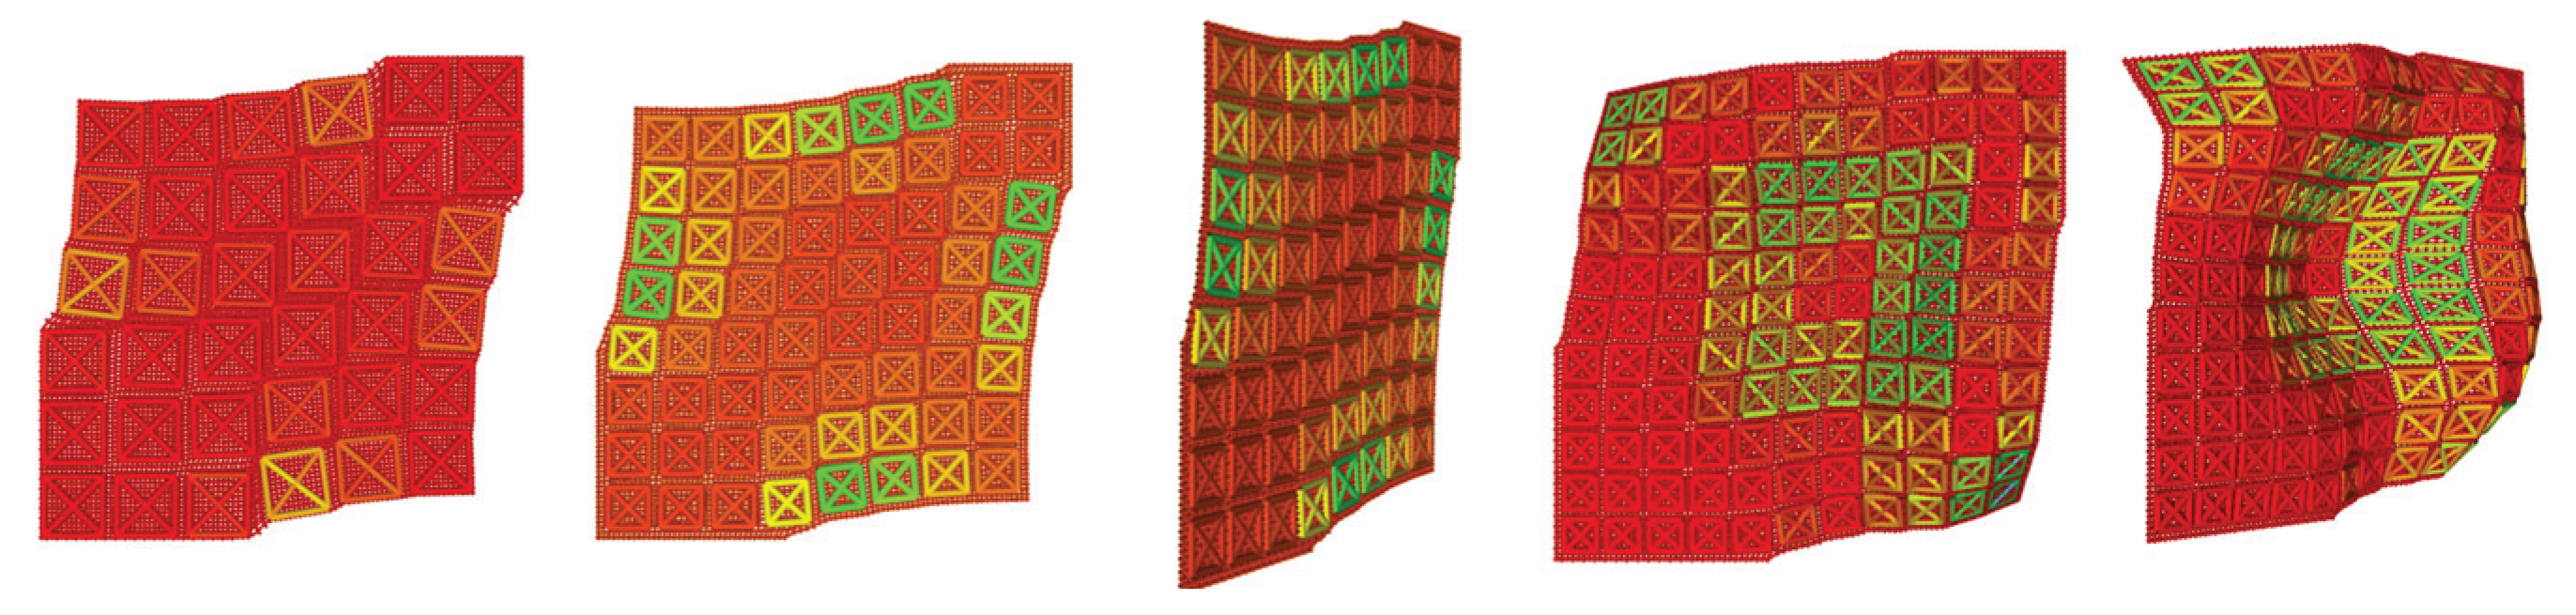

Table 1.
Fabric specifications of investigated glass fiber woven samples.
| Sample Id | Weave Type | Weight [g/m²] | Titer Warp [tex] | Titer Weft [tex] | Thread Density Warp [1/cm] | Thread Density Weft [1/cm] |
| A | Canvas | 80 | 33 | 33 | 12 | 12 |
| B | 2/2 Twill | 80 | 33 | 33 | 12 | 12 |
| C | 2/2 Twill | 160 | 68 | 68 | 12 | 11.5 |
| D | Canvas | 163 | 68 | 68 | 12 | 11.5 |
| E | Canvas | 280 | 68x3 | 204 | 7 | 6.5 |
| F | 2/2 Twill | 280 | 68x3 | 204 | 7 | 6.5 |
| G | 1/7 Satin | 296 | 340 | 68 | 22 | 21.5 |
Table 2.
Computed entries of effective extensional stiffness tensor per sample.
| Sample Id | Entry 1111 [Pa mm] | Entry 2222 [Pa mm] | Entry 1212 [Pa mm] | Entry 1122 [Pa mm] |
| A | 8.559×10⁶ | 8.559×10⁶ | 3.112×10⁵ | 1.420×10⁴ |
| B | 8.545×10⁶ | 8.545×10⁶ | 3.104×10⁵ | 2.747×10⁴ |
| C | 9.740×10⁶ | 1.018×10⁷ | 5.625×10⁵ | 3.217×10⁴ |
| D | 9.766×10⁶ | 1.020×10⁷ | 6.204×10⁵ | 1.648×10⁴ |
| E | 9.716×10⁶ | 8.874×10⁶ | 8.272×10⁵ | 2.506×10⁴ |
| F | 9.698×10⁶ | 8.862×10⁶ | 7.884×10⁵ | 2.944×10⁴ |
| G | 1.816×10⁷ | 1.858×10⁷ | 1.195×10⁶ | 1.265×10⁴ |
Disclaimer/Publisher’s Note: The statements, opinions and data contained in all publications are solely those of the individual author(s) and contributor(s) and not of MDPI and/or the editor(s). MDPI and/or the editor(s) disclaim responsibility for any injury to people or property resulting from any ideas, methods, instructions or products referred to in the content. |
© 2026 by the authors. Licensee MDPI, Basel, Switzerland. This article is an open access article distributed under the terms and conditions of the Creative Commons Attribution (CC BY) license.
Copyright: This open access article is published under a Creative Commons CC BY 4.0 license, which permit the free download, distribution, and reuse, provided that the author and preprint are cited in any reuse.