

Submitted:
11 September 2026
Posted:
14 September 2026
You are already at the latest version
Abstract
Currently, rapid digital revolution in the building industry due to the necessity to solve chronic challenges such as low productivity, inconsistent execution quality, and difficulty in controlling costs and schedules. Construction supervision is one area where digital transformation can have a significant impact, given the repetitive nature of its tasks, which rely heavily on human expertise and manual labor. The aim of this study is to develop a comprehensive framework to evaluate the effectiveness of the digital transformation on supervision in construction projects using modeling of structural equations (PLS-SEM). The data obtained was examined. and evaluated utilizing technique PLS-SEM software to build the proposed model. The results show a positive correlation between the supervisor's productivity and the utilization of digital technology, depending on the context of the task and the nature of the work. The study also proposes a methodology for the use of SEM in this area, comprising model construction steps and evaluation indicators, and it provides suggestions for researchers and practitioners to improve the effectiveness of using digital transformation in construction supervision.
Keywords:
digital transformation
; construction supervision
; building projects
; modeling of structural equations
; Smart PLS
1. Introduction
Construction supervision plays a key component when it comes to the achievement of building projects, making sure that the building is executed in keeping with the specs and plans. Traditional supervision processes, however, have numerous problems which have a negative effect on project quality and effectiveness. Manual inspection and monitoring process on site have been documented with error rates of 20% to 30% in the detection of irregularities and defects, which have significant consequences on quality, cost and time [1].
These challenges are heightened during COVID-19 when home inspections are more critical than ever, and the research and practice community have responded with creative digital solutions to modernize compliance and supervision. Manual measurements, paper-based document management, work documentation, etc., are typical supervision activities that are highly repetitive, require a lot of physical effort, and depend on a person’s experience and ability, making them suitable for automation and digitalization [1,2]. Moreover, construction sites are dynamically changing and there is a gap between the design model and the reality of the construction site, which is one of the main sources of uncertainty in project work [3].
Digital transformation in construction supervision marks a shift in the way supervisors oversee the construction process, transforming it from a paper-based and visual inspection approach to an integrated system powered by advanced digital technology. Construction 5.0 [4] has introduced the concept of human-machine collaboration and a culture of learning, so the emphasis is now on a balanced use of AI and organizational processes and human expertise.
This transformation involved employing an integrated set of technologies that work together to offer a real time and a comprehensive view of the status of the project. These technologies can be categorized according to the four-way integration model identified in recent studies [5], as shown in Table 1.
Together, these technologies form what is known as the Digital Twin, a dynamic model that reflects the actual state of the project in real time and enables the simulation of future scenarios and the prediction of risks [5,6].
Some of the most important applications of digital technologies in the various stages of supervision for construction projects are as follows:
2. Design and Planning Phase
2.1. Site Analysis and Design Improvement
Using Geographic Information Systems (GIS) and Hydrological Models (HEC-HMS) to analyze site data and identify optimal locations [7].
Applying virtual reality (VR) technologies to gather user feedback and improve designs [8].
2.2. Detecting Interferences
Numerous experiments have shown that the application of BIM has enabled the detection of many design interferences before the start of implementation for a large number of construction projects.
3. Implementation and Construction Phase
3.1. Real-Time Supervision
Monitoring work progress: Using drones every 6 days to collect and process images to detect problems (more than one problem can be identified in a single project).
Quality control: Using sensors in construction equipment to monitor the quality of work and construction components.
Safety monitoring: Using 4D digital systems to detect hazards and issue an immediate alarm [9].
3.2. Coordination Between Parties
The Spatial Sense platform provides collaborative capabilities that allow stakeholders to remotely review site data, comment on digital forms, and assign tasks, reducing delays caused by fragmented communication [10].
4. Operation and Maintenance Phase
4.1. Continuous Monitoring
By deploying a set of sensors at the project site to collect and analyze operational data using artificial intelligence.
Predicting equipment failures using Long Short-Term Memory (LSTM) models to identify expected failure locations and times.
4.2. Improvement Results
It is possible to improve the maintenance response time from 36 hours to 8 hours (an improvement of 77.8%) in the project under consideration.
5. Literature Review
In recent years, there has been a great deal of interest in the prospects of digital transformation in the field of construction project management. Over the past decade, there has been a lot of interest in the potential of digital transformation in construction project management. Basic research in this field was geared towards the recording of fundamental concepts and application of new technologies on the construction site. This was the time when the first use of time-lapse photography and drones for progress tracking was introduced, as explained in a recent systematic review of 395 publications to investigate their development and use [11].
As each technology advanced, people turned to ways to combine these different technologies into an integrated system. In a thorough study conducted by Abdelkader et al. [12] by using the PRISM methodology, authors showed that BIM also gives a complete visualization of the project while low-cost sensors (IoT) allow following the actual project progress in real time and simulations can predict future scenarios. The study demonstrated that one of the biggest value-adds of digital twins is to project managers in determining potential opportunities and risks in the project prior to implementation.
The current period represents a paradigm shift with the proliferation of advanced artificial intelligence applications. A recent study by Mitra and Molville [13] documents that technology can now enhance structural compliance in three key areas: defect detection, dimensional measurement, and conformity verification. The study also identifies the technology stacks best suited to each inspection purpose, providing a roadmap for commercial applications and future research.
Kim et al. [14] used SEM in an exploratory study to examine the digital technology’ impact on productivity of a construction project’s supervisors. It is a pioneering study for the evaluation of digital transformation of supervision with SEM methodology. The study offered a practical guide to how digital tools can improve productivity by emphasizing staged adoption and task-specific considerations.
Alqahtani et al. [15] investigated the factors of critical success (CSFs) that influence the efficiency of AI -enabled systems. The application of digital twins in the construction industry in Saudi Arabia has been examined by PLS-SEM. A reflective-hierarchical model has been created which captures three dimensions of success factors: human factors (HCFs), infrastructure factors (TIFs) in addition to technological factors and standards and governance factors (GSFs). The study emphasized the significance of funding governance frameworks, scalable infrastructure, and high-quality data. To reap the advantages of AI-powered digital transformation, workforce training and incentives are required [15].
Naji et al. [16] used the Digital Transformation Readiness Level Index in Building Construction (DTRLIIBC) to measure the digital transformation’s level of maturity in the construction sector by applying SEM. In order to get the most efficient model possible, causal relationships between variables were identified using SEM in order to minimize the measurement error. The research offers a framework to organize organizations by digital maturity levels, and can be applied by government agencies, construction companies and developers to track the level of digital transformation.
Okanlawon et al. used PLS-SEM to evaluate the impact of adopting augmented reality (AR) technologies on the construction lifecycle in Nigeria [17]. Dissemination of Innovation (DOI) theory and Technology Acceptance Model (TAM) were used to develop the conceptual framework. The study showed that integrating AR throughout the construction lifecycle can improve the construction process.
Kumar and Padala [18] created a framework based on PLS-SEM to recognize the key factors that impact the implementation of digital twin systems in construction projects. Multiple techniques (data-driven performance, real-time monitoring, significant integration with monitoring) were integrated by second-order latent variables, with significant results (p < 0.001).
With the ever-expanding use of digital technologies such as the Internet of Things (IoT), Building Information Modeling (BIM), digital twins in the construction sector, and artificial intelligence (AI) [14,19], the importance of measuring the impact of digital transformation on supervision is also growing. However, a systematic review of the literature reveals a significant gap in the research literature: the absence of comprehensive assessment models that combine several measures of digital transformation and examine the causal relationship between the introduction of technology and the measures of performance of the supervisors [14,15]. This study aims to fill this gap by developing a framework for the effect of digital transformation on supervision through structural equation modeling (SEM), a sophisticated statistical analysis technique that can be used to analyze complex relationships between observed variables and underlying variables.
6. Materials and Methods
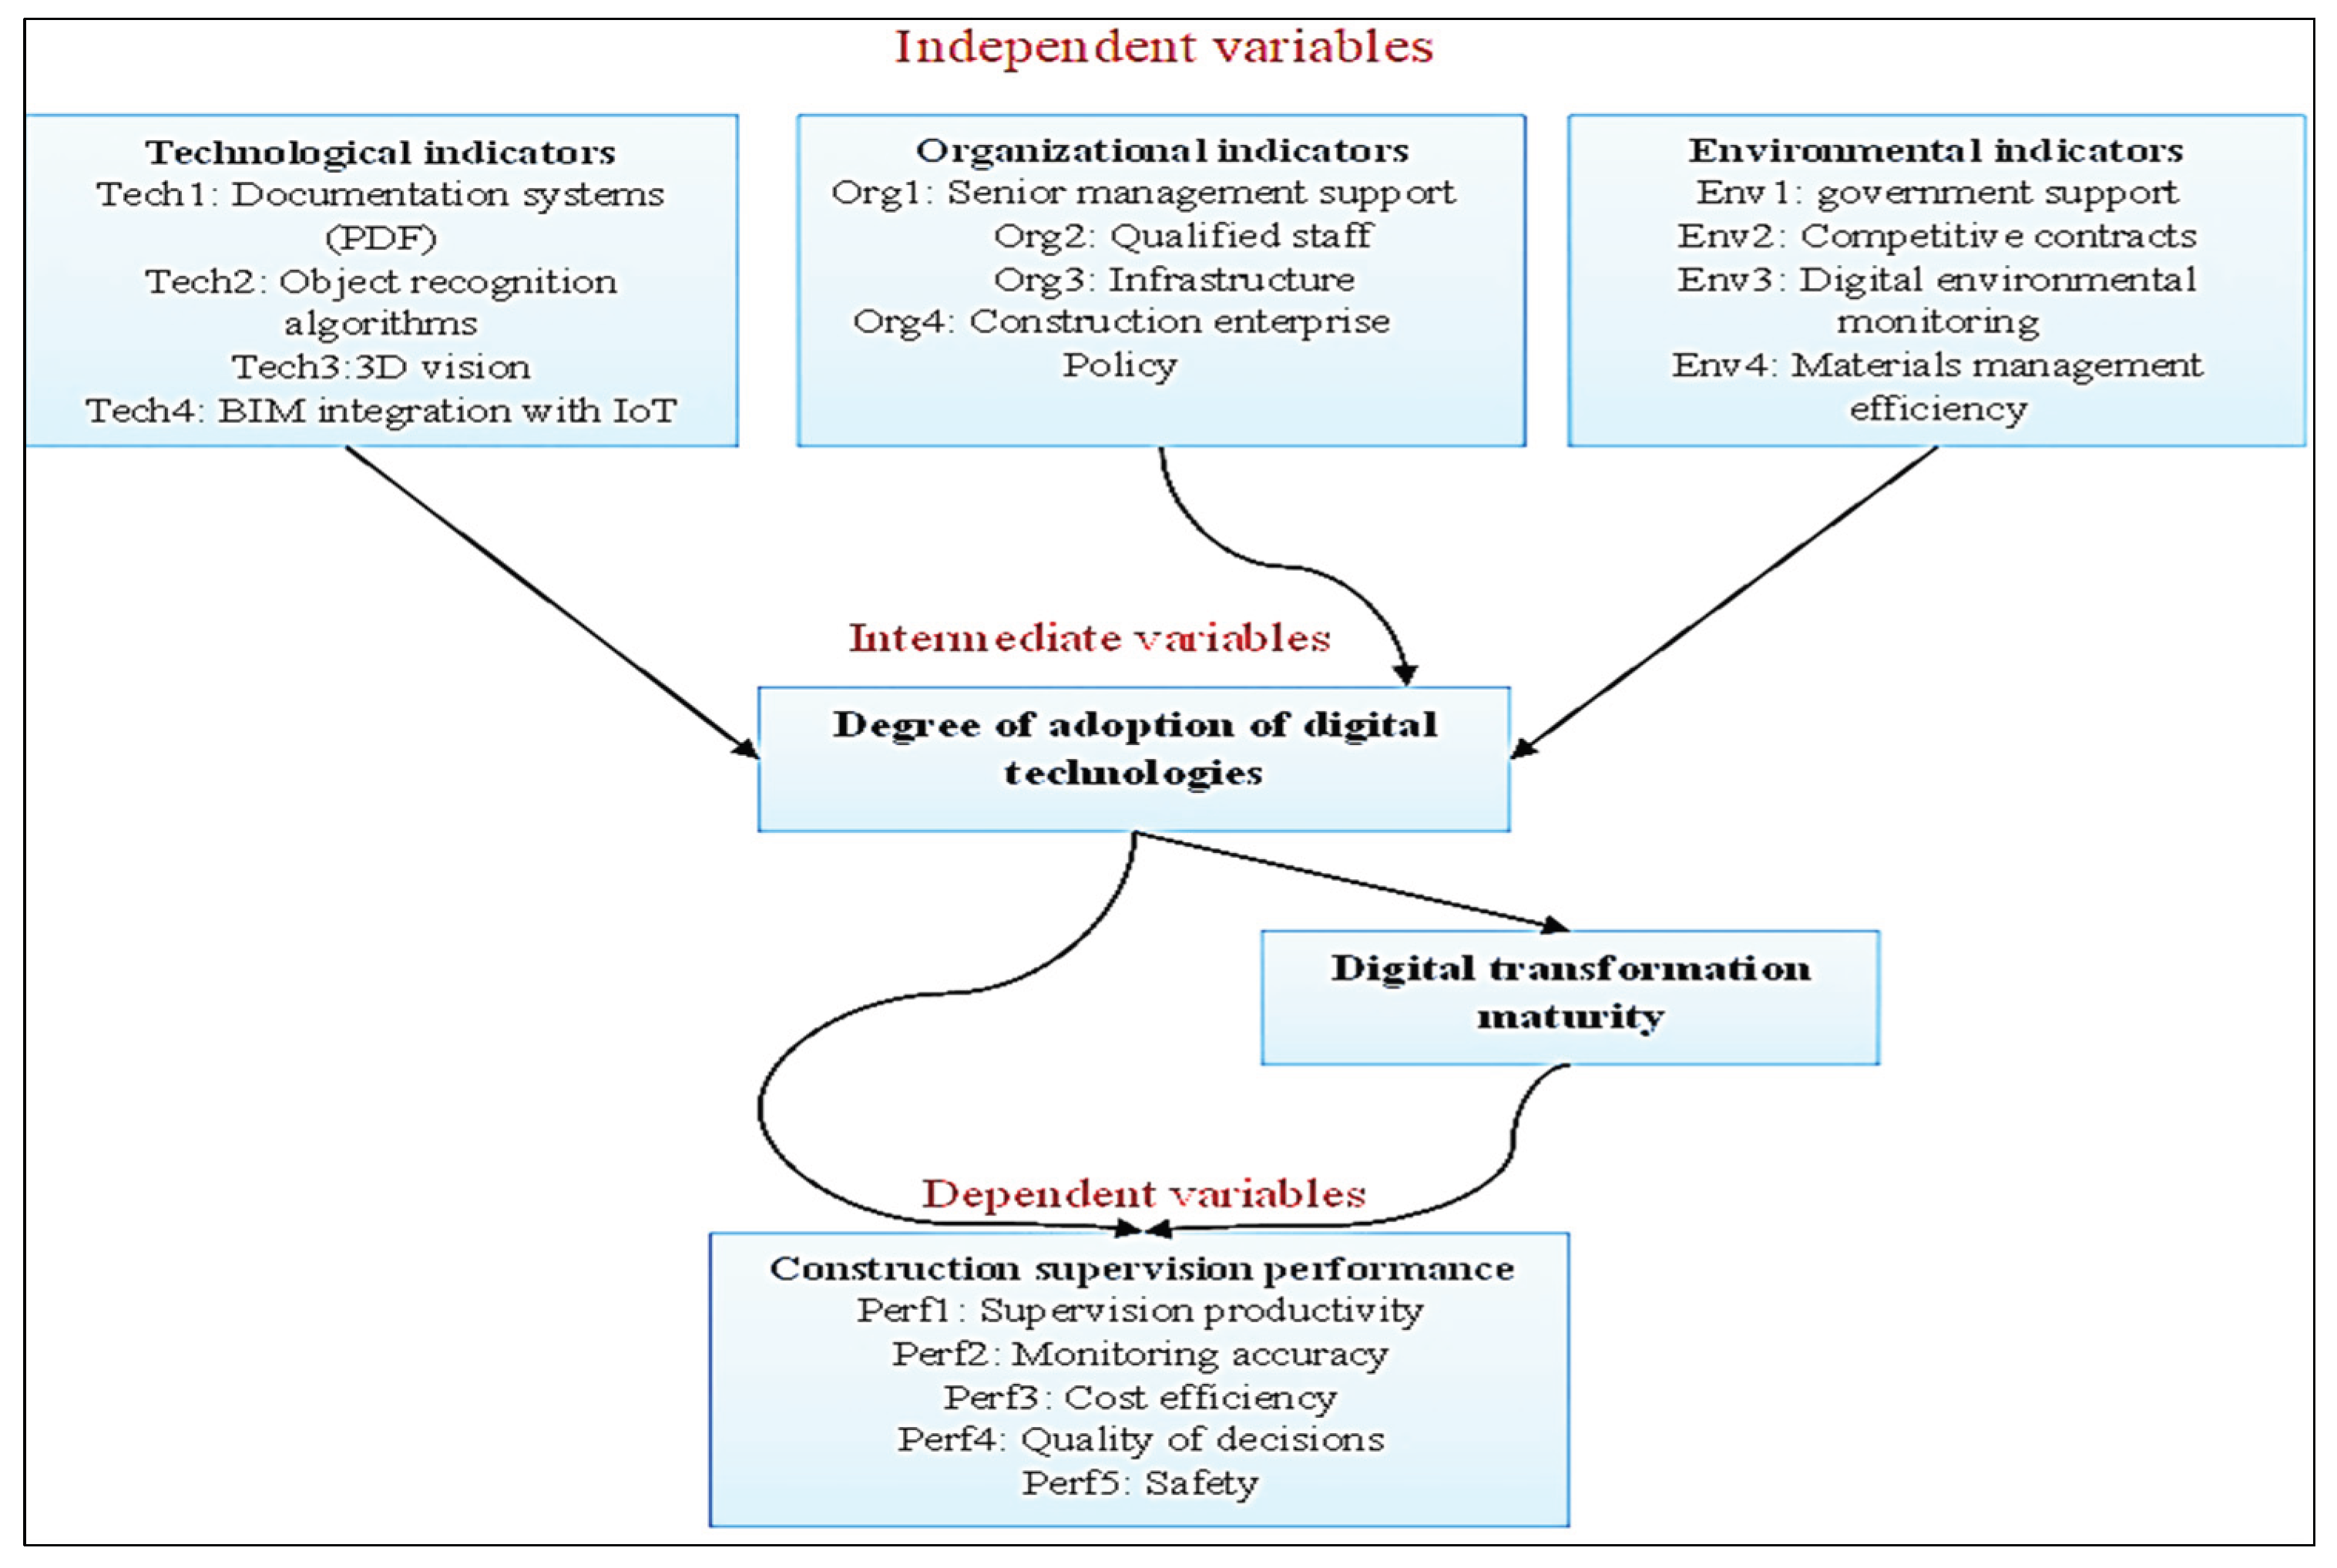
The proposed structural model for this study, which is based on the applied studies framework, consists of three groups of indicators: indicators of the digital transformation process (independent variables), indicators measuring the impact of the digital transformation process on the performance of the construction supervision process (dependent variables), and two latent (mediating) variables: degree of digital technology use and digital transformation maturity. see the Figure below [2,15,20,21]:
Figure 1.
Study model.
Smart PLS is the most popular software for implementing PLS-SEM in construction management research. The software includes a suite of tools that enable researchers to build measurement models, evaluate model quality using multiple indicators, and test causal relationships by estimating path coefficients [22,23].
Based on the key variables and expected relationship between the indicators, a questionnaire using the five-point Likert scale was created as the main data collection and measurement tool, as displayed in Table 2. The questionnaire was sent to a sample of engineers, supervisors, project managers and construction industry experts to examine the impact of technological, organizational and environmental digital transformation indicators on the performance of construction supervision in construction projects.
Once all the questionnaires were completed, then the data were analyzed, and the measurement model was tested using Smart PLS software, as shown in Figure 2. Assessment of the model’s internal consistency reliability, convergent and discriminant validity will be measured [24,25,26].
Based on the proposed model, the following hypotheses can be formulated:
H1: The degree of digital technology adoption (DoT) is positively related to technological indicators (TIs) which improves the performance of supervision.
H2: The organizational indicators have positive effects on the Degree of Digital Technology (DoT) and the latter positively contributes to the improvement of supervision performance. The higher the degree of digital technology adoption (DoT).
H3: The higher the performance of supervision will be, and the environmental indicators will have a positive effect on the degree of digital technology adoption (DoT).
H4: The extent of digital technology adoption (DoT) is positively related to technological indicators, and this positively contributes to the maturity of digital transformation (DoM).
H5: Organizational indicators contribute to digital transformation (DoM) maturity in a positive way with respect to digital technology adoption (DoT).
H6: Environmental indicators have positive impact on digital technology adoption (DoT) which in turn positively impacts digital transformation maturity (DoM).
From the perspective of “reliability and dependability,” the study indicators are assessed [27]. While reliability demonstrates the correctness of the scale in representing the phenomena under investigation, dependability refers to the degree to which the measurement may provide comparable findings over repeated testing; hence, it illustrates the measurement sequence. To evaluate the proposed measurement model and its parameters, the Smart-PLS 4 software was used, as shown in Table 3. Additionally, the structural model was investigated by estimating path coefficients for determining the direction and strength of the relationships between the study variables. t-values and p-values were used to determine the significance of these relationships. In addition, the coefficient of determination (R²) was computed to determine the ability of the model to explain variance, and the ability of the predictor variables to explain the variance of the endogenous variables. [28,29,30].
Structural Equation Modeling (SEM) using the software SmartPLS is an advanced statistical method that can model and analyze complex causal relationships between independent variables (digital adoption factors) and dependent variables (supervision performance outcomes) in the context of digital transformation in construction projects [33,34]. These relationships are represented, ranging from conceptual models to mathematical equations and graphs [35].
7. Results
Digital technologies automate repetitive tasks, like measurement, which are otherwise performed by hand. Reduce human error, document, and have an up-to-the-minute view of project status. These features translate directly into actual better supervision, productivity and quality of supervision deliverables.
To determine the appropriate sample size in this study, several equations are used depending on the type of study, the population, and the variables. Equation 1 was used to find the sample size of the respondents with a 95% confidence level and a 50% expected percentage, resulting in a margin of error of 5%, which is appropriate for the exploratory nature of the study.
where:
n: sample size
Z: degree of confidence; for instance, 1.96, and 1.645 stand for 95%, and 90% confidence, respectively.
p: The coefficient of variance among the target sample’s components (Its value is often taken 0.5)
ε: The greatest estimate error, that can range from 8 to 9%.
A total number of 150 surveys were given out. Nine surveys were removed for inaccurate completion, leaving 141 participant questionnaires used in the study. Table 4 displays the demographic characteristics and dispersion of the study sample (respondents).
The values of the arrows in Figure 3 represent the outer loadings that show the association between the latent variables and their observed variables. These loadings are also referred to as indicator reliability. A good indicator would have an outer loading of 0.7 or higher, which means that it has a substantial contribution to the construct. The outer loading is a measure of the relationship between the measured indicators and a latent variable. In this type of models, it is assumed that changes in the observed variables are explained by changes in the latent variables, which is why the arrows in the model go from the latent constructs to the observed constructs. For example, a loading p-value of 0.708 or higher means that the indicator has for example more than 50% of the variance explained by the latent construct (0.708 squared is approximately 0,5), and is therefore considered excellent.
However, if the external load of the variables is between 0.40 and 0.70, it should be removed because it affects the values of the external factors in the measurement model (Cronbach’s alpha coefficient, composite reliability, extracted mean variance). It can be retained if it does not impact the parameters.
As mentioned previously, in Table 5 there is one external load for an indicator (material management efficiency) with a value less than 0.7 (less than the specified standard), although the Cronbach’s coefficient and the reliability coefficient are not affected, but there are other values and coefficients that may be affected, and therefore it is excluded.
After excluding the indicator with a value of less than 0.7, improving the model, and then retesting the model, Figure 4 shows that the model for the impact of digital transformation indicators on the performance of supervision in the construction project meets the required criteria.
Eliminating indicators with factor loadings less than 0.7 is a fundamental methodological step in improving the quality of structural equation models using Smart-PLS. This process aims to:
- Improve the reliability of the internal consistency of the underlying variables.
- Improve convergent validity (AVE) by making at least two indicators for each latent construct explain over 50% of the variance.
- Reduce measurement error, leading to more accurate estimates of structural relationships.
- Achieve a more compact and reliable model with fewer indicators.
After eliminating indicators with low loads, the values of reliability indicators are expected to increase, especially for groups from which indicators with low loads have been removed (Table 6).
The discrimination is validated. This measure aims to ensure that the measure (the underlying variable) is strongly correlated with its own indices compared to its correlations with the indices of any other measure in the model. Table 7 shows that all variables have reached higher individual values.
It is noteworthy that the value (1.000) in the first column is greater than the other correlations in its rows (0.554, 0.679, 0.328, 0.535, 0.705) and so on for the remaining columns for the other variables, therefore the results are acceptable. This means that these variables are characterized by a lack of overlap with the other variables, which confirms the validity of distinguishing between them.
8. Discussion
The results of the bootstrapping procedure for Estimating the T-statistic for all levels of variables are presented in Table 8. Bootstrapping is a non-parametric approach that is employed to evaluate the statistical significance of relationships between variables in structural equation modeling. The t-values for the path coefficients for the hypothesized relationships for all constructs are identified. Furthermore, p-values should be less than the predetermined significance levels, generally 0.05 or 0.01, to establish statistical significance.
The results show that technological indicators (such as documentation system,3D Vision, object recognition algorithms, and BIM integration with IoT) have the strongest impact on the success of digital transformation. This can be explained by the fact that the availability of the appropriate technological infrastructure is a prerequisite for any digital transformation. Without reliable and scalable tools, organizations will be unable to effectively collect and analyze data, hindering their ability to realize the benefits of digital transformation for building management.
Organizational indicators ranked second in terms of impact, confirming that the mere availability of digital technologies is insufficient to guarantee successful transformation. Digital infrastructure alone is not enough for successful project supervision performance; rather, the policies and implementation of digital technologies by construction organizations, along with support for sensor management, are the most critical factors. This also includes workforce training and incentives to ensure widespread and sustainable adoption of new construction supervision technologies.
While environmental indicators were the third most significant indicator, they are still important for the success of Digital transformation in building management. Government support plays a crucial role in driving digital. A paradigm shift in managing construction. In addition, digital environmental monitoring and competitive tool development. In addition, digital environmental monitoring and the development of environmental monitoring tools. contracts which encourage the organization to use new technologies to stay competitive; factors to watch for that will affect the digital transformation process and the performance of Supervision in construction projects.
The coefficient of determination (R²) was calculated, which is a statistical measure that shows the proportion of variance (difference) in the dependent variable (result of supervisory performance) that can be explained by the independent variables (technological indicators, organizational indicators and environmental indicators) were entered into the regression model.
Where its value was (0.652) This explains that the independent variables (technological, organizational and environmental) explain about 65.2% of the changes in supervisory performance, while 34.8% of the changes in supervisory performance are due to other factors not included in the model. Table 9 shows that the value of R² = 0.652 is considered a strong and acceptable result in this field of research compared to other studies.
This value is classified as a “strong” explanatory power according to the standards adopted in the PLS-SEM literature, and is considered a good result in the context of behavioral and organizational studies in the construction sector.”
9. Conclusions
The Structural Equation Model (SEM) is a powerful methodological tool for assessing the impact of digital transformation on construction supervision in construction projects. Previous studies have explored a variety of SEM applications, ranging from assessing supervisory productivity, to analyzing critical success factors for digital twins, to developing indicators for measuring digital transformation maturity and pre-construction readiness.
Cronbach’s alpha values for every variable in this model are more than 0.7 (Table 4,5), indicating a high degree of questionnaire validity. The questionnaire’s strong reliability is demonstrated by the CR, which shows the overall dependability of variables at all levels and surpasses the necessary value of 0.7 to meet these criteria. AVE is a representation of the average variance of variable extraction over all phases. Because the AVE values in Table 4,5 are higher than the essential value of 0.5, they demonstrate that the questionnaire satisfies the pertinent statistical requirements.
The PLS-SEM analysis results showed that the coefficient of determination (R²) for the dependent variable ‘construction supervision performance’ was 0.652, indicating that the proposed model explains approximately 65.2% of the total variance. This value is classified as a strong explanatory power according to the criteria adopted in the construction management literature, and it is consistent with the best results achieved by similar models in the construction sector.
Causal relationships can be quantified using path coefficients (β), and the study demonstrated a positive impact of adopting digital technologies on construction supervision performance in construction projects. Technological indicators are the most influential on the success factors of digital transformation, followed by organizational and then environmental indicators. Adopting digital technologies alone is not enough; it must be supported by technological, organizational, leadership and contextual factors to achieve the desired results in supervision.
One of the most significant limitations of this study is related to the nature of the statistical method used (PLS-SEM) and its theoretical assumptions, such as the generalizability of the results (the data used reflects the perceptions and opinions of participants at a specific time and place; results drawn from a sample in a particular country (such as Iraq or Saudi Arabia) may not necessarily apply to other contexts with different economic, cultural, or organizational conditions). There is also the potential for personal bias in responses (the survey data relies on participants’ self-reported assessments, which may be influenced by personal biases, such as overestimating performance or underestimating the impact of the studied indicators). Furthermore, there are limitations related to the nature of the construction and supervision sector, such as the difficulty of generalizing the results to all projects (construction projects vary greatly in size (large/small), type (residential/infrastructure/industrial), and method of execution). Additional limitations relate to human factors and practical application, among others.
Based on the analysis of the results, the following conclusions can be drawn:
1. Technological indicators have the greatest impact on the success of digital transformation in construction supervision, followed by organizational indicators and environmental indicators.
2. The availability of digital technologies alone is not enough to ensure better supervision performance; they need to be enabled by good policies and proper implementation.
3. Senior management support, government support, development of documentation systems, and integration of BIM systems are the main factors for the success of digital transformation in the construction sector.
4. The maturity of digital transformation is an important mediating factor between the TOE indicators and tangible improvements in the supervision performance.
Based on the study, recommendations can be given to construction companies about the development of digital transformation and its influence on the performance of the supervisors in construction works:
1. Balanced Investment: Policy development and human capacity building must go hand in hand with construction companies’ investment in technological infrastructure.
2. Prioritizing Technological Factors: Given the importance of technological indicators, it is advisable to begin by developing the technological infrastructure (data quality, scalability, and technical integration) before moving on to other aspects.
3. Human capacity building: Budget should be provided to train and build digital skills of supervisors and engineers, and incentives should be provided for the introduction of new technology.
4. Governance Frameworks: Creating clear regulations and rules to regulate the use of digital technologies, including data quality and information security standards.
5. Building Partnerships with Government Entities: Partnering with Government to maximize use of existing partnership support and incentive programs for digital transformation.
6. Replication of the study in other geographical settings: To validate the results by replicating the study in other organizational and economic settings
7. Conducting longitudinal studies: to monitor the relationship between the TOE indicators and supervisory performance over several levels in digital transformation.
8. Incorporating the ability to parameterize the model: for example, organizational size, project type, technological development level in the region.
9. Investigating the interactions between the three indicators, the focus is not on the influence of a single indicator, but on the interaction between three indicators, which will be explored in future research.
References
- Mitra, A.; Mulville, M. A Scoping Review of Digital Technologies Used for Automating Onsite Construction Inspection: Applications and Future Direction. Proceedings of Digital Frontiers in Buildings and Infrastructure International Conference Series, 2025, August; pp. 136–157. [Google Scholar]
- Kim, D.H.; Yoo, W.S.; Son, J.W.; Jung, W.Y.; Lee, J.S.; Kang, S.M. Optimization of Digital Construction Supervision Systems through Field Practitioner Usability Evaluation and Gap Analysis. Adv. Sci. Technol. 2026, 173, 183–188. [Google Scholar] [CrossRef]
- Qadri, F.H.; Sharif, M.; Muddassir, S.M. Risk prediction for mega construction prediction: a concise review. Sustain. Resilient Infrastruct. 2025, 1–20. [Google Scholar] [CrossRef]
- Kjellmark, G.; Hjelseth, E.; Penaloza, G.A.; Riemer-Sørensen, S. Toward Construction 5.0: Bridging AI and People through Continuous Learning. J. Constr. Eng. Manag. 2026, 152(1), 04025227. [Google Scholar] [CrossRef]
- Padala, S.P. A bibliometric review of digital twin-enabled technologies for construction project monitoring and control. Built Environ. Proj. Asset Manag. 1–20. [CrossRef]
- Chen, J.-H.; Chen, C.-H. Integration of BIM and LiDAR for digital twin analysis in large-scale construction projects. SPIE Smart Structures and NDE Conference, Canada, 2026. [Google Scholar]
- Wahba, D.; Omran, A.A.; Adly, A.; Gad, A.; Arman, H.; El-Bagoury, H. Optimizing site selection for construction: integrating GIS modeling, geophysical, geotechnical, and Geomorphological data using the analytic hierarchy process. ISPRS Int. J. Geo-Inf. 2024, 14(1), 3. [Google Scholar] [CrossRef]
- Strzałkowski, P.; Bęś, P.; Szóstak, M.; Napiórkowski, M. Application of virtual reality (VR) technology in mining and civil engineering. Sustainability 2024, 16(6), 2239. [Google Scholar] [CrossRef]
- Zoleykani, M.J.; Abbasianjahromi, H. Integrating AR and 4D-BIM for dynamic hazard management in construction projects. Int. J. Constr. Manag. 2025, 1–25. [Google Scholar] [CrossRef]
- Berlato, M.; Binni, L.; Durmus, D.; Gatto, C.; Giusti, L.; Massari, A.; Toldo, B.M.; Cascone, S.; Mirarchi, C. Digital platforms for the built environment: A systematic review across sectors and scales. Buildings 2025, 15(14), 2432. [Google Scholar] [CrossRef]
- Hou, Y.; Elwakil, E. Advancing Smart Construction Management: A Comprehensive Analysis of Digital Twin Applications and Challenges. J. Struct. Des. Constr. Pract. 2026, 31(2). [Google Scholar] [CrossRef]
- Abdulqader, M.; Alias, A. H. B.; Haron, N. A.; Zuhri, M. Y. M. DT, BIM, and IoTs Contributions and Barriers in Construction PM: A PRISMA. Paradigm 2025, 12. [Google Scholar]
- Mitra, A.; Mulville, M. A Scoping Review of Digital Technologies Used for Automating Onsite Construction Inspection: Applications and Future Direction. Proceedings of Digital Frontiers in Buildings and Infrastructure International Conference Series, 2025, August; pp. 136–157. [Google Scholar]
- Kim, D.H.; Park, C.H.; Yoo, W.S.; Kang, S.M. Structural Equation Model (SEM)-Based Productivity Evaluation for Digitalization of Construction Supervision. Buildings 2025, 15(23), 4380. [Google Scholar] [CrossRef]
- Alqahtani, F.; et al. Exploring Critical Success Factors of AI-Integrated Digital Twins on Saudi Construction Project Deliverables: A PLS-SEM Approach. Buildings 2025, 15(19), 3543. [Google Scholar] [CrossRef]
- Naji, K.K.; Gunduz, M.; Al-Hababi, H. Mapping the Digital Transformation Maturity of the Building Construction Industry Using Structural Equation Modeling. Buildings 2024, 14(9), 2786. [Google Scholar] [CrossRef]
- Okanlawon, T.; Oyewobi, L.; Dauda, J.; Ogunjimi, O.; Bello, A.; Jimoh, R. Modeling the Effect of Integrating Augmented Reality on Construction Lifecycle in Nigeria Using Partial Least Square Structural Equation Modelling (PLS-SEM). Smart and Sustainable Built Environment 2025. [Google Scholar] [CrossRef]
- Kumar, H.N.; Padala, S.P.S. A PLS-SEM based framework for enabling digital twin systems for real-time monitoring and control in construction projects. Constr. Innov. Inf. Process Manag. 2026, ahead-of-print. [Google Scholar] [CrossRef]
- Alsaffar, A.; Beach, T.; Rezgui, Y. Enhancing asset management: Integrating digital twins for continuous permitting and compliance - A systematic literature review. J. Build. Eng. 2024, 99, 111515. [Google Scholar] [CrossRef]
- You, Z. Intelligent construction: unlocking opportunities for the digital transformation of China’s construction industry. Eng. Constr. Archit. Manag. 2024, 31(4), 1429–1453. [Google Scholar] [CrossRef]
- Yin, K.; Miao, Y.; Huang, C. Environmental regulation, technological innovation, and industrial structure upgrading. Energy Environ. 2024, 35(1), 207–227. [Google Scholar] [CrossRef]
- Batra, S. Exploring the application of PLS-SEM in construction management research: a bibliometric and meta-analysis approach. Eng. Constr. Archit. Manag. 2025, 32(4), 2697–2727. [Google Scholar] [CrossRef]
- Abdel-Tawab, M.; Kineber, A.F.; Chileshe, N.; Abanda, H.; Ali, A.H.; Almukhtar, A. Building information modelling implementation model for sustainable building projects in developing countries: a PLS-SEM approach. Sustainability 2023, 15(12), 9242. [Google Scholar] [CrossRef]
- Cefis, M.; Angelelli, M.; Carpita, M.; Ciavolino, E. Detecting causal relations among indicators with the CTA test: simulations and applications. Soc. Indic. Res. 2025, 178(1), 393–417. [Google Scholar] [CrossRef]
- Hair, J.F.; Babin, B.J.; Ringle, C.M.; Sarstedt, M.; Becker, J.M. Covariance-based structural equation modeling (CB-SEM): a SmartPLS 4 software tutorial: JF Hair et al. 2025.
- Margalina, V.M.; Kreienbaum, C.; Hair, J.F.; Becker, J.M.; Ringle, C.M. Multiple linear and logistic regression analysis: a SmartPLS 4 software tutorial. J. Mark. Anal. 2026, 1–18. [Google Scholar] [CrossRef]
- Shi, L.; Huang, K.; Liu, Y.; Ge, F.; Liu, S. Risk Assessment in Supplier Selection for Intelligent Manufacturing Systems Based on PLS-SEM. Appl. Sci. 2022, 12(8), 3998. [Google Scholar] [CrossRef]
- Purwanto, A. Partial least squares structural squation modeling (PLS-SEM) analysis for social and management research: a literature review. J. Ind. Eng. Manag. Res. 2021. [Google Scholar]
- Kamis, A.; Saibon, R.A.; Yunus, F.; Rahim, M.B.; Herrera, L.M.; Montenegro, P. The SmartPLS analyzes approach in validity and reliability of graduate marketability instrument. Soc. Psychol. Educ. 2020, 57(8), 987–1001. [Google Scholar]
- Gamil, Y.; Abd Rahman, I. Studying the relationship between causes and effects of poor communication in construction projects using PLS-SEM approach. J. Facil. Manag. 2023, 21(1), 102–148. [Google Scholar] [CrossRef]
- Lapidus, A.; Abramov, I.; Kuzmina, T.; Abramova, A.; AlZaidi, Z.A.K. Sustainable Activity of Construction Companies under the Influence of Destabilizing Factors on the Duration of Implementation of Investment-Construction Projects. Buildings 2023, 13, 2696. [Google Scholar] [CrossRef]
- Takyi-Annan, G.E.; Zhang, H. Assessing the impact of overcoming BIM implementation barriers on BIM usage frequency and circular economy in the project lifecycle using Partial least Squares structural Equation modelling (PLS-SEM) analysis. Energy Build. 2023, 295, 113329. [Google Scholar] [CrossRef]
- Zhang, G.; Wang, T.; Wang, Y.; Zhang, S.; Lin, W.; Dou, Z.; Du, H. Study on the influencing factors of digital transformation of construction enterprises from the perspective of dual effects—A hybrid approach based on PLS-SEM and fsQCA. Sustainability 2023, 15(7), 6317. [Google Scholar] [CrossRef]
- Padala, S.P. A PLS-SEM based framework for enabling digital twin systems for real-time monitoring and control in construction projects. Constr. Innov. 1–32. [CrossRef]
- Zhang, G.; Wang, T.; Wang, Y.; Zhang, S.; Lin, W.; Dou, Z.; Du, H. Study on the Influencing Factors of Digital Transformation of Construction Enterprises from the Perspective of Dual Effects—A Hybrid Approach Based on PLS-SEM and fsQCA. Sustainability 2023, 15, 6317. [Google Scholar] [CrossRef]
- Rehman, M.A.; Alqahtani, D.A. The Catalyst of Culture: Unlocking Blockchain-Driven Digital Transformation in Saudi Construction. Buildings 2026, 16, 672. [Google Scholar] [CrossRef]
- Waqar, A.; Othman, I.; Radu, D.; Ali, Z.; Almujibah, H.; Hadzima-Nyarko, M.; Khan, M.B. Modeling the Relation between Building Information Modeling and the Success of Construction Projects: A Structural-Equation-Modeling Approach. Appl. Sci. 2023, 13, 9018. [Google Scholar] [CrossRef]
- AL-Zubaidi, E.D.A.; AlZaidi, Z.A.K. Integration of Building Information Modeling (BIM) and Lean Construction Methods: A Pathway to Improved Project Delivery. J. Eur. Des. Systèmes Autom. 2025, 58(3). [Google Scholar]
Figure 2.
Structural model of dependent, mediating, and independent variables in Smart PLS.
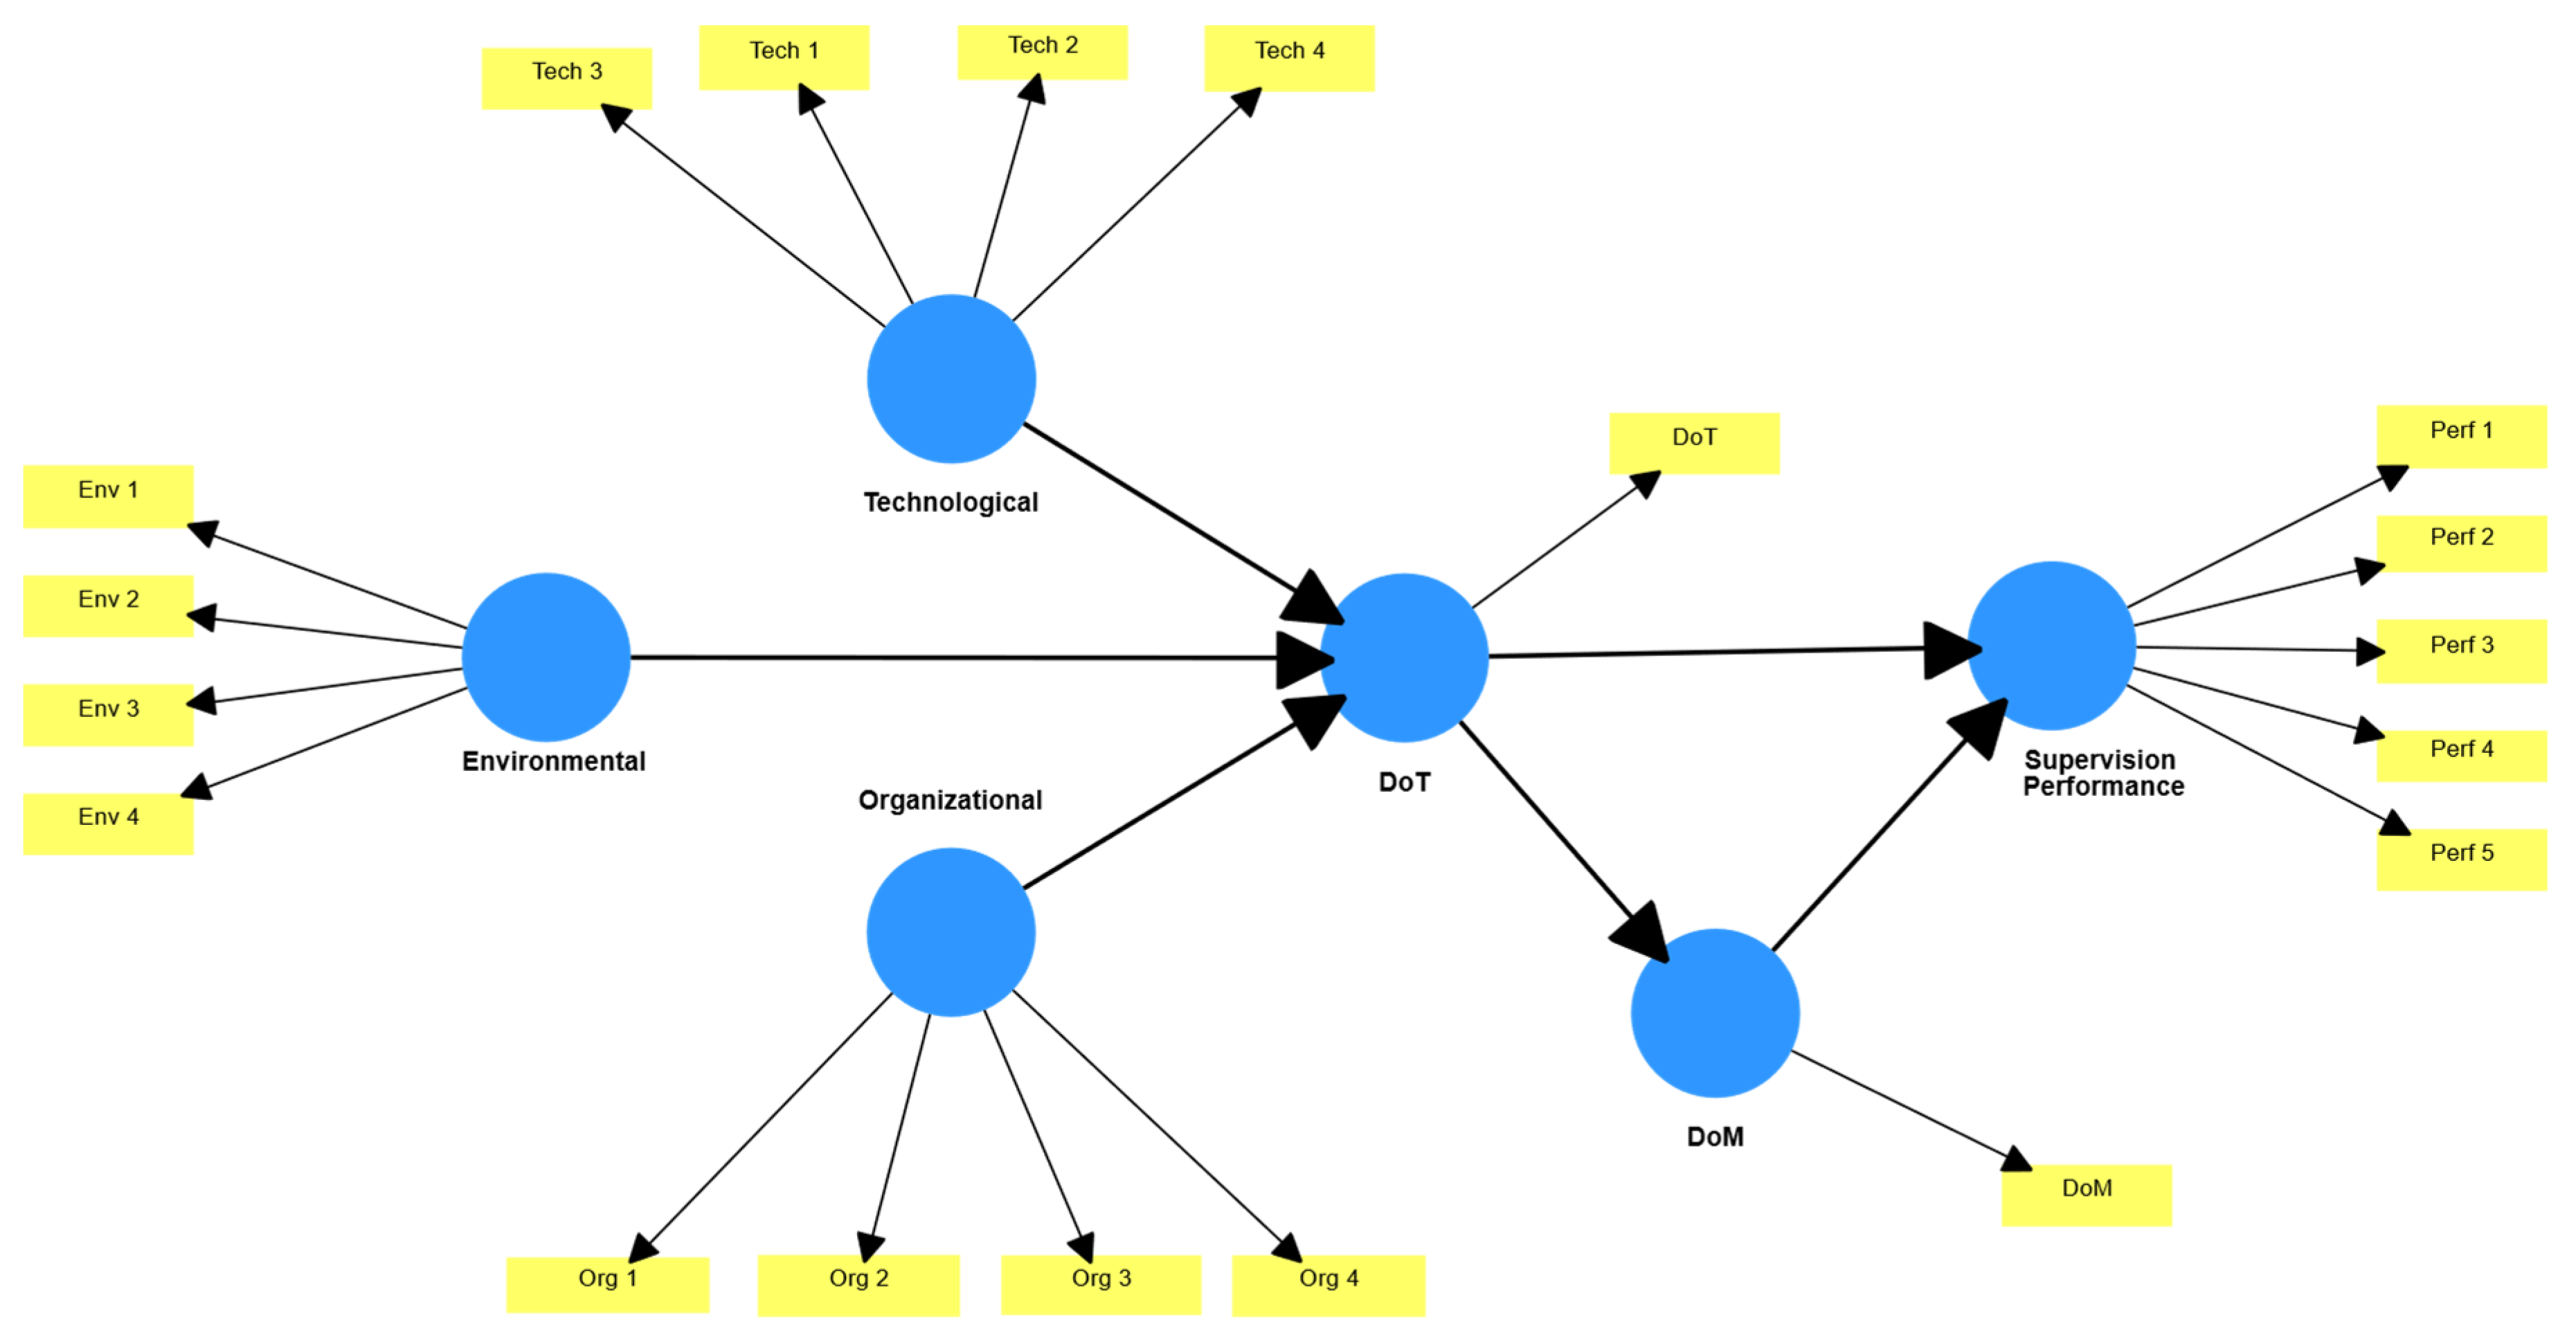
Figure 3.
Outcomes of the impact of digital transformation on supervisory performance in construction projects.
Figure 3.
Outcomes of the impact of digital transformation on supervisory performance in construction projects.
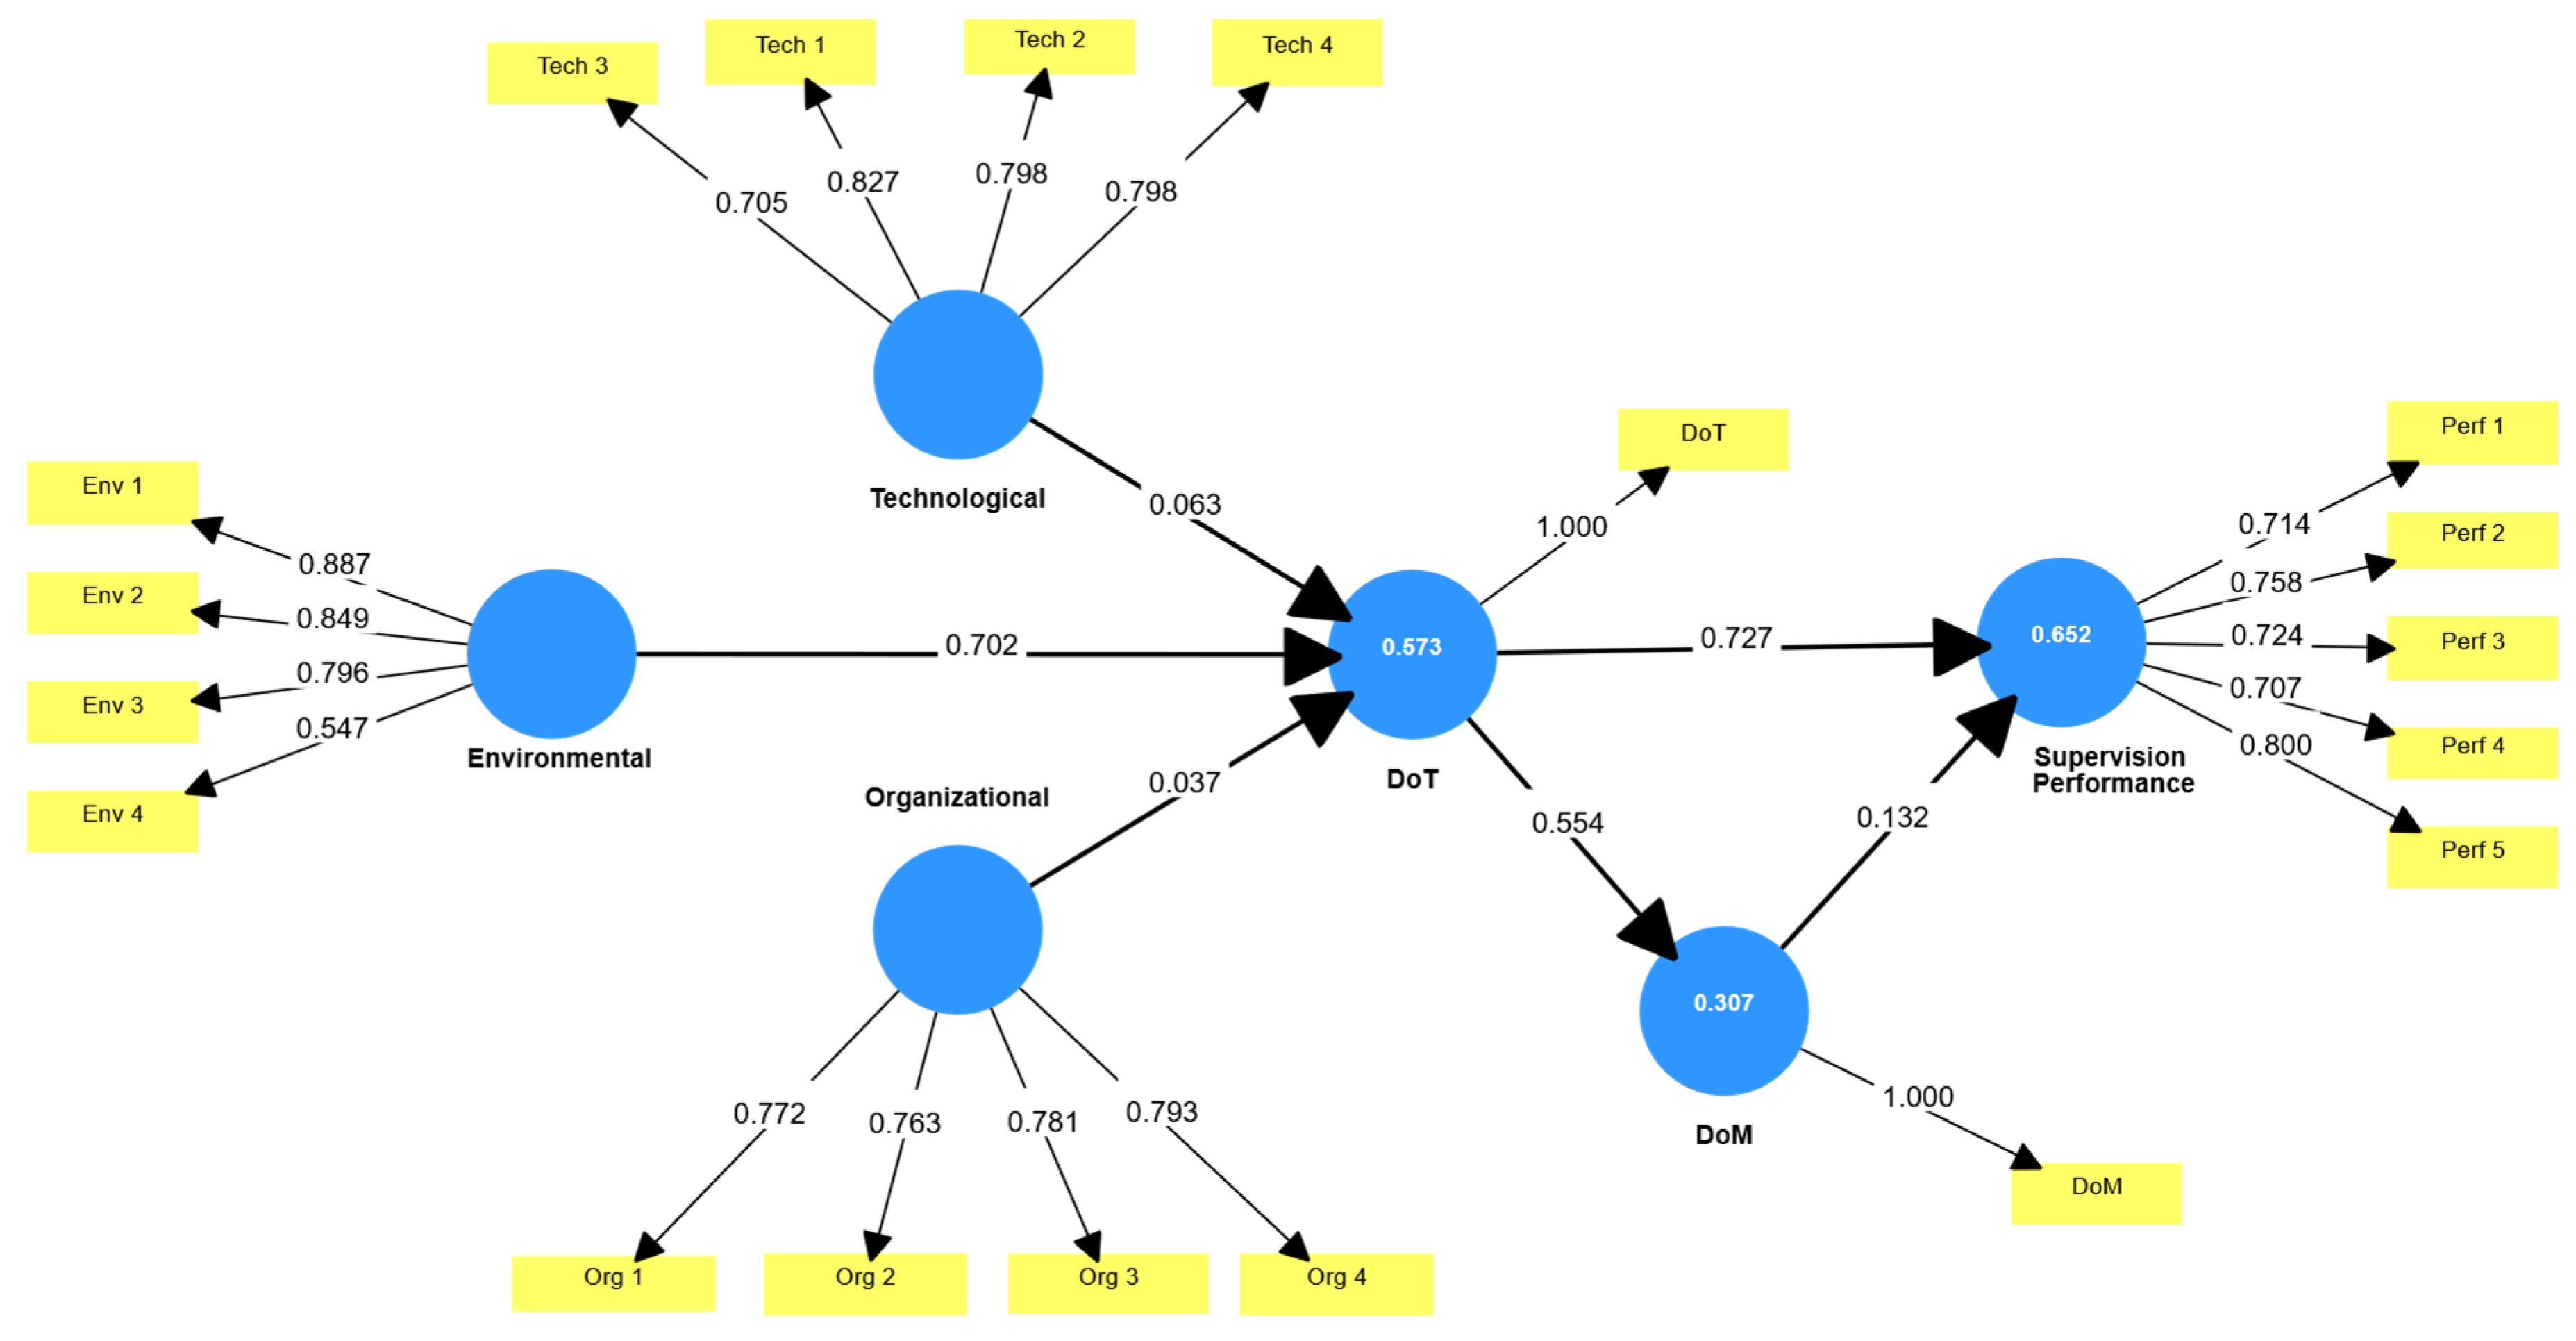
Figure 4.
Results from assessing the measuring model following adjustment.
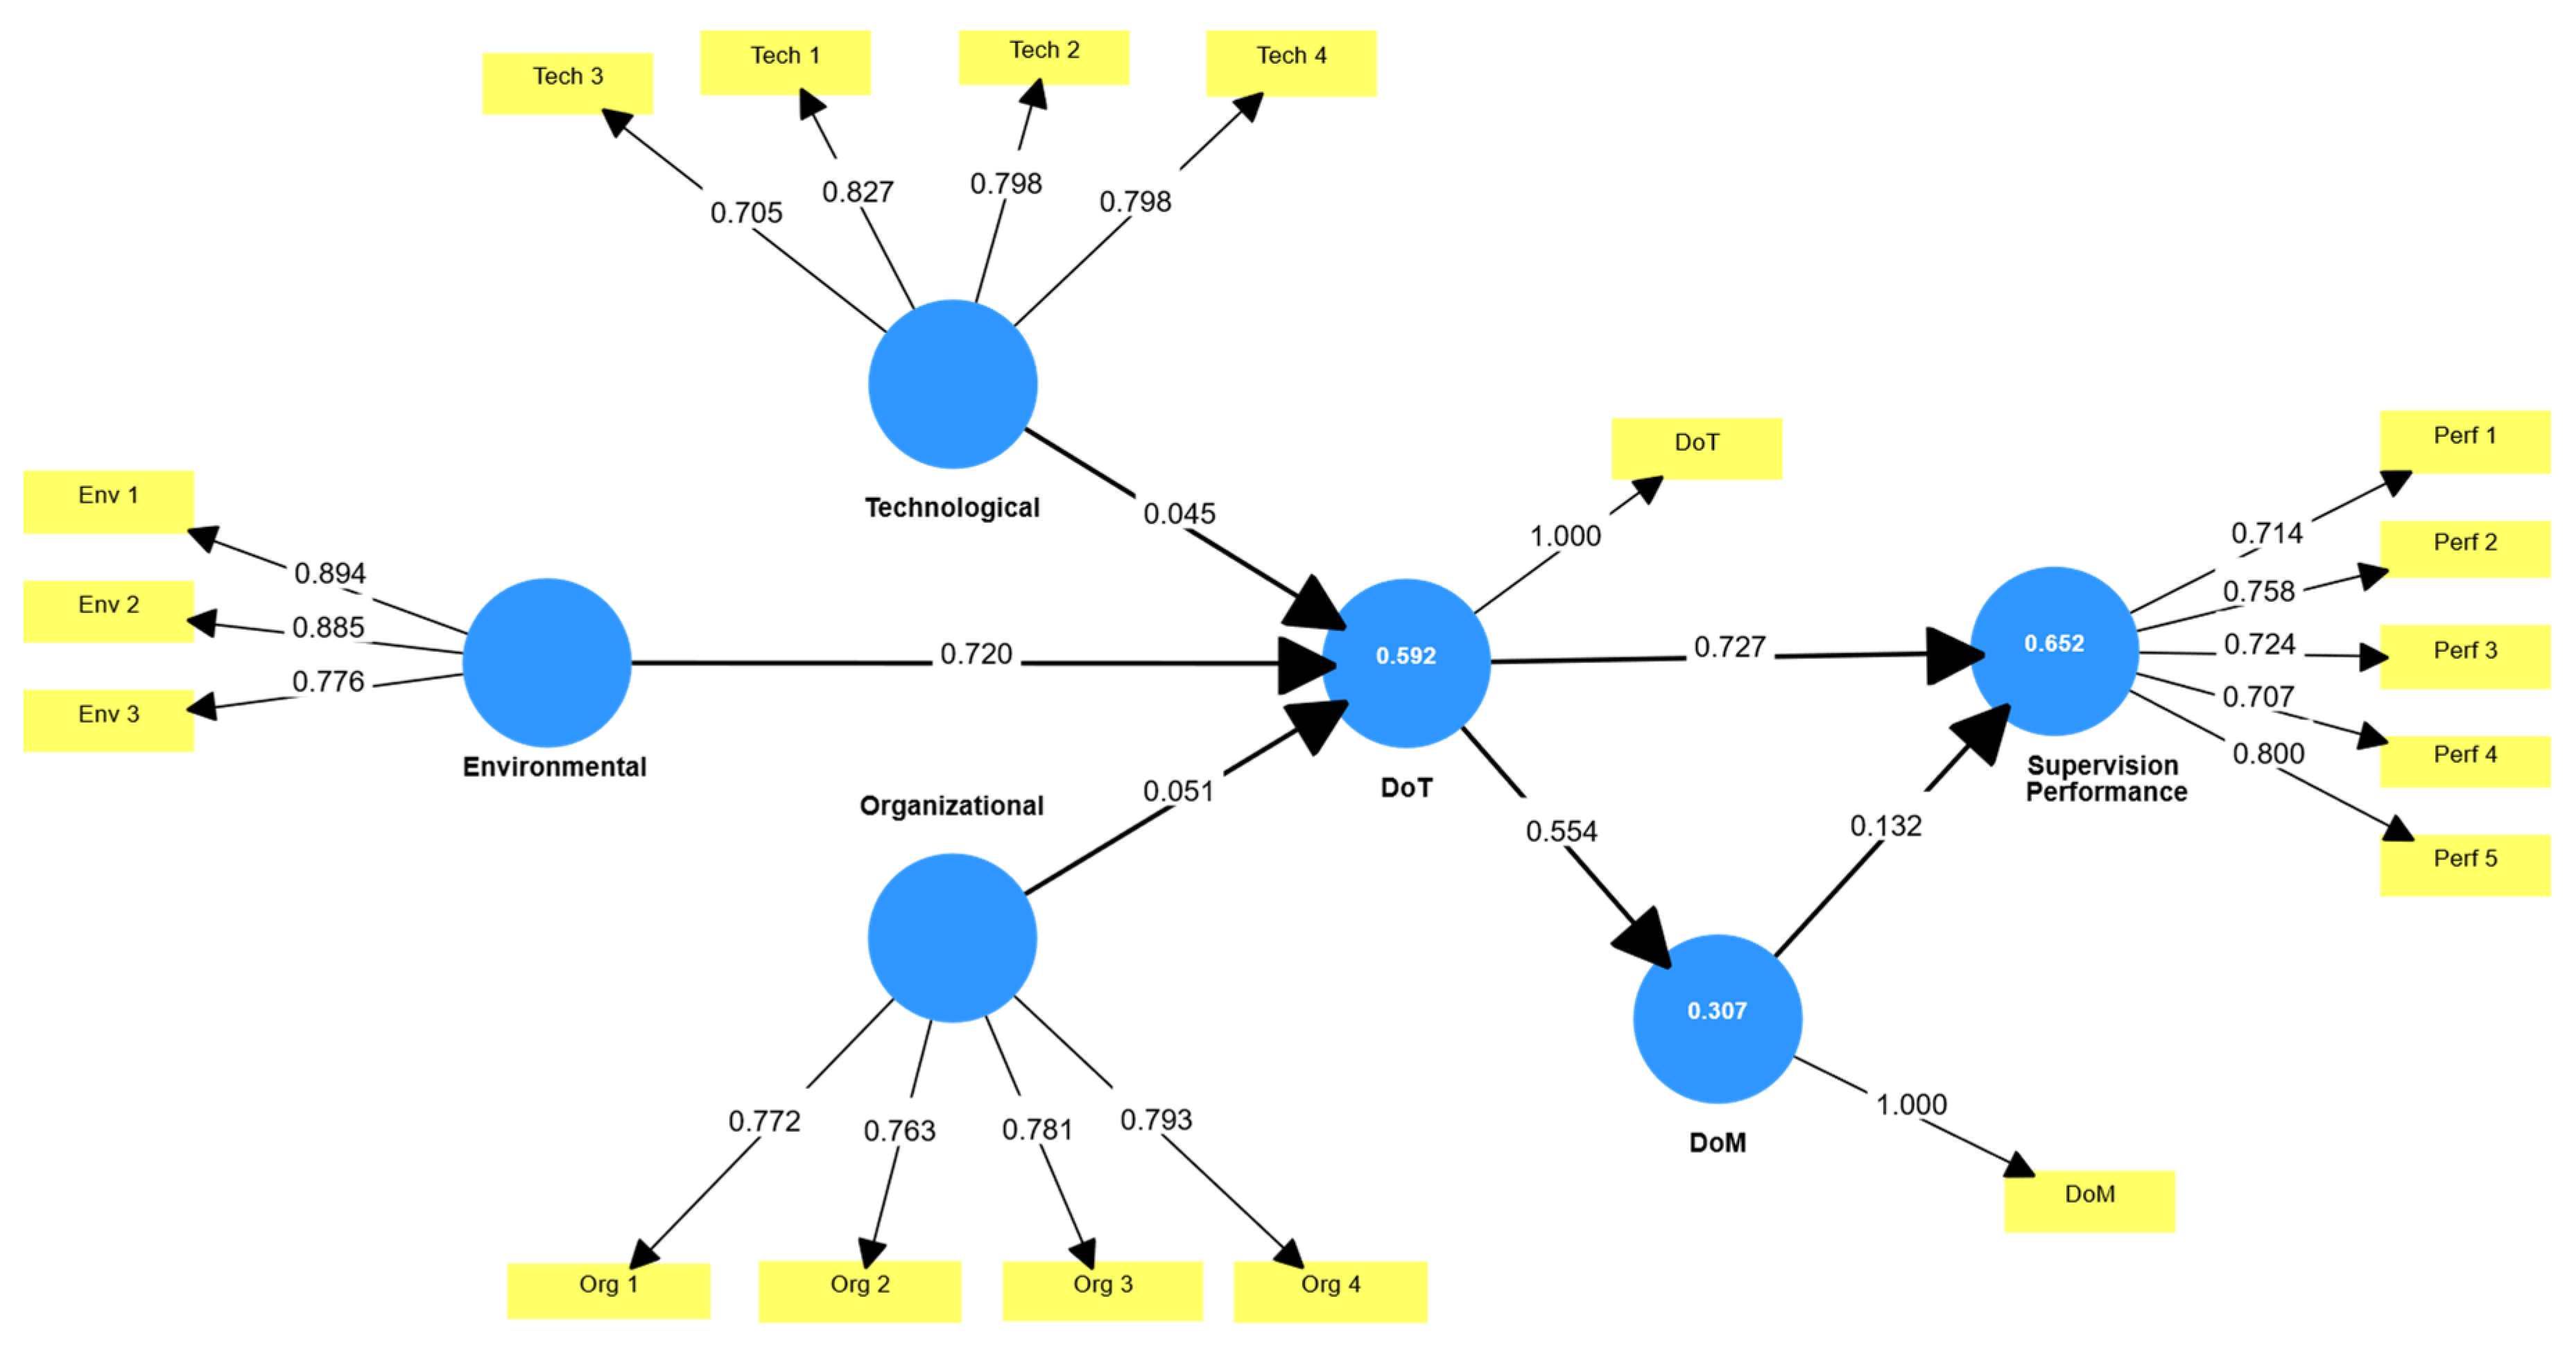

Table 1.
Digital transformation technology models.
| Table field | Key applications in supervision |
|---|---|
| Computer Vision | Visual comprehension, algorithms for monitoring labor, materials, equipment, and activities, visual analytics |
| Internet of Things (IoT) | Sensors, data transmission, edge devices, signal processing |
| Building Information Modeling (BIM) | Control, progress tracking, matching the implemented reality with the model |
| Machine learning | Data preparation, model training, forecasting and optimization, and immediate feedback. |
Table 2.
Five-point Likert Scale.
| Likert scale | 1 | 2 | 3 | 4 | 5 |
|---|---|---|---|---|---|
| Impact Degree | Minimal | Low | Moderate | High | Very High |
| Criteria. | Accepted limit | |
|---|---|---|
| 1 | Reliability of the internal dependability | Composite reliability ≥ 0.60, Cronbach alpha ≥0.70 |
| 2 | Items stability | Standard loading of the items ≥0.70 |
| 3 | Validity of the convergent | Average variance extracted (AVE) ≥0.50 |
| 4 | Validity of the discriminant | Outer Loading |
| (Correlation of variables - R2 - AVE) |
Table 4.
Demographic characteristics of the study sample.
| Demographic characteristics | Description of properties | Cumulative percentage % | Percentage % |
|---|---|---|---|
| Nature of work | Consultants | 54 | 38.3 |
| Contractors | 78 | 17 | |
| Investors | 103 | 17.7 | |
| Others | 141 | 27 | |
| Educational level | Secondary / Diploma | 19 | 13.5 |
| Bachelor’s Degree | 88 | 48.9 | |
| Master’s Degree | 121 | 23.4 | |
| Ph.D. | 141 | 14.2 | |
| Years of experience | 5–10 years | 32 | 22.7 |
| 11–15 years | 84 | 36.9 | |
| 16–25 years | 128 | 31.2 | |
| More than 25 | 141 | 9.2 |
Table 5.
Results of the Measurement Model Assessment of the impact of Digital Transformation Indicators on the performance of Construction Supervision.
Table 5.
Results of the Measurement Model Assessment of the impact of Digital Transformation Indicators on the performance of Construction Supervision.
| Items | Outer L0. | Cronbach Alpha > 0.7 | CR (rho_a) > 0.7 | CR (rho_a) > 0.7 | AVE > 0.5 |
|---|---|---|---|---|---|
| Tech 1 | 0.827 | 0.814 | 0.853 | 0.864 | 0.614 |
| Tech 2 | 0.798 | ||||
| Tech 3 | 0.705 | ||||
| Tech 4 | 0.798 | ||||
| Org 1 | 0.772 | 0.782 | 0.784 | 0.859 | 0.604 |
| Org 2 | 0.763 | ||||
| Org 3 | 0.781 | ||||
| Org 4 | 0.793 | ||||
| Env 1 | 0.887 | 0.785 | 0.838 | 0.859 | 0.610 |
| Env 2 | 0.849 | ||||
| Env 3 | 0.796 | ||||
| Env 4 | 0.547 | ||||
| DoT | 1 | - | - | - | - |
| DoM | 1 | - | - | - | - |
| Perf 1 | 0.714 | 0.860 | 0.889 | 0.859 | 0.550 |
| Perf 2 | 0.758 | ||||
| Perf 3 | 0.724 | ||||
| Perf 4 | 0.707 | ||||
| Perf 5 | 0.800 |
Table 6.
Results of the Adjusted Measurement Model Assessment of the impact of Digital Transformation Indicators on Supervisory Performance.
Table 6.
Results of the Adjusted Measurement Model Assessment of the impact of Digital Transformation Indicators on Supervisory Performance.
| Items | Outer Loading > 0.7 | Cronbach Alpha > 0.7 | CR (rho_a) > 0.7 | CR (rho_a) > 0.7 | AVE > 0.5 |
|---|---|---|---|---|---|
| Tech 1 | 0.827 | 0.814 | 0.853 | 0.864 | 0.614 |
| Tech 2 | 0.798 | ||||
| Tech 3 | 0.705 | ||||
| Tech 4 | 0.798 | ||||
| Org 1 | 0.772 | 0.782 | 0.784 | 0.859 | 0.604 |
| Org 2 | 0.763 | ||||
| Org 3 | 0.781 | ||||
| Org 4 | 0.793 | ||||
| Env 1 | 0.894 | 0.812 | 0.821 | 0.889 | 0.728 |
| Env 2 | 0.885 | ||||
| Env 3 | 0.776 | ||||
| DoT | 1 | - | - | - | - |
| DoM | 1 | - | - | - | - |
| Perf 1 | 0.714 | 0.860 | 0.889 | 0.859 | 0.550 |
| Perf 2 | 0.758 | ||||
| Perf 3 | 0.724 | ||||
| Perf 4 | 0.707 | ||||
| Perf 5 | 0.800 |
Table 7.
A matrix indicating the variables’ correlations.
| DoM | DoT | Environmental | Organizational | Supervision Performance | Technological | |
|---|---|---|---|---|---|---|
| DoM | 1.000 | |||||
| DoT | 0.554 | 1.000 | ||||
| Environmental | 0.679 | 0.753 | 0.781 | |||
| Organizational | 0.328 | 0.357 | 0.387 | 0.777 | ||
| Supervision _Performance | 0.535 | 0.800 | 0.663 | 0.736 | 0.741 | |
| Technological | 0.705 | 0.507 | 0.593 | 0.775 | 0.604 | 0.783 |
Table 8.
Path coefficients for all levels of variables.
| Original sample (O) | Standard deviation (STDEV) | T statistics (|O/STDEV|) | P values | Results | |
|---|---|---|---|---|---|
| Technological -> DoT -> Supervision Performance | 0.710 | 0.140 | 5.054 | 0.000 | Significant Accepting hypothesis H1 |
| Organizational -> DoT -> Supervision _Performance | -0.297 | 0.127 | 2.332 | 0.020 | Significant Accepting hypothesis H2 |
| Environmental -> DoT -> Supervision _Performance | 0.169 | 0.085 | 1.982 | 0.048 | Significant Accepting hypothesis H3 |
| Technological -> DoT -> DoM | 0.541 | 0.096 | 5.643 | 0.000 | Significant Accepting hypothesis H4 |
| Organizational -> DoT -> DoM | -0.226 | 0.100 | 2.275 | 0.023 | Significant Accepting hypothesis H5 |
| Environmental -> DoT -> DoM | 0.128 | 0.076 | 1.695 | 0.090 | Insignificant Rejecting hypothesis H6 |
Table 9.
Comparing the value () of the proposed model with some studies.
| Study | Subject of study | R2 | Rank |
|---|---|---|---|
| Alqahtani et al. (2026) [36] | Adopting blockchain technology in Saudi construction | 0.711 | Very strong |
| Alqahtani et al. (2025) [15] | Critical factors for AI-powered digital twins | 0.65 | Strong |
| Waqar et al. (2023) [37] | The relationship between the application of Building Information Modeling (BIM) and project success [38] | 0.52 | Moderate to strong |
| Proposed study | Digital transformation on construction supervision performance | 0.652 | Strong |
Disclaimer/Publisher’s Note: The statements, opinions and data contained in all publications are solely those of the individual author(s) and contributor(s) and not of MDPI and/or the editor(s). MDPI and/or the editor(s) disclaim responsibility for any injury to people or property resulting from any ideas, methods, instructions or products referred to in the content. |
© 2026 by the authors. Licensee MDPI, Basel, Switzerland. This article is an open access article distributed under the terms and conditions of the Creative Commons Attribution (CC BY) license (http://creativecommons.org/licenses/by/4.0/).
Copyright: This open access article is published under a Creative Commons CC BY 4.0 license, which permit the free download, distribution, and reuse, provided that the author and preprint are cited in any reuse.