

Submitted:
11 September 2026
Posted:
14 September 2026
You are already at the latest version
Abstract
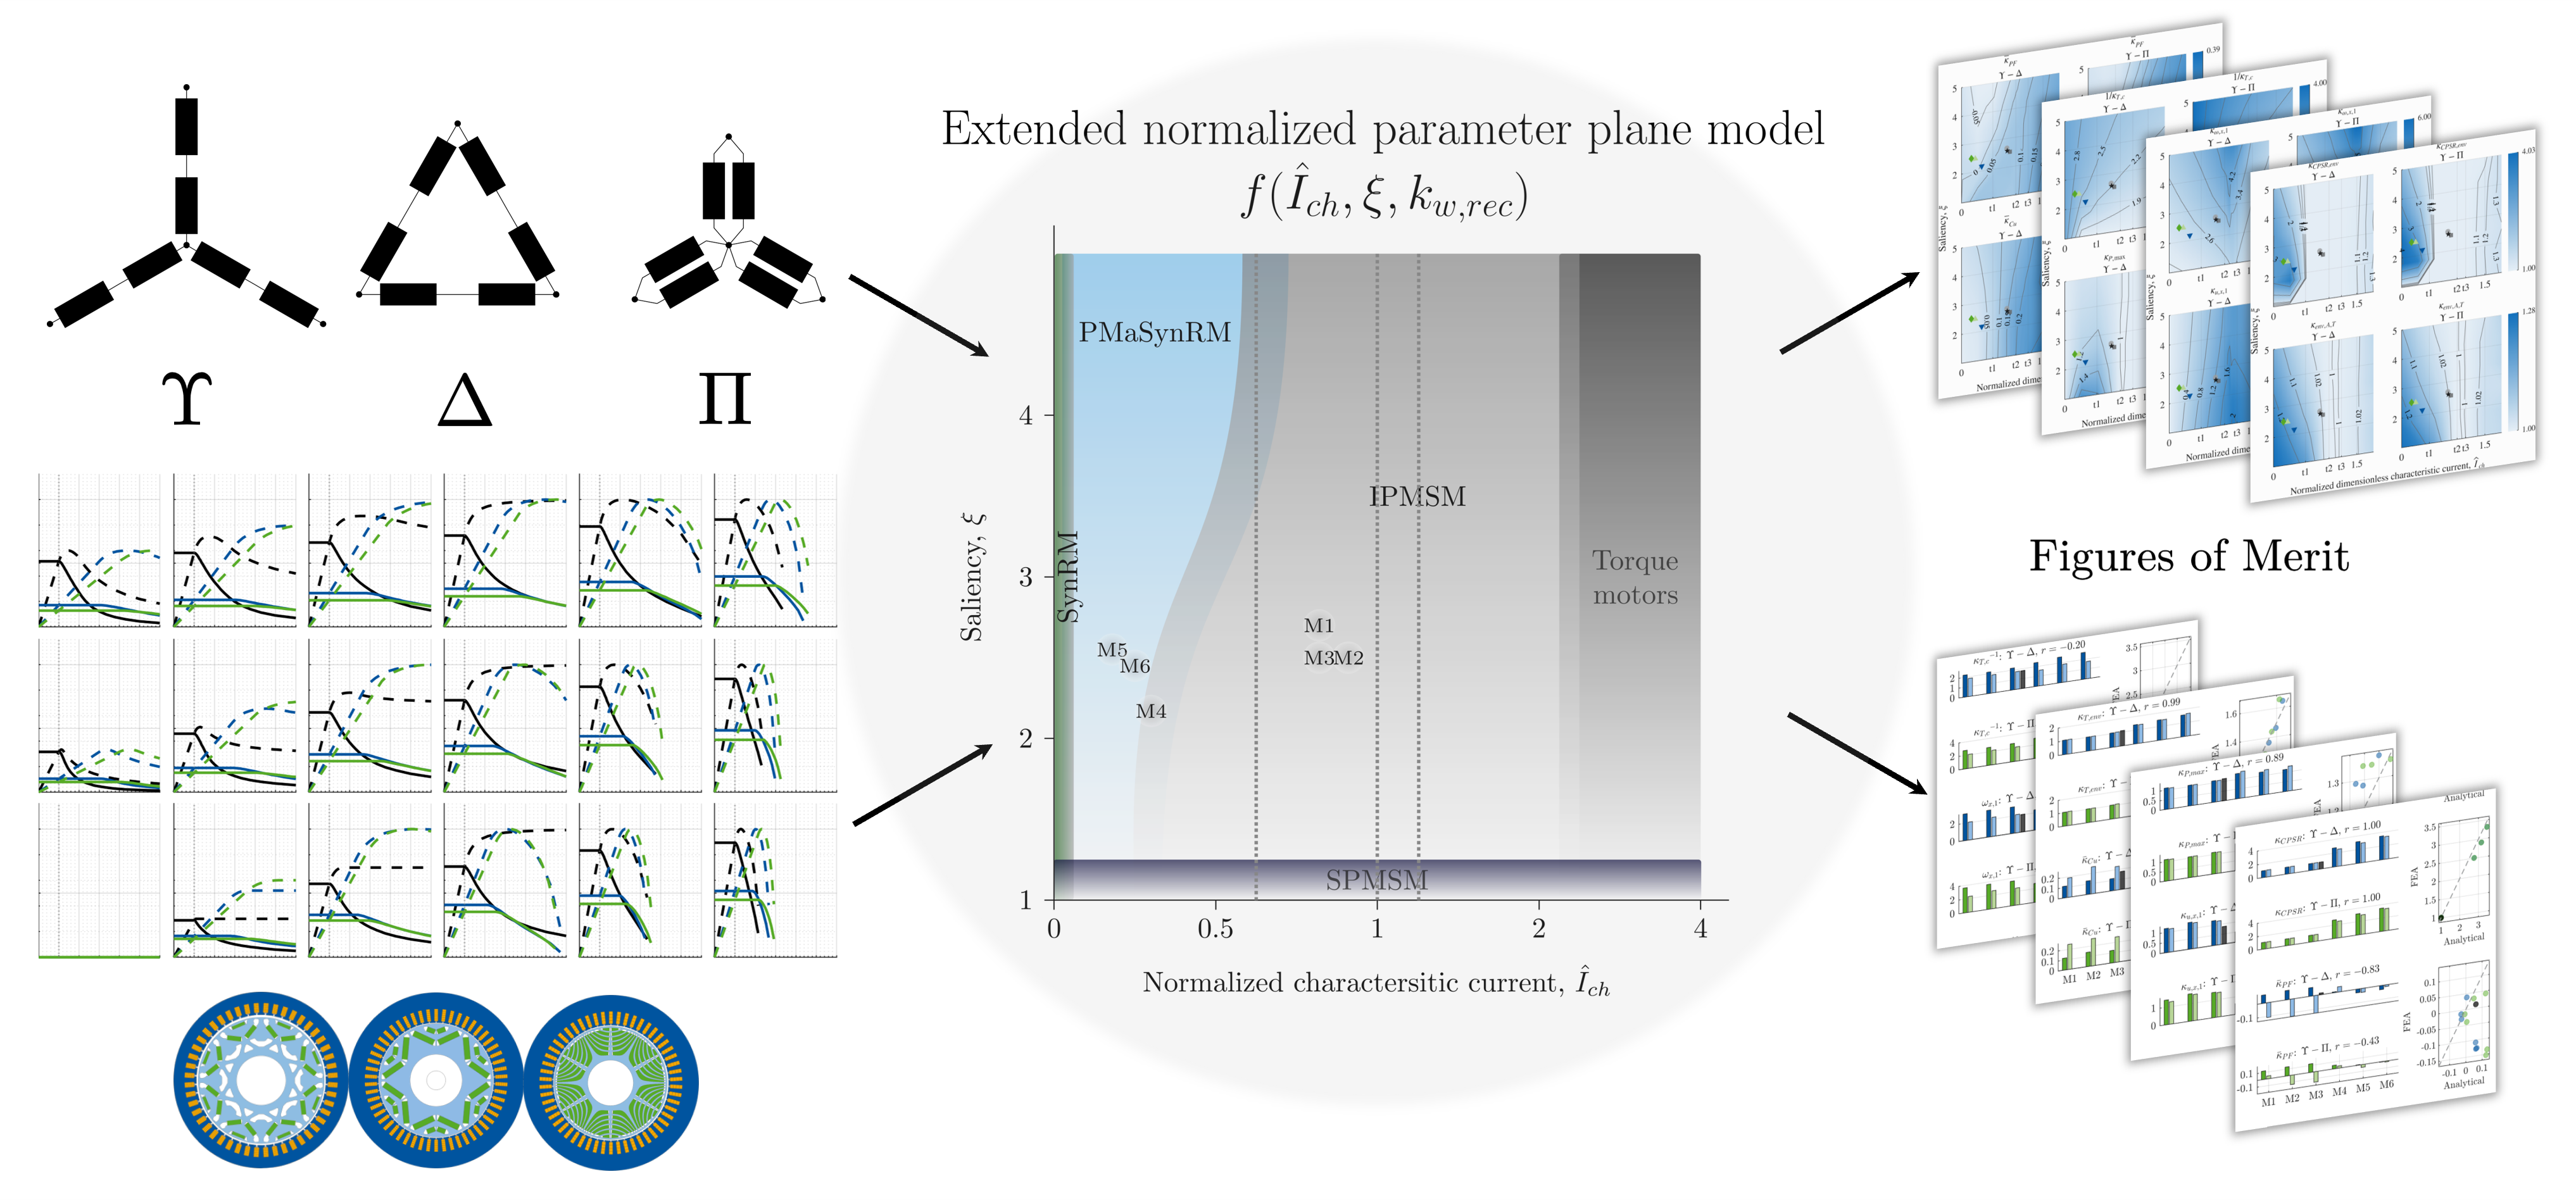
Traction electric machines in electrified mobility are constrained by limited supply voltage and critical materials. Active winding reconfiguration (AWR) changes the winding connection during operation to improve voltage utilization and field-weakening capability. However, general design rules for AWR remain limited. This work extends the characteristic-current-based normalized parameter-plane framework to AWR via topology-dependent reconfiguration factors and evaluates the resulting torque-speed-power behavior over the design space. The analytical model is compared against finite-element analysis of six baseline machines and test-bench measurements from one machine. Normalized characteristic current is the dominant design parameter, capturing the balance between magnetic and current loading, while saliency and the reconfiguration factor set the magnitude of the benefit. Figures of merit are defined to quantify reconfiguration benefit across peak performance, crossover points, torque-speed envelopes, and part-load performance. Across these figures of merit, three explicit thresholds for normalized characteristic current are identified. Below the lowest threshold, designs such as synchronous reluctance and ferrite-assisted machines gain of up to four times higher constant-power over speed range (CPSR) and 40% higher peak power. Above it and up to the middle threshold, conventional rare-earth traction machines gain mainly in part-load efficiency instead. Above the highest threshold, narrow-field-weakening designs gain mainly in speed-range extension. These thresholds provide generalized, geometry-independent early-stage AWR screening for traction machine concepts.
Keywords:
active winding reconfiguration
; normalized parameter plane
; characteristic current
; saliency
; traction electric machine
; field weakening
; permanent magnet synchronous machine
; star-delta
; series-parallel
; winding reconfiguration
; open-end winding
1. Introduction
Primary traction electric drives for electrified mobility must balance cost, sustainability, and high-speed performance under a fixed DC-link voltage constraint. Several rare-earth-free rotor solutions exist, including induction machines, synchronous reluctance machines (SynRM), permanent magnet (PM) assisted SynRM (PMaSynRM), and externally excited machines. Each introduces varying trade-offs with torque density, efficiency, volume, or thermal margin for reduced critical-material content [1,2,3]. Among these, ferrite-magnet permanent magnet synchronous machines (PMSMs) require a larger machine volume and higher inverter current rating to match rare-earth performance [4,5,6,7,8].
Active winding reconfiguration (AWR) has regained attention as a means to address this trade-off. Prior works cover reconfigurable hardware topologies, low-level reconfiguration control, and fault-tolerant operation, but design studies remain largely single-point demonstrations[9,10,11,12,13,14,15,16,17,18,19,20,21,22]. Reported gains are substantial and span a wide-range, including 20 percent to 80 percent increases in torque or power density and up to 60 percent reductions in total losses [23]. Yet, there is a lack of clear design parameters or threshold ranges to predict this benefit without a full design study [23,24]. Identifying this benefit currently requires a full AWR design study. Conventional multi-objective optimization methods require numerous detail design evaluations [25]. While data-driven approaches reduce this evaluation count [26,27,28], such design studies benefit from analytical methods to further reduce computational effort.
A sensitivity study [29] found that weak rotor magnetic loading benefits more from AWR based on a single rotor design. However, the trend starts to reverse at very low magnetic loading and does not generalize further. Generalized design-space explorations have instead used normalized parameter-plane (NPP) models based on the saliency–flux-linkage NPP model [30,31,32]. Works in [12,33,34,35,36,37] identify regions of AWR improvement and discuss design boundaries along with validation against models and measurements considering saturation effects. However, the boundaries identified shift based on the input parameters, requiring iterative solving or lookup tables for each design [37]. In contrast, normalized characteristic current () based NPP model [38] expresses a design-independent, closed-form boundary at . This threshold value represents theoretical infinite CPSR capability. Since AWR benefit is fundamentally governed by field-weakening capability, this type of NPP model is well suited for extension to AWR topologies, though [38] did not originally address AWR.
One study [39] extended the based NPP model to AWR by introducing a third parameter, normalized field-weakening current, for series-parallel reconfiguration topology. However, the study omitted the effect of turns ratio on PM flux linkage, as otherwise expected [12,35]. The same single threshold from [38], , is identified qualitatively, without any figure of merit (FoM) to quantify torque or power gain over the CPSR. Validation is limited to one design at , a machine with inherently narrow field-weakening. The recommendation is that machines with narrow field-weakening (large and low saliency) primarily benefit from AWR and contradicts the findings in [29]. Broader case-study evidence [23] also indicate substantial AWR benefit for machines with wide field-weakening and CPSR capability () [38,40,41,42].
The gap therefore remains threefold: an AWR-extended based NPP model that accounts for the turns-ratio effect on PM flux linkage, expression of reconfiguration benefit through quantified FoMs, and validation across the wide-field-weakening region near .
The goals of this work are:
- 1.
- Extend the two-parameter NPP model from [38] with turns-ratio effect to obtain a geometry-independent analytical model that predicts the torque-speed-power behavior of AWR topologies over the design space.
- 2.
- Derive a reduced set of FoMs from this model that quantify the benefit of AWR reconfiguration.
- 3.
- Identify explicit parameter thresholds that separate AWR-favorable from AWR-unfavorable design regions.
2. Materials and Methods
2.1. Active Winding Reconfiguration Topologies and Notation
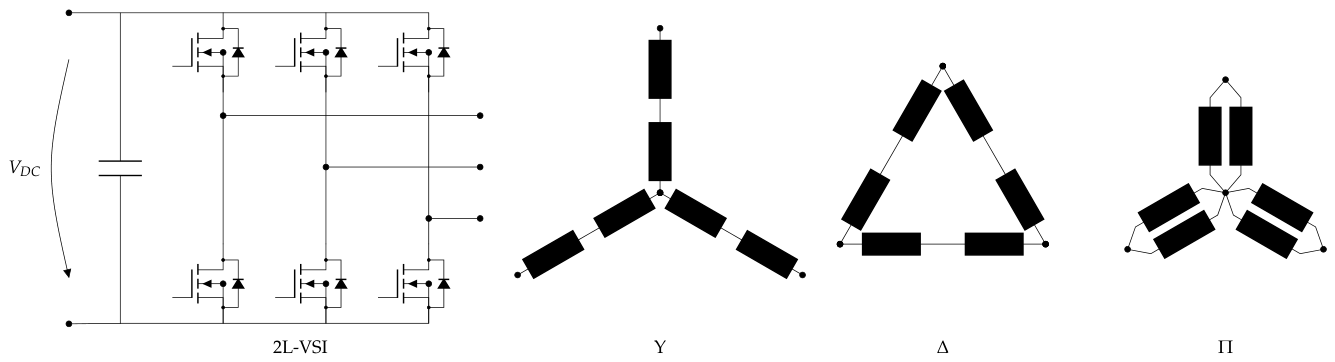
Most conventional traction machines use a three-phase winding driven by a two-level voltage source inverter (VSI) with one end of the phases joined at a common neutral point, i.e., in a star () configuration. Actively reconfiguring the windings from this state changes the voltage utilization and field-weakening capability. The following topologies are considered in this work, as summarized in Table 1.
- Star (): The anchor () configuration; the three phases are joined at a common neutral point, driven by a single inverter.
- Parallel (): Each phase winding is reconnected from series to parallel, giving an effective turns ratio relative to ; current per parallel branch is halved while the induced voltage is unchanged. This typically requires nine switches [23].
Figure 1.
Machine winding topologies considered in this work connected to a two-level voltage source inverter.
Figure 1.
Machine winding topologies considered in this work connected to a two-level voltage source inverter.
2.2. Normalized Parameter-Plane Model
Following standard assumptions apply to the simplified d-q model representation of IPMSM machines [30,32,35,38]:
- 1.
- Lossless machine: stator (phase) resistance and all loss terms (iron loss, friction, leakage etc.) are set to zero.
- 2.
- Fundamental-wave, sinusoidal operation: higher harmonics are neglected, and sinusoidal quantities are assumed.
- 3.
- No cross-coupling: cross-coupling is neglected. and are solely dependent on and , respectively.
- 4.
- Linear magnetic properties: saturation effects and temperature-dependent changes of PM flux are neglected.
- 5.
- Steady-state operation: time-derivative terms in the voltage equations are zero.
The normalized voltage and torque equations, derived from the established absolute d-q model is described in [38], with normalization base quantities reproduced in Appendix A, as used in this work are:
Voltage limit equations show an ellipse whose d- and q-axes diameters are inversely proportional to the product of machine speed and the respective inductances, and . The center of these ellipses is given by the characteristic current, , and the ratio of the q- and d-axis inductances defines the saliency, , of the machine.
The normalization of any given reference drive and reference machine is made with the drive current and voltage limits set to one. The base speed of the reference machine, defined as the speed at which the voltage and current limits of the reference drive under MTPA control are reached, is normalized to one. With this convention, the reference drive and machine transitions from current-limited operation to FW at this normalized speed value of one. This convention is consistent with standard parameter-plane formulations [30,31,32,35,42] and coincides with the method of normalization in [38].
2.2.1. Significance of Normalized Characteristic Current
Previous research established normalized parameter-plane models for describing the FW capability of IPMSM. In this work, the formulation based on normalized characteristic current and saliency ratio is used. The characteristic current is a fundamental machine parameter and forms a key boundary recognized for its key role in determining field weakening performance [38,40,41,44]. In its normalized form (i.e., ), values above one indicate that the voltage limit ellipse intersect is outside the current limit circle, so the machine becomes speed-limited, whereas values below one allow continued field weakening toward higher speed with diminishing torque. Saliency modifies the shape of the voltage-limit ellipse and therefore the effectiveness of current utilization in FW; higher saliency reduces the d-axis current needed to remain within the voltage limit and improves torque-per-ampere output.
The characteristic current represents the ratio of the magnet flux to the d-axis inductance. When normalized against maximum stator current limit, it points to the machine’s relative magnetic loading and current loading, both fundamental design parameters in preliminary, analytical machine design.
The characteristic current also equals the balanced three-phase steady-state short-circuit current of the machine at high-speeds under idealized assumptions. placed near the maximum current limit therefore implies that a stator short circuit alone can approach the magnet’s demagnetizing field. Reduced- and rare-earth-free magnet designs, with lower demagnetization resistance, thus often target below this limit, most notably in ferrite-assisted synchronous reluctance machines. thus also captures the trade-off between demagnetization resistance and FW capability.
Together, and provide a physically grounded way to locate traction-machine designs in the normalized parameter plane. In this plane, most wide-CPSR machines, including those in automotive traction use, typically occupy the region with characteristic current around the rated maximum current limit (i.e., ) and a saliency, [38,40,44].
2.3. Extension of the – NPP Model to Active Winding Reconfiguration
The equivalent effect of winding reconfiguration on the voltage, current and torque equations is represented by a factor, . The anchor state (anc) is the configuration, and the reconfigured states (rec) are the and configurations.
The peak phase MMF () of the anchor configuration is defined as:
where is the number of series turns per phase and is the normalized inverter current limit.
The peak phase MMF () of the reconfigured state is then defined as:
The turns-ratio also affects the flux linkage and the inductances. The underlying reluctance and the PM flux remain unchanged , but the effect of the turns ratio appears in the flux linkage and in the inductance: the flux linkage scales proportionally with the turns ratio, while the inductance scales quadratically [12,35,43].
For any configuration, the onset of field weakening is the point at which the induced voltage reaches the voltage limit. The reconfiguration factor can be used to relate the voltage limit of the reconfigured state to that of the anchor state as follows:
For the configuration, is the ratio of the current and voltage limits between line and phase quantities. For the configuration, is the inverse of the turns-ratio between the reconfigured and anchor windings. The flux linkage, inductances, the voltage- and current-limits collectively make up the torque-speed equations in eq:normdq. Thus, the factor is incorporated into those equations using these relationships, as summarized in Table 2.
Analysis is then carried out pointwise in the plane. Each point representing the parameter pair defines an anchor machine in the configuration. For each anchor machine, the AWR topologies defined in Section 2.1 are evaluated as alternative reconfigured operating states of the underlying anchor machine by applying topology-dependent changes in current limit, voltage limit, or effective turns per phase, as summarized in the Table 2. This interpretation reflects the physical premise of AWR: the winding connection is reconfigured during operation whereas the machine geometry and material system remain unchanged.
The normalization established for the configuration remains applicable across all reconfigured states. Thus, keeping a normalized circle diagram from the configuration as the anchoring reference, MTPA and MTPV loci are generated for each topology, along with the resulting torque–speed envelopes, following the methodology in [38]. The corner-speed of the anchoring configuration always appears at the normalized value of unity, whereas the corner-speed of the reconfigured topologies appears at different normalized values.
The resulting comparison at each point in the parameter plane represents the effect of reconfiguration on one underlying machine design. This avoids renormalization per topology and ensures that all the corresponding torque–speed envelopes of the underlying machine design are directly comparable.
The comparison of torque–speed envelopes at selected – value pairs (Figure 3) provides only a preliminary view of the effect of reconfiguration. In the next section, scalar figures of merit are defined to systematically identify beneficial design regions across the entire parameter plane and to facilitate machine-level benchmarking.
2.4. Figures of Merit for Evaluating Reconfiguration Benefit
Figures of merit (FoMs) are defined to systematically identify thresholds and design-rules across the parameter plane.
A summary of the different FoMs are given in Table 3 and Table 4, while Figure 2 illustrates the reference points used in their definitions. The FoMs are primarily grouped in to four types.
- 1.
- Maximum performance
- 2.
- Crossover point
- 3.
- CPSR and field-weakening range
- 4.
- Part-load performance
2.5. Baseline Traction-Machine Set and Finite-Element Models
The results from the analytical extended NPP model, and the FoMs derived from it, are evaluated using numerical models of for representative automotive traction machines. Using detailed cross-sectional geometry, FEA models can provide sufficient fidelity in capturing nonlinear, saturation-dependent electromagnetic behavior across the full operational range. The evaluation is to quantify the correlation of important trends between the analytical model and the numerical models, and to identify any limitations of the analytical model. This section describes in brief the approach to finite-element-analysis (FEA) of the four representative automotive traction machines and two benchmark virtual designs of automotive traction machines (Table 5).
2.5.1. FEM Modeling
Electromagnetic modeling and FEA of the baseline machines is performed with the commercial software Ansys Motor-CAD [45] using its 2D transient finite-element-method solver. The geometry of machines M1–M3 is reconstructed after direct measurement from the machines’ active parts. Whereas, the geometry and model parameters of M4–M6 are derived from manufacturer design data. Background information on the FEA modeling approach and the assumptions made in the modeling of the baseline machines is provided in Appendix C.
2.6. Measurement of Machine M3
Machine M3, the device under test (DUT) is an open-end winding machine that can be reconfigured between and configurations. It was measured on a dynamometer test bench to validate the FEA model and to provide experimental data for comparison with the analytical model. The machine was operated using field-oriented control, while the dynamometer imposed the speed setpoint. Manual reconfiguration between and was performed using the terminal box shown in Figure 4. Shaft torque, shaft speed, three-phase line currents and voltages were recorded using the measurement equipment summarized in Appendix B.
3. Results
Three thresholds of are identified in the resulting FoMs across the parameter plane and marked in the subsequent figures.
- 1.
- Threshold :
- 2.
- Threshold :
- 3.
- Threshold :
3.1. Maximum Performance FoMs
The inverse torque ratio in Figure 5 transitions between two limits. For , torque depends only on . Consequently, the inverse torque ratio equals . For , the optimum occurs at . As a result, torque becomes proportional to the square of the current magnitude and the inverse torque ratio becomes .
Peak power and its FoM,, in Figure 5 shows three distinct regions of behavior with respect to and :
- For , reconfiguration only shifts the speed at which maximum power occurs, resulting in .
- For , the reconfigured state can raise maximum power, and for . Machines with show improvement of more than 40% in peak power.
- For , the benefit vanishes towards at a threshold of , and stays below unity for higher .
3.2. Crossover Point FoMs
The crossover FoMs identify where the reconfigured envelope begins to dominate the anchor envelope and the voltage stress associated with such a mode transition. Values of above unity indicate that the open-circuit induced voltage exceeds the available DC-link voltage. Under a short-circuit condition, this can lead to a risk of uncontrolled generating operation if no active control is applied. In an open-circuit condition, the resulting terminal voltage must remain below the blocking-voltage rating of the inverter switching devices, as observed in [35].
Increasing improves the anchor-state field-weakening capability and therefore shifts the crossover to higher speed, while the dependence on produces a ridge near . Below this region, the reconfigured state extends useful high-speed operation; above it, the field-weakening benefit weakens and the crossover speed decreases. The voltage-stress factor follows the same ridge qualitatively, but is moderated by the reduction in with increasing in the normalized model.
3.3. Constant-Power over Speed Range FoMs
The impact of the characteristic current on the FW capability, and hence on CPSR and the torque–speed envelope FoM, as seen in Figure 6, is established with three thresholds defined by and :
- For , both and increase with . However, the gain decreases with increasing , since improves the anchor state’s own CPSR. Machines with moderate show improvements of up to four times in CPSR. Machines with low and low show the largest improvement in of more than 20% over the anchor state.
- For , the reconfigured state’s finite maximum speed limits its advantage, and both ratios remain close to unity.
- For , both states are speed-limited with a narrow CPSR; the ratios rise slightly above unity, but the absolute improvement stays limited.
The composite envelope FoMs show that the largest AWR benefit occurs when reconfiguration moves the machine from a voltage-limited anchor state into a more favorable high-speed operating regime. This confirms that AWR should be evaluated by the composite envelope rather than by peak values alone.
3.4. Part-Load Performance FoMs
The FoMs described so far characterize performance along the rated torque–speed envelope only. To address part-load performance, two additional FoMs, and , are defined based on indicative power factor (PF) and copper losses, respectively. Though stator ohmic losses were neglected in the derivation of the normalized voltage and torque equations, a representation of these losses is useful for design analysis and is post-processed from the analytical model results [38].
Both FoMs are area-weighted means of the pointwise difference between the reconfigured and anchor states, normalized over the common feasible operating region ; positive values indicate that reconfiguration is favorable. captures the reduction in apparent power demand on the inverter for a given torque and speed, while captures the improvement in part-load efficiency through reduced stator ohmic (DC) loss.
Figure 6 shows in the base-speed region improves with but degrades with , whereas in deep FW the trend reverses. Since is dominated by the base-speed region, and predominantly by that of the reconfigured state, follows the base-speed trend: it decreases with and increases with .
Reconfiguration reduces phase current in the state and the resistance in the state. As copper loss scales with , the advantage is largest near the current limit and shrinks at part load. is further constrained by the definition of itself: for , a large fraction of the reconfigured envelope lies outside . Therefore, the advantage is only partially captured, whereas at higher the overlap grows and the copper-loss reduction is more fully reflected in .
3.5. Verification on Baseline Machines
The baseline machines M1–M6 (Table 5) are used to compare nonlinear FEA results against the extended NPP model at matched normalized design points. Measurement results of machine M3 are additionally included. The original winding connection is treated as the anchor, and the state is obtained by reconfiguring the FEA models and the test machine M3 while holding geometry, materials, temperatures, system voltage and current limits as fixed boundary conditions. The torque-speed curves from the FEA results and measurement results are normalized in the same normalization framework as the analytical model as from [38], restated in Appendix A. Corner speed of the anchor configuration is taken as the speed normalization reference (). Torque is normalized to the corner point speed with unity power factor electrical power (). Whereas the FEA-derived normalized characteristic current () and corner-point locate each machine on the normalized parameter plane to generate the corresponding analytical envelopes and FoMs.
The envelopes in Figure 7 show the largest discrepancies in the base-speed region, with good agreement in field weakening, consistent with prior literature [32,38,42]. The analytical model underpredicts peak torque for the reconfigured state, particularly at low and high (Figure 9, machine M6), because the constant-inductance NPP model cannot capture current-dependent saturation resolved by FEA, an effect also reported in other works utilizing the analytical NPP model [38,42,46]. The measurement results from machine M3 show good agreement with the FEA results in field weakening region for both configurations. For the anchor configuration, the maximum torque is in between the analytical and FEA results, while for the reconfigured configuration, the maximum torque matches the FEA results.
Higher amplifies this nonlinearity (Figure 9), therefore, the analytical model consistently overestimates at low and high , resulting in the predicted crossover speed being lower than in FEA.
Despite this, Figure 8 shows strong correlation for system-level FoMs (composite CPSR, envelope expansion, peak-power ratio, crossover voltage-stress factor, relative copper-loss improvement). Agreement is weakest for the corner-point torque ratio and inverter utilization FoMs, reflecting their sensitivity to nonlinear saturation and making the least reliable metric under the analytical model’s constant-inductance assumption. Data from the FoMs for machine M3 are provided in Table 6 and for all the machines in Appendix D.
4. Discussion
The relevant transition regions in the normalized design space occur at three characteristic levels:
- 1.
- marks the region of maximum CPSR and torque–speed envelope improvement.
- 2.
- is where maximum-power improvement and crossover voltage stress become critical.
- 3.
- is where torque–speed envelope improvement is least.
Saliency modifies the magnitude of the predicted benefit and shifts the crossover behavior, but does not change the dominant role of in the normalized design space. The key implications are summarized in Table 7. Based on the FoMs several design recommendations can be made for automotive traction machines with reconfigurable windings:
-
Low () designs benefit most from reconfiguration in terms of CPSR and torque–speed envelope expansion. The maximum benefit occurs up to a threshold value of . This observation motivates a design approach of reducing magnetic loading relative to current-loading, which in turn, can move the machine into the low- region where reconfiguration yields stronger high-speed benefits. Following designs benefit most:
- SynRM
- designs without PM
- PMaSynRM
- designs with weaker magnets and higher current loading, and
- IPMSM
- designs with significantly reduced rare-earth magnet content.
- SPMSM
- designs with weaker magnets and higher current loading.
In all four cases, conventional designs required a trade-off with high speed performance and low-end torque. Reconfiguration significantly enhances the machine’s high-speed performance and extends its operational range while saving on magnet material costs. The torque ratio from FEA models suggest availability of around times the torque in the anchor state as compared to the reconfigured state. This means the benefit in high-speed FoMs is achieved without compromising the low-speed torque requirements for traction applications. - Designs with , which make up most conventional rare-earth magnet based traction IPMSM designs, show limited gains in CPSR and torque–speed envelope from reconfiguration. However, they benefit in part-load efficiency and inverter loading, particularly during high-speed field-weakening operation. Thus, the motivation here is that strong-magnet machines suffer higher losses in field weakening. Reconfiguration mitigates these losses by optimizing the operating point. An alternative design approach is to reduce magnetic strength and material cost to utilize the potential of reconfiguration as mentioned in the previous point.
- For machines with high , i.e., with high magnetic strength and low current loading with limited field-weakening capability, reconfiguration may not improve the rated maximum power. It does, however, improve the torque–speed envelope and part-load efficiency, thereby providing a viable route to extend speed range despite limited field-weakening capability.
-
Choice between reconfiguration pairs: The absolute improvement in high speed performance and torque–speed envelope FoMs is higher for – reconfiguration pair than the – pair. This follows from the larger effective reconfiguration factor of the – pair. However, following aspects favor – pair:
- 1.
- The crossover speed is lower for the – pair, hence, the benefits are already available at lower speeds.
- 2.
- The crossover voltage-stress is lower for the – pair, hence, the risk of mode-shift is lower.
- 3.
- The threshold value for CPSR and torque–speed envelope improvement is inversely proportional to . More machine designs are covered by the – pair than the – pair.
5. Conclusions
This work extended the characteristic-current-based normalized parameter-plane model to active winding reconfiguration by introducing topology-dependent reconfiguration factors for the – and – configurations. The resulting model keeps the machine as the normalization anchor and predicts the torque-speed-power behavior of AWR topologies over the – design space.
The normalized characteristic current is the central design parameter because it captures the relative strength of PM flux linkage, or magnetic loading, with respect to current loading. Together with and , it gives physically meaningful thresholds that separate favorable and unfavorable regions for AWR. The figures of merit defined in this work quantify reconfiguration benefit across peak performance, crossover behavior, constant-power speed range, and part-load performance.
Comparison with non-linear FEA results for six representative traction-machine designs, and with measurement results from one machine (M3), confirmed that the analytical model captures the main system-level trends. The extended NPP model is therefore suitable for early-stage design screening and for identifying machine concepts that can benefit from reconfiguration. Final performance prediction still requires nonlinear FEA due to saturation-dependent inductance effects influencing the torque ratio and power-factor metrics.
Author Contributions
Conceptualization, R.K.-K., H.W. and J.A.; methodology, R.K.-K.; formal analysis, R.K.-K.; investigation, R.K.-K., H.W. and H.C.; writing—original draft preparation, R.K.-K.; writing—review and editing, H.W., H.C., M.E., and J.A.; visualization, R.K.-K.; supervision, M.E. and J.A.; resources, M.E. and J.A.; funding acquisition, M.E. and J.A. All authors have read and agreed to the published version of the manuscript.
Funding
This work was supported by the European Union’s Horizon Europe research and innovation program under Grant Agreement No.101192720 (HIGH-VOLTAGE FAST-CHARGING EFFICIENT ELECTRIC VEHICLE POWERTRAINS).
Data Availability Statement
The original measured and simulated torque-speed envelope data presented in this study are openly available in the Zenodo repository at https://doi.org/10.5281/zenodo.22647758.
Acknowledgments
The authors acknowledge Onur Kara, Fabian Jonczyck, and Oliver Kusche from the Chair of Mechatronics in Mobile Propulsion, RWTH Aachen University for support with measurements. The authors also acknowledge Michael Schröder and Christoph Neuhaus from FEV Europe GmbH, as well as Christian Milwisch and Peter Pišek, from Magna Powertrain GmbH, for their support.
Conflicts of Interest
The authors declare no conflicts of interest.
Abbreviations
| SynRM | Synchronous reluctance machine |
| PM | Permanent magnet |
| PMaSynRM | Permanent magnet assisted synchronous reluctance machine |
| PMSM | Permanent magnet synchronous machine |
| IPMSM | Interior permanent magnet synchronous machine |
| SPMSM | Surface-mounted permanent magnet synchronous machine |
| AWR | Active winding reconfiguration |
| NPP | Normalized Parameter Plane |
| CPSR | Constant power speed range |
| FoM | Figure of Merit |
| FoMs | Figures of Merit |
| MTPA | Maximum torque per ampere |
| MTPV | Maximum torque per voltage |
| FW | Field weakening |
| PF | Power factor |
| FEA | Finite element analysis |
| NdFeB | Neodymium iron boron |
| DC | Direct current |
| LUT | Look-up table |
| 2D | Two-dimensional |
Appendix A. Base Quantities for the Normalized Parameter Plane (NPP) Model

Table A1.
Base quantities for the normalized parameter plane (NPP) model.
| Quantity | Base Definition | Normalized Quantities |
|---|---|---|
| Current | ||
| Voltage | ||
| Power | ||
| Flux linkage | ; | |
| Electrical speed | : speed at which the voltage-limit ellipse meets the current-limit circle at the MTPA point | |
| Mechanical speed | ||
| Inductance | ||
| Torque |
Appendix B. Machine M3 Dynamometer Test Bench Setup and Operating Conditions
Table A2.
Numbered components and measurement equipment of the dynamometer test bench for machine M3 shown in Figure 4.
Table A2.
Numbered components and measurement equipment of the dynamometer test bench for machine M3 shown in Figure 4.
| No. | Component | Function / equipment |
|---|---|---|
| 1 | Device under test | Machine M3, operated in and winding configurations. |
| 2 | Reconfiguration terminal box | Terminal box at the open-ended winding terminals of DUT for manual winding reconfiguration between and . |
| 3 | Inverter terminal box and electrical sensor unit | Three-phase cable hand-over from inverter to reconfiguration terminal, as well as housing for 3-phase current sensors (LEM-ITS 600) and Voltage probes |
| 4 | Inverter | Universal inverter operating the device under test |
| 5 | Electrical signal acquisition | Matuschek PowerAnalyzer used for recording electrical signals. |
| 6 | Torque and speed measurement | HBM T40B torque transducer used for shaft torque and speed measurement. |
| 7 | Load machine | High-speed dynamometer imposing the speed set-point. |
| 8 | Cooling system | Closed-loop cooling water thermal conditioning unit. DUT has an oil-water heat exchanger. |
Table A3.
Operating conditions for machine M3 measurements.
| Parameter | Value / description |
|---|---|
| DC-link voltage | 650 |
| Control strategy | Field-oriented control with space-vector PWM |
| Modulation index | 0.924 |
| Stator winding temperature |
Appendix C. FEA Modeling of the Baseline Machines
Figure A1.
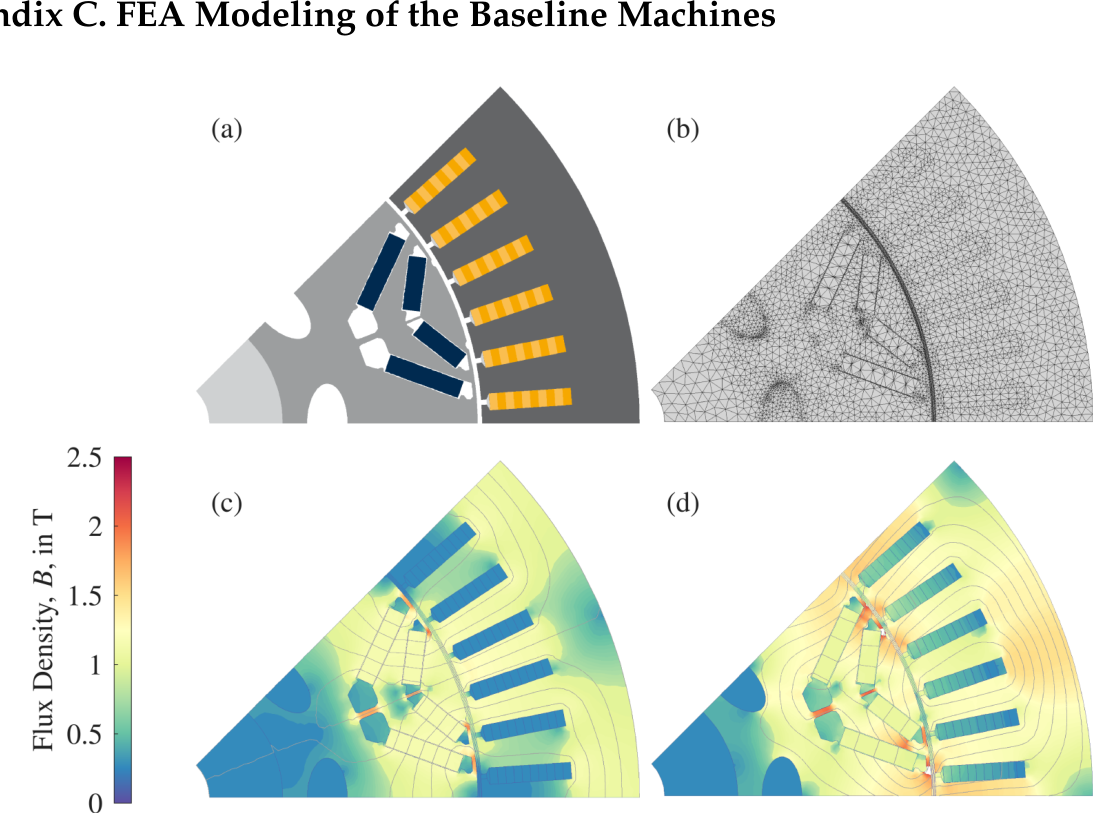
FEA model of machine M3 with (a) reconstructed 2D cross-sectional geometry, (b) mesh, and (c) flux density distribution at open-circuit condition and (d) flux density distribution at rated corner-point on-load condition.
Figure A1.
FEA model of machine M3 with (a) reconstructed 2D cross-sectional geometry, (b) mesh, and (c) flux density distribution at open-circuit condition and (d) flux density distribution at rated corner-point on-load condition.
The modeling workflow is organized into three levels:
- 1.
- 2D FEA of a single operating-point: The two-dimensional cross-section of the machine including the active parts of stator and rotor laminations, the PM, and the air gap is modelled. Based on the number of poles and slots, geometry and winding configuration, only a section (for e.g., one pole section) of the whole machine is modelled based on assumptions of symmetry and continuity of electromagnetic fields. For this selected section, a mesh is generated and fields are calculated (Figure A1). The electromagnetic field solution is post-processed to determine output quantities such as flux linkages, currents, voltages, torque, torque ripple, and losses at each simulated operating point. Five loss mechanisms are addressed: core loss in the stator and rotor laminations [47], magnet eddy-current loss [48], ohmic losses (DC and AC winding [49]), and friction loss. PWM switching losses and stray load losses are neglected.
- 2.
- Saturation and losses LUT: FEA is carried out across the full – plane at a fixed speed matching the corresponding measurements; the resulting LUT of output quantities are stored as scalable coefficients [50]. These are then used to evaluate results for any other speed, current, or torque set point.
- 3.
Appendix D. Figure of Merit Comparison Between Analytical and FEA Models for the Baseline Machines
Table A4.
Analytical and FEA figure-of-merit (FoM) comparison for – and – configurations, machines M1–M6.
Table A4.
Analytical and FEA figure-of-merit (FoM) comparison for – and – configurations, machines M1–M6.
| FoM | M1 | M2 | M3 | M4 | M5 | M6 | ||||||||||||||||||
|---|---|---|---|---|---|---|---|---|---|---|---|---|---|---|---|---|---|---|---|---|---|---|---|---|
| – | – | – | – | – | – | – | – | – | – | – | – | |||||||||||||
| Anl. | FEA | Anl. | FEA | Anl. | FEA | Anl. | FEA | Anl. | FEA | Anl. | FEA | Anl. | FEA | Anl. | FEA | Anl. | FEA | Anl. | FEA | Anl. | FEA | Anl. | FEA | |
| 2.23 | 1.82 | 2.74 | 2.08 | 2.17 | 1.82 | 2.66 | 2.16 | 2.20 | 1.78 | 2.71 | 2.13 | 2.40 | 1.57 | 3.00 | 1.90 | 2.60 | 1.82 | 3.31 | 2.07 | 2.70 | 1.73 | 3.47 | 2.03 | |
| 1.11 | 1.08 | 1.11 | 1.09 | 1.07 | 1.06 | 1.07 | 1.07 | 1.11 | 1.09 | 1.11 | 1.09 | 1.30 | 1.38 | 1.38 | 1.39 | 1.19 | 1.28 | 1.25 | 1.36 | 1.14 | 1.29 | 1.19 | 1.35 | |
| 3.09 | 2.24 | 3.63 | 2.50 | 3.09 | 2.24 | 3.63 | 2.61 | 3.05 | 2.37 | 3.58 | 2.80 | 2.34 | 1.52 | 2.77 | 1.73 | 2.33 | 1.72 | 2.74 | 1.88 | 2.26 | 1.50 | 2.65 | 1.66 | |
| 1.19 | 1.15 | 1.40 | 1.28 | 1.32 | 1.28 | 1.55 | 1.49 | 1.22 | 1.19 | 1.44 | 1.40 | 0.51 | 0.55 | 0.61 | 0.63 | 0.31 | 0.37 | 0.37 | 0.40 | 0.22 | 0.26 | 0.25 | 0.28 | |
| 1.00 | 1.23 | 1.00 | 1.23 | 1.00 | 1.00 | 1.00 | 1.00 | 1.00 | 1.00 | 1.00 | 1.00 | 2.77 | 4.30 | 2.77 | 4.30 | 3.18 | 3.87 | 3.18 | 3.87 | 3.49 | 4.17 | 3.49 | 5.04 | |
| 1.05 | 1.13 | 1.05 | 1.12 | 1.03 | 1.02 | 1.03 | 1.03 | 1.05 | 1.07 | 1.04 | 1.06 | 1.39 | 1.71 | 1.34 | 1.70 | 1.49 | 1.72 | 1.43 | 1.83 | 1.58 | 1.87 | 1.54 | 2.07 | |
| 0.06 | -0.11 | 0.12 | -0.12 | 0.07 | -0.14 | 0.13 | -0.16 | 0.06 | -0.16 | 0.12 | -0.17 | 0.01 | -0.06 | 0.05 | -0.09 | -0.03 | 0.02 | 0.01 | 0.01 | -0.03 | -0.01 | -0.01 | -0.01 | |
| 0.11 | 0.21 | 0.12 | 0.29 | 0.13 | 0.29 | 0.14 | 0.31 | 0.12 | 0.25 | 0.12 | 0.29 | 0.02 | 0.05 | 0.02 | 0.03 | 0.02 | -0.00 | 0.01 | 0.01 | 0.01 | 0.00 | 0.01 | 0.01 | |
References
- Kallur-Krishnamoorthy, R.; Schröder, M.; Rosen, T.; Andert, J. Rare-Earth-Free Electric Machines with Interchangeable Rotors. MTZ Worldw. 2025, 86, 16–25. [Google Scholar] [CrossRef]
- Tokat, A.; Nguyen, D.K. Drive Cycle Comparison of a PMSM and an EESM for a Traction Application Utilizing Modular Stator Manufacturing. In Proceedings of the 2024 International Conference on Electrical Machines (ICEM), 2024; pp. 1–7. [Google Scholar] [CrossRef]
- Petrelli, G.; Nuzzo, S.; Zou, T.; Barater, D.; Franceschini, G.; Gerada, C. Review and Future Developments of Wound Field Synchronous Motors in Automotive. In Proceedings of the 2023 IEEE International Conference on Electrical Systems for Aircraft, Railway, Ship Propulsion and Road Vehicles & International Transportation Electrification Conference (ESARS-ITEC), 2023; pp. 1–6. [Google Scholar] [CrossRef]
- Dilevrano, G.; Ragazzo, P.; Ferrari, S.; Pellegrino, G. Comparative Design of Ferrite- and NdFeB-PMSMs Using the (x,b) Design Plane. In Proceedings of the 2023 IEEE International Electric Machines & Drives Conference (IEMDC), 2023; pp. 1–7. [Google Scholar] [CrossRef]
- Tahanian, H.; Aliahmadi, M.; Faiz, J. Ferrite Permanent Magnets in Electrical Machines: Opportunities and Challenges of a Non-Rare-Earth Alternative. IEEE Trans. Magn. 2020, 56, 1–20. [Google Scholar] [CrossRef]
- Luk, P.C.K.; Abdulrahem, H.A.; Xia, B. Low-Cost High-Performance Ferrite Permanent Magnet Machines in EV Applications: A Comprehensive Review. eTransportation 2020, 6, 100080. [Google Scholar] [CrossRef]
- Kimiabeigi, M.; Widmer, J.D.; Long, R.; Gao, Y.; Goss, J.; Martin, R.; Lisle, T.; Soler Vizan, J.M.; Michaelides, A.; Mecrow, B. High-Performance Low-Cost Electric Motor for Electric Vehicles Using Ferrite Magnets. IEEE Trans. Ind. Electron. 2016, 63, 113–122. [Google Scholar] [CrossRef]
- Nasr, A.; Chareyron, B.; Abdenour, A.; Milosavljevic, M. Design of a Permanent Magnet Assisted Synchronous Reluctance Motor Using Ferrites. In Proceedings of the 2020 International Conference on Electrical Machines (ICEM), Gothenburg, Sweden, 2020; pp. 1758–1764. [Google Scholar] [CrossRef]
- Nipp, E. Permanent Magnet Motor Drives with Switched Stator Windings. PhD thesis, Royal Institute of Technology, Stockholm, 1999. [Google Scholar]
- Takatsuka, Y.; Hara, H.; Yamada, K.; Maemura, A.; Kume, T. A Wide Speed Range High Efficiency EV Drive System Using Winding Changeover Technique and SiC Devices. In Proceedings of the 2014 International Power Electronics Conference (IPEC-Hiroshima 2014 - ECCE ASIA), Hiroshima, Japan, 2014; pp. 1898–1903. [Google Scholar] [CrossRef]
- Geissler, M.; Osinenko, P.; Herlitzius, T. Winding Switching Strategy for Electric Wheel Drives in Agricultural Machinery. In Proceedings of the 2015 IEEE International Conference on Industrial Technology (ICIT), Seville, 2015; pp. 851–856. [Google Scholar] [CrossRef]
- Hao, L.; Namuduri, C.; Naik, S.M.; Freitas, C. High Speed Performance of PM Machine with Reconfigurable Winding. In Proceedings of the 2015 IEEE Energy Conversion Congress and Exposition (ECCE), Montreal, QC, Canada, 2015; pp. 1840–1848. [Google Scholar] [CrossRef]
- Atiq, S.; Lipo, T.A.; Kwon, B.i. Experimental Verification of Winding Switching Technique to Enhance Maximum Speed Operation of Surface Mounted Permanent Magnet Machines. IET Electr. Power Appl. 2016, 10, 294–303. [Google Scholar] [CrossRef]
- Zhou, X.; Buticchi, G.; Migliazza, G.; Wang, S.; Galea, M.; Gerada, C. Review of Speed-Extension of Permanent Magnet Synchronous Motor with Reconfigurable-Winding System. In Proceedings of the 2021 IEEE 30th International Symposium on Industrial Electronics (ISIE), Kyoto, Japan, 2021; pp. 1–6. [Google Scholar] [CrossRef]
- Lee, C.H.; Shin, H.S.; Noh, H.R.; Kim, K.C. A Study on The Electromagnetic Multi-Step Transmission Characteristics of Interior Permanent Magnet Synchronous Motors. Energies 2022, 15, 9615. [Google Scholar] [CrossRef]
- Li, A.; Jiang, D.; Sun, X.; Liu, Z. Online Drive Topology Conversion Technology for PMSM Speed Range Extension. IEEE Trans. Power Electron. 2022, 37, 7113–7121. [Google Scholar] [CrossRef]
- Nair, S.V.; Layek, K.; Hatua, K. An Unequal Split Dual Three-Phase PMSM With Extended Torque-Speed Characteristics for Automotive Application. IEEE Trans. Power Electron. 2022, 37, 12437–12449. [Google Scholar] [CrossRef]
- Shuai, Y.; Jiang, D.; Chen, Z.; Liu, Z.; Sun, H.; Li, P. Study of Star-Delta Soft Switch to Extend AC Motor High Speed Operation Region. CES Trans. Electr. Mach. Syst. 2023, 7, 248–255. [Google Scholar] [CrossRef]
- Fuchs, E.; Schraud, J.; Fuchs, F. Analysis of Critical-Speed Increase of Induction Machines via Winding Reconfiguration With Solid-State Switches. IEEE Trans. Energy Convers. 2008, 23, 774–780. [Google Scholar] [CrossRef]
- Gerling, D.; Dajaku, G.; Bachheibl, F.; Patzak, A. Analytical Calculation of the Novel Stator Cage Machine. In Proceedings of the 2015 18th International Conference on Electrical Machines and Systems (ICEMS), Pattaya, Thailand, 2015; pp. 1346–1352. [Google Scholar] [CrossRef]
- Scharfenstein, D.; Schuller, S.; Quabeck, S.; Doncker, R.W.D. Modeling of Induction Machines With Switched Stator Windings. In Proceedings of the 2020 IEEE Transportation Electrification Conference & Expo (ITEC), Chicago, IL, USA, 2020; pp. 1050–1055. [Google Scholar] [CrossRef]
- Mao, H.; Ye, R.; Liu, M. Dynamically Reconfigurable Motor Technology for High Density and High Efficiency HEV Drives without Rare-Earth Materials. In Proceedings of the 2022 IEEE Transportation Electrification Conference & Expo (ITEC), Anaheim, CA, USA, 2022; pp. 784–789. [Google Scholar] [CrossRef]
- Best, J.; Asef, P.; Vagg, C. A Review of Motors With Reconfigurable Windings for Automotive Traction Drives. IEEE Access 2025, 13, 140187–140204. [Google Scholar] [CrossRef]
- Oestreicher, R.; Könen, C.; Kulzer, A.C. Efficiency Increase of Electric Drives in Customer Related Driving Scenarios through Switchable Systems. IET Conf. Proc. 2025, 2025, 34–39. [Google Scholar] [CrossRef]
- Clauer, M.; Bauer, D.; Parspour, N. High-Speed Oil-Cooled PMSM with Novel Permanent Magnet Shape and Carbon Fiber Sleeved Rotor for High-Performance Powertrain. E+i Elektrotechnik Und Informationstechnik 2025, 142, 114–141. [Google Scholar] [CrossRef]
- Wellmann, C.; Khaleel, A.R.; Brinkmann, T.; Wahl, A.; Monissen, C.; Eisenbarth, M.; Andert, J. Electric Machine Co-Optimization for EV Drive Technology Development: Integrating Bayesian Optimization and Nonlinear Model Predictive Control. eTransportation 2025, 23, 100392. [Google Scholar] [CrossRef]
- Wellmann, C.; Rahkola, P.; Tota, S.S.; Pihlatie, M.; Khaleel, A.R.; Marx, C.; Sharma, A.; Eisenbarth, M.; Andert, J. Machine-Learning Integrated Multi-Domain Co-Optimization for Electrified Heavy Duty Fleets. eTransportation 2026, 27, 100511. [Google Scholar] [CrossRef]
- Mi, C. Analytical Design of Permanent-Magnet Traction-Drive Motors. IEEE Trans. Magn. 2006, 42, 1861–1866. [Google Scholar] [CrossRef]
- Oestreicher, R.; Koenen, C.; Kulzer, A.C. Analysis of Factors Influencing the Efficiency Improvement Potential of a Winding Changeover in an Electric Machine. In Proceedings of the SAE Technical Papers on CD-ROM/SAE Technical Paper Series, Stuttgart, Germany, 2025; p. 2025–01–0518. [Google Scholar] [CrossRef]
- Soong, W.; Miller, T. Theoretical Limitations to the Field-Weakening Performance of the Five Classes of Brushless Synchronous AC Motor Drive. In Proceedings of the International Conference on Electrical Machines and Drives, 1993, 1993; pp. 127–132. [Google Scholar]
- Soong, W.; Miller, T. Field-Weakening Performance of Brushless Synchronous AC Motor Drives. IEE Proc.-Electr. Power Appl. 1994, 141, 331–340. [Google Scholar] [CrossRef]
- Soong, W.; Ertugrul, N. Field-Weakening Performance of Interior Permanent-Magnet Motors. IEEE Trans. Ind. Appl. 2002, 38, 1251–1258. [Google Scholar] [CrossRef]
- Boxriker, M. Höhere Ausnutzung mehrphasiger Synchronmaschinen durch Spulen- und Polpaarzahlumschaltung. PhD thesis, Karlsruhe Institute of Technology, Karlsruhe, 2020. [Google Scholar] [CrossRef]
- Boxriker, M.; Kolb, J.; Doppelbauer, M. Determining the Volume Optimal Parameter Values for Multi-Phase Permanent Magnet Synchronous Motors with Switchable Coil Configuration. In Proceedings of the 2018 20th European Conference on Power Electronics and Applications (EPE’18 ECCE Europe), Riga, Latvia, 2018. [Google Scholar]
- Boxriker, M.; Kolb, J.; Doppelbauer, M. Effects of Coil Configuration Switching, Pole-Changing and Multi-Phase Windings on Permanent Magnet Synchronous Motors. In Proceedings of the IECON 2017 - 43rd Annual Conference of the IEEE Industrial Electronics Society, Beijing, 2017; pp. 1925–1932. [Google Scholar] [CrossRef]
- Boxriker, M.; Winzer, P.; Kolb, J.; Doppelbauer, M. Increasing the Operating Range of Permanent Magnet Synchronous Motors by Switching the Winding Configurations. In Proceedings of the 2016 IEEE 2nd Annual Southern Power Electronics Conference (SPEC), Auckland, New Zealand, 2016; pp. 1–6. [Google Scholar] [CrossRef]
- Layek, K.; Roy, D.; Hatua, K. A Split-Tapped Interior Permanent Magnet Synchronous Machine Topology for Electric Vehicles Requiring 3-Speed Transmission. IEEE Trans. Ind. Electron. 2026, 73, 207–218. [Google Scholar] [CrossRef]
- Ge, H.; Jiang, J.; Ye, J.; Emadi, A. Behavior Study of Permanent Magnet Synchronous Machines Based on a New Normalized Model. IEEE Trans. Ind. Electron. 2019, 66, 7539–7550. [Google Scholar] [CrossRef]
- Chen, T.; Chen, L.; Chai, F. Behavior Modeling and Design of Winding-Switching Permanent Magnet Synchronous Machine System Based on Normalized Model. In Proceedings of the 2023 26th International Conference on Electrical Machines and Systems (ICEMS), 2023; pp. 5228–5232. [Google Scholar] [CrossRef]
- Pellegrino, G.; Vagati, A.; Guglielmi, P. Design Tradeoffs Between Constant Power Speed Range, Uncontrolled Generator Operation, and Rated Current of IPM Motor Drives. IEEE Trans. Ind. Appl. 2011, 47, 1995–2003. [Google Scholar] [CrossRef]
- Vera, L.J.F.C.; Hsieh, M.F. Investigating the Impact of Characteristic Current on IPMSM Efficiency Area in Flux-Weakening Region. IEEE Trans. Magn. 2024, 60, 1–6. [Google Scholar] [CrossRef]
- Jansson, E.; Grunditz, E.; Thiringer, T. Impact of Saturation and Scaling on the Field Weakening Performance of an Interior PM Machine. In Proceedings of the 2020 International Conference on Electrical Machines (ICEM), Gothenburg, Sweden, 2020; pp. 1136–1142. [Google Scholar] [CrossRef]
- Wang, H.; Kallur-Krishnamoorthy, R.; Neuhaus, C.; Andert, J. Integrated DC Boost Charger in Post-800V Architecture with Open-End Winding Machine – Magnetic-Domain Modelling and Torque Analysis. In Proceedings of the 2026 Stuttgart International Symposium, Stuttgart, Germany, 2026; p. 2026–01–0739. [Google Scholar] [CrossRef]
- Pellegrino, G.; Bianchi, N.; Cupertino, F.; Jahns, T.M.; Soong, W.L. The Rediscovery of Synchronous Reluctance and Ferrite Permanent Magnet Motors: Tutorial Course Notes . In SpringerBriefs in Electrical and Computer Engineering, 1st ed. 2016 ed.; Springer International Publishing: Imprint: Springer: Cham, 2016. [Google Scholar] [CrossRef]
- Ansys, Inc. Ansys Motor-CAD User Guide Version 2025 R2. Available online: https://ansyshelp.ansys.com/public/account/secured?returnurl=/Views/Secured/MotorCAD/v252/en/Motor-CAD_UG/MotorCAD/topics/motor-cadmanual.html.
- Fornasiero, E.; Bianchi, N.; Soong, W.L. Analysis of Torque versus Current Capability of Reluctance and Interior PM Machines under Limited Current and Flux-Linkage Operation. In Proceedings of the 2014 IEEE Energy Conversion Congress and Exposition (ECCE), Pittsburgh, PA, USA, 2014; pp. 4162–4169. [Google Scholar] [CrossRef]
- Ionel, D.M.; Popescu, M.; McGilp, M.; Miller, T.; Dellinger, S.; Heideman, R.J. Computation of Core Losses in Electrical Machines Using Improved Models for Laminated Steel. Proceedings of the Conference Record of the 2006 IEEE Industry Applications Conference Forty-First IAS Annual Meeting 2006, Vol. 2, 827–835. [Google Scholar] [CrossRef]
- Ruoho, S.; Santa-Nokki, T.; Kolehmainen, J.; Arkkio, A. Modeling Magnet Length In 2-D Finite-Element Analysis of Electric Machines. IEEE Trans. Magn. 2009, 45, 3114–3120. [Google Scholar] [CrossRef]
- Volpe, G.; Popescu, M.; Marignetti, F.; Goss, J. AC Winding Losses in Automotive Traction E-Machines: A New Hybrid Calculation Method. In Proceedings of the 2019 IEEE International Electric Machines & Drives Conference (IEMDC), 2019; pp. 2115–2119. [Google Scholar] [CrossRef]
- Goss, J.; Mellor, P.H.; Wrobel, R.; Staton, D.A.; Popescu, M. The Design of AC Permanent Magnet Motors for Electric Vehicles: A Computationally Efficient Model of the Operational Envelope. In Proceedings of the 6th IET International Conference on Power Electronics, Machines and Drives (PEMD 2012), 2012; pp. 1–6. [Google Scholar] [CrossRef]
- Stipetic, S.; Goss, J.; Zarko, D.; Popescu, M. Calculation of Efficiency Maps Using a Scalable Saturated Model of Synchronous Permanent Magnet Machines. IEEE Trans. Ind. Appl. 2018, 54, 4257–4267. [Google Scholar] [CrossRef]
Figure 2.
Exemplary torque-speed envelopes of anchor and reconfigured configurations, with the corresponding points of reference used in the definitions of figures of merit in Table 4.
Figure 2.
Exemplary torque-speed envelopes of anchor and reconfigured configurations, with the corresponding points of reference used in the definitions of figures of merit in Table 4.
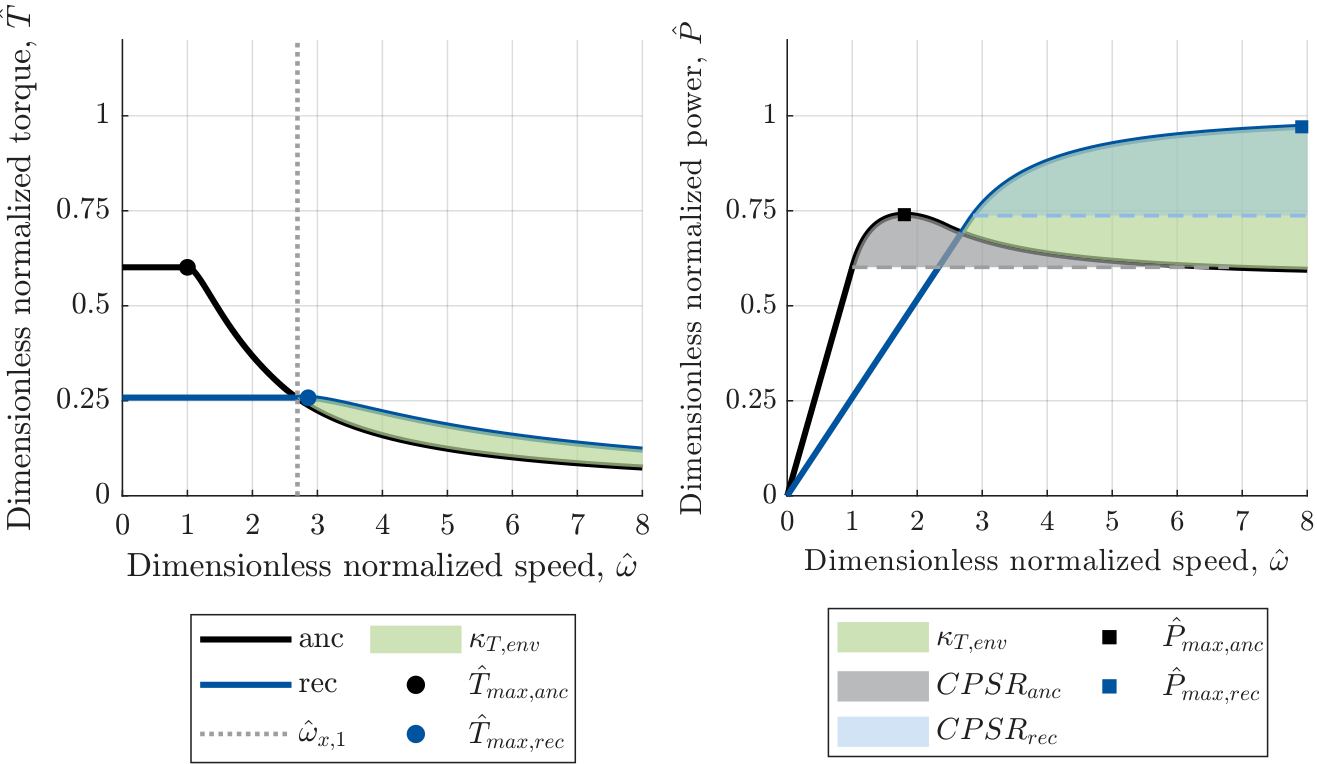
Figure 3.
Selected value pairs from the parameter plane, with corresponding torque-speed envelopes for the anchor and reconfigured topologies.
Figure 3.
Selected value pairs from the parameter plane, with corresponding torque-speed envelopes for the anchor and reconfigured topologies.
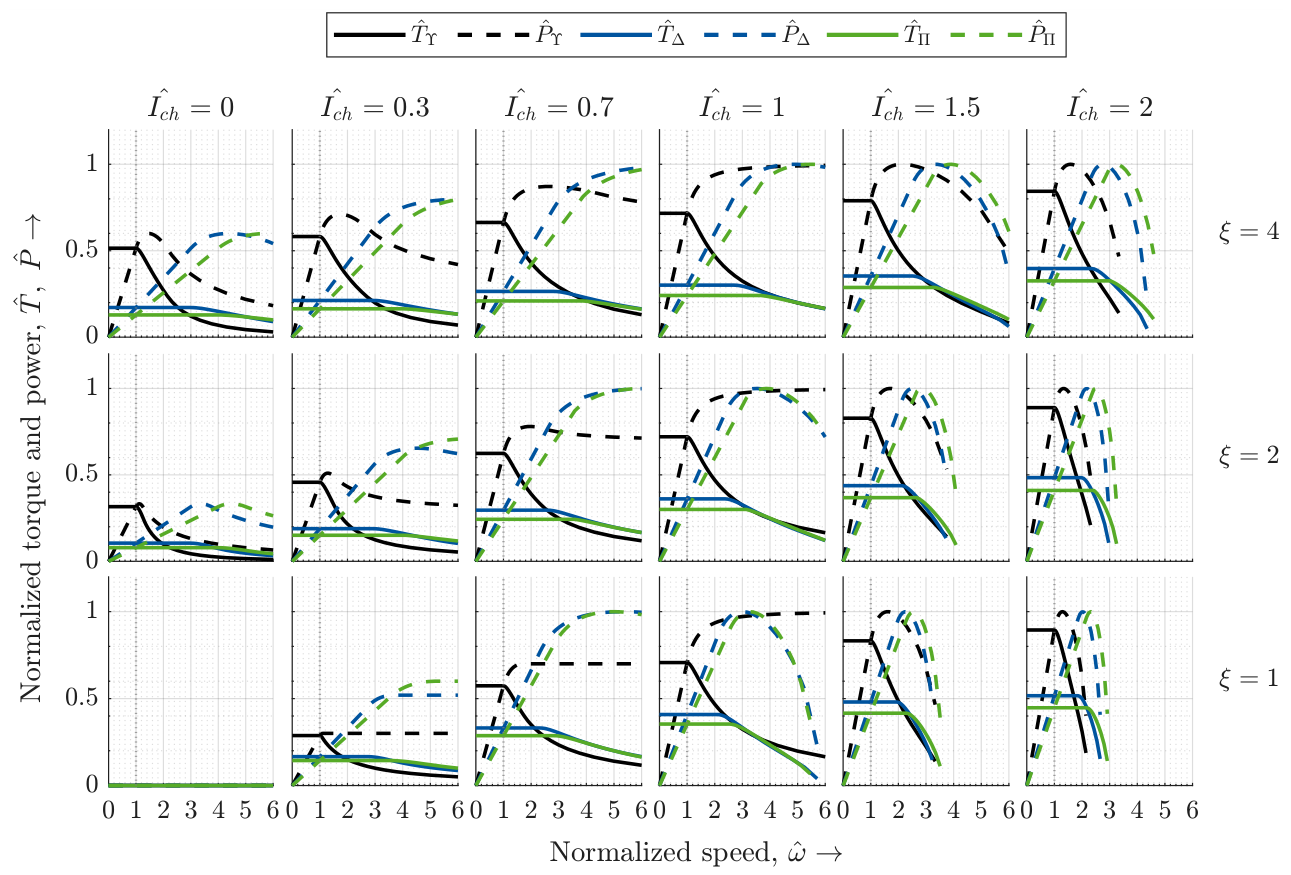
Figure 4.
Dynamometer test bench for machine M3. Numbered components are listed in Table A2.
Figure 4.
Dynamometer test bench for machine M3. Numbered components are listed in Table A2.
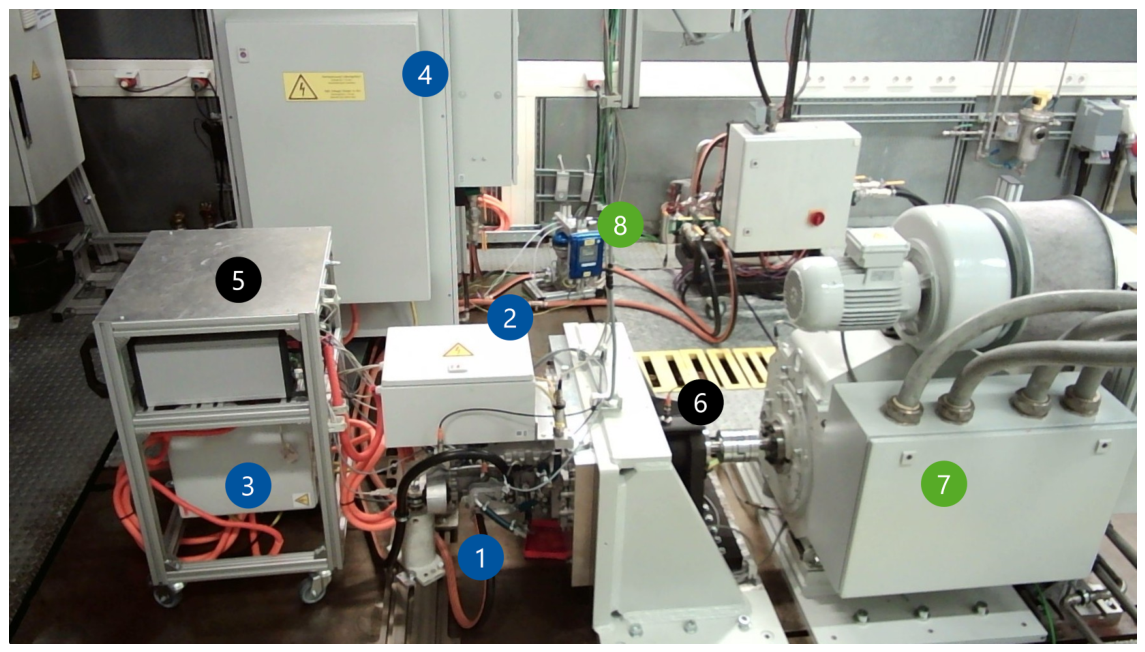
Figure 5.
Single point metric: Maximum performance FoMs (, ) and Crossover point FoMs (, ) for – and – AWR topologies.
Figure 5.
Single point metric: Maximum performance FoMs (, ) and Crossover point FoMs (, ) for – and – AWR topologies.
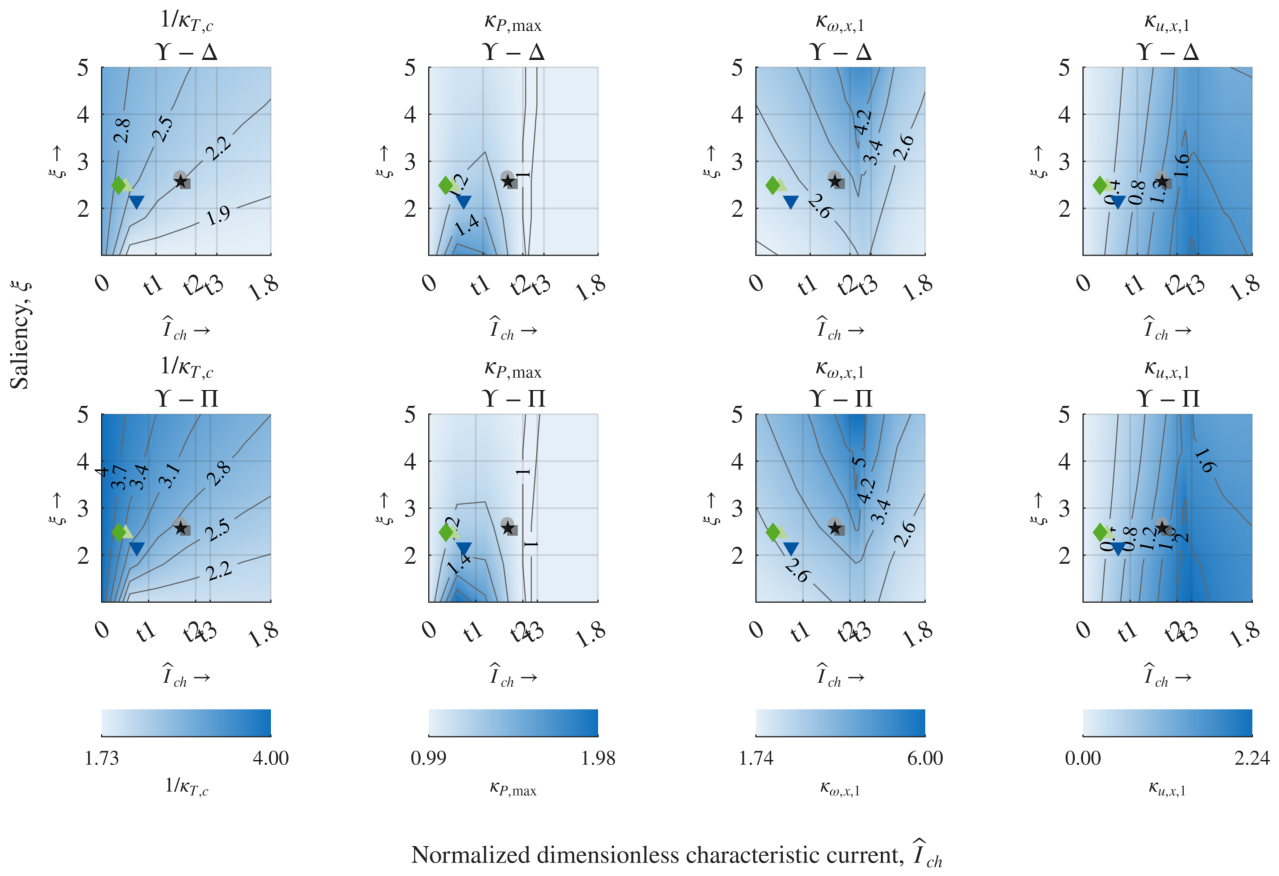
Figure 6.
Envelope & area metrics: CPSR FoMs (, ) and part-load performance FoMs (, ) for – and – AWR topologies.
Figure 6.
Envelope & area metrics: CPSR FoMs (, ) and part-load performance FoMs (, ) for – and – AWR topologies.
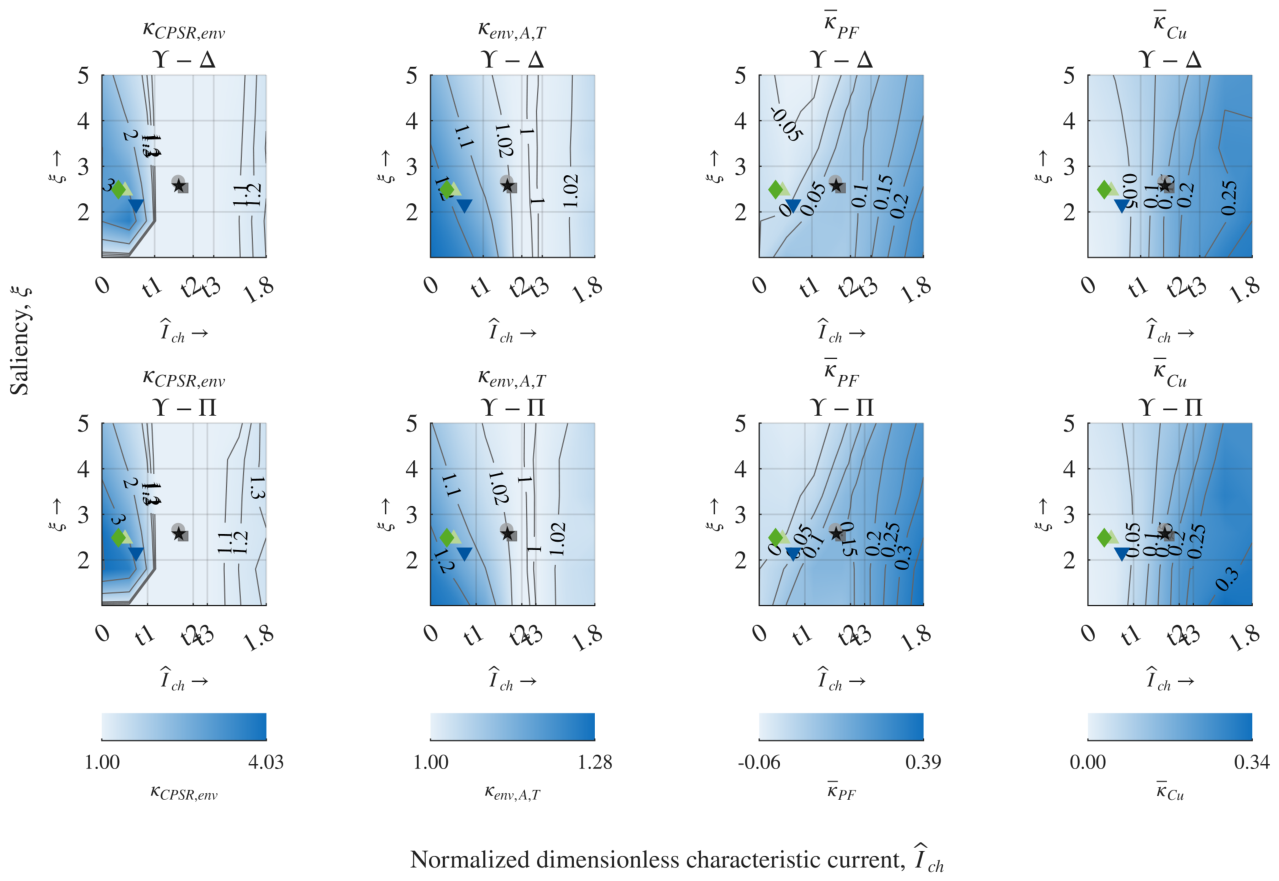
Figure 7.
Torque–speed envelopes from FEA and the analytical NPP model for the – pair across M1–M6.
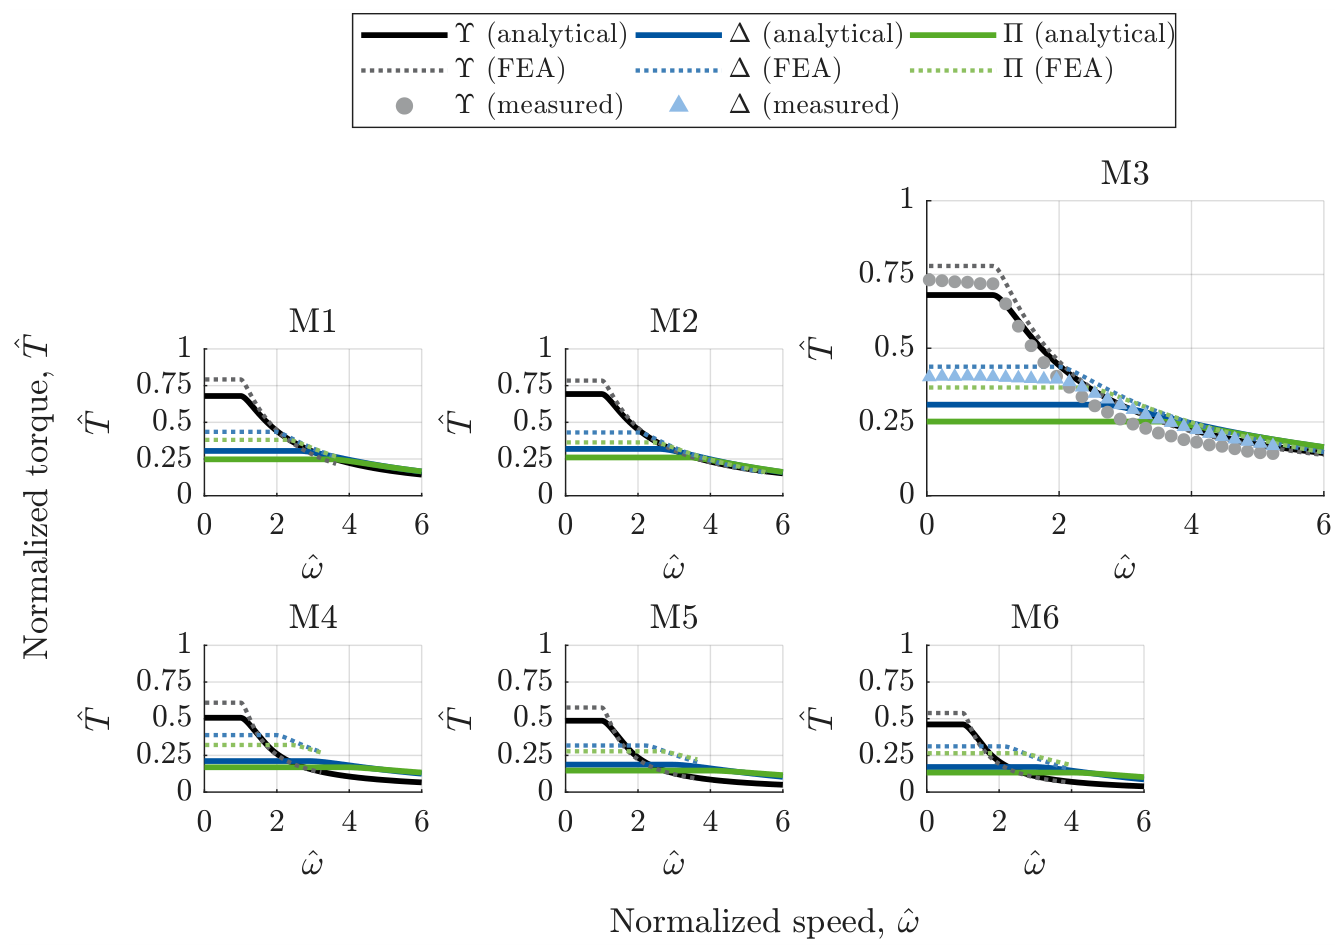
Figure 8.
Comparison of analytical and FEA-based FoM values across M1–M6, including measurement results from machine M3; correlation coefficient r indicates trend agreement.
Figure 8.
Comparison of analytical and FEA-based FoM values across M1–M6, including measurement results from machine M3; correlation coefficient r indicates trend agreement.
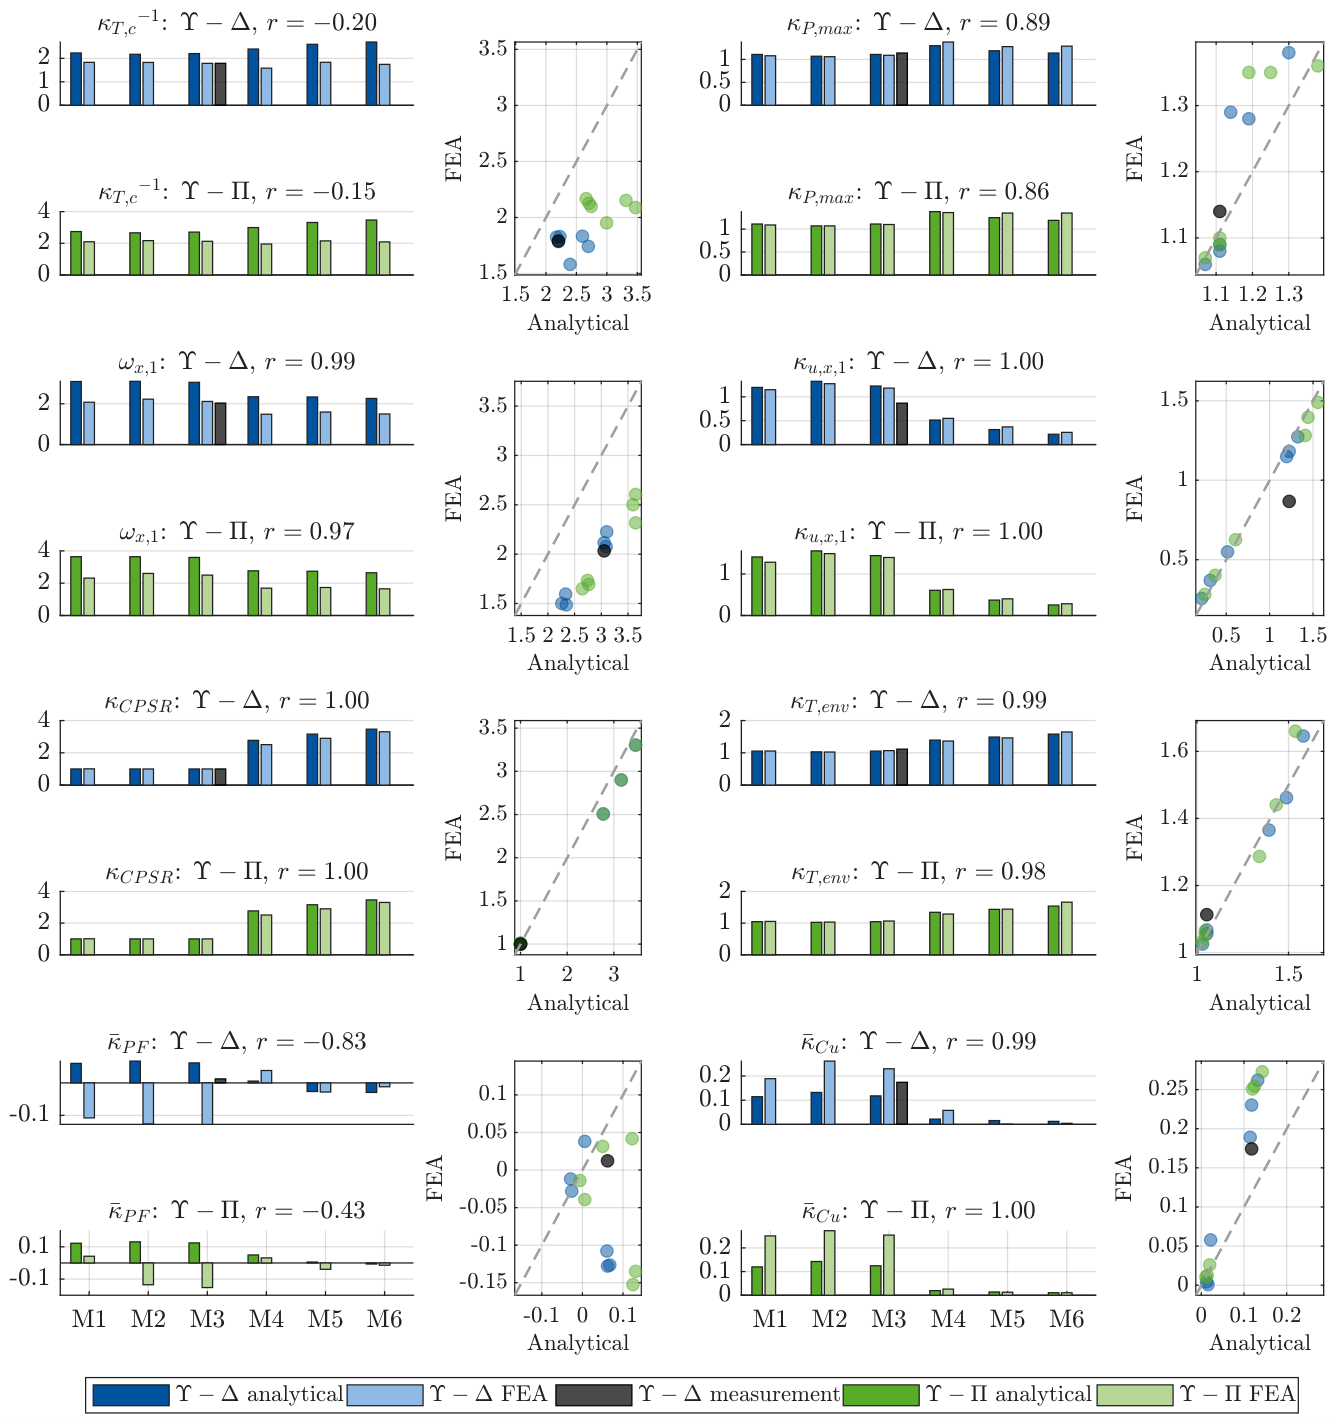
Figure 9.
FEA vs. analytical NPP normalized torque–current characteristics for the – pair, machine M6, base-speed region.
Figure 9.
FEA vs. analytical NPP normalized torque–current characteristics for the – pair, machine M6, base-speed region.
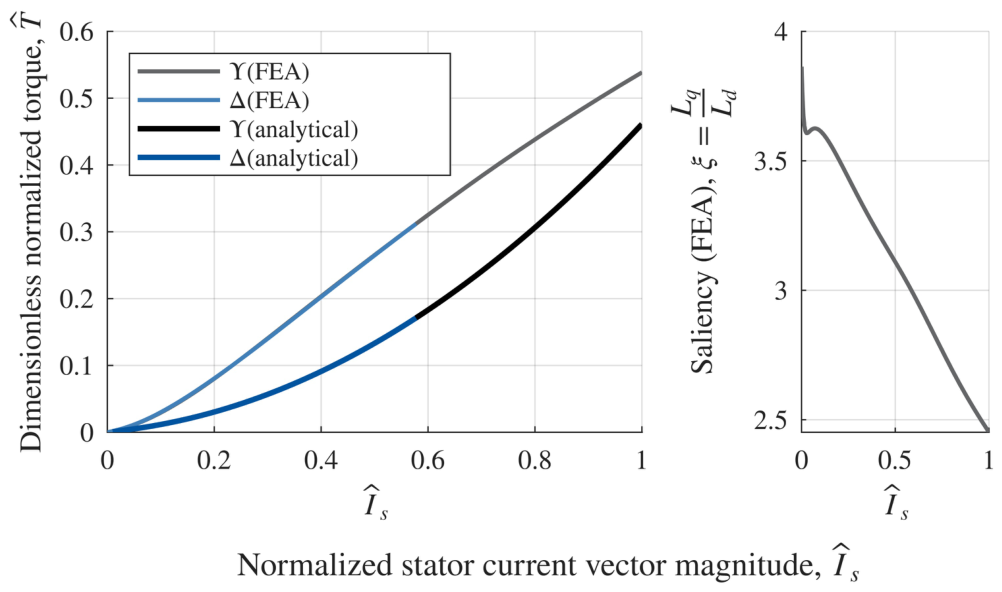
Table 1.
AWR topologies and normalized reconfiguration parameters used in this work.
| Topology | Symbol | Switches | |||
|---|---|---|---|---|---|
| Star | 1 | 1 | 1 | - | |
| Delta | 1 | 5 | |||
| Parallel | 1 | 1 | 9 |
1 Anchor configuration denoted by ; reconfigured state denoted by . Voltage and current ratios are defined at the phase terminals — for parallel configuration, the phase current is unchanged, but the current density in each parallel branch is halved.
Table 2.
Normalized model parameters for the AWR configurations
| Parameter | Remark | |||
|---|---|---|---|---|
| Reconfiguration factor | ||||
| Normalized current limit | ||||
| Normalized voltage limit | ||||
| 1 | 1 | Turns per phase ratio |
Table 3.
Definitions used in the derivation of figures of merit.
| Helper | Symbol | Equation | Physical meaning / design relevance |
|---|---|---|---|
| Torque difference | Pointwise torque difference used to locate the first crossover speed. | ||
| Common valid speed interval | Shared speed range over which anchor and reconfigured envelopes are compared. | ||
| Composite envelope torque | Pointwise composite torque envelope used in the area-ratio definition. | ||
| CPSR threshold speed | Speed at which constant-power operation ends for a given torque level. | ||
| Rated CPSR power | Constant-power threshold fixed at the corner point. | ||
| Composite power envelope | Pointwise power envelope used to compute composite CPSR. | ||
| Common operating area | Intersection of feasible operating areas of both configurations. |
Table 4.
Figures of merit used to quantify the benefit of reconfiguration.
| FoM | Symbol | Equation | Physical meaning / design relevance |
|---|---|---|---|
| Maximum performance FoMs | |||
| Corner-point torque ratio | Base-speed torque ratio; values below unity indicate a torque penalty for reconfiguration. | ||
| Peak power ratio | Ratio of absolute peak powers, ; values above unity indicate a peak-power benefit. | ||
| Crossover point FoMs | |||
| First crossover speed | Speed at which the torque envelopes first crossover; lower values indicate earlier benefit from reconfiguration. | ||
| Crossover voltage-stress factor | Normalized induced voltage at the crossover speed; indicates voltage-stress and mode-shift risk. | ||
| CPSR FoMs | |||
| Composite AWR CPSR | System-level CPSR gain of the reconfigured drive relative to the anchor drive. | ||
| Composite torque-area ratio | Fractional expansion of the torque–speed operating area over the common speed interval. | ||
| Part-load performance FoMs | |||
| Mean PF improvement | Area-averaged PF gain over the common operating map. | ||
| Mean copper-loss improvement | Area-averaged copper-loss reduction over the common operating map. | ||
* All ratios are (reconfigured over anchor) unless stated otherwise. Values above unity indicate an improvement relative to the anchor configuration. The subscript denotes the composite envelope formed from the pointwise maximum of both configurations.
Table 5.
Machine specifications for baseline machines M1–M6.
| Parameter | M1 | M2 | M32 | M4 | M53 | M62 |
|---|---|---|---|---|---|---|
| Symbol | • | ▪ | ★ | ▾ | ⧫ | ▴ |
| Rotor topology | IPMSM | IPMSM | IPMSM | IPMSM | PMaSynRM | PMaSynRM |
| Magnet material | NdFeB | NdFeB | NdFeB | NdFeB | Ferrite | Ferrite |
| Magnet layout1 | ▿ | |||||
| Stator slots | 48 | 48 | 48 | 72 | 72 | 72 |
| Pole-pairs | 4 | 4 | 4 | 3 | 3 | 3 |
| System voltage in | 400 | 800 | 800 | 800 | 1200 | 1200 |
| Maximum RMS line current in | 600 | 230 | 180 | 530 | 280 | 280 |
| Maximum mechanical torque in | 310 | 350 | 342 | 455 | 387 | 391 |
| Maximum mechanical power in | 170 | 130 | 100 | 250 | 192 | 169 |
| Maximum rotational speed in / | 15000 | 17000 | 17000 | 20000 | 15000 | 15000 |
| Active parts outer diameter in | 220 | 200 | 200 | 234 | 234 | 234 |
| Active length in | 175 | 156 | 156 | 130 | 130 | 130 |
1 Magnet-layout symbols: ▿ denotes an inverse-delta layout; and denote single- and double-layer V-shaped layouts; and denote four- and five-layer U-shaped layouts. 2 Machine M3 is an open-end winding machine used for measurement. 3 M1–M4 are commercially available traction machines used as reference machines. M5 and M6 are virtual ferrite PMaSynRM benchmark designs derived from M4.
Table 6.
Comparison of FoMs from analytical, FEA, and measurement results for machine M3.
| Method | ||||||||||
|---|---|---|---|---|---|---|---|---|---|---|
| Analytical | 0.45 | 1.11 | 3.05 | 1.23 | 1.00 | 1.05 | 0.06 | 0.12 | ||
| FEA | 0.84 | 2.57 | 0.56 | 1.09 | 2.12 | 1.18 | 1.00 | 1.07 | -0.13 | 0.23 |
| Measurement | 0.81 | 2.66 | 0.61 | 1.21 | 1.94 | 1.16 | 1.00 | 1.11 | -0.02 | 0.01 |
Table 7.
Key implications of the AWR comparison FoMs over the parameter plane, including agreement with FEA models.
Table 7.
Key implications of the AWR comparison FoMs over the parameter plane, including agreement with FEA models.
| Figure of merit | Symbol | Key implication (design message) | FEA correlation |
|---|---|---|---|
| Maximum performance FoMs | |||
| Corner-point torque ratio | Reconfiguration incurs a base-speed torque penalty relative to the anchor state; the disadvantage is most pronounced at low and high . | Low | |
| Peak power ratio | Peak-power benefit depends on : for , reconfiguration does not increase the achievable peak power, independent of . | High | |
| Crossover point FoMs | |||
| First crossover speed | Reconfiguration becomes advantageous at lower speed when both and are low; tends to earlier crossover than due to its lower . | High | |
| Crossover voltage-stress factor | The highest voltage stress and associated mode-shift risk occur near across ; generally yields lower stress than . | High | |
| CPSR FoMs | |||
| Composite AWR CPSR | determines CPSR gain: strong improvement occurs for , while designs near show negligible benefit; higher reduces the relative gain. | High | |
| Composite torque-envelope area ratio | Torque–speed area expands significantly for , with the largest gains at low ; near , no gain is expected. | High | |
| Part-load performance FoMs | |||
| Mean PF improvement | Improvement is favored by higher and lower ; low combined with high can lead to deterioration. | Low | |
| Mean copper-loss improvement | Reconfiguration can reduce part-load copper losses even when envelope gains are small, subject to the common operating area; for the same parameters, – gives a larger reduction than –. | High | |
Disclaimer/Publisher’s Note: The statements, opinions and data contained in all publications are solely those of the individual author(s) and contributor(s) and not of MDPI and/or the editor(s). MDPI and/or the editor(s) disclaim responsibility for any injury to people or property resulting from any ideas, methods, instructions or products referred to in the content. |
© 2026 by the authors. Licensee MDPI, Basel, Switzerland. This article is an open access article distributed under the terms and conditions of the Creative Commons Attribution (CC BY) license.
Copyright: This open access article is published under a Creative Commons CC BY 4.0 license, which permit the free download, distribution, and reuse, provided that the author and preprint are cited in any reuse.