

Submitted:
10 September 2026
Posted:
14 September 2026
You are already at the latest version
Abstract
Background: Hypoxemia after bidirectional Glenn palliation can result from several distinct physiologic mechanisms that may produce similar arterial oxygen saturation. We evaluated whether routinely available bedside markers can help distinguish these mechanisms in a mechanistic virtual-patient model.Methods: A steady-state zero-dimensional closed-loop model generated five causes of Glenn hypoxemia: elevated pulmonary vascular resistance, Veno venous collateral shunting, pulmonary gas-exchange impairment, increased metabolic demand, and ventricular dysfunction. The underlying physiologic variables responsible for each mechanism were hidden from the classifier. Machine-learning models used only bedside-observable variables: SpO₂, heart rate, mean arterial pressure, hemoglobin, Glenn/SVC pressure, and SVC oxygen saturation. Multinomial logistic regression was evaluated in a held-out test cohort, with random forest as a nonlinear comparator.Results: Among 150,000 generated states, 70,529 met prespecified hypoxemia and physiologic criteria; after class balancing, 26,905 virtual patients were analyzed. SpO₂ alone provided limited mechanistic discrimination (accuracy 26.8%; macro-AUROC 0.584). The multivariable bedside model improved accuracy to 59.1% (95% CI 57.9%–60.2%) and macro-AUROC to 0.865 (95% CI 0.860–0.871). Elevated pulmonary vascular resistance was most readily identified, with Glenn/SVC pressure providing the largest incremental contribution to classification. Veno venous collateral shunting and pulmonary gas-exchange impairment remained the principal areas of overlap. When compensatory systemic vasoconstriction was incorporated into ventricular dysfunction, systemic flow could fall despite preserved mean arterial pressure, reducing the discriminatory value of blood pressure alone.Conclusions: Bedside interpretation of Glenn hypoxemia should extend beyond arterial oxygen saturation. In this mechanistic model, Glenn/SVC pressure and venous oxygen saturation substantially improved distinction among physiologic causes of hypoxemia, while preserved arterial pressure did not reliably indicate preserved systemic flow. These findings support a physiology-based, multivariable approach to evaluating Glenn hypoxemia and provide specific hypotheses for prospective clinical validation.
Keywords:
bidirectional Glenn
; hypoxemia
; machine learning
; bedside monitoring
; central venous pressure
; venous oxygen saturation
; single ventricle
Introduction
Hypoxemia is common in patients with bidirectional Glenn physiology, but arterial oxygen saturation alone provides limited information about the mechanism producing it. Following the Glenn, superior vena caval blood reaches the pulmonary arteries without a subpulmonary ventricle, making pulmonary blood flow dependent on systemic venous return, the transpulmonary pressure gradient, pulmonary vascular resistance, and downstream atrial pressure [1,2,6]. Consequently, similar systemic oxygen saturations may occur in markedly different hemodynamic states.
Several mechanisms can contribute to Glenn hypoxemia. Increased pulmonary vascular resistance may impair passive pulmonary blood flow and increase Glenn pressure [2,6,14], whereas venovenous collaterals permit systemic venous blood to bypass effective pulmonary oxygenation and may decompress the superior caval circulation [3,4]. Pulmonary gas-exchange abnormalities can reduce systemic saturation without a corresponding reduction in pulmonary blood flow; in Glenn patients, supplemental oxygen has been shown to increase arterial saturation without materially changing Qp/Qs [10]. Increased metabolic demand and reduced systemic output may further lower venous oxygen saturation through increased extraction or impaired oxygen delivery [1,5,11]. Importantly, reduced cardiac output need not initially produce hypotension: compensatory vasoconstriction can preserve arterial pressure despite falling output, and hypotension may therefore be a later sign of low-output physiology in infants [15]. These mechanisms may consequently produce similar cyanosis while generating different pressure, flow, and venous oxygenation profiles.
At the bedside, however, these underlying physiologic disturbances are not directly measured. Clinicians instead integrate readily available variables such as SpO2, systemic arterial pressure, Glenn or central venous pressure, heart rate, hemoglobin concentration, and superior vena caval or central venous oxygen saturation. Clinical observations support the value of considering these signals together. During transient obstruction of the cavopulmonary pathway, increased central venous pressure has been accompanied by decreases in SpO2, central venous oxygen saturation, and cerebral near-infrared spectroscopy [13]. Similarly, pulmonary vasodilation with inhaled nitric oxide after Glenn has been associated with lower central venous pressure and improved arterial and venous oxygen saturation [14]. Whether combinations of these routinely available bedside measurements contain sufficient information to distinguish among major mechanisms of Glenn hypoxemia has not been systematically evaluated.
We therefore developed a physiology-based virtual-patient model in which the underlying cause of hypoxemia was known but withheld from the classifier. We tested whether machine learning using only routinely available bedside markers could distinguish five major physiologic mechanisms: elevated pulmonary vascular resistance, venovenous collateral shunting, pulmonary gas-exchange impairment, increased metabolic demand, and ventricular dysfunction. We hypothesized that arterial oxygen saturation alone would provide limited mechanistic discrimination, whereas the addition of pressure and venous oxygenation measurements would substantially improve classification.
Methods
Study Design and Two-Layer Modeling Strategy
This was a mechanistic computational study. The model had two deliberately separated layers. The hidden physiology layer generated a known cause of hypoxemia and solved the associated circulation. The observation layer converted that state into measurements that could plausibly be obtained in clinical care. Only observation-layer variables were provided to the machine-learning models. Hidden PVR, pulmonary flow, systemic flow, oxygen consumption, collateral flow, pulmonary venous oxygenation, and ventricular pump parameters were never supplied to the classifier. This separation was intended to prevent information leakage and to make the classification question clinically interpretable.
Closed-Loop Glenn Circulation
A steady-state zero-dimensional model represented a bidirectional Glenn without additional antegrade pulmonary blood flow. All flows were indexed to body surface area. The circuit contained an upper-body systemic pathway, the SVC/Glenn pathway, a pulmonary pathway, a lower-body systemic pathway, and the common atrial/systemic ventricular compartment. The model enforced conservation of flow, so pressure and flow could not be assigned independently. This pressure-flow framework follows prior analytical and patient-specific Glenn models [1,2,6,11].
Upper-body venous return was represented as Q_SVC = (MAP − P_SVC)/R_upper. Effective pulmonary flow was Q_p = (P_SVC − P_atrium)/R_p. Lower-body venous return was Q_IVC = (MAP − P_atrium)/R_lower. When no venovenous collateral was present, Q_SVC = Q_p. When a VVC was present, Q_VVC = (P_SVC − P_atrium)/R_VVC and conservation required Q_SVC = Q_p + Q_VVC. Thus, increased pulmonary pathway resistance raised upstream SVC/Glenn pressure and altered effective pulmonary flow, whereas a VVC provided an alternative low-pressure pathway that reduced effective pulmonary participation and partially decompressed the SVC compartment [3,4].
Ventricular Pump Representation
To avoid defining ventricular dysfunction by hypotension, the systemic ventricle was represented as an effective pressure source with an internal pump resistance. Systemic arterial pressure was solved from MAP = P_atrium + P_source − R_vent x Q_s, where P_source represents the effective pressure head generated by the ventricle and R_vent represents internal pump resistance. Total systemic flow Q_s was the sum of Q_SVC and Q_IVC and therefore depended on MAP. The ventricular-dysfunction phenotype incorporated both pump impairment and a compensatory vascular response. Effective ventricular pressure generation was reduced nonlinearly to 66%-97% of the patient-specific baseline and internal pump resistance increased by approximately 3%-58%. During mild and moderate impairment, upper- and lower-body systemic resistances increased progressively, reaching approximately 2.3 times baseline, representing compensatory vasoconstriction that could reduce systemic flow while preserving arterial pressure. In the most severe states, this compensatory increase was allowed to partially recede, permitting hypotension to emerge as a later feature. This staged response is a modeling approximation motivated by clinical observations that blood pressure may remain preserved despite falling cardiac output in neonates and young infants [15].
Numerical Solution and Physiologic Rejection Criteria
For each sampled virtual patient, the steady-state pressure-flow equations form a coupled linear system. The downstream Glenn resistance was represented as the pulmonary pathway resistance alone or as the parallel combination of pulmonary and VVC pathways when a collateral was present. The effective upper-body and lower-body conductances were then combined with the ventricular pressure-source equation, allowing MAP, SVC/Glenn pressure, Q_SVC, Q_p, Q_VVC, Q_IVC, and Q_s to be obtained algebraically in a single closed-form solution. No iterative optimizer was required. States with a singular or non-finite solution, nonpositive regional flow, or values outside the prespecified broad physiologic bounds were rejected before cohort selection. Oxygen-content and saturation equations were solved only after a valid pressure-flow state had been established.
Oxygen Transport and Saturation
Blood oxygen content was approximated as C_O2 = 1.34 x Hb x S_O2; the dissolved oxygen component was omitted from the hidden oxygen-content balance because of its small contribution in the modeled saturation range. Total oxygen consumption was divided between upper- and lower-body circulations. Regional venous oxygen content was calculated from arterial oxygen content, regional blood flow, and regional oxygen use. At the common atrial/systemic ventricular mixing point, oxygen mass conservation required Q_s x C_aO2 = Q_p x C_pvO2 + Q_VVC x C_SVCO2 + Q_IVC x C_IVCO2. SpO2 and SVC saturation were therefore outputs of the solved circulation rather than assigned class labels.
Definition of Hidden Mechanisms
Five dominant mechanisms were specified before classification. Each changed a distinct hidden physiologic element while baseline patient characteristics continued to vary. The mechanisms and their expected bedside consequences are summarized in Table 1.
Virtual-Patient Generation and Parameterization
Virtual patients were generated by Monte Carlo sampling from prespecified baseline distributions. Hemoglobin was centered at 15.0 g/dL (SD 1.4), common atrial pressure at 5 mmHg (SD 1.0), effective pulmonary pathway resistance at 3.0 WU.m2 (SD 0.65), oxygen consumption at 160 mL/min/m2 (SD 24), ventricular pressure source at 68 mmHg (SD 6.5), and ventricular internal resistance at 1.8 model resistance units (SD 0.35). Upper-body and lower-body effective systemic resistances were centered at 28 and 32 model resistance units, respectively, and varied between patients. The pressure, pulmonary-flow, PVR, and metabolic scale was anchored to published Glenn CMR, catheterization, and modeling studies [1,2,5,6,11]. Values not directly available as Glenn-specific distributions, including pump, compensatory vascular, and heart-rate response parameters, were treated explicitly as modeling assumptions and examined through ablation or sensitivity analyses.
The pulmonary gas-exchange phenotype used a hidden gas-exchange efficiency parameter that reduced pulmonary venous oxygenation without changing the underlying cavopulmonary resistance. The purpose was to represent impaired oxygen transfer while keeping the mechanism distinct from pulmonary vascular flow limitation. Because the model does not contain a full ventilation-perfusion or ventilator-response model, FiO2, PaO2, PaCO2, and pH were not used as classification features in the primary analysis.
Generation of Bedside-Observable Markers
After the hidden state was solved, the observation layer generated the primary bedside variables: SpO2, MAP, Glenn/SVC pressure, SVC saturation, hemoglobin, and heart rate. Gaussian measurement error was added to SpO2 (SD 1.2 percentage points), Glenn/SVC pressure (1 mmHg), MAP (2 mmHg), hemoglobin (0.25 g/dL), and SVC saturation (1.8 percentage points).
Heart rate was modeled as a secondary physiologic response rather than a hidden class label. A patient-specific baseline heart rate (mean 125 beats/min, SD 14) was increased according to excess metabolic demand and the degree of systemic hypotension, with additional measurement variability. Because this relation is a modeling assumption rather than a Glenn-specific validated equation, its importance was tested by removing heart rate from the classifier; the principal results were unchanged.
Respiratory variables were deliberately excluded from the primary machine-learning analysis. In preliminary development, FiO2 and PaCO2 distributions were partly linked to the simulated pulmonary gas-exchange phenotype and PaO2 was derived from the modeled arterial saturation. Using those variables for classification would therefore risk feature-definition leakage and would overstate their independent bedside information. Carbon dioxide can also alter Glenn flow and oxygenation directly [9]. A future clinical validation study should evaluate independently measured blood gases and respiratory support variables rather than synthetic respiratory surrogates.
NIRS was retained only as a secondary sensitivity feature because it was synthetically derived primarily from venous oxygenation. Lactate was removed from the main analysis: delayed production and clearance cannot be represented adequately by this steady-state model.
Cohort Selection and Prevention of Trivial Classification
A total of 150,000 candidate states were generated (30,000 per mechanism) before physiologic filtering. Broad validity filters required finite solutions, pulmonary flow 0.3-5.0 L/min/m2, systemic flow 1.0-8.0 L/min/m2, Glenn/SVC pressure 3-30 mmHg, MAP 25-100 mmHg, SpO2 40%-95%, and SVC saturation 0%-90%; 138,767 states remained. The strict cohort then required observed SpO2 65%-80%, internal Qp 0.8-3.2 L/min/m2, internal Qs 1.8-6.0 L/min/m2, and Glenn/SVC pressure 5-24 mmHg; 70,529 states met these criteria. Qp and Qs were used only as hidden plausibility filters and were never exposed to the classifier. Restricting SpO2 to 65%-80% deliberately forced substantial overlap in cyanosis severity.
Because the five simulated mechanisms had different acceptance rates after physiologic filtering, the machine-learning dataset was down-sampled to the smallest class. The final balanced cohort contained 26,905 patients (5,381 per mechanism). Stratified sampling assigned 20,178 observations (75%) to training and 6,727 (25%) to held-out testing. A fixed random seed (20260812) was used for generation, balancing, and data splitting.
Machine-Learning Models and Statistical Analysis
Three prespecified information levels were evaluated. Model 1 used SpO2 alone. Model 2 represented noninvasive bedside information and used SpO2, heart rate, MAP, and hemoglobin. Model 3, the primary Glenn bedside model, added Glenn/SVC pressure and SVC saturation. A secondary NIRS-augmented model tested whether synthetic NIRS added information to Model 3. Hidden PVR, Qp, Qs, oxygen consumption, VVC flow, pulmonary gas-exchange efficiency, ventricular pump parameters, and synthetic respiratory variables were never supplied to the primary classifier.
The primary classifier was multinomial logistic regression after standardization using training-set parameters. A 500-tree random forest with class weighting served as a nonlinear comparator. Performance was assessed only in the held-out test set using overall five-class accuracy and macro-averaged one-versus-rest AUROC. For the primary model, 1,000 bootstrap resamples of the held-out test set provided 95% confidence intervals for overall accuracy, macro-AUROC, and mechanism-specific recall. A normalized confusion matrix characterized misclassification patterns. Leave-one-variable-out ablation quantified the incremental contribution of each primary bedside marker.
Sensitivity analyses independently regenerated the virtual population after doubling measurement error, shifting hemoglobin by +/-2 g/dL, changing baseline pulmonary resistance by -20% or +25%, and changing baseline oxygen consumption by -15% or +20%. The same validity filters were applied in each scenario, after which the five classes were independently rebalanced to the smallest available class. Consequently, sensitivity-analysis sample sizes differ from the primary cohort and from one another. Phenotype definitions and classifier specifications were not retuned within sensitivity scenarios.
Reference-State Physiologic Plausibility Check
Before phenotype generation, an unperturbed reference population was simulated using the same baseline distributions but without a disease-specific perturbation. This was a descriptive plausibility check rather than patient-level external validation. Model-generated pulmonary flow and Glenn/SVC pressure were compared with the scale of published CMR and catheterization measurements [2,6].
Results
Cohort Generation and Bedside-Marker Distributions
Of 150,000 candidate states generated in total (30,000 per mechanism), 138,767 passed broad physiologic validity filters and 70,529 met the strict hypoxemia/hemodynamic criteria. After balancing, 26,905 virtual patients were analyzed, with 5,381 per mechanism. The training set contained 20,178 observations and the held-out test set 6,727.
Reference-State Physiologic Plausibility
In 25,000 unperturbed reference simulations, the physiologically valid population produced mean effective pulmonary flow of 2.01 +/- 0.34 L/min/m2 and mean Glenn/SVC pressure of 11.0 +/- 1.8 mmHg. The pulmonary-flow value was similar to the summed CMR LPA and RPA flow reported by Laudenschlager et al. (0.971 + 0.998 = 1.97 L/min/m2) [2], and the modeled Glenn pressure was within the low-teen SVC pressure range reported across contemporary multicenter Glenn catheterization data [6]. This check supports the scale of the unperturbed circulation but is not patient-level validation.
Bedside-Marker Distributions
SpO2 intentionally overlapped across mechanisms, with median values between 69.0% and 72.7% (Table 2). Elevated PVR showed the highest Glenn/SVC pressure, whereas increased metabolic demand showed the lowest SVC saturation and the highest heart rate. After incorporating compensatory systemic vasoconstriction, ventricular dysfunction no longer produced uniformly low arterial pressure: its median MAP was 64.4 mmHg, with substantial overlap with the other mechanisms, despite lower hidden systemic flow. The 95% simulation intervals overlapped substantially across several bedside variables, demonstrating why no single marker uniquely identified the mechanism.
Within the ventricular-dysfunction phenotype, the model reproduced a compensated low-output phase. Median MAP was 64.7 mmHg in mild states and 64.3 mmHg in moderate states, while median systemic flow fell from 3.10 to 2.20 L/min/m2. In severe states, median MAP decreased to 51.2 mmHg as systemic flow remained low at 2.06 L/min/m2. SVC saturation fell and heart rate increased across this progression. Thus, hypotension emerged principally after compensatory vascular responses became insufficient rather than serving as the initial marker of reduced systemic flow.
Classification Using Progressively Available Bedside Information
SpO2 alone provided little mechanistic discrimination (26.8% accuracy; macro-AUROC 0.584). The noninvasive bedside model increased accuracy to 32.3% and macro-AUROC to 0.656. The primary Glenn bedside model achieved 59.1% accuracy (95% CI 57.9%-60.2%) and macro-AUROC 0.865 (95% CI 0.860-0.871). Adding NIRS did not materially change performance (59.1%; macro-AUROC 0.865), supporting its secondary role in this synthetic steady-state framework.
Random forest accuracy was 57.5% (macro-AUROC 0.849) using the same inputs as the primary Glenn bedside logistic model, providing no advantage over the interpretable classifier.
Mechanism-Specific Performance and Variable Contribution
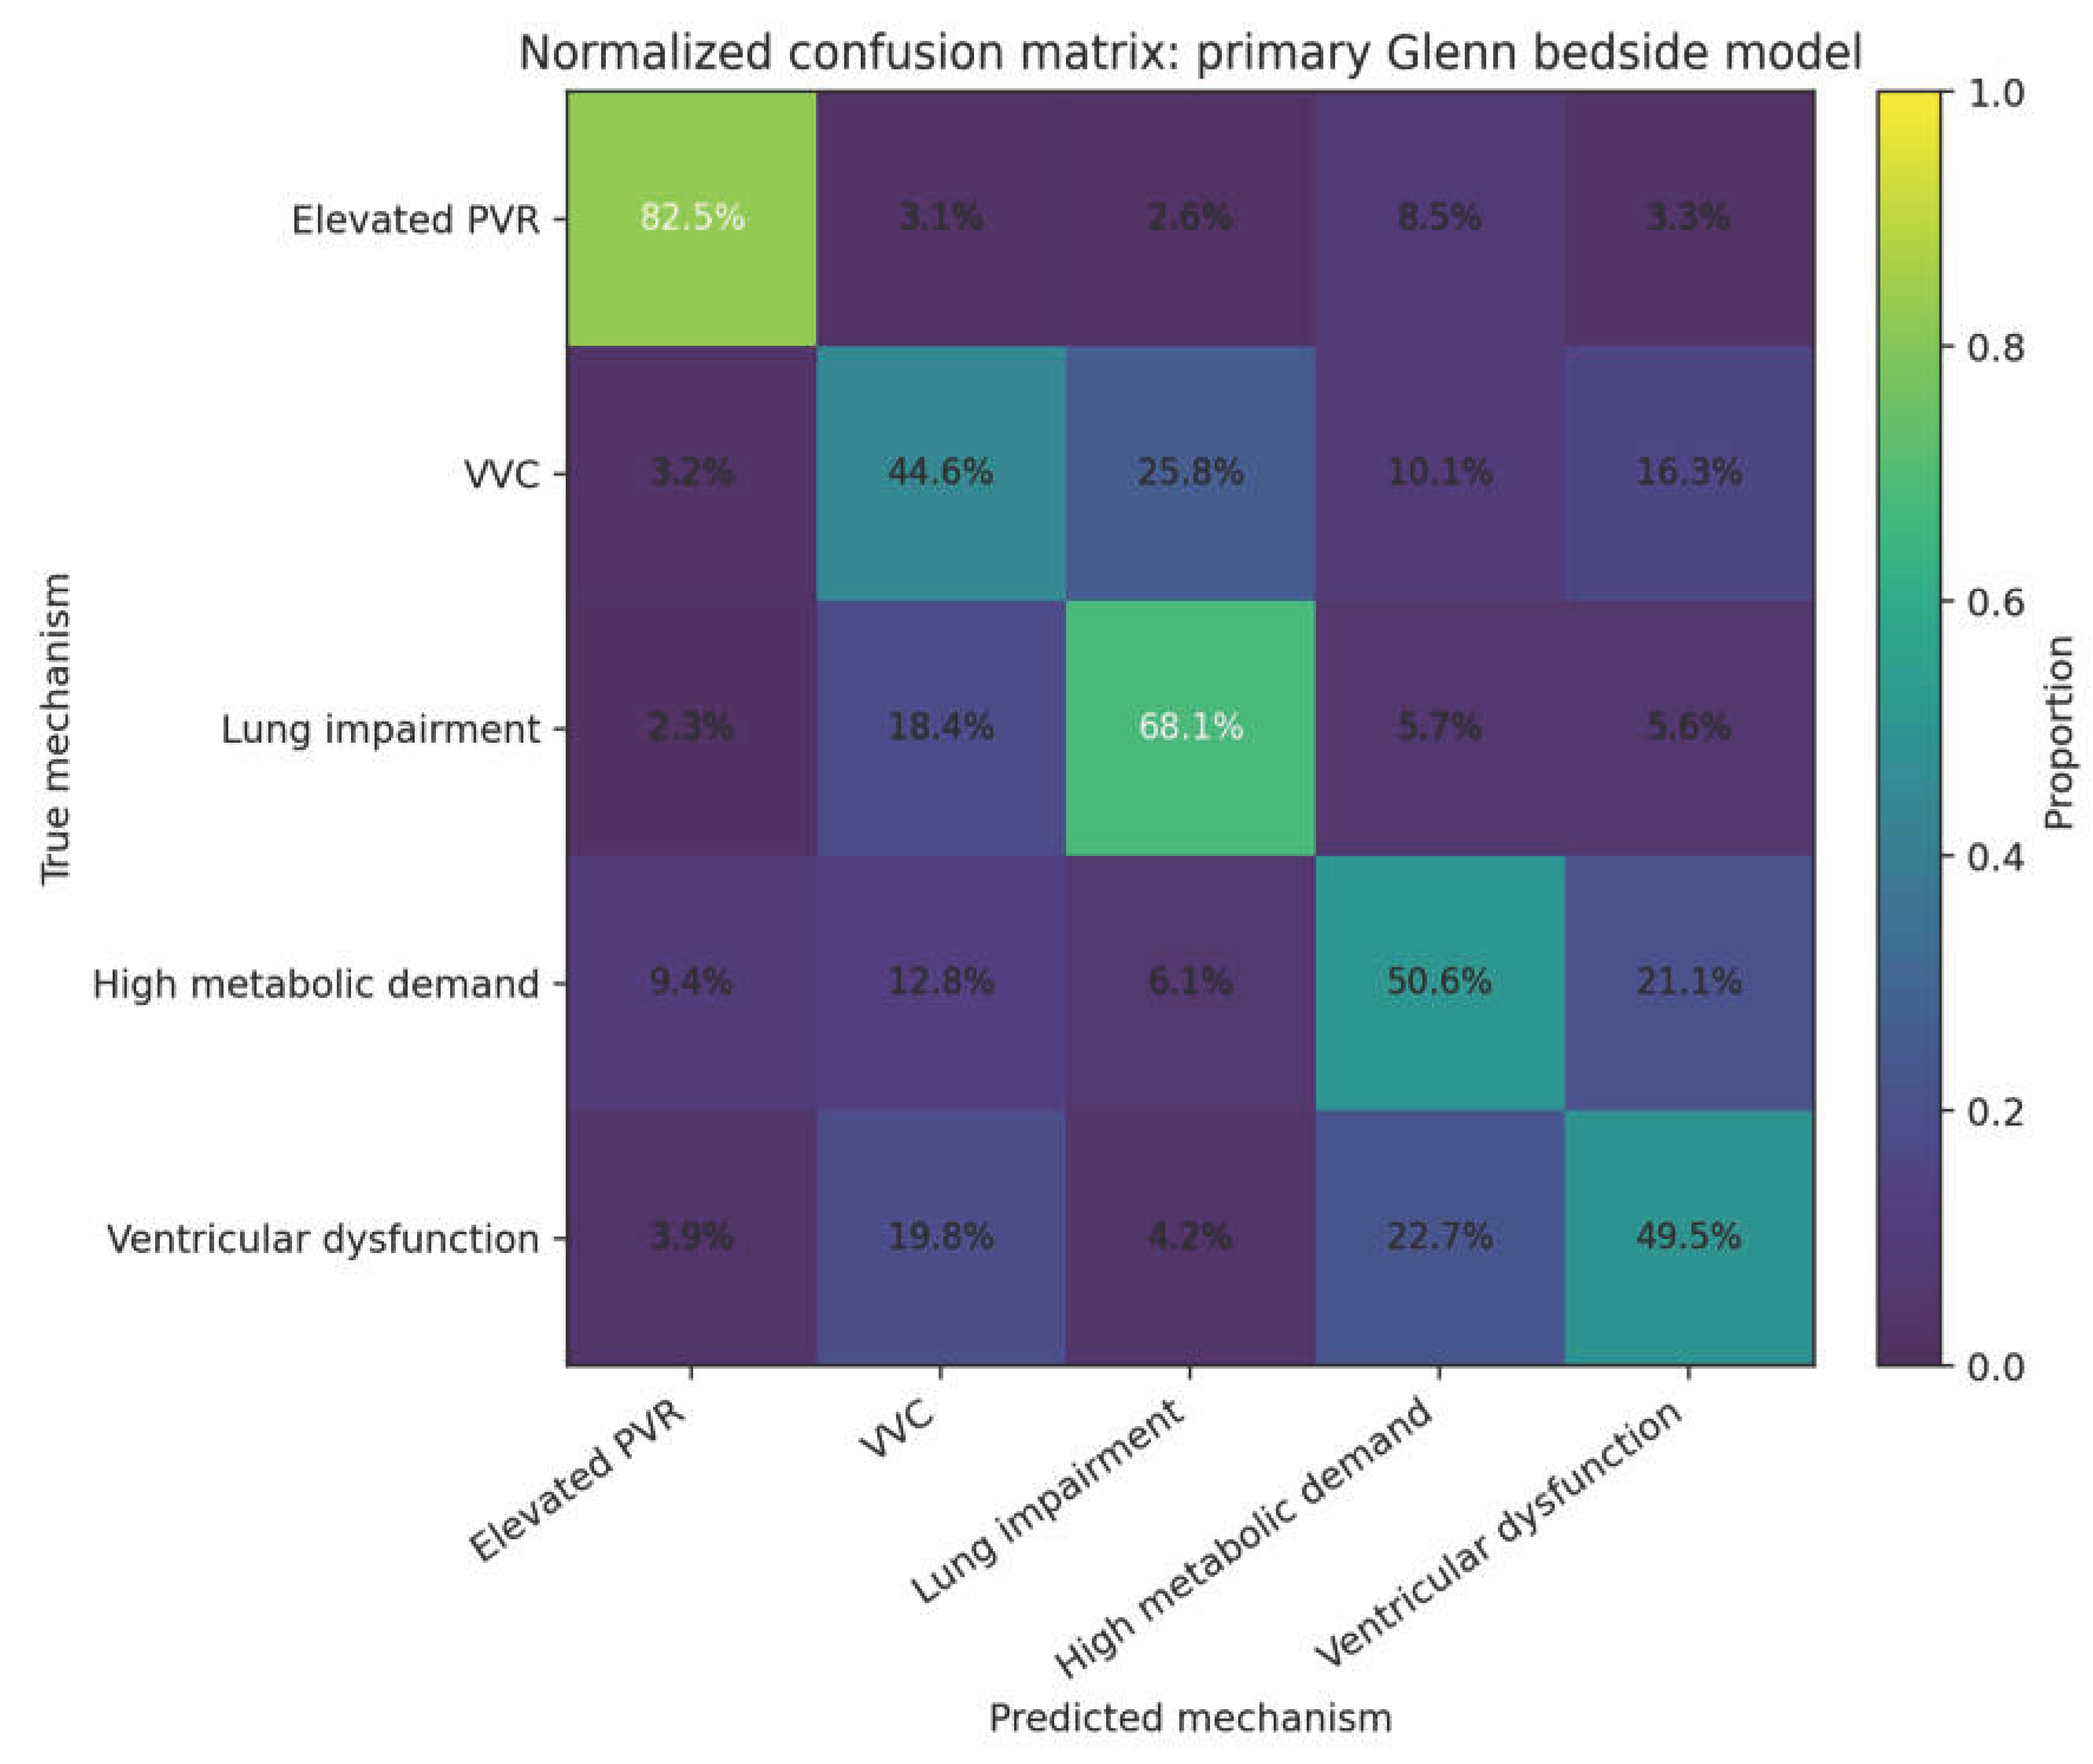
In the primary bedside model, recall was 82.5% for elevated PVR (95% CI 80.6%-84.6%), 68.1% for pulmonary gas-exchange impairment (65.6%-70.5%), 50.6% for increased metabolic demand (47.9%-53.3%), 49.5% for ventricular dysfunction (47.0%-52.4%), and 44.6% for VVC shunting (41.9%-47.2%). Compared with the previous noncompensated ventricular phenotype, allowing MAP to remain preserved during early and moderate low-output states appropriately reduced the separability of ventricular dysfunction. Residual ambiguity involved VVC shunting versus pulmonary gas-exchange impairment and compensated ventricular dysfunction versus metabolic/VVC patterns (Figure 2).
Ablation confirmed that Glenn/SVC pressure carried the largest incremental information. Removing Glenn pressure reduced accuracy from 59.1% to 44.0% and macro-AUROC from 0.865 to 0.769. Removing SVC saturation reduced accuracy to 48.2% (AUROC 0.788), removing SpO2 to 48.7% (AUROC 0.791), removing heart rate to 58.0% (AUROC 0.858), removing MAP to 58.2% (AUROC 0.860), and removing hemoglobin to 58.7% (AUROC 0.863). The small effect of removing MAP is consistent with the revised ventricular phenotype, in which arterial pressure can remain preserved despite reduced systemic flow.
Figure 1.
Incremental classification performance using bedside-observable markers. The primary Glenn model adds Glenn/SVC pressure and SVC saturation to noninvasive bedside information. Performance reflects the revised ventricular phenotype in which systemic vascular compensation can preserve MAP during early and moderate low-output states..
Figure 1.
Incremental classification performance using bedside-observable markers. The primary Glenn model adds Glenn/SVC pressure and SVC saturation to noninvasive bedside information. Performance reflects the revised ventricular phenotype in which systemic vascular compensation can preserve MAP during early and moderate low-output states..
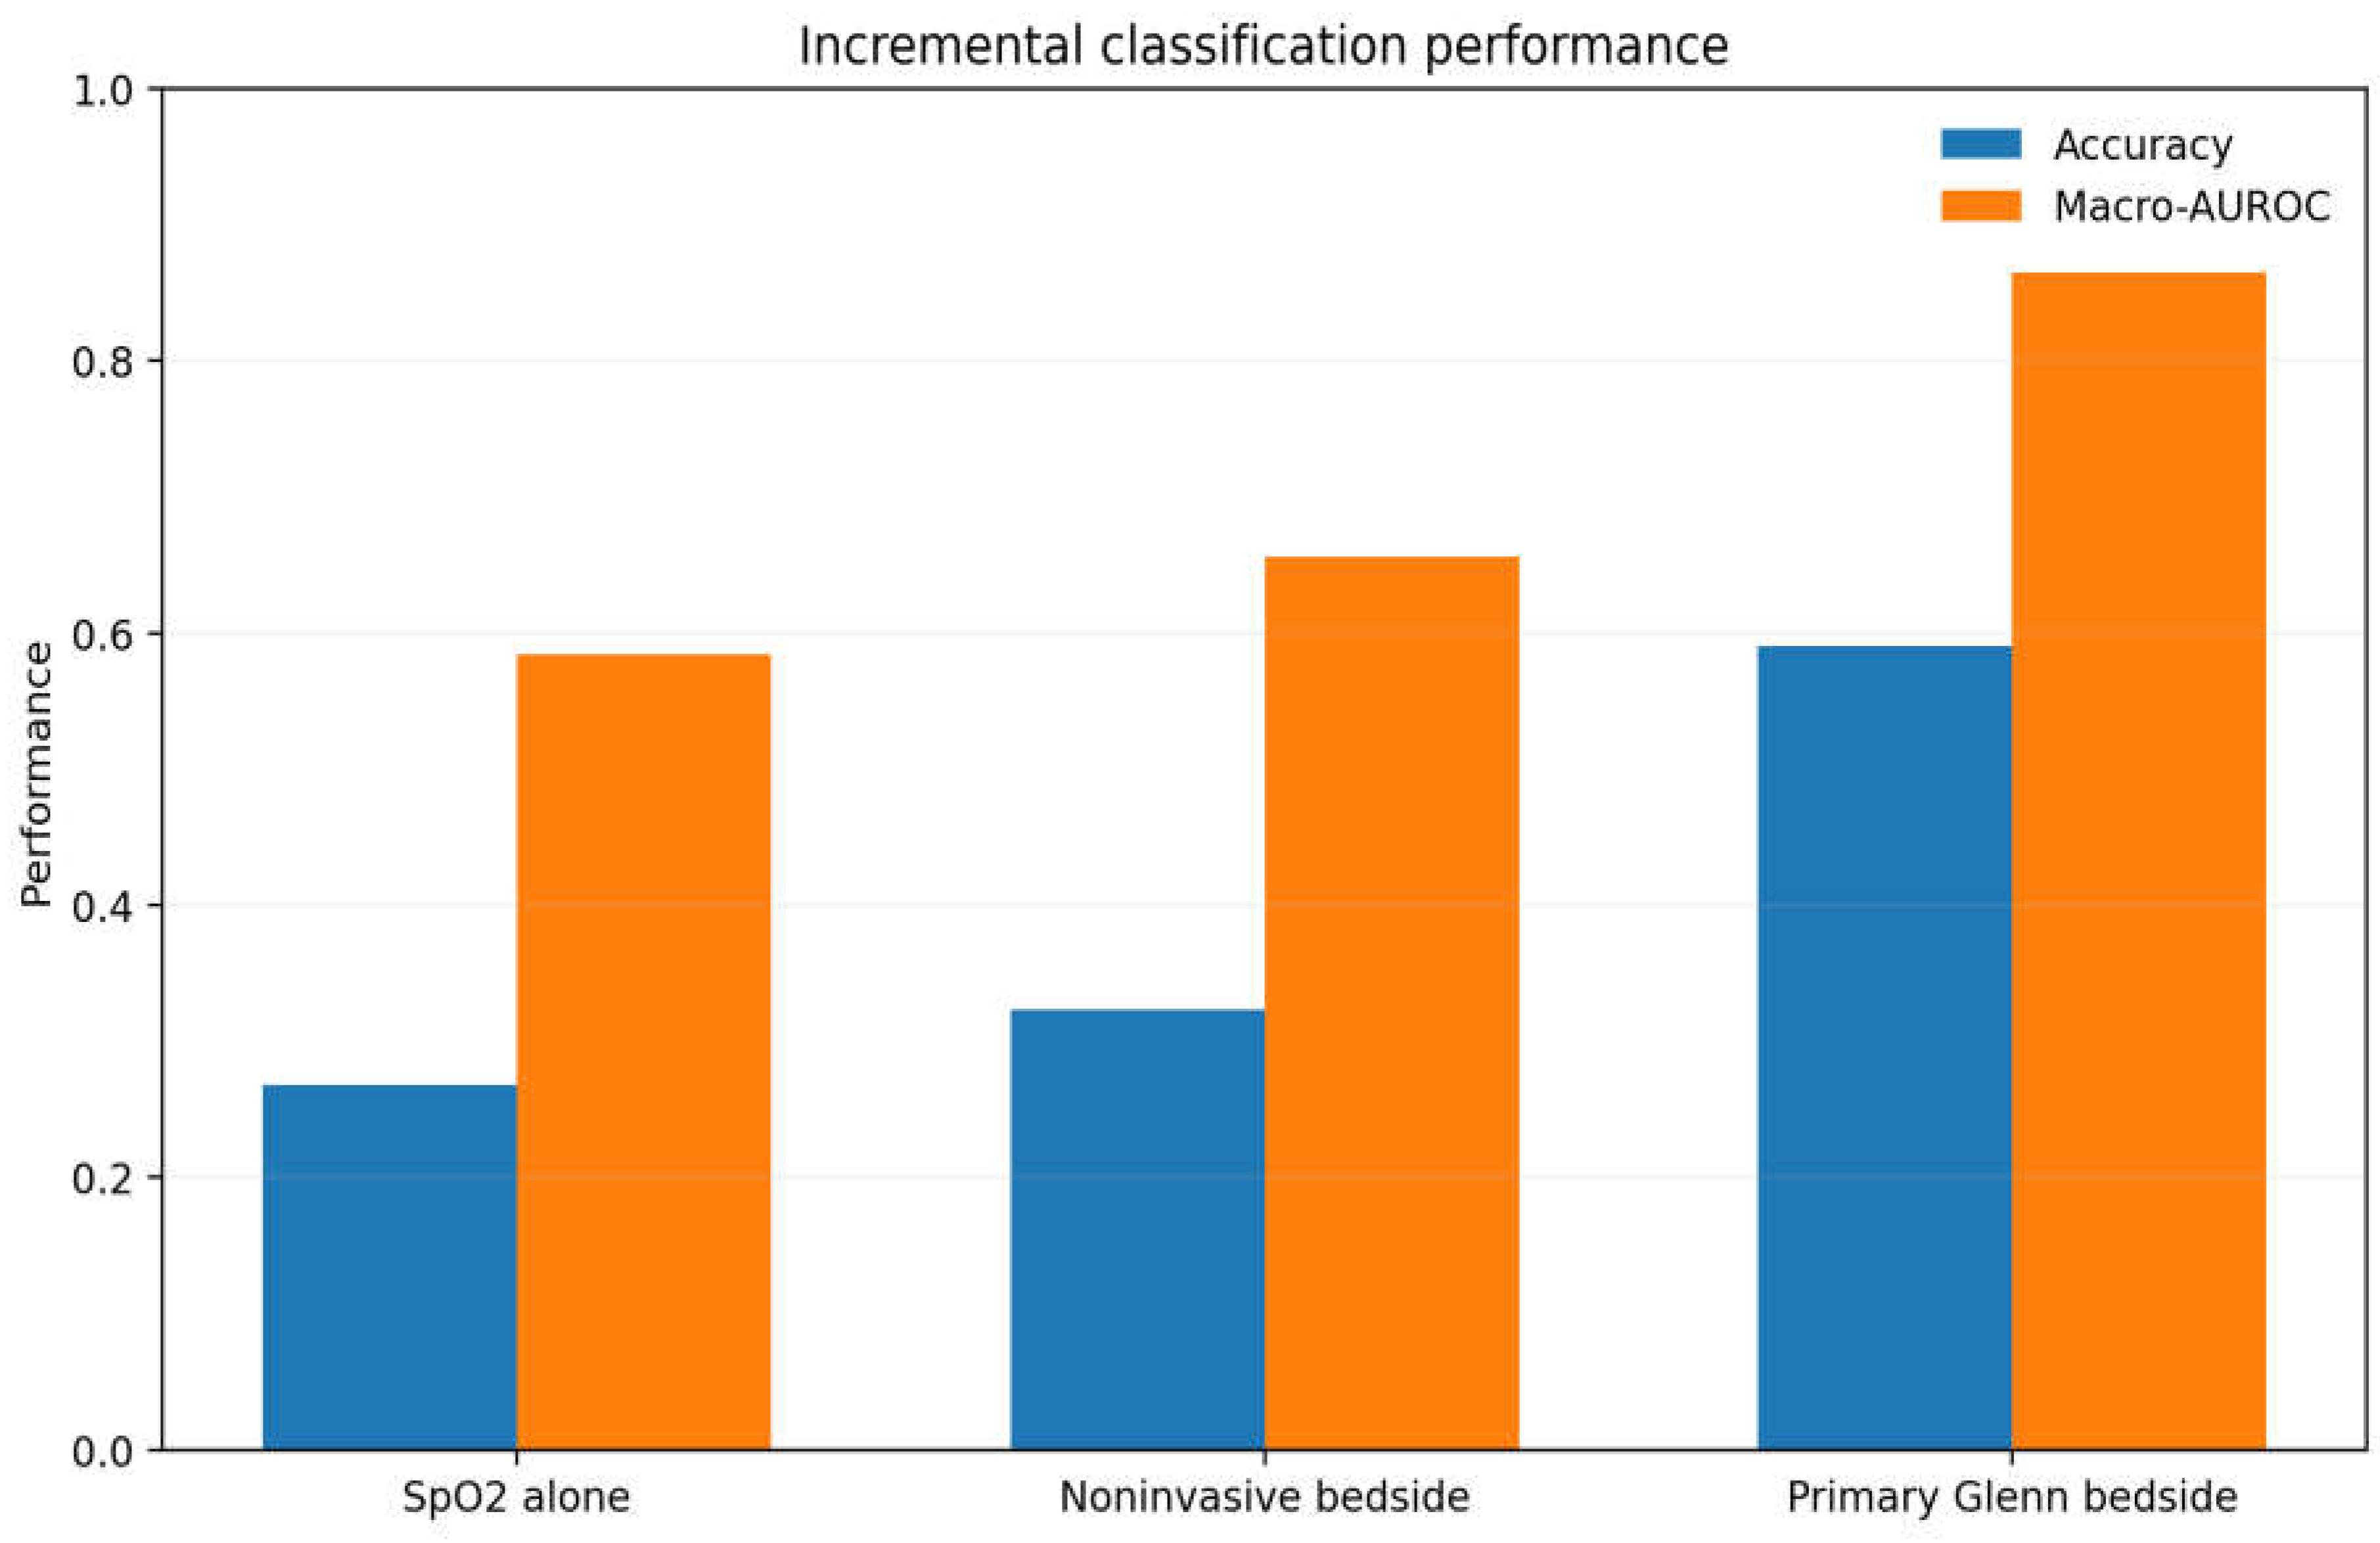
Figure 2.
Normalized confusion matrix for the primary Glenn bedside model. Elevated PVR remained the most readily identified mechanism. Residual overlap involved VVC shunting versus pulmonary gas-exchange impairment and compensated ventricular dysfunction versus metabolic/VVC patterns.
Figure 2.
Normalized confusion matrix for the primary Glenn bedside model. Elevated PVR remained the most readily identified mechanism. Residual overlap involved VVC shunting versus pulmonary gas-exchange impairment and compensated ventricular dysfunction versus metabolic/VVC patterns.
Sensitivity Analyses
Primary-model performance remained similar when baseline pulmonary resistance, hemoglobin, or oxygen consumption was changed. Macro-AUROC ranged from 0.848 to 0.881 across these scenarios. Doubling measurement error produced the largest decline, to 48.1% accuracy and macro-AUROC 0.793. Each sensitivity scenario was independently regenerated, filtered, and rebalanced, so the N reported in Table 3 is the balanced sample available for that specific scenario rather than the primary-cohort sample size. Table 3 summarizes primary performance, mechanism-specific recall, ablation, and sensitivity analyses.
Discussion
This study asked whether routinely available bedside markers can distinguish major physiologic causes of hypoxemia after bidirectional Glenn. In the virtual cohort, SpO2 alone was insufficient. Adding heart rate, MAP, Glenn/SVC pressure, and SVC saturation substantially improved discrimination. The clinically relevant result is not that unmeasured PVR, Qp, or oxygen consumption should be calculated at the bedside; those quantities remained hidden internal causes. Rather, the model predicts that different hidden mechanisms can produce different combinations of measurements clinicians can obtain.
Glenn/SVC pressure provided the largest incremental information. This is physiologically consistent with a passive pulmonary circulation in which flow depends on upstream venous pressure, downstream atrial pressure, and pulmonary resistance [1,2,6]. In clinical reports, pulmonary vasodilation with inhaled nitric oxide after Glenn decreased central venous pressure while improving arterial and venous oxygen saturation [14]. The model therefore predicts that, among patients with comparable hypoxemia, a higher Glenn pressure should increase the probability of pulmonary vascular or mechanical flow limitation; it is not proposed as a specific diagnostic rule.
VVC shunting remained difficult to separate from pulmonary gas-exchange impairment using the primary hemodynamic markers. This is physiologically plausible: both may cause cyanosis without marked Glenn-pressure elevation. VVCs are recognized decompressive venous pathways after cavopulmonary connection [3,4], whereas pulmonary gas-exchange changes can alter saturation without a proportional change in Qp/Qs [10]. We did not use synthetic blood-gas or FiO2 variables to improve this distinction because those variables were partly generated from the lung-impairment definition and would risk information leakage. In clinical validation, independently measured respiratory support and blood-gas data should be tested prospectively.
The ventricular-dysfunction phenotype illustrates why arterial pressure should not be treated as a direct surrogate for cardiac output. Reduced pump performance was coupled to compensatory systemic vasoconstriction, allowing systemic flow and venous oxygenation to deteriorate while MAP remained near the range observed in the other mechanisms during mild and moderate impairment. Hypotension emerged mainly in severe decompensation, consistent with postoperative observations that blood pressure may remain maintained despite falling cardiac output in neonates and young infants [15]. This change reduced ventricular-dysfunction recall from the very high values seen when low MAP was a dominant signature to 49.5%, a more physiologically plausible result. In the compensated phase, falling SVC saturation and a modest heart-rate response carried more information about reduced systemic flow than MAP alone.
Increased metabolic demand preferentially lowered SVC saturation and increased the modeled heart-rate response, consistent with the expected effect of higher extraction on venous oxygenation [1,5]. Heart rate contributed modestly to overall discrimination, while removal of MAP had little effect after compensated ventricular dysfunction was introduced. These findings emphasize that normal arterial pressure does not exclude impaired systemic output in the modeled Glenn circulation.
NIRS was intentionally kept secondary because it was generated largely from venous oxygenation and therefore added little independent information once SVC saturation was available. Lactate was removed from the main analysis because a steady-state model cannot reproduce delayed lactate production and clearance. These choices favor a parsimonious feature set over adding synthetic markers simply because they are clinically measurable.
Several limitations remain. First, the cohort is synthetic, and the reported accuracy cannot be interpreted as clinical diagnostic performance. Second, the zero-dimensional model is steady-state and does not represent respiratory phasic Glenn flow, pulsatility, detailed ventricular pressure-volume behavior, delayed biochemical kinetics, or dynamic vasoactive responses. Third, several distributions and response coefficients are modeling assumptions rather than measured Glenn distributions. In particular, the staged systemic-resistance response used to represent compensation during ventricular dysfunction is a simplified approximation of neurohumoral vasoconstriction and does not model time-dependent ventricular-arterial coupling. Fourth, the pulmonary gas-exchange phenotype is a simplified gas-exchange-efficiency model rather than an explicit ventilation-perfusion model. Fifth, antegrade pulmonary blood flow, aortopulmonary collaterals, pulmonary venous obstruction, pulmonary arteriovenous malformations, and mixed simultaneous mechanisms were not included in the primary classification task [7,8,10,11]. Finally, Glenn pressure and SVC saturation are not continuously available in every patient and depend on catheter position and loading conditions.
The next step is clinical validation using synchronized bedside data linked to independent mechanistic adjudication from catheterization, echocardiography, cross-sectional imaging, respiratory assessment, and clinical course. The model generates specific hypotheses for that validation: elevated Glenn pressure should increase the likelihood of pulmonary vascular or mechanical flow limitation; VVC and pulmonary gas-exchange abnormalities may require respiratory and imaging context for separation; disproportionate venous desaturation should accompany increased extraction; and reduced systemic output may initially present with preserved MAP, lower venous oxygen saturation, and compensatory tachycardia before hypotension develops.
In conclusion, routinely available bedside markers contained substantially more information about the simulated cause of Glenn hypoxemia than SpO2 alone. A primary combination of SpO2, heart rate, MAP, hemoglobin, Glenn/SVC pressure, and SVC saturation achieved meaningful mechanistic discrimination, but MAP alone contributed little once compensated ventricular dysfunction was modeled. The persistent overlap between VVC shunting and pulmonary gas-exchange impairment, and between compensated low-output states and other low-extraction phenotypes, identifies important targets for future clinical validation. These findings are mechanistic and hypothesis-generating and require validation in clinical Glenn patients.
Funding
None.
Conflicts of Interest
The author declares no conflict of interest.
References
- Diller, G.P.; Uebing, A.; Willson, K.; Davies, L.C.; Dimopoulos, K.; Thorne, S.A.; Gatzoulis, M.A.; Francis, D.P. Analytical identification of ideal pulmonary-systemic flow balance in patients with bidirectional cavopulmonary shunt and univentricular circulation: oxygen delivery or tissue oxygenation? Circulation 2006, 114, 1243–1250. [Google Scholar] [CrossRef] [PubMed]
- Laudenschlager, S.; Schofield, S.; Drysdale, N.; Stone, M.; Romanowicz, J.; Frank, B.; DiMaria, M.; Kheyfets, V.O.; Hedjazi-Moghari, M. Estimation of pulmonary vascular resistance for Glenn physiology. PLoS ONE 2024, 19, e0307890. [Google Scholar] [CrossRef] [PubMed]
- McElhinney, D.B.; Reddy, V.M.; Hanley, F.L.; Moore, P. Systemic venous collateral channels causing desaturation after bidirectional cavopulmonary anastomosis: evaluation and management. J. Am. Coll. Cardiol. 1997, 30, 817–824. [Google Scholar] [CrossRef] [PubMed]
- Magee, A.G.; McCrindle, B.W.; Mawson, J.; Benson, L.N.; Williams, W.G.; Freedom, R.M. Systemic venous collateral development after the bidirectional cavopulmonary anastomosis: prevalence and predictors. J. Am. Coll. Cardiol. 1998, 32, 502–508. [Google Scholar] [CrossRef] [PubMed]
- Downing, T.E.; Whitehead, K.K.; Dori, Y.; Gillespie, M.J.; Harris, M.A.; Fogel, M.A.; Rome, J.J.; Glatz, A.C. Accuracy of conventional oximetry for flow estimation in patients with superior cavopulmonary connection: a comparison with phase-contrast cardiac MRI. Circ. Cardiovasc Imaging 2013, 6, 943–949. [Google Scholar] [CrossRef] [PubMed]
- Laudenschlager, S.; Chauhan, D.; Chaudhuri, N.R.; Mascio, C.E.; Udassi, J.P.; Frank, B.S.; Romanowicz, J.; Loke, Y.H.; Kheyfets, V.O.; Hedjazi Moghari, M. Estimation of pre-Fontan pulmonary vascular resistance in children with single ventricle heart disease at the Glenn stage: a multicenter study. Front Pediatr. 2025, 13, 1698653. [Google Scholar] [CrossRef] [PubMed]
- Yan, T.; Tong, G.; Zhang, B.; Yan, F.; Zhou, X.; Wang, X.; Lu, H.; Ma, T.; Wang, X.; Yu, H.; Sun, Z.; Zhang, W. The effect of antegrade pulmonary blood flow following a late bidirectional Glenn procedure. Interact. Cardiovasc Thorac. Surg. 2018, 26, 454–459. [Google Scholar] [CrossRef] [PubMed]
- Triedman, J.K.; Bridges, N.D.; Mayer, JEJr; Lock, J.E. Prevalence and risk factors for aortopulmonary collateral vessels after Fontan and bidirectional Glenn procedures. J. Am. Coll. Cardiol. 1993, 22, 207–215. [Google Scholar] [CrossRef] [PubMed]
- Hoskote, A.; Li, J.; Hickey, C.; Erickson, S.; Van Arsdell, G.; Stephens, D.; Holtby, H.; Bohn, D.; Adatia, I. The effects of carbon dioxide on oxygenation and systemic, cerebral, and pulmonary vascular hemodynamics after the bidirectional superior cavopulmonary anastomosis. J. Am. Coll. Cardiol. 2004, 44, 1501–1509. [Google Scholar] [CrossRef] [PubMed]
- Ishikawa, Y.; Ishikawa, S.; Sagawa, K.; Ushinohama, H.; Nakamura, M.; Kado, H. Favorable effects of oxygen inhalation in patients after bidirectional Glenn procedure as assessed by cardiovascular magnetic resonance flow measurement. Circ. J. 2016, 80, 1378–1385. [Google Scholar] [CrossRef] [PubMed]
- Fang, Z.A.; Ghelani, S.J.; Koutsogiannaki, S.; DiNardo, J.A.; Yuki, K. Validation of a mathematical model of bidirectional Glenn circulation with aortopulmonary collaterals and the implications for QP/QS calculation. J. Cardiothorac. Vasc. Anesth. 2018, 32, 395–401. [Google Scholar] [CrossRef] [PubMed]
- Pridjian, A.K.; Mendelsohn, A.M.; Lupinetti, F.M.; Beekman RH3rd Dick M2nd Serwer, G.; Bove, E.L. Usefulness of the bidirectional Glenn procedure as staged reconstruction for the functional single ventricle. Am. J. Cardiol. 1993, 71, 959–962. [Google Scholar] [CrossRef] [PubMed]
- Kakuta, N.; Kawahito, S.; Mita, N.; Kambe, N.; Kasai, A.; Wakamatsu, N.; Katayama, T.; Soga, T.; Tada, F.; Kitaichi, T.; Kitagawa, T.; Kitahata, H. Usefulness of central venous oxygen saturation monitoring during bidirectional Glenn shunt. J. Med. Invest. 2013, 60, 272–275. [Google Scholar] [CrossRef] [PubMed]
- Gamillscheg, A.; Zobel, G.; Urlesberger, B.; Berger, J.; Dacar, D.; Stein, J.I.; Rigler, B.; Metzler, H.; Beitzke, A. Inhaled nitric oxide in patients with critical pulmonary perfusion after Fontan-type procedures and bidirectional Glenn anastomosis. J. Thorac. Cardiovasc Surg. 1997, 113, 435–442. [Google Scholar] [CrossRef] [PubMed]
- Wernovsky, G.; Wypij, D.; Jonas, R.A.; Mayer JEJr Hanley, F.L.; Hickey, P.R.; Walsh, A.Z.; Chang, A.C.; Castaneda, A.R.; Newburger, J.W.; Wessel, D.L. Postoperative course and hemodynamic profile after the arterial switch operation in neonates and infants: a comparison of low-flow cardiopulmonary bypass and circulatory arrest. Circulation 1995, 92, 2226–2235. [Google Scholar] [CrossRef] [PubMed]

Table 1.
Hidden physiologic mechanisms used to generate the virtual cohort.
| Mechanism | Internal perturbation (hidden) | Expected bedside consequence | Physiologic support |
|---|---|---|---|
| Elevated PVR | Increase effective pulmonary pathway resistance 1.5-3.2x; preserve intrinsic pulmonary gas exchange | Higher Glenn/SVC pressure with hypoxemia; venous oxygenation may fall | Passive Glenn pressure-flow/PVR studies [2,6]; nitric oxide response [14] |
| VVC shunting | Add graded venous bypass from SVC toward a lower-pressure venous/atrial compartment | Hypoxemia with relatively lower/decompressed Glenn pressure than isolated high PVR | Systemic venous collateral series [3,4] |
| Pulmonary gas-exchange impairment | Reduce hidden pulmonary gas-exchange efficiency while preserving cavopulmonary resistance | Low SpO2 without obligatory Glenn-pressure elevation; clinical separation may require independent respiratory data | Oxygen can raise saturation without material Qp/Qs change [10] |
| Increased metabolic demand | Increase regional oxygen consumption 1.2-1.8x baseline | Lower SVC saturation and compensatory higher heart rate with relatively preserved Glenn pressure | Flow-metabolism/oxygen-consumption studies [1,5] |
| Ventricular dysfunction | Reduce ventricular pressure generation and increase internal pump resistance; increase systemic resistance during mild/moderate impairment with partial loss of compensation in severe states | Reduced systemic flow with initially preserved MAP, lower venous oxygenation, and compensatory tachycardia; hypotension emerges later with decompensation | Flow and oxygen-delivery framework [11]; preserved blood pressure despite falling postoperative cardiac output [15] |
Table 2.
Bedside-marker distributions in the strict hypoxemic cohort. Values are median [2.5th-97.5th percentile].
Table 2.
Bedside-marker distributions in the strict hypoxemic cohort. Values are median [2.5th-97.5th percentile].
| Mechanism | SpO2 (%) | HR (bpm) | MAP (mmHg) | Glenn/SVC (mmHg) | SVC sat (%) | Hb (g/dL) |
|---|---|---|---|---|---|---|
| Elevated PVR | 72.7 [65.5-79.4] | 125.9 [97.1-155.9] | 66.4 [54.5-78.2] | 16.9 [10.6-23.2] | 53.9 [40.6-66.5] | 15.1 [12.5-17.7] |
| VVC shunting | 72.2 [65.5-79.3] | 125.6 [97.6-154.1] | 66.2 [54.2-78.0] | 10.4 [6.8-14.3] | 56.3 [44.3-68.4] | 15.1 [12.5-17.9] |
| Pulmonary gas-exchange impairment | 69.0 [65.2-77.4] | 125.5 [95.6-154.6] | 67.4 [55.1-79.4] | 11.3 [7.3-15.8] | 54.5 [45.1-67.1] | 15.4 [12.8-18.1] |
| Increased metabolic demand | 70.1 [65.3-78.7] | 135.6 [105.4-166.0] | 67.5 [56.0-79.9] | 11.3 [7.4-15.8] | 49.6 [39.1-64.9] | 15.4 [12.7-18.0] |
| Ventricular dysfunction | 70.6 [65.3-79.0] | 130.3 [99.8-160.4] | 64.4 [51.5-76.1] | 9.7 [6.3-13.6] | 50.4 [39.2-65.4] | 15.3 [12.6-18.0] |
Table 3.
Machine-learning performance, uncertainty, variable contribution, and sensitivity analyses.
Table 3.
Machine-learning performance, uncertainty, variable contribution, and sensitivity analyses.
| Analysis | Specification | Accuracy / Recall | 95% CI | Macro-AUROC |
|---|---|---|---|---|
| Panel A | Model performance | |||
| SpO2 alone | SpO2 | 0.268 | 0.584 | |
| Noninvasive bedside | SpO2 + HR + MAP + Hb | 0.323 | 0.656 | |
| Primary Glenn bedside | + Glenn/SVC pressure + SVC saturation | 0.591 | 0.579-0.602 | 0.865 (0.860-0.871) |
| NIRS augmented | Primary + NIRS | 0.591 | 0.865 | |
| Random forest comparator | Same inputs as primary model | 0.575 | 0.849 | |
| Panel B | Mechanism-specific recall: primary model | |||
| Elevated PVR | 0.825 | 0.806-0.846 | ||
| VVC shunting | 0.446 | 0.419-0.472 | ||
| Pulmonary gas-exchange impairment | 0.681 | 0.656-0.705 | ||
| Increased metabolic demand | 0.506 | 0.479-0.533 | ||
| Ventricular dysfunction | 0.495 | 0.470-0.524 | ||
| Panel C | Key ablation findings | |||
| Remove Glenn pressure | Primary model minus one marker | 0.440 | 0.769 | |
| Remove MAP | Primary model minus one marker | 0.582 | 0.860 | |
| Remove SVC sat | Primary model minus one marker | 0.482 | 0.788 | |
| Remove SpO2 | Primary model minus one marker | 0.487 | 0.791 | |
| Remove HR | Primary model minus one marker | 0.580 | 0.858 | |
| Remove Hb | Primary model minus one marker | 0.587 | 0.863 | |
| Panel D | Sensitivity analyses | |||
| Baseline | N=9,005 | 0.594 | 0.867 | |
| 2x measurement noise | N=8,980 | 0.481 | 0.793 | |
| Hb -2 g/dL | N=6,265 | 0.590 | 0.861 | |
| Hb +2 g/dL | N=12,460 | 0.617 | 0.880 | |
| Baseline PVR -20% | N=9,210 | 0.590 | 0.858 | |
| Baseline PVR +25% | N=8,920 | 0.601 | 0.874 | |
| VO2 -15% | N=12,395 | 0.630 | 0.881 | |
| VO2 +20% | N=5,040 | 0.566 | 0.850 |
Disclaimer/Publisher’s Note: The statements, opinions and data contained in all publications are solely those of the individual author(s) and contributor(s) and not of MDPI and/or the editor(s). MDPI and/or the editor(s) disclaim responsibility for any injury to people or property resulting from any ideas, methods, instructions or products referred to in the content. |
© 2026 by the authors. Licensee MDPI, Basel, Switzerland. This article is an open access article distributed under the terms and conditions of the Creative Commons Attribution (CC BY) license (http://creativecommons.org/licenses/by/4.0/).
Copyright: This open access article is published under a Creative Commons CC BY 4.0 license, which permit the free download, distribution, and reuse, provided that the author and preprint are cited in any reuse.