

Submitted:
10 September 2026
Posted:
11 September 2026
You are already at the latest version
Abstract
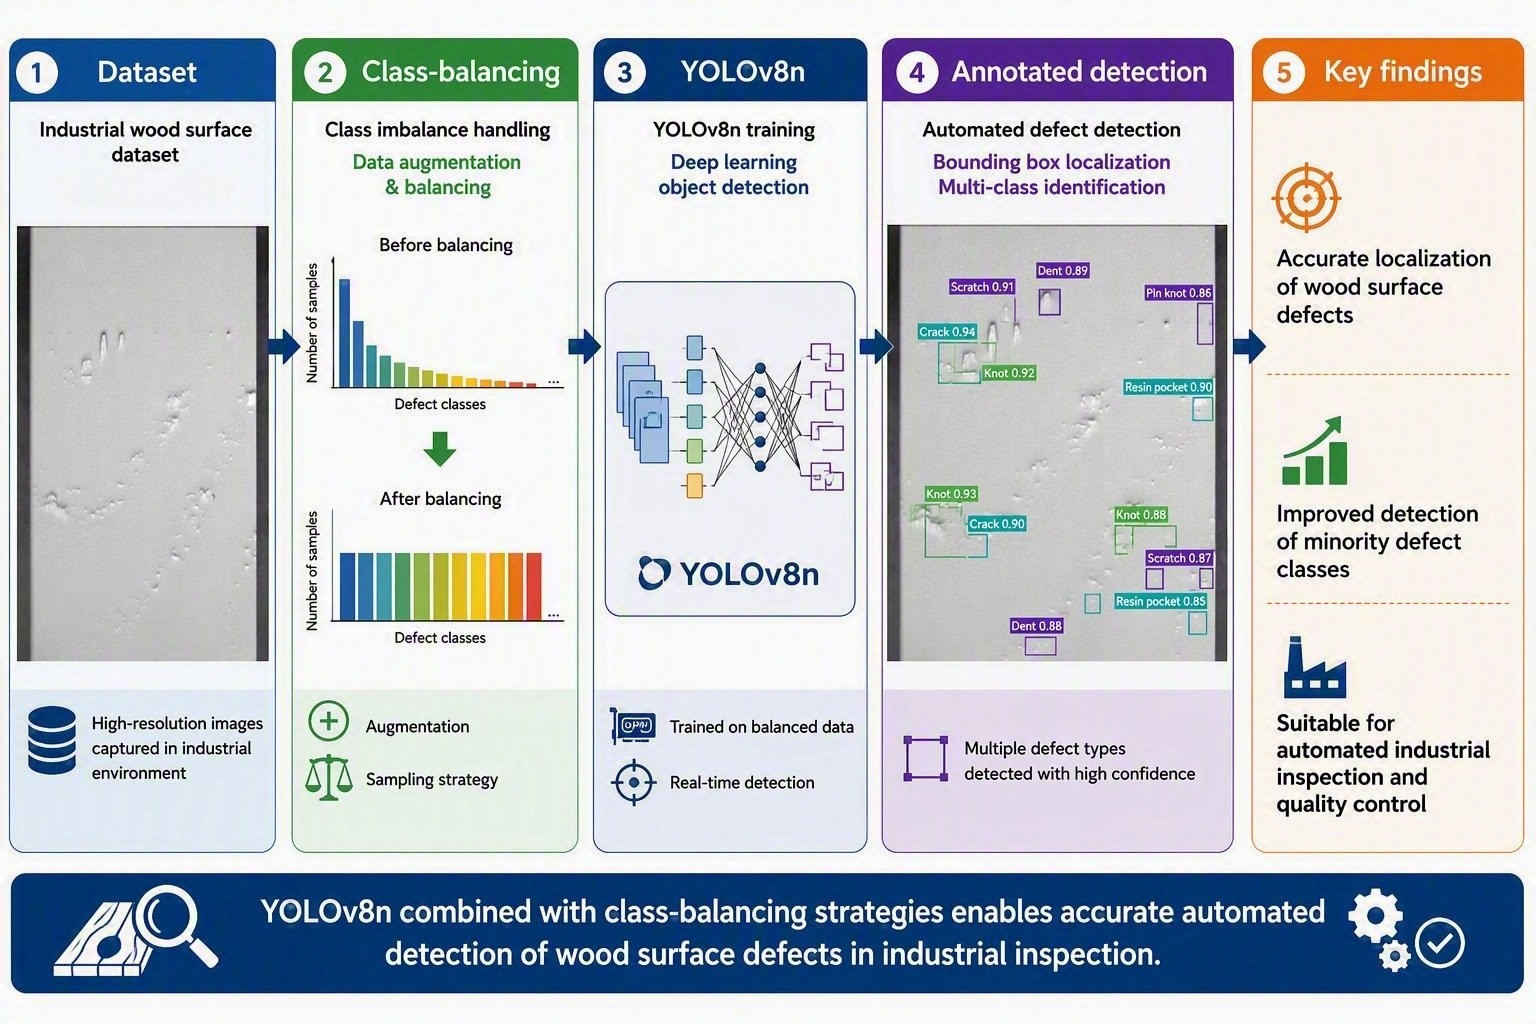
This study, presents OptiWood-YOLO, a deep learning method for automated wood-surface defect detection. Manual inspection of wood surfaces takes time and effort, and the work becomes difficult for operators who must check every board on a fast production line. We collected dataset from defective timber samples in collaboration with local wood-processing companies at a running sawmill. We first annotated the collected images using Roboflow to identify and label the different surface defects. After annotation, we applied preprocessing and augmentation techniques to improve data quality and diversity and to address common visual challenges such as motion blur, uneven lighting, and background clutter. We evaluate the method under four ablation settings: without preprocessing or augmentation, with preprocessing only, with augmentation only, and with both preprocessing and augmentation. The dataset contains seven annotated classes in total: six wood-defect classes blistering, crack, fingerjoint, planing torn, scratch, and wrinkling and one auxiliary class, Objects. We compare the final OptiWood YOLOv8n model with YOLOv11, faster region-based convolutional neural network (faster R-CNN), and the transformer-based RT-DETR model. We use precision, recall, mean average precision (mAP) at intersection over union (IoU) threshold 0.5 (mAP@0.5), mAP@0.5:0.95, and inference speed measured in frames per second (FPS). The final OptiWood YOLOv8n model achieves a precision of 0.54, recall of 0.47, mAP@0.5 of 0.46, and mAP@0.5:0.95 of 0.23. It achieves the best overall detection accuracy among the evaluated models while also maintaining the highest inference speed. Our experimental results show that preprocessing, augmentation, and class-imbalance mitigation help to improve detection performance.
Keywords:
wood defect detection
; wood surface inspection
; YOLOv8n
; industrial image dataset
; object detection
; deep learning
; class imbalance
1. Introduction
Quality is important in every piece of wood. Even small surface defects can reduce product value and affect customer acceptance. Cracks, scratches, finger-joint problems, and planing damage affect both appearance and usability. Sawmills and wood-processing companies handle large volumes of timber, making consistent manual inspection difficult. Manual inspection is time-consuming, labor-intensive, and affected by human fatigue and variation, which increases the need for automated defect detection in modern quality control [1,2].
Deep learning has improved industrial visual inspection by allowing models to learn defect patterns directly from images instead of relying on manually designed features [1,3]. This is useful for wood inspection because defects can vary in shape, size, and texture, while natural wood grain and low-contrast surface patterns can make detection difficult [4,5,6]. Object detection models can generally be divided into two-stage and single-stage approaches. Two-stage models such as faster R-CNN first generate possible defect regions and then classify and localize them, while single-stage models perform detection in one process [1,3]. Although two-stage models can provide strong localization performance, their additional processing stages can increase computational cost. Single-stage models are therefore attractive for industrial inspection, where both detection accuracy and inference speed are important [1,3].
YOLO is one of the most widely used single-stage detector families because it provides a practical balance between speed and accuracy [1,3]. Recent studies have successfully applied and improved YOLO models for wood and wood-panel defect detection [2,4,5,6,7]. These studies have focused on problems such as multiscale defects, small defects, feature loss, and complex surface patterns. For example, improved YOLOv8 models have used additional detection heads, attention mechanisms, improved feature fusion, and modified downsampling to preserve important defect information [2,5,6,7].
For this reason, we use YOLO as the main detector in this study and compare YOLOv8n and YOLOv11 under the same conditions to determine which version is more suitable for our dataset. However, YOLO-based models can still struggle with small defects, complex wood textures, and variations in image quality [5,6,7]. Small defects may occupy only a limited part of an image, making useful features difficult to preserve during downsampling [2,6]. Visually similar wood patterns and complex backgrounds can also lead to missed or incorrect detections [5,6]. Detection performance also depends strongly on the quality, diversity, and balance of the training data [1]. Therefore, in addition to comparing YOLO versions, we focus on preprocessing, augmentation, and class-imbalance mitigation to improve detection performance for industrial wood inspection.
Building a reliable detection model also requires a sufficiently large and carefully annotated dataset [1]. In this study, defective timber samples were obtained in collaboration with local wood-processing companies. The samples were transported to a laboratory environment, where high-resolution images were captured under controlled acquisition conditions. We manually annotated the images to identify defect regions, which required substantial effort because of the dataset size and the visual similarity between some defect classes. Roboflow was used to support image annotation and dataset management [8,9].
The resulting dataset presents several practical challenges, including class imbalance, small defects, low-contrast surface patterns, and visually similar defect categories. These challenges directly shaped the next steps of our work. Rather than developing a completely new detection architecture, we focused on building a practical detection pipeline around the collected data. We applied preprocessing and augmentation to improve data quality and reduce the effects of motion blur, uneven lighting, and background clutter. These steps prepared the dataset for model training and provided a stronger baseline for wood surface inspection. Since all images were captured under controlled laboratory conditions, direct validation on a production line remains an important topic for future work.
To address these challenges, we propose OptiWood-YOLO, a YOLOv8n-based method for automated wood-defect detection. The dataset contains six wood-defect classes—blistering, crack, fingerjoint, planing torn, scratch, and wrinkling—together with one auxiliary class, Objects. We evaluate the OptiWood-YOLO model against YOLOv11, faster R-CNN, and the transformer-based RT-DETR model. We utilize metrics like precision, recall, mAP@0.5, mAP@0.5:0.95, and inference speed measured in FPS. This comparison covers recent one-stage detection, a well-established two-stage detector, and a transformer-based real-time detector, allowing us to examine both detection accuracy and computational performance.
The final OptiWood-YOLOv8n model achieves a precision of 0.54, recall of 0.47, mAP@0.5 of 0.46, and mAP@0.5:0.95 of 0.23. Among the evaluated detectors, it achieves the best overall detection performance while maintaining the highest inference throughput. The ablation and class-imbalance experiments further show that preprocessing, augmentation, and imbalance mitigation improve the final performance.
The main contributions of this work are:
-
We introduce an industrially motivated wood-defect dataset containing six wood-defect classes and one auxiliary Objects class.“`
- We annotate thousands of high-resolution images using Roboflow and define a consistent annotation scheme for visually different and partially overlapping defect patterns.
- We develop OptiWood-YOLO, a practical YOLOv8n-based detection pipeline that combines preprocessing, augmentation, and class-imbalance mitigation.
- We compare OptiWood-YOLOv8n with YOLOv11, faster R-CNN, and RT-DETR, covering one-stage, two-stage, and transformer-based object-detection architectures.
- We evaluate overall detection accuracy, class-wise performance, robustness to imaging disturbances, and inference throughput.
The remainder of this paper is organized as follows: Section 2 reviews wood-defect types and related literature. Section 3 describes data acquisition and annotation. Section 4 details the OptiWood method. Section 5 presents the experiments and results. Section 7 concludes the paper and outlines future work.
2. Overview of Wood-Defect Types and Related Work
In this section, we discuss common wood-defect types and recent approaches for automated wood-surface inspection. First, we discuss defect categories and terminology used in the literature and then summarize recent detection methods, with particular attention to YOLO-based models and other object-detection architectures.
2.1. Wood-Defect Categories and Terminology
Wood defects can be grouped according to their visual characteristics and their effects on product quality, structural integrity, or market value [1]. However, the literature does not always use the same terminology for similar defects [1,4,7]. In this study, related terms are mapped to the six defined wood-defect classes to keep the annotation and evaluation consistent.
For example, checks and splits are treated as crack-type defects, while machining marks and surface tear-out are grouped under planing torn grain. These mappings are annotation decisions used in this study to reduce ambiguity between closely related defect labels.
Detecting wood defects remains challenging because natural grain patterns, low contrast, small defect regions, and complex surface textures can resemble actual defects [2,4,5,6]. Recent studies have therefore adapted YOLO-based models to improve the detection of small and visually difficult defects [2,4,5,6,7]. Table 1 summarizes representative YOLO-based methods according to the wood-defect types they address.
Based on this terminology mapping and the defects observed in our samples, this study focuses on six wood-defect classes: blistering, crack, fingerjoint, planing torn, scratch, and wrinkling, as shown in Figure 1. The dataset also contains one auxiliary class, Objects.
2.2. Crack-Related Defects: Cracks, Checks, and Splits
Cracks, checks, and splits are important in wood-quality assessment because they can reduce product quality and may lead to material downgrading or rejection. Reliable detection of these defects is therefore important for consistent quality control [4,15,16].
Researchers have modified YOLO variants by adding small-object detection heads, multi-scale feature fusion, and attention mechanisms to improve the detection of thin and linear crack-related defects [10,11,16,17]. As summarized in Table 1, crack-type defects are among the most frequently studied wood defects. Some studies report strong detection performance. For example, Qiu et al. [11] reported an mAP of 80.06%. However, many approaches treat several crack-related defects as one class, which can make it difficult to distinguish between visually similar defect types.
2.3. Surface and Machining Defects: Torn Grain, Scratches, and Machining Marks
Surface and machining defects such as torn grain, scratches, and machining marks mainly affect visual quality, but they can also reduce the market value of furniture, panels, and other visible wood products. These defects are difficult to detect because they are often small, irregular, and mixed with complex wood-grain textures [5,12,13].
YOLO-based methods have been developed to improve the detection of these surface defects. PB-YOLOv5 [12] and CCG-YOLOv7 [13], for example, use feature-enhancement and attention mechanisms to improve the representation of small and weak defect patterns. Recent YOLOv8-based studies have also focused on preserving fine features during downsampling and improving multi-scale feature extraction [2,5,6].
In the present study, scratch and planing torn are treated as separate defect classes. This distinction is important because thin and low-contrast surface patterns are generally more difficult to detect than larger and visually distinctive defects, as also reported in previous wood-defect studies [2,5,6].
2.4. Veneer and Joint-Related Defects
Blistering, wrinkling, adhesive failures, and finger-joint-related defects are relevant to plywood, laminated timber, and other engineered wood products. Compared with commonly studied defects such as cracks and scratches, some of these categories appear less frequently in public wood-defect datasets [1]. Their visual appearance can also vary considerably depending on the material, manufacturing process, and imaging conditions.
Recent studies have explored both convolutional and transformer-based approaches for veneer and surface-defect detection [18,19]. Transformer-based models can be useful when global image context is important, although their performance still depends on the amount and quality of the available training data.
Finger-joint defects are also important in engineered wood because joint quality affects both appearance and product performance. However, dedicated detection studies for finger-joint defects remain less common than studies of cracks, knots, or scratches [1,4,7]. This supports the need for datasets that contain a broader range of industrially relevant defect categories.
2.5. Alternative Models and Recent Research Trends
While YOLO models are widely used for wood-defect detection because of their computational efficiency, recent research also evaluates two-stage and transformer-based detectors as alternative architectures. Faster R-CNN represents a two-stage detection approach, while DETR-based models use transformer attention to model global relationships within an image [20,21,22].
Faster R-CNN first generates candidate object regions and then performs classification and bounding-box refinement. This approach can provide accurate localization, but it generally requires more computation than single-stage YOLO detectors [3,20]. This can limit its suitability for industrial applications where high inference throughput is important.
Transformer-based detectors provide another direction for object detection. DETR introduced an end-to-end transformer-based detection framework, while RT-DETR was designed to improve the efficiency of transformer-based detection for real-time applications [21,22]. Recent studies have also explored transformer-based methods for wood and veneer defect detection [18,19]. However, their performance can depend strongly on the amount of training data, defect size, image complexity, and available computational resources.
Recent research also explores methods that reduce dependence on large labeled datasets, including transfer learning, semi-supervised learning, and other data-efficient approaches [1]. These directions are particularly relevant for rare defect classes for which collecting and annotating enough training examples can be difficult. Nevertheless, subtle and low-contrast wood defects remain challenging, and direct comparison across studies is difficult because datasets, defect definitions, imaging conditions, and evaluation procedures often differ [1].
The present work therefore compares YOLOv8n, YOLOv11, faster R-CNN, and RT-DETR using the same dataset split and input resolution. Using the same experimental conditions reduces the effect of differences in evaluation data and allows a more controlled comparison of detector architectures. The experiments further examine preprocessing, augmentation, class imbalance, robustness to imaging disturbances, and inference throughput.
3. Dataset Construction: Acquisition and Annotation
This section explains how we obtain the timber samples, capture images, annotate defects, and create the dataset for training and evaluation.
3.1. Wood Defect Image Acquisition
We obtain defective timber samples in collaboration with local wood-processing companies between January and March 2025. We transported the samples to a laboratory environment for controlled image acquisition. We capture high-resolution images in both 2D and 3D to preserve fine surface details and structural characteristics of the wood defects.
The final dataset contains seven annotated classes: blistering, crack, fingerjoint, Objects, planing torn, scratch, and wrinkling. Six of these—blistering, crack, fingerjoint, planing torn, scratch, and wrinkling—correspond to wood defects discussed in the literature, while Objects is an auxiliary class included to represent foreign items or unexpected artifacts encountered during industrial operation.
3.2. Annotation Process
We manually annotate all images using the Roboflow platform, which provides native support for YOLO-based object detection and facilitates efficient annotation management [23]. We draw axis-aligned bounding boxes around every visible defect and remove blurry or unclear images to reduce annotation noise.
Figure 2 and Figure 3 show two ways to label finger-joints: a single bounding box around the entire area or separate boxes per repeating segment. These two annotation strategies help the model recognize both individual finger-joint defects and continuous finger-joint patterns.
We keep the final dataset classes consistent: blistering, crack, fingerjoint, Objects, planing torn, scratch, and wrinkling. Of these, six are wood-defect classes and Objects is an auxiliary class. The figures below show typical examples.
3.3. Dataset Creation and Observations
We review all labels to ensure correct class assignment and bounding box placement; having two annotators improves quality [24]. Using Roboflow, we export the dataset in YOLO format with separate train/validation/test folders and label files.

Table 2.
Class-wise distribution of images and annotations in the final dataset.
| Annotated class | Images | Annotations |
|---|---|---|
| Blistering | 747 | 2,573 |
| Crack | 1,939 | 2,887 |
| Fingerjoint | 1,333 | 5,073 |
| Objects | 2,082 | 12,244 |
| Planing torn | 2,021 | 19,489 |
| Scratch | 1,255 | 3,314 |
| Wrinkling | 1,130 | 3,393 |
| Total | 10,507 | 48,973 |
Table 3.
Dataset split summary.
| Item | Count | Share |
|---|---|---|
| Total images | 10,507 | 100% |
| Training images | 8,931 | 85.0% |
| Validation images | 841 | 8.0% |
| Test images | 735 | 7.0% |
| Total annotations | 48,973 | — |
| Average boxes/image | 4.66 | — |
We run a quick pre-training test in Roboflow Train to check label quality. Figure 8 shows that mAP varies and remains low, suggesting the dataset benefits from full YOLO training with proper preprocessing and augmentation. We therefore continue with YOLOv8n and compare it with YOLOv11, faster R-CNN, and RT-DETR.
4. OptiWood Method
Figure 9 shows the workflow architecture of our OptiWood-YOLO model. It outlines the full process we use to prepare the dataset, apply augmentations, train the models, and evaluate performance. The method has two main parts: data pre-processing and model training.
4.1. Data Pre-Processing
We start with the dataset created from defective timber samples obtained from the collaborating wood-processing companies. Each image may include one or several defects, and all defects are manually annotated in Roboflow. The dataset includes six wood-defect classes—blistering, crack, fingerjoint, planing torn, scratch, and wrinkling—and one auxiliary class, Objects. Roboflow exports labels in YOLO bounding-box format.
We split the data into training, validation, and test sets, and every model uses the same split. Before training, we review labels and clean the dataset. Polygon annotations are converted to bounding boxes using minimum and maximum coordinates. We remove corrupted images and rebuild the cache to ensure clean loading. Examples of planing-torn and scratch defects are shown in Figure 6 and Figure 7.
To preserve small defect details, we resize images to . YOLOv8n uses an anchor-free detection head, so no anchor-box recalculation is required for this input resolution; the standard feature-map strides are retained.
4.2. Model Training and Evaluation
We evaluate four detectors: OptiWood YOLOv8n, YOLOv11, faster R-CNN, and RT-DETR. YOLOv8n and YOLOv11 represent one-stage detectors, faster R-CNN provides a two-stage baseline, and RT-DETR provides a transformer-based comparison. All models use the same train, validation, and test split and the same input resolution to support a consistent comparison.
We train YOLO models with AdamW, learning rate , and cosine scheduling on an NVIDIA A100 MIG 1g.5gb GPU, batch size 4. We use warm-up epochs, early stopping, and a reduced-mosaic stage near the end. We evaluate on the validation set using precision, recall, mAP@0.5, mAP@0.5:0.95, and inference time.
4.3. Use of Generative Artificial Intelligence (AI) in Paper Preparations
We use a generative artificial intelligence tool during the preparation of this manuscript to help in language editing, grammatical correction, paragraph structure, and improving the clarity and readability of the text.
We did not use for dataset creation, annotation decisions, model training, experimental analysis, generation of research results, interpretation of the results, or formulation of scientific conclusions. All AI-assisted content was critically reviewed, verified, and edited by the authors, who take full responsibility for the final content of the manuscript.
5. Results and Experiments
This section presents the results of the wood-defect detection experiments. The final OptiWood YOLOv8n model is compared with YOLOv11, faster R-CNN, and RT-DETR. We also examine the effects of preprocessing, augmentation, class-imbalance mitigation, imaging disturbances, and inference speed.
5.1. Experimental Setup
All models use the same train/validation/test split. Preprocessing includes bounding-box normalization, correction of annotation inconsistencies, and resizing to to preserve small defect details. Augmentations include mosaic, mixup, HSV changes, scaling, and horizontal flips. YOLOv8n is trained with AdamW using a learning rate of , cosine scheduling, warm-up epochs, and early stopping on an NVIDIA A100 MIG 1g.5gb GPU [23].
5.2. Detection Performance and Model Comparison
Table 4 reports the class-wise performance of the baseline OptiWood YOLOv8n configuration before the final class-imbalance mitigation step. The evaluation uses the fixed dataset split described in Table 3. The best results are obtained for fingerjoint and crack, with mAP@0.5 values of 0.72 and 0.68, respectively. Objects also show comparatively stable performance with an mAP@0.5 of 0.49. In contrast, scratch, wrinkling, and planing torn are more difficult to detect. These classes often contain small, thin, or low-contrast visual patterns that can be difficult to distinguish from natural wood grain [5,13].
Table 5 compares the overall performance of the evaluated detectors. OptiWood YOLOv8n achieves the best overall performance, with a precision of 0.54, recall of 0.47, mAP@0.5 of 0.46, and mAP@0.5:0.95 of 0.23. YOLOv11 performs slightly lower, achieving a precision of 0.53, recall of 0.45, mAP@0.5 of 0.45, and mAP@0.5:0.95 of 0.21. RT-DETR reaches 0.50 precision, 0.44 recall, 0.41 mAP@0.5, and 0.19 mAP@0.5:0.95, while faster R-CNN produces the lowest overall performance.
The results show that OptiWood YOLOv8n provides the best balance of detection accuracy and computational efficiency. Although the differences compared with YOLOv11 are relatively small, OptiWood achieves the highest value for all four detection metrics. The comparison with RT-DETR and faster R-CNN further indicates that increased architectural complexity does not necessarily improve performance for this industrial dataset.
5.3. Ablation and Class Imbalance Mitigation
To quantify the contribution of preprocessing and augmentation, we evaluate four YOLOv8n configurations. As shown in Table 6, the baseline model without preprocessing or augmentation achieves an mAP@0.5 of 0.31 and an mAP@0.5:0.95 of 0.11. Preprocessing alone increases mAP@0.5 to 0.36, while augmentation alone increases it to 0.39. Combining preprocessing and augmentation produces the best configuration within the ablation experiment, increasing mAP@0.5 to 0.45 and mAP@0.5:0.95 to 0.21. These results show that both components contribute to improved performance, with augmentation producing the larger individual gain [4,5,7,25].
Because the dataset contains substantially different numbers of annotations across classes, we also evaluate a class-imbalance mitigation strategy. The objective is particularly to improve the detection of underrepresented classes such as scratch and blistering.
As shown in Table 7, precision increases from 0.52 to 0.54 and recall increases from 0.45 to 0.47. In addition, mAP@0.5 increases from 0.45 to 0.46, while mAP@0.5:0.95 increases from 0.21 to 0.23. The improvement is also visible for the minority classes: scratch mAP@0.5 increases from 0.29 to 0.33 and blistering from 0.37 to 0.39.
The class-imbalance mitigation is included in the final OptiWood configuration reported in Table 5. The results suggest that addressing class imbalance improves overall performance, particularly for underrepresented classes, although substantial differences between defect classes remain. Additional minority-class examples, improved annotation consistency, and methods designed for small and low-contrast objects may therefore provide further gains.
5.4. Error Analysis and Robustness
We examine common false positives (FP) and false negatives (FN) to understand the remaining detection errors. Most false positives occur when natural grain patterns are incorrectly classified as scratches. False negatives are commonly associated with faint scratches and narrow planing-torn regions that blend into the surrounding wood texture. Confusion is also observed between crack and scratch and between fingerjoint and planing torn. These patterns are consistent with previous findings showing that small and low-contrast defects remain difficult for conventional object detectors [5,12,13].
We further evaluate the robustness of the final OptiWood YOLOv8n model under changes in brightness, motion blur, and image compression. Table 8 shows that all three imaging disturbances reduce performance. Motion blur causes the largest reduction, decreasing mAP@0.5 from 0.46 to 0.43 and mAP@0.5:0.95 from 0.23 to 0.19. Brightness variation results in a smaller reduction, while JPEG compression has only a limited effect on overall detection performance. This effect is particularly relevant for scratches and planing torn because their detection depends strongly on fine edges and surface texture [5,7].
5.5. Runtime and Deployment Metrics
Table 9 compares inference throughput on the tested hardware. OptiWood YOLOv8n achieves the highest throughput at 51.30 FPS, followed by YOLOv11 at 47.00 FPS. RT-DETR operates at 35.00 FPS, while faster R-CNN is substantially slower at 19.60 FPS. Together with the accuracy results in Table 5, these results show that OptiWood YOLOv8n achieves both the highest overall detection performance and the highest throughput among the evaluated models.
These results show that OptiWood YOLOv8n provides the best computational performance among the evaluated models. However, real-time inference speed alone does not establish readiness for autonomous industrial deployment, since detection reliability and the consequences of false negatives must also be considered.
5.6. Calibration and Operating Thresholds
For effective inspection, the confidence threshold determines the trade-off between false alarms and missed defects. A lower threshold can increase recall but also produces more false-positive detections requiring manual review, whereas a higher threshold reduces false alarms at the risk of missing defects. Class-specific thresholds may therefore be useful because the consequences of missing a defect vary between classes. For example, thresholds for difficult classes such as scratch can be adjusted according to downstream inspection requirements. Similar threshold optimization has been used in previous work on small and low-contrast wood defects [5,13].
6. Threats to Validity
Internal validity. Class imbalance and annotation ambiguity may influence per-class performance, particularly for small and visually similar defects. We evaluated a class-imbalance mitigation strategy, which improved recall and the performance of minority classes such as scratch and blistering. Nevertheless, the remaining differences between classes indicate that imbalance and annotation ambiguity are not completely resolved.
- External validity. The timber samples originate from a limited industrial context, while image acquisition was performed under controlled laboratory conditions. Differences in wood species, surface finishes, cameras, lighting, and production-line conditions may therefore affect model performance in other environments. The robustness experiments provide initial evidence under controlled brightness, motion-blur, and compression changes, but evaluation at additional sawmills is required before broad generalization.
7. Conclusions and Future Work
This work presents OptiWood-YOLO, a practical YOLOv8n-based method for automated wood-surface defect detection using industrial image data. The final OptiWood model achieves a precision of 0.54, recall of 0.47, mAP@0.5 of 0.46, and mAP@0.5:0.95 of 0.23. Among the evaluated detectors, OptiWood achieves the best overall detection performance, outperforming YOLOv11, RT-DETR, and faster R-CNN while also providing the highest inference throughput at 51.30 FPS.
The ablation experiments show that both preprocessing and data augmentation contribute to detection performance. Class-imbalance mitigation further improves recall and the detection of underrepresented classes, although scratches, wrinkling, and planing-torn defects remain challenging because of their small size, low contrast, and similarity to natural wood texture.
The results demonstrate the potential of OptiWood-YOLO as an effective baseline for automated wood-surface inspection. However, the current performance does not eliminate the need for further development, particularly for difficult minority classes and evaluation across different production environments. Future work will focus on collecting more diverse industrial data, improving minority-class detection, refining annotation consistency, evaluating additional transformer-based and hybrid detector architectures, and testing the method under extended real production-line conditions.
Additional information on the dataset, reproducibility, training hyperparameters, confusion-matrix results, and learning-rate schedule is provided in Appendices Appendix A–Appendix E.
Author Contributions
Conceptualization, H.S. and E.S.; methodology, H.S. and T.K.; software, H.S.; validation, H.S. and T.K.; investigation, T.K.; resources, T.K.; data curation, A.K. and T.K.; writing—original draft preparation, H.S.; writing—review and editing, H.S., E.S., T.K. and A.K.; visualization, H.S.; supervision, E.S.; project administration, E.S.; funding acquisition, E.S. All authors have read and agreed to the published version of the manuscript.
Funding
This research was funded by the European Union under the Renewing and Competent Finland 2021–2027 programme, project No. 81414.
Data Availability Statement
The dataset generated and analyzed during the current study is available from the corresponding author upon reasonable request, subject to applicable agreements and restrictions related to the industrial data.
Acknowledgments
The authors would like to thank the collaborating wood-processing companies for their support in providing defective timber samples used in this study. During the preparation of this manuscript, the authors used ChatGPT (OpenAI, San Francisco, CA, USA) to assist with language editing, grammatical correction, sentence restructuring, and improvement of readability. The authors reviewed and edited all AI-assisted content and take full responsibility for the final content of the manuscript.
Conflicts of Interest
The authors declare no conflicts of interest.
Appendix A. Dataset Card
Provenance. Defective timber samples were obtained from local wood-processing companies between January and March 2025; images were captured under controlled laboratory conditions.
- Device setup. High-resolution RGB image acquisition in 2D and 3D.
- Task. Wood-surface defect detection using object detection.
- Classes. Six wood-defect classes—blistering, crack, fingerjoint, planing torn, scratch, and wrinkling—and one auxiliary class, Objects.
- Splits. A fixed training, validation, and test split was used for all evaluated models to ensure consistent comparison.
- Annotation. Bounding boxes were manually annotated in Roboflow and reviewed for annotation quality [24]. Both single-box and multiple-box annotation strategies were used for finger-joint regions.
Intended use. Automated wood-surface inspection.
- Out of scope. Internal defects requiring non-destructive testing methods such as X-ray imaging.
- Known issues. The dataset contains class imbalance and visually similar defect categories, particularly fine cracks, scratches, and small finger-joint regions.
Appendix B. Reproducibility Checklist
Models. YOLOv8n, YOLOv11, faster R-CNN, and RT-DETR were evaluated using the same dataset split and input resolution.
- Hyperparameters. AdamW optimizer, base learning rate of , cosine learning-rate schedule, batch size of 4, image size of , warm-up epochs, and early stopping were used for YOLO training.
- Data splits. The same fixed training, validation, and test sets were used for all evaluated models.
- Hardware. YOLO models were trained using an NVIDIA A100 MIG 1g.5gb GPU.
- Evaluation. Precision, recall, mAP@0.5, mAP@0.5:0.95, and inference throughput were used to evaluate model performance.
Appendix C. Training Hyperparameters
Table A1.
Training hyperparameters for OptiWood-YOLOv8n.
| Parameter | Value |
|---|---|
| Optimizer | AdamW |
| Base learning rate | 0.002 |
| Learning-rate schedule | Cosine (Appendix E) |
| Batch size | 4 |
| Input size | |
| Warm-up epochs | 3 |
| Early-stopping patience | 20 |
| Augmentations | Mosaic, mixup, HSV, translation/scaling, and horizontal flips |
| Mosaic schedule | Strong early; reduced near convergence |
Appendix D. Confusion Matrix
Table A2.
Normalized confusion matrix (%) for four representative defect classes using OptiWood-YOLOv8n.
Table A2.
Normalized confusion matrix (%) for four representative defect classes using OptiWood-YOLOv8n.
| Actual class | Crack | Fingerjoint | Planing torn | Scratch |
|---|---|---|---|---|
| Crack | 78 | 6 | 8 | 8 |
| Fingerjoint | 7 | 82 | 7 | 4 |
| Planing torn | 10 | 6 | 72 | 12 |
| Scratch | 12 | 4 | 10 | 74 |
Columns represent predicted classes and rows represent actual classes.
Appendix E. Training Schedule
Appendix E.1. Cosine Learning-Rate Schedule
We use cosine annealing for the learning rate:
where t is the current training step, T is the total number of training steps, , and is the minimum learning rate.
References
- Fang, Y.; Ma, Y.; Gao, S.; Chen, J. Recent advances in wood surface defect inspection using deep learning (2021–2025). BioResources 2026, 21, 8746–8770. [Google Scholar] [CrossRef]
- Li, R.; Zhong, S.; Yang, X. Wood panel defect detection based on improved YOLOv8n. BioResources 2025, 20, 2556–2573. [Google Scholar] [CrossRef]
- Ma, Y.; Yin, J.; Huang, F.; Li, Q. Surface defect inspection of industrial products with object detection deep networks: A systematic review. Artif. Intell. Rev. 2024, 57, 333. [Google Scholar] [CrossRef]
- An, H.; Liang, Z.; Qin, M.; Huang, Y.; Xiong, F.; Zeng, G. Wood defect detection based on the CWB-YOLOv8 algorithm. J. Wood Sci. 2024, 70, 26. [Google Scholar] [CrossRef]
- Xi, H.; Wang, R.; Liang, F.; Chen, Y.; Zhang, G.; Wang, B. SiM-YOLO: A wood surface defect detection method based on the improved YOLOv8. Coatings 2024, 14, 1001. [Google Scholar] [CrossRef]
- Dou, W.; You, J. A novel wood surface defect detection model based on improved YOLOv8. BioResources 2025, 20, 5709–5730. [Google Scholar] [CrossRef]
- Wang, R.; Liang, F.; Wang, B.; Zhang, G.; Chen, Y.; Mou, X. An efficient and accurate surface defect detection method for wood based on improved YOLOv8. Forests 2024, 15, 1176. [Google Scholar] [CrossRef]
- Roboflow. Roboflow Annotate. Available online: https://docs.roboflow.com/annotate (accessed on 2026).
- Roboflow. Box Prompting (AI Labeling). Available online: https://docs.roboflow.com/annotate/use-roboflow-annotate/box-prompting-ai-labeling (accessed on 2026).
- Zhao, Z.; Yang, X.; Zhou, Y.; Sun, Q.; Ge, Z.; Liu, D. Real-time detection of particleboard surface defects based on improved YOLOV5 target detection. Sci. Rep. 2021, 11, 21777. [Google Scholar] [CrossRef] [PubMed]
- Qiu, Y.; Ai, Z.; Lin, Y.; Xu, Z.; Liu, X. Detecting defects of wooden boards by improved YOLOv4-tiny algorithm. In Proceedings of the 2021 Chinese Intelligent Systems Conference; Springer, 2021; pp. 519–527. [Google Scholar]
- Huang, Z.; Liu, M. PB-YOLOv5: Lightweight YOLOv5 variant for particleboard surface defect detection. Sensors 2023, 23, 1839. [Google Scholar] [CrossRef] [PubMed]
- Cui, W.; Li, Z.; Duanmu, A.; Xue, S.; Guo, Y.; Ni, C.; Zhu, T.; Zhang, Y. CCG-YOLOv7: A wood defect detection model for small targets using improved YOLOv7. IEEE Access 2024, 12, 10575–10585. [Google Scholar] [CrossRef]
- Li, B.; Wang, R.; Liang, F.; et al. BPN-YOLO: A novel method for wood defect detection based on YOLOv7. Forests 2022, 13, 2103. [Google Scholar] [CrossRef]
- Chen, R.; Wang, J.; Liu, Q.; et al. TSW-YOLO-v8n: Optimization of detection algorithms for surface defects on sawn timber. Forests 2024, 15, 125. [Google Scholar] [CrossRef]
- Zhou, J.; Ning, J.; Xiang, Z.; Yin, P. ICDW-YOLO: An efficient timber construction crack detection algorithm. Sensors 2024, 24, 4333. [Google Scholar] [CrossRef] [PubMed]
- Lin, X.; Gong, W.; Sun, L.; Yang, X.; Leng, C. WDNET-YOLO: Enhanced deep learning for structural timber defect detection. Buildings 2025, 15, 2281. [Google Scholar] [CrossRef]
- Li, W.; Zhao, L.; Chen, Y. Transformer-based framework for veneer defect detection. Wood Sci. Technol. 2023. [Google Scholar]
- Ge, Y.; Jiang, D.; Sun, L. Wood veneer defect detection based on multiscale DETR with position encoder net. Sensors 2023, 23, 4837. [Google Scholar] [CrossRef] [PubMed]
- Ren, S.; He, K.; Girshick, R.; Sun, J. Faster R-CNN: Towards real-time object detection with region proposal networks. Adv. Neural Inf. Process. Syst. 2015, 28. [Google Scholar]
- Carion, N.; Massa, F.; Synnaeve, G.; Usunier, N.; Kirillov, A.; Zagoruyko, S. End-to-end object detection with transformers. In Proceedings of the European Conference on Computer Vision (ECCV); Springer: Cham, Switzerland, 2020. [Google Scholar] [CrossRef]
- Zhao, Y.; Lv, W.; Xu, S.; Wei, J.; Wang, G.; Dang, Q.; Liu, Y.; Chen, J. DETRs beat YOLOs on real-time object detection. In Proceedings of the IEEE/CVF Conference on Computer Vision and Pattern Recognition (CVPR), Seattle, WA, USA, 17–21 June 2024; pp. 16965–16974. [Google Scholar] [CrossRef]
- Yaseen, M. What is YOLOv8: An in-depth exploration of the internal features of the next-generation object detector. arXiv 2024, (accessed in 2026). arXiv:2408.15857. Available online: https://arxiv.org/abs/2408.15857.
- Sager, C.; Janiesch, C.; Zschech, P. A survey of image labelling for computer vision applications. J. Bus. Anal. 2021, 4, 91–110. [Google Scholar] [CrossRef]
- Ge, Y.; Ji, H.; Liu, X. Wood surface defect detection based on improved YOLOv8. Signal Image Video Process. 2025, 19, 663. [Google Scholar] [CrossRef]
Figure 1.
Examples of the six wood-defect classes used in this study: blistering, crack, fingerjoint, planing torn, scratch, and wrinkling.
Figure 1.
Examples of the six wood-defect classes used in this study: blistering, crack, fingerjoint, planing torn, scratch, and wrinkling.

Figure 2.
Annotation example of a finger-joint defect.

Figure 3.
Finger-joint annotation using separate bounding boxes.

Figure 4.
Example of a crack defect.

Figure 5.
Example of a finger-joint defect.

Figure 6.
Example of a planing-torn defect.

Figure 7.
Example of a scratch defect.

Figure 8.
Results of the dataset pre-training in Roboflow.

Figure 9.
OptiWood workflow: pre-processing, dataset preparation, data augmentation, model selection, and evaluation.
Figure 9.
OptiWood workflow: pre-processing, dataset preparation, data augmentation, model selection, and evaluation.

Table 1.
YOLO-based models grouped by defect types and related references.
| Model | Defect types | References |
|---|---|---|
| YOLOv4, YOLOv8 | Cracks | [5,7,10,11] |
| YOLOv5, YOLOv8 | Planing torn grain, scratches | [5,7,12] |
| YOLOv7 | Scratches | [13,14] |
| YOLOv8, YOLO (general) | Wrinkling, blistering, glue failures | [4,7] |
| YOLO (general) | General wood defects | [4,15] |
Table 4.
Class-wise validation results for the baseline OptiWood-YOLOv8n configuration.
| Class | Precision | Recall | mAP@0.5 | mAP@0.5:0.95 |
|---|---|---|---|---|
| Blistering | 0.36 | 0.48 | 0.37 | 0.16 |
| Crack | 0.62 | 0.64 | 0.68 | 0.33 |
| Fingerjoint | 0.77 | 0.66 | 0.72 | 0.33 |
| Objects | 0.55 | 0.43 | 0.49 | 0.23 |
| Planing torn | 0.47 | 0.29 | 0.33 | 0.15 |
| Scratch | 0.41 | 0.28 | 0.29 | 0.13 |
| Wrinkling | 0.42 | 0.34 | 0.30 | 0.14 |
Table 5.
Overall comparison of the evaluated object-detection models.
| Model | Precision | Recall | mAP@0.5 | mAP@0.5:0.95 |
|---|---|---|---|---|
| OptiWood-YOLOv8n | 0.54 | 0.47 | 0.46 | 0.23 |
| YOLOv11 | 0.53 | 0.45 | 0.45 | 0.21 |
| RT-DETR | 0.50 | 0.44 | 0.41 | 0.19 |
| Faster R-CNN | 0.41 | 0.32 | 0.34 | 0.13 |
Table 6.
Ablation study of preprocessing and data augmentation for OptiWood-YOLOv8n.
| Setting | Precision | Recall | mAP@0.5 | mAP@0.5:0.95 |
|---|---|---|---|---|
| Baseline | 0.38 | 0.29 | 0.31 | 0.11 |
| Preprocessing only | 0.44 | 0.33 | 0.36 | 0.14 |
| Augmentation only | 0.47 | 0.37 | 0.39 | 0.17 |
| Preprocessing + augmentation | 0.52 | 0.45 | 0.45 | 0.21 |
Table 7.
Effect of class-imbalance mitigation on OptiWood-YOLOv8n performance.
| Method | Precision | Recall | mAP@0.5 | mAP@0.5: 0.95 |
Scratch mAP@0.5 |
Blistering mAP@0.5 |
|---|---|---|---|---|---|---|
| Baseline | 0.52 | 0.45 | 0.45 | 0.21 | 0.29 | 0.37 |
| Imbalance mitigation | 0.54 | 0.47 | 0.46 | 0.23 | 0.33 | 0.39 |
Table 8.
Robustness of the final OptiWood-YOLOv8n model under controlled imaging shifts.
| Imaging condition | Precision | Recall | mAP@0.5 | mAP@0.5:0.95 |
|---|---|---|---|---|
| Nominal (no shift) | 0.54 | 0.47 | 0.46 | 0.23 |
| Brightness | 0.50 | 0.43 | 0.44 | 0.20 |
| Mild motion blur | 0.50 | 0.43 | 0.43 | 0.19 |
| JPEG quality = 60 | 0.51 | 0.44 | 0.45 | 0.21 |
Table 9.
Runtime performance of the evaluated models.
| Model | Preprocessing (ms) |
Inference (ms) |
Postprocessing (ms) |
FPS |
|---|---|---|---|---|
| OptiWood-YOLOv8n | 0.40 | 16.70 | 3.00 | 51.30 |
| YOLOv11 | 0.50 | 18.20 | 3.10 | 47.00 |
| RT-DETR | — | — | — | 35.00 |
| Faster R-CNN | 0.70 | 45.60 | 4.30 | 19.60 |
Disclaimer/Publisher’s Note: The statements, opinions and data contained in all publications are solely those of the individual author(s) and contributor(s) and not of MDPI and/or the editor(s). MDPI and/or the editor(s) disclaim responsibility for any injury to people or property resulting from any ideas, methods, instructions or products referred to in the content. |
© 2026 by the authors. Licensee MDPI, Basel, Switzerland. This article is an open access article distributed under the terms and conditions of the Creative Commons Attribution (CC BY) license.
Copyright: This open access article is published under a Creative Commons CC BY 4.0 license, which permit the free download, distribution, and reuse, provided that the author and preprint are cited in any reuse.