
Submitted:
10 September 2026
Posted:
11 September 2026
You are already at the latest version
Abstract
Breast cancer remains a major cause of cancer-related mortality, and improved molecular characterization of pathological progression may support more objective tissue assessment. Raman spectroscopy (RS) provides a label-free and non-destructive approach for probing the intrinsic biochemical composition of biological tissues. In this study, we establish a Raman-based framework for characterizing biochemical remodeling across representative human breast pathologies and for exploring subtype-associated spectral differences between invasive ductal carcinoma (IDC) and invasive lobular carcinoma (ILC). Formalin-fixed, paraffin-embedded (FFPE) tissues from five patients, representing normal breast tissue, intraductal papilloma, high-grade ductal carcinoma in situ (DCIS), IDC, and ILC, were analyzed using 785 nm excitation over the fingerprint region of 500–2000 cm⁻¹. Spectral preprocessing combining Savitzky–Golay smoothing, airPLS baseline correction, and vector normalization substantially reduced fluorescence-related background contributions and improved the resolution of biochemical Raman features. The spectra revealed progressive attenuation of lipid-associated bands near ~1063, ~1300, and ~1445 cm⁻¹, accompanied by increased relative contributions from protein- and nucleic-acid-associated features near ~1003, ~1420, and 1600–1650 cm⁻¹. The phenylalanine-to-lipid intensity ratio (I1003/I1445) increased from ≤0.2 in normal tissue to ≥1.5 in invasive lesions, providing an interpretable quantitative descriptor of the shift from a lipid-dominant toward a relatively protein-enriched Raman phenotype. IDC and ILC also exhibited distinct spectral characteristics, with IDC showing a prominent ~1618 cm⁻¹ aromatic C=C-associated feature and ILC exhibiting an enhanced ~890 cm⁻¹ carbohydrate-associated contribution. Principal component analysis (PCA) demonstrated clear multivariate organization of the training spectra, while supervised classification using LDA, SVM, random forest, and KNN confirmed that the Raman-derived features contained substantial discriminative information. Among the evaluated models, the RBF-SVM achieved the highest training accuracy of 93.4% and retained an accuracy of 90.0%, sensitivity of 85.7%, and specificity of 100% on a held-out test set. Collectively, these findings support a proof-of-concept framework in which breast pathological progression is associated with coordinated biochemical Raman changes that can be quantified through interpretable spectral descriptors and subsequently exploited for machine-learning classification. Larger patient-level and multi-center studies are required to validate the robustness and clinical generalizability of the proposed approach.
Keywords:
Raman spectroscopy
; breast cancer
; machine learning
; label-free diagnosis
; Google Colab
; optical biopsy
1. Introduction
Breast cancer remains one of the most common malignancies and a leading cause of cancer-related mortality among women worldwide. According to the GLOBOCAN 2022 report, approximately 2.3 million new breast cancer cases and 670,000 deaths were estimated globally in 2022 [1]. In Vietnam, breast cancer is the most commonly diagnosed cancer among women. According to the 2022 statistics, approximately 24,500–25,000 new cases occur annually, with approximately 10,000 deaths per year, accounting for 8.3% of cancer-related mortality [1]. Recent epidemiological data indicate a steady increase in breast cancer incidence, particularly in developing countries, together with a trend toward diagnosis at younger ages [1]. Early detection is recognized as a critical factor in improving treatment outcomes, reducing mortality, and enhancing patients' quality of life [1,2]. Although conventional diagnostic modalities, including mammography, ultrasonography, magnetic resonance imaging (MRI), and histopathological biopsy, remain indispensable and histopathological examination is considered the diagnostic reference standard, these approaches are associated with inherent limitations, including invasiveness, high operational costs, prolonged turnaround times, and dependence on the expertise and interpretation of individual practitioners [1,2,3].
To address these challenges, biospectroscopic techniques have emerged as promising complementary approaches for cancer screening and tissue characterization [3]. Among them, Raman spectroscopy (RS) has attracted considerable attention as a molecularly sensitive analytical technique capable of probing the intrinsic biochemical composition of biological specimens through their molecular vibrational modes [3,4]. Based on the inelastic scattering of photons, Raman spectroscopy produces characteristic spectral bands associated with specific molecular bonds and biochemical constituents, thereby providing a molecular fingerprint that can be used to distinguish between normal and pathological tissue states [3].
Malignant transformation of breast tissue is accompanied by profound biochemical and metabolic alterations involving proteins, lipids, nucleic acids, and other cellular constituents [5]. These biochemical changes can be reflected in Raman spectra through variations in peak position, intensity, and full width at half maximum (FWHM) [5,6]. Several Raman bands have been widely associated with diagnostically relevant biochemical components, including the ~785 cm⁻¹ band attributed primarily to nucleic acids, the ~1002 cm⁻¹ phenylalanine band, the ~1445 cm⁻¹ CH₂ deformation band associated with lipids and proteins, and the Amide I band near ~1655 cm⁻¹, which is sensitive to protein secondary structure [5,7]. Such biochemical sensitivity makes Raman spectroscopy particularly attractive for investigating molecular changes that accompany the transition from non-neoplastic to malignant tissue.
However, Raman spectra acquired from biological tissues are intrinsically complex and are affected by fluorescence backgrounds, instrumental noise, spectral variability, and biological heterogeneity, making direct manual interpretation challenging [8,9,10]. Computational methods, particularly machine learning (ML) and deep learning (DL), have therefore increasingly been incorporated into Raman-based cancer analysis. These approaches can facilitate spectral preprocessing, feature extraction, dimensionality reduction, and automated classification, thereby improving the efficiency and reproducibility of spectral analysis [1,3]. Deep learning architectures, such as convolutional neural networks (CNNs), can additionally learn complex spectral representations that may be difficult to identify through conventional feature-based analysis.
The integration of Raman spectroscopy with advanced computational approaches has consequently enabled high-throughput analysis and improved classification performance across a range of cancer-related applications [11,12]. Machine-learning models can potentially establish an end-to-end analytical workflow from spectral acquisition to automated classification, reducing dependence on manual spectral interpretation and facilitating the analysis of large spectral datasets [3,5,13]. Such computational frameworks may also support future development of portable and point-of-care Raman systems, particularly in settings where access to advanced diagnostic infrastructure is limited.
Several recent studies have demonstrated the potential of AI-assisted Raman analysis for cancer classification. For example, a recently reported random-stacked convolutional neural network (RS-CNN) trained on a relatively large spectral dataset (450 spectra per cell line) achieved an accuracy of 98.63%, whereas conventional models such as CNN, SVM, and LDA showed lower performance of approximately 85% [7,14]. When the number of spectra was reduced to 100 per cell line, the RS-CNN retained an accuracy of 91.47%, while conventional CNN performance decreased to 70.83% [7]. Raman spectroscopy combined with chemometric and machine-learning approaches has also demonstrated high classification performance in other cancer types, including prostate cancer and gastric cancer, with reported classification accuracies or AUC values approaching or exceeding 95% in selected datasets [1,3,15]. These findings highlight the potential of computational Raman spectroscopy for extracting clinically relevant information from complex biological spectra.
Importantly, the value of machine learning extends beyond classification performance. Interpretable approaches, including feature-importance analysis and SHAP-based methods, can identify spectral regions that contribute most strongly to model decisions, thereby providing a potential link between computational predictions and underlying biochemical processes [7]. Such approaches may facilitate the identification of spectroscopic biomarkers and improve the biological interpretability of Raman-based classification models. For example, specific spectral regions around 980, 1158–1160, and 1603–1607 cm⁻¹ have been reported as potentially informative for cancer discrimination and subtype classification [7].
Despite these advances, several important challenges remain before Raman–AI approaches can be translated into robust clinical applications. Experimental Raman spectra often differ substantially from idealized reference spectra because of fluorescence, tissue heterogeneity, sample preparation, instrumental variation, and other experimental factors [11]. These challenges are particularly relevant to formalin-fixed, paraffin-embedded (FFPE) tissues, in which strong fluorescence backgrounds can obscure diagnostically relevant Raman features [11]. In addition, Raman studies of breast tissue in Vietnam remain relatively limited, particularly those addressing histopathological heterogeneity at the tissue level and incorporating standardized computational workflows for spectral preprocessing, feature extraction, and classification [11]. Consequently, reproducible analytical frameworks are needed to characterize biochemical spectral variation across pathological states while minimizing the influence of fluorescence and technical variability. At the same time, models should ideally provide interpretable spectral features rather than relying exclusively on prediction accuracy.
More importantly, most existing Raman-based breast cancer studies have primarily focused on distinguishing malignant from non-malignant tissue or on maximizing classification performance, whereas the biochemical spectral trajectory across multiple histopathological states and the spectroscopic differentiation of distinct invasive carcinoma subtypes remain comparatively less explored. In particular, it remains unclear whether Raman spectral features can capture a continuous biochemical transition from normal and benign tissue through high-grade ductal carcinoma in situ (DCIS) to invasive carcinoma, and whether distinct spectral phenotypes can be resolved between invasive ductal carcinoma (IDC) and invasive lobular carcinoma (ILC). Addressing these questions is important because IDC and ILC represent biologically and morphologically distinct invasive breast carcinoma subtypes, yet their discrimination using label-free spectroscopic information remains challenging.
Therefore, rather than using machine learning solely as a predictive classification tool, the present study combines biochemical Raman profiling with quantitative spectral descriptors and machine-learning analysis to investigate pathological progression and invasive subtype-associated spectral phenotypes. Particular attention is given to the coordinated evolution of lipid-, protein-, nucleic-acid-, and carbohydrate-associated Raman features and to intensity ratios that quantify changes in the relative biochemical composition of the tissue.
To address these gaps, this study aims to establish a biochemically interpretable Raman spectral framework for breast pathological progression and invasive subtype discrimination, together with a reproducible computational workflow for spectral analysis. Specifically, the study: (i) characterizes Raman spectral profiles across five histopathological groups, including normal breast tissue, intraductal papilloma, high-grade DCIS, invasive ductal carcinoma (IDC), and invasive lobular carcinoma (ILC); (ii) establishes a systematic preprocessing workflow combining Savitzky–Golay smoothing, airPLS baseline correction, and vector normalization to reduce fluorescence and technical background effects in FFPE tissue spectra; (iii) identifies characteristic vibrational modes and quantitative spectroscopic biomarkers associated with pathological progression and subtype-specific biochemical phenotypes; and (iv) integrates dimensionality reduction and machine-learning classifiers within an accessible Google Colab workflow to evaluate the reproducibility and discriminative capability of the identified spectral patterns. The central hypothesis is that breast pathological progression is accompanied by a measurable Raman spectral trajectory characterized by coordinated changes in lipid-, protein-, nucleic-acid-, and carbohydrate-associated signals, and that invasive IDC and ILC exhibit distinguishable biochemical spectral phenotypes.
2. Materials and Methods
2.1. Physical Principles of Raman Spectroscopy
The physical foundation of Raman spectroscopy in oncology resides in inelastic scattering of photons following their interaction with molecular vibrational modes. When incident photons with energy E₀ = hν₀ interact with breast tissue, the predominant outcome is elastic Rayleigh scattering. However, a negligible fraction (approximately 10⁻⁷) undergoes energy exchange—the Raman effect [16]. This interaction produces Stokes and Anti-Stokes shifts; the former is primarily utilized in clinical diagnostics due to its higher intensity at physiological temperatures, as governed by Boltzmann distribution. The Raman shift (Δν), measured in wavenumbers (cm⁻¹), is independent of excitation wavelength and acts as a direct probe of vibrational frequencies of specific chemical bonds (e.g., C-H, C=C, P-O₂). In breast cancer analysis, the Raman spectrum functions as a high-resolution "molecular fingerprint," capturing the intrinsic biochemical transition from healthy to pathological states [3].
2.2. Study Subjects and Specimen Collection
Formalin-fixed, paraffin-embedded (FFPE) breast tissue specimens were obtained from five representative patients undergoing diagnostic biopsy at K Hospital (Tan Trieu Campus), Hanoi, Vietnam. The sample cohort encompassed the following histopathological classifications:

Table 1.
Histopathological Classification of Patient Specimens.
| No. | Specimen Code | Histopathological Diagnosis | Pathological Classification | Lables |
|---|---|---|---|---|
| 1 | K3-24-34265 | Intraductal papilloma | Benign | Negative |
| 2 | K3-24-71173 | Normal breast tissue | Healthy Control | Negative |
| 3 | K3-24-54485 | Invasive lobular carcinoma (ILC) | Malignant | Positive |
| 4 | K3-24-71484 | Invasive ductal carcinoma (IDC) | Malignant | Positive |
| 5 | K3-24-57744 | Ductal carcinoma in situ (DCIS), high grade | Non-invasive malignant lesion | Positive |
Histopathological diagnosis was independently confirmed by two experienced pathologists according to World Health Organization (WHO) classification guidelines. All procedures were approved by the institutional ethics review board, and informed consent was obtained from all participants.
2.3. Raman Spectroscopic Acquisition
Tissue sections of 5 μm thickness were prepared using a microtome and mounted on CaF₂ slides to minimize background interference. All specimens were deparaffinized using standard xylene and ethanol gradients prior to spectroscopic analysis.
Raman spectra were acquired using a confocal Raman microscope system equipped with a 785 nm near-infrared diode laser excitation source (XploRA PLUS, Horiba Scientific). The 785 nm wavelength was selected to minimize tissue autofluorescence while maintaining adequate Raman scattering cross-sections. A 100× objective lens (numerical aperture 0.90, Olympus) was employed for spectral acquisition.
For each designated region of interest (ROI), spectra were systematically collected in the fingerprint region (500–2000 cm⁻¹). The spectral integration time was optimized at 10 seconds per measurement, with three consecutive accumulations performed at each acquisition point to substantially enhance the signal-to-noise ratio (SNR). To prevent potential thermal damage and photobleaching artifacts, laser power delivered to the sample surface was strictly maintained at 15 mW. Multi-point evaluations were performed across topologically distinct areas within each specimen to assess intra-tissue heterogeneity. Multi-point evaluations were performed across topologically distinct areas within each specimen to assess intra-tissue heterogeneity. Specifically, 20 Raman spectra were systematically collected at varying locations across 5 tissue sections per patient, yielding a total of 100 spectral datasets compiled from 5 patients.
2.4. Spectral Preprocessing Pipeline on Google Colab
To mitigate formidable fluorescence interference peaking near 1500 cm⁻¹ in FFPE specimens, a multi-step post-acquisition computational workflow was implemented in Python on Google Colab [17,18]. The complete preprocessing pipeline was developed as an open-source Jupyter Notebook, ensuring reproducibility and accessibility for clinical translation. All spectral files (.txt format) were read using pandas, with wavenumber and intensity columns automatically detected. To ensure consistency across samples, all spectra were interpolated onto a common wavenumber axis using linear interpolation (scipy.interpolate.interp1d), with the first file serving as the reference axis. This alignment was critical to maintain uniform feature dimensions for subsequent machine learning analysis. High-frequency instrumental noise was reduced without distorting underlying biological signals using a Savitzky-Golay filter (second-order polynomial, 15-point window) implemented via scipy.signal.savgol_filter [17]. To decouple subtle Raman transitions from the dominant fluorescence background, baseline subtraction was performed using the Adaptive Iterative Reweighted Penalized Least Squares (airPLS) algorithm implemented via pybaselines.Baseline.arpls [18]. Key parameters included λ = 10⁵ (smoothness) and p = 0.01 (asymmetry), optimized empirically to balance baseline fitting accuracy without distorting Raman signals. Following baseline correction, spectra were subjected to vector normalization (L₂-norm) over the entire spectral range using numpy.linalg.norm to account for sample thickness variations and laser power fluctuations.
2.5. Feature Extraction
Following preprocessing, a structured feature extraction protocol was implemented to capture diagnostic spectral information [11,19]. Features were extracted from the following Raman bands. Primary peak intensities: ~890 cm⁻¹ (carbohydrates), ~1003 cm⁻¹ (phenylalanine), ~1063 cm⁻¹ (lipids), ~1300 cm⁻¹ (lipids), ~1420 cm⁻¹ (nucleic acids), ~1445 cm⁻¹ (lipids/proteins), ~1618 cm⁻¹ (aromatic C=C), and ~1650 cm⁻¹ (Amide I); Derived intensity ratios: Phenylalanine-to-lipid ratio: I₁₀₀₃ / I₁₄₄₅ (marker of malignant progression); Amide I-to-lipid ratio: I₁₆₁₈ / I₁₀₆₃ (protein conformational changes); Carbohydrate-to-lipid ratio: I₈₉₀ / I₁₀₆₃ (Warburg effect marker, particularly for ILC); Nucleic acid-to-lipid ratio: I₁₄₂₀ / I₁₄₄₅ (elevated nuclear-to-cytoplasmic ratio). Peak intensities were extracted as mean values within a ±5 cm⁻¹ window centered at each diagnostic band. All feature extraction was performed using NumPy and Pandas libraries within the Google Colab environment.
2.6. Machine Learning Pipeline
An integrated machine learning pipeline was developed for automated classification of breast tissue pathologies, comprising the following steps: i/ Data Preparation and Preprocessing: Class labels were encoded using sklearn.preprocessing.LabelEncoder. The feature matrix was standardized using sklearn.preprocessing.StandardScaler to ensure zero mean and unit variance, preventing features with larger scales from dominating model training. Data were partitioned into training (70%) and testing (30%) sets using stratified random sampling (sklearn.model_selection.train_test_split) to preserve class distribution; ii/ Dimensionality Reduction: Principal Component Analysis (PCA) was applied using sklearn.decomposition.PCA to reduce feature dimensionality while retaining 95% of cumulative explained variance. This approach mitigated overfitting risk and enabled visualization of high-dimensional spectral data in reduced space; iii/ Classification Models: Five supervised learning algorithms were implemented and evaluated: Linear Discriminant Analysis (LDA), Support Vector Machine (SVM), Random Forest, Gradient Boosting, K-Nearest Neighbors (KNN); iv/ Model Evaluation: Model performance was evaluated using multiple metrics as: Accuracy, Precision, Sensitivity, Confusion Matrix.
3. Results and Discussion
3.1. Raman Spectral Characteristics Across Breast Tissue Pathologies
Raman spectra were acquired from five histopathological groups of FFPE breast tissues over the fingerprint region (500–2000 cm⁻¹). Following preprocessing using Savitzky–Golay smoothing, airPLS baseline correction, and vector normalization, fluorescence-related background contributions were substantially reduced, allowing the underlying biochemical Raman features to be more clearly resolved and revealing distinct spectral patterns among the investigated pathological groups.
As shown in Figure 1a, the raw spectra exhibited pronounced background variation, noise, and several high-intensity spectral fluctuations that partially obscured diagnostically relevant Raman features. Following preprocessing, these contributions were markedly reduced, and the characteristic biochemical bands became more clearly resolved (Figure 1b). Despite substantial differences in relative band intensities among the histopathological groups, the spectra shared a common set of Raman features associated with major tissue constituents, including lipids, proteins, carbohydrates, and nucleic acids. Importantly, the relative contributions of these biomolecular components varied systematically across the investigated pathological states.
Normal breast tissue exhibited a predominantly lipid-rich spectral phenotype, characterized by prominent bands near ~1063 cm⁻¹ (C–C stretching), ~1300 cm⁻¹ (CH₂ twisting), and ~1445 cm⁻¹ (CH₂/CH₃ deformation). In contrast, the phenylalanine-associated band at ~1003 cm⁻¹ was relatively weak, resulting in a low phenylalanine-to-lipid intensity ratio (I1003/I1445≪1). Collectively, these spectral characteristics are consistent with the lipid-rich biochemical composition expected for normal breast tissue.
The spectra of intraductal papilloma displayed an intermediate biochemical profile between normal tissue and the malignant groups. A modest increase in the phenylalanine-associated band at ~1003 cm⁻¹ was observed relative to normal tissue, accompanied by a moderate attenuation of lipid-associated bands. The I1003/I1445 ratio ranged from approximately 0.2 to 0.5, indicating a shift in the relative protein-to-lipid spectral contribution while retaining substantial lipid-associated features.
High-grade DCIS exhibited more pronounced spectral remodeling. Increased contributions were observed in the carbohydrate-associated region near ~890 cm⁻¹ and the phenylalanine-associated band at ~1003 cm⁻¹, accompanied by attenuation of the lipid-associated bands near ~1063 and ~1300 cm⁻¹. A feature near ~1420 cm⁻¹, associated with CH₂ deformation and contributions from nucleic-acid-containing cellular components, also became more prominent. The I1003/I1445 ratio increased to approximately 0.6–1.0, indicating a further shift from a lipid-dominant toward a protein-enriched spectral phenotype.
IDC exhibited a markedly altered Raman phenotype relative to the non-invasive groups. A prominent band near ~1618 cm⁻¹, assigned to aromatic C=C-associated vibrations, was observed together with an enhanced phenylalanine-associated signal near ~1003 cm⁻¹. Concurrently, the major lipid-associated bands near ~1063 and ~1300 cm⁻¹ were substantially attenuated. The I1003/I1445 ratio exceeded 1.5 in the investigated IDC spectra, indicating a pronounced shift in the relative protein-to-lipid spectral contribution. These spectral changes are consistent with extensive biochemical remodeling associated with invasive carcinoma.
ILC exhibited a distinct spectral phenotype together with greater variation in relative band intensities across the measured spectra. Although the positions of the major Raman bands remained reproducible (Δν < 2 cm⁻¹), their relative intensities varied substantially. Some sampling locations retained appreciable lipid-associated signals, whereas others showed pronounced lipid attenuation accompanied by an enhanced carbohydrate-associated feature near ~890 cm⁻¹. This pattern suggests greater biochemical heterogeneity within the investigated ILC tissue and is consistent with alterations in carbohydrate-associated metabolism; however, confirmation of a specific metabolic mechanism would require complementary biochemical or metabolomic measurements.
Taken together, the spectra in Figure 1 reveal a coordinated biochemical transition across the investigated histopathological states, characterized predominantly by progressive attenuation of lipid-associated Raman features and increasing contributions from protein-, nucleic-acid-, and carbohydrate-associated bands. Rather than representing isolated peak changes, these coordinated spectral alterations suggest a multivariate biochemical trajectory accompanying breast pathological progression. The quantitative evolution of these spectral features and their intensity ratios is examined in the following section.
3.2. Quantitative Raman Signatures of Biochemical Progression
The transition from normal breast tissue to malignant lesions was accompanied by a marked change in the relative contribution of protein- and lipid-associated Raman signals. In particular, the intensity ratio I1003/I1445, representing the relative contribution of the phenylalanine-associated band at ~1003 cm⁻¹ to the lipid/protein-associated band at ~1445 cm⁻¹, showed a progressive increase across the investigated pathological states. Table 2 summarizes the observed I1003/I1445 ranges from normal tissue to invasive carcinoma.
Figure 2 shows the distribution of the phenylalanine-to-lipid intensity ratio (I1003/I1445) between the Negative and Positive spectral classes. The Negative group, comprising normal breast tissue and intraductal papilloma, exhibited a relatively narrow distribution centered at low ratio values, with a median of 0.15 (IQR: 0.09–0.23; n = 17spectra). In contrast, the Positive group, comprising high-grade DCIS, IDC, and ILC, showed a markedly higher I1003/I1445 ratio, with a median of 1.42 (IQR: 1.25–1.71; n = 53spectra). The difference between the two spectral classes was statistically significant (Mann–Whitney Utest, p < 0.001).
The approximately 9.5-fold difference in median I1003/I1445 between the Positive and Negative groups indicates a pronounced alteration in the relative biochemical composition of the investigated tissues. Specifically, the increase in this ratio is consistent with the coordinated spectral changes observed in Figure 1, where attenuation of lipid-associated Raman bands was accompanied by an increased relative contribution of the phenylalanine-associated band at ~1003 cm⁻¹. Thus, rather than reflecting an isolated change in a single Raman band, I1003/I1445 provides a quantitative descriptor of the transition from a lipid-dominant spectral phenotype in normal/benign tissue toward a relatively protein-enriched phenotype in malignant lesions.
The Positive group also exhibited a broader distribution than the Negative group, as reflected by its larger interquartile range (1.25–1.71 versus 0.09–0.23). This increased spectral variability may reflect greater biochemical heterogeneity within the Positive class, which encompasses three histopathologically distinct malignant lesions—high-grade DCIS, IDC, and ILC. Such heterogeneity is consistent with the progressive and subtype-dependent spectral remodeling observed across these pathological states.
Notably, the two distributions showed minimal overlap in the present dataset, with Negative spectra predominantly occupying the low-ratio region and Positive spectra occurring at substantially higher values. This separation demonstrates that I1003/I1445 contains substantial discriminative information for distinguishing the investigated normal/benign and malignant spectral classes. Nevertheless, the apparent separation between the two groups should not be interpreted as a clinically validated diagnostic threshold. Establishment of a robust cut-off would require threshold optimization using receiver operating characteristic analysis and subsequent validation in a larger, independent patient cohort.
Taken together, these findings support I1003/I1445 as an interpretable spectroscopic descriptor of the biochemical changes accompanying breast pathological progression. When considered alongside subtype-associated Raman features, including the ~1618 cm⁻¹ aromatic C=C-associated band observed in IDC and the ~890 cm⁻¹ carbohydrate-associated feature in ILC, this ratio provides a biologically interpretable basis for the subsequent multivariate and machine-learning analyses.
3.3. Multivariate Spectral Organization and Machine-Learning Classification
Principal component analysis (PCA) was applied to the standardized feature matrix comprising eight Raman peak intensities and four derived intensity ratios. The first three principal components explained 72.22% of the total variance, with PC1, PC2, and PC3 accounting for 42.33%, 17.49%, and 12.40%, respectively.
PCA was initially performed on the training dataset to investigate the intrinsic multivariate organization of the Raman spectral features. As shown in Figure 3, PC1 and PC2 together accounted for 59.82% of the total variance. The 17 Negative training spectra were distributed predominantly at negative PC1 scores, whereas the 53 Positive training spectra were located mainly at positive PC1 scores. Consequently, the two classes exhibited substantial separation in the PC1–PC2 score space, with limited visual overlap between their distributions.
The Positive class exhibited a broader distribution, particularly along PC2, indicating greater within-class spectral variability than the Negative class. This broader dispersion may reflect the greater biochemical and histopathological heterogeneity of the Positive group, which comprises high-grade DCIS, IDC, and ILC. Because PCA is an unsupervised dimensionality-reduction technique, class labels were not used to optimize the observed separation. Thus, the clustering pattern reflects intrinsic differences in the multivariate Raman feature space rather than a supervised class boundary. These findings provided a rationale for subsequent supervised classification.
Five supervised machine-learning algorithms—linear discriminant analysis (LDA), support vector machine (SVM), random forest (RF), gradient boosting, and k-nearest neighbors (KNN)—were evaluated using the 70-spectrum training dataset. Among the investigated classifiers, the RBF-kernel SVM achieved the highest training-stage classification performance, with an accuracy of 93.4%, followed closely by random forest (93.2%) and gradient boosting (93.0%). LDA and KNN achieved lower accuracies of 89.2% and 87.7%, respectively (Table 3). Based on its superior performance during model development, the optimized SVM was selected for subsequent evaluation using the held-out test dataset.
3.4. Held-Out Test-Set Performance of the Optimized SVM Model
The final optimized SVM classifier was evaluated on a held-out test set comprising 30 spectra that were not used for model fitting. As shown in Figure 4, 27 of the 30 test spectra were correctly classified, corresponding to an overall test accuracy of 90.0%. Of the 21 Positive spectra, 18 were correctly classified and three were misclassified as Negative, yielding a sensitivity of 85.71%. All nine Negative spectra were correctly identified, corresponding to a specificity of 100%. No false-positive predictions were observed, resulting in a positive predictive value (PPV) of 100%, whereas the negative predictive value (NPV) was 75.0%.
The decrease in accuracy from 93.4% during model development to 90.0% on the held-out test set was modest, indicating that the SVM retained substantial discriminatory capability when applied to spectra not used for model fitting. Importantly, the test-set results provide a more appropriate estimate of predictive performance than the training-stage accuracy. The absence of false-positive predictions demonstrates high specificity within the evaluated test set, whereas the three false-negative predictions indicate that sensitivity was comparatively lower and that a subset of malignant spectra retained spectral characteristics overlapping with those of the Negative class.
Taken together, the unsupervised PCA and supervised SVM analyses provide complementary evidence for class discrimination. PCA revealed intrinsic multivariate organization of the training spectra, whereas the held-out test evaluation demonstrated that this spectral structure could be translated into predictive classification. These results support the utility of the extracted Raman biomarkers as an interpretable feature space for distinguishing the investigated Negative and Positive spectral classes.
3.4. Discussion
The Raman spectral analysis of the investigated breast tissue pathologies revealed a systematic biomolecular shift accompanying malignant transformation. Progressive attenuation of the lipid-associated Raman bands near ~1063, ~1300, and ~1445 cm⁻¹ was observed from normal and benign tissues toward malignant lesions [5]. This trend is consistent with the progressive disruption or replacement of lipid-rich breast stroma by increasingly cellular neoplastic tissue [3,5]. Altered lipid metabolism is also a well-recognized feature of cancer progression, involving changes in fatty-acid synthesis, utilization, and β-oxidation pathways that support enhanced cellular proliferation [20]. Nevertheless, the Raman measurements obtained in the present study should primarily be interpreted as evidence of altered tissue biochemical composition rather than as direct measurements of specific metabolic pathways.
Concurrently, protein-associated Raman contributions near ~1003 cm⁻¹ and ~1618–1650 cm⁻¹ became more prominent in malignant tissues. The phenylalanine ring-breathing mode near ~1003 cm⁻¹ is particularly informative because it reflects protein-associated spectral contributions that may increase with cellular density and proliferative activity [11]. The progressive increase in the I1003/I1445 ratio from approximately 0.2 in normal tissue to values above 1.5 in invasive lesions therefore provides an interpretable quantitative descriptor of the transition from a lipid-dominant toward a relatively protein-enriched Raman phenotype. In the present dataset, this ratio showed a marked separation between the Negative and Positive spectral groups, supporting its potential value as a candidate spectroscopic marker of pathological progression.
Distinct spectral characteristics were also observed between IDC and ILC. IDC exhibited a prominent Raman band near ~1618 cm⁻¹, attributed primarily to aromatic C=C-related vibrations involving aromatic amino-acid residues such as tyrosine and phenylalanine. The increased contribution of this band may be consistent with altered protein composition and stromal remodeling associated with invasive ductal lesions [5,11]. However, assigning this feature specifically to collagen remodeling or a desmoplastic response would require complementary histological or molecular validation. In contrast, ILC showed an enhanced carbohydrate-associated Raman feature near ~890 cm⁻¹ together with greater spectral heterogeneity. The I890/I1063 ratio was higher in ILC than in IDC, with mean values of approximately 1.24 and 0.56, respectively, suggesting a greater relative contribution of carbohydrate-associated spectral components in ILC. This observation is consistent with altered carbohydrate metabolism in malignant tissue. Although enhanced glycolytic metabolism is widely associated with the Warburg effect [17,19], the ~890 cm⁻¹ Raman feature alone cannot be considered direct evidence of aerobic glycolysis. Confirmation of such a metabolic mechanism would require complementary biochemical, molecular, or metabolomic measurements.
Machine-learning analysis further demonstrated that the Raman-derived features contained substantial discriminative information. Among the evaluated classifiers, the RBF-SVM achieved the highest training accuracy of 93.4%, followed by Random Forest at 93.2%. More importantly, the optimized SVM retained an overall accuracy of 90.0% when evaluated on the held-out test set, with a sensitivity of 85.71% and a specificity of 100%. The relatively modest decrease from 93.4% training accuracy to 90.0% held-out test accuracy suggests that the model preserved a high level of discriminative performance when applied to spectra not used during model fitting. The absence of false-positive predictions in the held-out test set is noteworthy, resulting in a specificity and positive predictive value of 100% within the present dataset. In contrast, three Positive spectra were misclassified as Negative, reducing the sensitivity to 85.71%. This finding indicates that a subset of malignant spectra retained biochemical characteristics that overlapped with the Negative spectral phenotype. Therefore, future optimization should focus not only on overall accuracy but also on reducing false-negative classifications, which are particularly important in potential diagnostic applications.
The observed classification performance is comparable with previous Raman-based breast cancer studies reporting accuracies in the range of approximately 85–92% [15,18,21,22]. However, direct comparison should be made cautiously because reported performance depends strongly on sample type, cohort size, preprocessing strategy, feature selection, class definition, and validation protocol. In the present work, the integration of interpretable biochemical descriptors with multivariate and machine-learning analysis is particularly relevant because it links classification performance to measurable Raman spectral changes rather than relying exclusively on algorithmic prediction.
Taken together, the results support a hierarchical analytical framework in which pathological progression is first reflected by coordinated biochemical changes in the Raman spectra, subsequently quantified through interpretable intensity ratios such as I1003/I1445, captured at the multivariate level by PCA, and finally exploited for supervised classification. This integration of biochemical interpretability with machine-learning analysis represents an important feature of the present study and provides a stronger mechanistic basis for classification than a purely black-box predictive approach.
Several limitations should nevertheless be acknowledged. First, the study involved FFPE tissue specimens from only five patients, which limits the statistical power and biological generalizability of the findings. Second, multiple Raman spectra acquired from the same specimen should be regarded as technical or spatially resolved spectral observations rather than fully independent biological replicates. Third, the subtype-associated Raman features identified for IDC and ILC require confirmation in larger cohorts with sufficient patient-level representation of each histopathological subtype. Finally, variations introduced by fixation, paraffin embedding, tissue preparation, and instrumental conditions may affect Raman intensities and should be systematically evaluated before inter-laboratory translation.
Future studies should therefore prioritize larger patient cohorts, patient-level validation, multi-center testing, and standardized Raman acquisition and preprocessing protocols. Multimodal spectroscopic integration may also provide additional value; in particular, combining Raman spectroscopy with Fourier-transform infrared spectroscopy (FTIR) could offer complementary molecular information and potentially improve tissue characterization. As larger spectral databases become available, deep-learning and explainable artificial-intelligence approaches may further enhance feature extraction and model interpretation. In addition, complementary histochemical, molecular, and metabolomic analyses could provide independent validation of the biological mechanisms underlying the observed spectral changes.
Overall, the present findings support a proof-of-concept framework in which breast pathological progression is associated with coordinated biochemical changes in Raman spectra, quantified through interpretable spectroscopic ratios, captured by multivariate analysis, and subsequently utilized for machine-learning classification. Although larger and independently validated clinical datasets are required before clinical translation, this framework provides a promising basis for the future development of Raman-assisted computational pathology.
5. Conclusion
This study demonstrates the feasibility of combining near-infrared Raman spectroscopy with interpretable spectral analysis and machine learning for label-free characterization and classification of human breast tissue pathologies. A multi-step computational workflow incorporating spectral preprocessing, feature extraction, dimensionality reduction, and supervised classification was implemented in Python using Google Colab. The Raman analysis revealed a coordinated biochemical shift across pathological progression, characterized by attenuation of lipid-associated bands and a relative increase in protein-associated spectral contributions. In particular, the phenylalanine-to-lipid intensity ratio (I1003/I1445) increased from ≤0.2 in normal breast tissue to ≥1.5 in invasive lesions, supporting its potential as an interpretable spectroscopic descriptor of the transition from a lipid-dominant toward a relatively protein-enriched tissue phenotype. Subtype-associated spectral differences were also observed between invasive ductal carcinoma (IDC) and invasive lobular carcinoma (ILC). The I890/I1063ratio was higher in ILC than in IDC, with mean values of approximately 1.24 and 0.56, respectively, suggesting differences in the relative contribution of carbohydrate-associated spectral components between the two invasive subtypes. These findings should be regarded as candidate subtype-associated Raman signatures requiring confirmation in larger patient cohorts. Among the evaluated machine-learning models, the RBF-SVM achieved the highest training accuracy of 93.4%. More importantly, when applied to the held-out test set, the optimized SVM achieved an overall accuracy of 90.0%, with a sensitivity of 85.71% and a specificity of 100%. These results indicate that the Raman-derived features retained substantial discriminative information when applied to spectra not used during model fitting. The present study establishes a proof-of-concept Raman framework that links biochemical spectral remodeling, quantitative intensity ratios, multivariate analysis, and machine-learning classification. Rather than relying solely on predictive accuracy, the proposed approach provides a biochemically interpretable basis for distinguishing the investigated breast tissue classes. Nevertheless, because the present study included only five patients and multiple spectra were acquired from individual tissue specimens, larger patient-level and multi-center validation studies are required before clinical translation. Future work should also investigate multimodal integration with complementary techniques such as FTIR spectroscopy and explainable machine-learning approaches to further improve tissue characterization and model interpretability.
Acknowledgments
This research was funded by the basic research project BENH VIEN K, number: 1002/QD-BVK-131.
References
- Bray, F.; Laversanne, M.; Sung, H.; Ferlay, J.; Siegel, R.L.; Soerjomataram, I.; Jemal, A. Global Cancer Statistics 2022: GLOBOCAN Estimates of Incidence and Mortality Worldwide for 36 Cancers in 185 Countries. CA. Cancer J. Clin. 2024, 74, 229–263. [Google Scholar] [CrossRef] [PubMed]
- Eberhardt, K.; Stiebing, C.; Matthäus, C.; Schmitt, M.; Popp, J. Advantages and Limitations of Raman Spectroscopy for Molecular Diagnostics: An Update. Expert Rev. Mol. Diagn. 2015, 15, 773–787. [Google Scholar] [CrossRef] [PubMed]
- Talari, A.C.S.; Movasaghi, Z.; Rehman, S.; Rehman, I.U. Raman Spectroscopy of Biological Tissues. Appl. Spectrosc. Rev. 2015, 50, 46–111. [Google Scholar] [CrossRef]
- Bitar, R.A.; Martinho, H.D.S.; Tierra-Criollo, C.J.; Zambelli Ramalho, L.N.; Netto, M.M.; Martin, A.A. Biochemical Analysis of Human Breast Tissues Using Fourier-Transform Raman Spectroscopy. J. Biomed. Opt. 2006, 11, 054001. [Google Scholar] [CrossRef] [PubMed]
- Movasaghi, Z.; Rehman, S.; Rehman, I.U. Raman Spectroscopy of Biological Tissues. Appl. Spectrosc. Rev. 2007, 42, 493–541. [Google Scholar] [CrossRef]
- Zúñiga, W.C.; Jones, V.; Anderson, S.M.; Echevarria, A.; Miller, N.L.; Stashko, C.; Schmolze, D.; Cha, P.D.; Kothari, R.; Fong, Y.; et al. Raman Spectroscopy for Rapid Evaluation of Surgical Margins during Breast Cancer Lumpectomy. Sci. Rep. 2019, 9, 14639. [Google Scholar] [CrossRef] [PubMed]
- Czamara, K.; Majzner, K.; Pacia, M.Z.; Kochan, K.; Kaczor, A.; Baranska, M. Raman Spectroscopy of Lipids: A Review. J. Raman Spectrosc. 2015, 46, 4–20. [Google Scholar] [CrossRef]
- Bari, R.Z.A.; Usman, M.; Huda, N.U.; Javed, M.A.; Tamulevičius, S.; Zhang, X. Advanced Artificial Intelligence Combined with SERS Platforms for Diagnosis and Therapeutic Effects of Cancer in Clinical Applications. Spectrochim. Acta. A. Mol. Biomol. Spectrosc. 2026, 348, 127053. [Google Scholar] [CrossRef] [PubMed]
- Conforti, P.M.; Lazzini, G.; Russo, P.; D’Acunto, M. Raman Spectroscopy and AI Applications in Cancer Grading: An Overview. IEEE Access 2024, 12, 54816–54852. [Google Scholar] [CrossRef]
- Majumder, S.K.; Keller, M.D.; Boulos, F.I.; Kelley, M.C.; Mahadevan-Jansen, A. Comparison of Autofluorescence, Diffuse Reflectance, and Raman Spectroscopy for Breast Tissue Discrimination. J. Biomed. Opt. 2008, 13, 054009. [Google Scholar] [CrossRef] [PubMed]
- Kong, K.; Kendall, C.; Stone, N.; Notingher, I. Raman Spectroscopy for Medical Diagnostics — From in-Vitro Biofluid Assays to in-Vivo Cancer Detection. Adv. Drug Deliv. Rev. 2015, 89, 121–134. [Google Scholar] [CrossRef] [PubMed]
- Ning, T.; Li, H.; Chen, Y.; Zhang, B.; Zhang, F.; Wang, S. Raman Spectroscopy Based Pathological Analysis and Discrimination of Formalin Fixed Paraffin Embedded Breast Cancer Tissue. Vib. Spectrosc. 2021, 115, 103260. [Google Scholar] [CrossRef]
- Li, X.; Ren, H.; Deng, Y.; Li, Y.; Hu, F. Integration of Raman Spectroscopy and Metabolomics for Early Breast Cancer Detection and Classification. Cancer Med. 2026, 15, e71861. [Google Scholar] [CrossRef] [PubMed]
- Peng, H.; Wang, Y.; Tang, X.; Shang, L.; Chen, F.; Liang, P.; Wang, Y.; Li, B. Adjustable Spot Wide-Field Raman Spectroscopy Combined with Machine Learning for Accurate Classification of Breast Cancer Cells. Talanta 2026, 298, 128862. [Google Scholar] [CrossRef] [PubMed]
- Ma, D.; Shang, L.; Tang, J.; Bao, Y.; Fu, J.; Yin, J. Classifying Breast Cancer Tissue by Raman Spectroscopy with One-Dimensional Convolutional Neural Network. Spectrochim. Acta. A. Mol. Biomol. Spectrosc. 2021, 256, 119732. [Google Scholar] [CrossRef] [PubMed]
- Ferraro, J.R.; Nakamoto, K.; Brown, C.W. Introductory Raman Spectroscopy.
- Zhao, J.; Lui, H.; McLean, D.I.; Zeng, H. Automated Autofluorescence Background Subtraction Algorithm for Biomedical Raman Spectroscopy. Appl. Spectrosc. 2007, 61, 1225–1232. [Google Scholar] [CrossRef] [PubMed]
- Zhang, Z.-M.; Chen, S.; Liang, Y.-Z. Baseline Correction Using Adaptive Iteratively Reweighted Penalized Least Squares. The Analyst 2010, 135, 1138. [Google Scholar] [CrossRef] [PubMed]
- Behzadi, H.; Manzetti, S.; Dargahi, M.; Roonasi, P.; Khalilnia, Z. Application of Calculated NMR Parameters, Aromaticity Indices and Wavefunction Properties for Evaluation of Corrosion Inhibition Efficiency of Pyrazine Inhibitors. J. Mol. Struct. 2018, 1151, 34–40. [Google Scholar] [CrossRef]
- Praveen, B.B.; Stevenson, D.J.; Antkowiak, M.; Dholakia, K.; Gunn-Moore, F.J. Enhancement and Optimization of Plasmid Expression in Femtosecond Optical Transfection. J. Biophotonics 2011, 4, 229–235. [Google Scholar] [CrossRef] [PubMed]
- Kneipp, J.; Schut, T.B.; Kliffen, M.; Menke-Pluijmers, M.; Puppels, G. Characterization of Breast Duct Epithelia: A Raman Spectroscopic Study. Vib. Spectrosc. 2003, 32, 67–74. [Google Scholar] [CrossRef]
- Ó Faoláin, E.; Hunter, M.B.; Byrne, J.M.; Kelehan, P.; McNamara, M.; Byrne, H.J.; Lyng, F.M. A Study Examining the Effects of Tissue Processing on Human Tissue Sections Using Vibrational Spectroscopy. Vib. Spectrosc. 2005, 38, 121–127. [Google Scholar] [CrossRef]
Figure 1.
Representative Raman spectra of the five investigated breast histopathological groups. (a) Raw spectra showing fluorescence-related background, noise, and spectral variability before preprocessing. (b) Corresponding spectra after Savitzky–Golay smoothing, airPLS baseline correction, and vector normalization, revealing characteristic biochemical Raman features.
Figure 1.
Representative Raman spectra of the five investigated breast histopathological groups. (a) Raw spectra showing fluorescence-related background, noise, and spectral variability before preprocessing. (b) Corresponding spectra after Savitzky–Golay smoothing, airPLS baseline correction, and vector normalization, revealing characteristic biochemical Raman features.
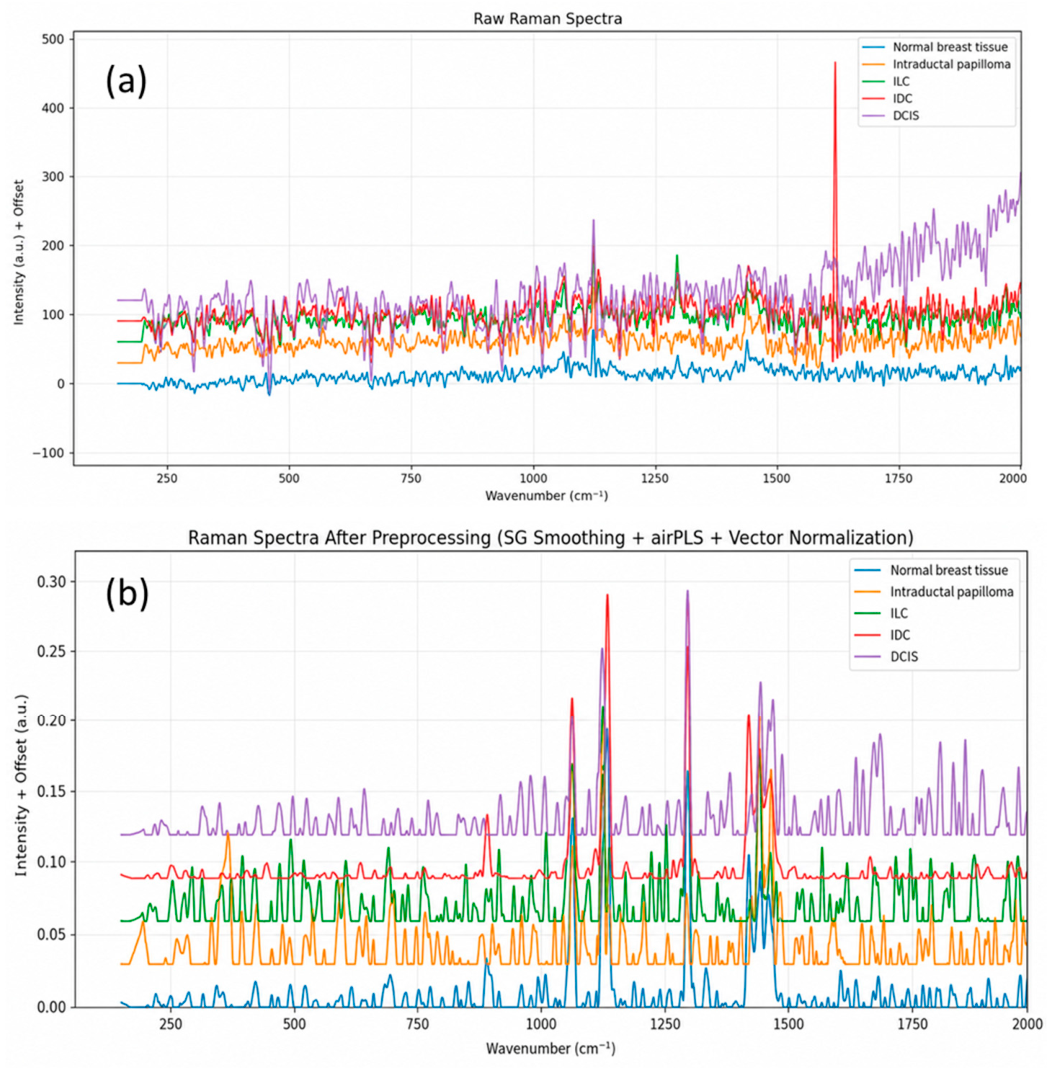
Figure 2.
Distribution of I1003/I1445 by Pathological Class. Each point represents an individual Raman spectrum.
Figure 2.
Distribution of I1003/I1445 by Pathological Class. Each point represents an individual Raman spectrum.
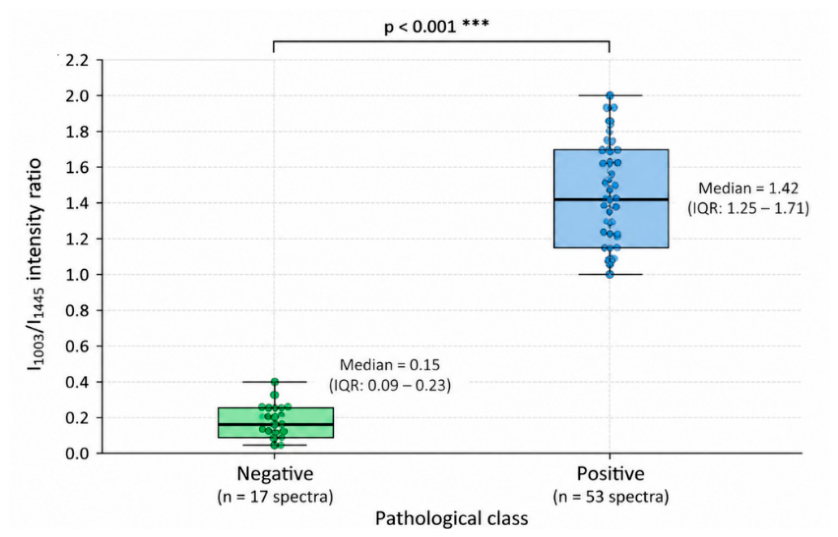
Figure 3.
PCA score plot of the training Raman dataset. PC1 and PC2 explain 42.33% and 17.49% of the total variance, respectively. Negative spectra (n = 17) are shown in black and Positive spectra (n = 53) in yellow. The plot demonstrates substantial separation between the two spectral classes, predominantly along PC1.
Figure 3.
PCA score plot of the training Raman dataset. PC1 and PC2 explain 42.33% and 17.49% of the total variance, respectively. Negative spectra (n = 17) are shown in black and Positive spectra (n = 53) in yellow. The plot demonstrates substantial separation between the two spectral classes, predominantly along PC1.
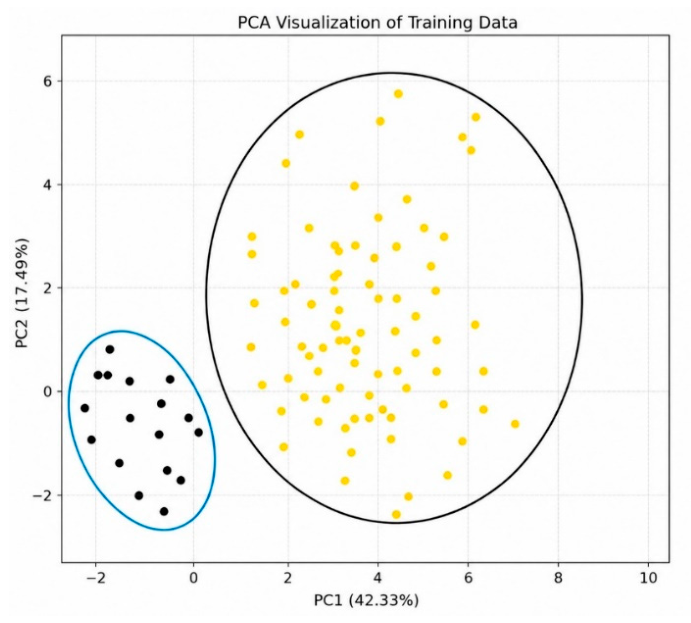
Figure 4.
Confusion matrix of the optimized SVM classifier evaluated on the held-out test set. Of the 30 test spectra, 27 were correctly classified, including 9/9 Negative and 18/21 Positive spectra. The resulting accuracy, sensitivity, and specificity were 90.0%, 85.71%, and 100%, respectively.
Figure 4.
Confusion matrix of the optimized SVM classifier evaluated on the held-out test set. Of the 30 test spectra, 27 were correctly classified, including 9/9 Negative and 18/21 Positive spectra. The resulting accuracy, sensitivity, and specificity were 90.0%, 85.71%, and 100%, respectively.
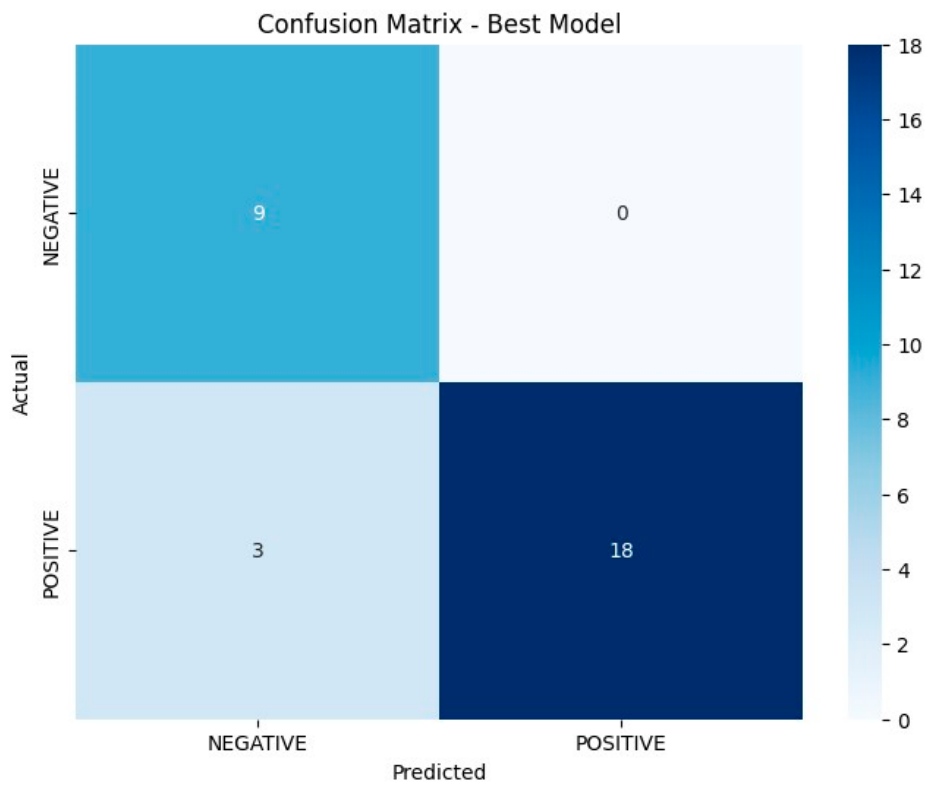
Table 2.
I1003/I1445 ratio across the investigated breast pathological groups.
| Pathological group | I1003/I1445 ratio | Disease stage |
| Normal breast tissue | ≤ 0.2 | Healthy |
| Intraductal papilloma | 0.2–0.5 | Benign |
| High-grade DCIS | 0.6–1.0 | Non-invasive malignant lesion |
| Invasive carcinoma | ≥ 1.5 | Invasive malignant lesion |
Table 3.
Training-set performance of the evaluated machine-learning classifiers.
| Model | Accuracy (%) | Precision (%) | Recall (%) | F1-score (%) |
| LDA | 89.2 | 89.0 | 89.2 | 89.1 |
| SVM (RBF) | 93.4 | 93.4 | 93.3 | 93.1 |
| Random Forest | 93.2 | 94.5 | 93.3 | 93.5 |
| Gradient Boosting | 93.0 | 94.5 | 93.3 | 93.4 |
| KNN (k = 5) | 87.7 | 87.9 | 87.7 | 87.7 |
Disclaimer/Publisher’s Note: The statements, opinions and data contained in all publications are solely those of the individual author(s) and contributor(s) and not of MDPI and/or the editor(s). MDPI and/or the editor(s) disclaim responsibility for any injury to people or property resulting from any ideas, methods, instructions or products referred to in the content. |
© 2026 by the authors. Licensee MDPI, Basel, Switzerland. This article is an open access article distributed under the terms and conditions of the Creative Commons Attribution (CC BY) license.
Copyright: This open access article is published under a Creative Commons CC BY 4.0 license, which permit the free download, distribution, and reuse, provided that the author and preprint are cited in any reuse.