
Submitted:
11 September 2026
Posted:
11 September 2026
You are already at the latest version
Abstract
We examine whether improvements in firm profitability are associated with a lower carbon-intensity response to revenue growth. Using 26,866 firm-year observations for Chinese listed companies from 2012 to 2022, we estimate firm and year fixed-effects models in which the carbon-intensity response is measured as the change in carbon intensity relative to the change in revenue. The baseline association between marginal profit and the carbon-intensity response is negative. Importantly, the result remains negative in a denominator-free specification that relates the change in carbon intensity directly to the change in net profit, indicating that the finding is not solely driven by the shared change-in-revenue denominator. The association is weaker above an estimated marginal-profit threshold and is attenuated among firms with higher market value. The results are consistent with an organizational-slack channel.
Keywords:
carbon intensity
; marginal carbon dynamics
; firm profitability
; slack resources
; green transition
1. Introduction
Firms are the core actors in energy consumption, production organization, and technology adoption, and constitute the principal micro-level contributors to carbon emissions. Controlling carbon intensity while expanding output is a question that firms need to address continuously in the green transition. Existing studies typically evaluate the environmental consequences of firms’ operating activities in terms of total carbon emissions, carbon intensity, and abatement performance. Compared with total emissions, which are highly sensitive to firm size, carbon intensity captures the emission burden per unit of output and is therefore better suited to tracking changes in emission efficiency during production expansion [1]. Changes in carbon intensity, however, are not determined solely by output scale; they may also depend on firms’ operating conditions, particularly profitability. Profit changes may provide resource support for low-carbon retrofits, but may equally reinforce expansion incentives and short-term profit orientation to some extent. The effect of profit changes on carbon performance may therefore involve both a resource effect and an expansion effect, manifesting not necessarily as a unidirectional shift in carbon intensity levels but rather as a change in the sensitivity of carbon intensity to revenue growth under different operating conditions.
We ask whether year-to-year profit improvements are associated with a lower response of carbon intensity to revenue growth. We define this response as ΔCI/ΔRevenue and refer to it as the carbon-intensity response. Existing studies have examined firm growth, profitability pressure, and carbon performance separately [2,3,4], but whether profit changes are associated with the marginal sensitivity of carbon intensity during revenue growth still lacks direct and systematic micro-level evidence. Bringing profit changes, revenue growth, and carbon intensity estimated from industry emissions and firm cost shares into a unified framework may help understand, at the micro level, how operating conditions and revenue expansion jointly relate to the process of green transformation.
Methodologically, we use a sample of Chinese listed firms over 2012–2022 (26,866 firm-year observations) and estimate a two-way fixed effects model of the carbon margin on marginal profit, measured respectively as the annual change in carbon intensity and the annual change in profit, each scaled by the annual change in output. Because the two margin indicators share the same denominator (the change in output), which may introduce mechanical correlation at the construction stage, we further estimate alternative constructions without the shared denominator—such as regressing the change in carbon intensity directly on the change in profit—as robustness checks, to examine whether the baseline results are sensitive to the indicator construction. In addition, we employ a panel threshold model to examine whether the effect of marginal profit is nonlinear, test the moderating role of firm market value in the profit–carbon intensity relationship, and analyze heterogeneity by ownership type, local green policy intensity, firm size, and region.
Our estimates indicate a negative baseline association that survives a denominator-free specification, is weaker above a marginal-profit threshold, and is attenuated among higher-value firms; the association also varies across ownership, green-policy intensity, firm size, and region.
This paper makes two contributions. First, we shift attention from the level of carbon intensity to its response to revenue growth. Second, we evaluate the shared-denominator concern directly by pairing the ratio-based model with a denominator-free specification. The policy implications of the heterogeneity findings are discussed in the Discussion.
2. Literature Review
Research on firm carbon performance has developed along three interconnected strands. The first strand concerns measurement. Carbon intensity, carbon dependence, carbon exposure, and carbon risk characterize firm carbon performance from different angles; absolute emission levels and emission-reduction magnitudes capture, respectively, the state and the intertemporal improvement of carbon performance, so static levels should be distinguished from dynamic changes [5]; emission scopes, accounting boundaries, and the choice of intensity denominators all affect the economic meaning of carbon performance indicators [6]. When firm-level direct emission data are unavailable, industry emissions can be allocated to firms according to their share of operating costs in total industry operating costs [7], the approach adopted here. Recent reviews further emphasize that consistent definitions and comparable indicator construction are essential for accurately assessing corporate carbon performance [8]. Evidence from voluntary carbon disclosure suggests that disclosed carbon information can reflect underlying carbon performance [9] and that disclosure and performance are best understood jointly rather than in isolation [10]. Third-party environmental information disclosure can also shape firms’ actual carbon emissions [11].
The second strand concerns the formation mechanisms of carbon performance. Corporate governance and carbon strategy constitute important internal foundations: environmentally oriented boards improve carbon performance both directly and, possibly, indirectly through carbon strategy, and management’s awareness of climate risk may strengthen these effects to some extent [12,13]. Emission-reduction initiatives, environmental innovation, and resource-use efficiency tend to reduce greenhouse gas emission intensity, and this effect may be more pronounced in high-polluting industries [14]. Financial resources provide the resources needed for environmental governance and abatement investment: improvements in short-term financial resources tend to enhance environmental performance, and relaxed financing constraints may reduce pollution emissions [15]. Recent evidence further suggests that firm growth can be accompanied by declining carbon intensity, and that environmental taxation and green innovation may strengthen the decoupling between firm growth and carbon emissions. Cash-rich firms exhibit lower carbon emissions, suggesting that internal financial slack facilitates abatement [16], and recent evidence documents a close link between firm profitability and carbon emissions [17], with ownership and governance structures further moderating this relationship [18]. Green finance can ease the financing constraints on green innovation [19], and place-based climate policies—such as China’s low-carbon city pilots and carbon emission trading schemes—improve carbon emission efficiency and influence firm-level outcomes [20,21]. Institutional investors also promote firms’ carbon information disclosure [22]. Digital transformation has further emerged as a driver of lower carbon intensity among Chinese manufacturers [23].
The third strand concerns the economic consequences of carbon performance. Better carbon performance is generally associated with stronger financial performance, and this association may be more pronounced when relative emission indicators are used [24]. Voluntary carbon disclosure is positively associated with financial performance, although the effect can be negative in the short run and positive in the long run [25,26]. Actual carbon performance is negatively associated with financial performance and market value, self-reported carbon performance shows no significant effect, and self-reported abatement actions may increase market value [27]. Good carbon performance also tends to lower total, systematic, and idiosyncratic risk, although these benefits may depend on national governance quality and the type of external crisis [28,29]. Firm carbon emissions also reduce organizational performance, while carbon disclosure can partly mitigate this adverse effect [30]. Investors price carbon risk, and firm-level exposure to climate-related transition risk is now routinely measured [31,32]. At the same time, ESG ratings remain contested as signals of corporate environmental performance because raters disagree substantially [33].
Taken together, existing research has established a measurement framework covering absolute emissions, relative intensity, dynamic abatement, and composite assessment; has explained carbon performance from the perspectives of governance, carbon strategy, environmental innovation, financing constraints, and profit pressure; and has examined the consequences of carbon performance and disclosure for financial performance, market value, and firm risk. Most of these studies, however, focus on the direct effect of firm growth on carbon intensity or treat financial performance as a consequence of carbon performance. Whether annual profit changes—the most direct and persistent change in firm operation—alter the sensitivity of carbon intensity to revenue changes remains largely underexamined. We address this gap: drawing on slack resources theory, we take the carbon margin as our research object and examine how profit levels are associated with the sensitivity of carbon intensity to revenue changes during firm expansion.
3. Theory and Hypothesis
Building on Shen and Huang [34], we develop the following specification to derive the theoretical relationship between firms’ marginal profit and the carbon margin. Y denotes nominal operating revenue, which serves as a monetary proxy for firm activity, and firms’ converted carbon emissions are defined in .
where denotes the total energy consumption of the industry to which the firm belongs, and denotes the total operating cost of that industry; C denotes the firm’s operating cost, and G denotes the firm’s effective carbon production and governance capacity—that is, the actual governance capacity formed through equipment renewal, energy conservation, and process optimization that yields net cost savings. Accordingly, we require . is the CO₂ conversion coefficient, and can be treated as a predetermined parameter given the industry and year; the superscript I denotes the industry level (According to the Xiamen Energy Conservation Center’s standard for calculating the carbon conversion coefficient, the carbon conversion coefficient of 1 ton of standard coal is 2.493. If the denominator is missing or equal to zero, this indicator is treated as missing).
The firm’s carbon intensity and its related margin are presented in (2) , where CI denotes carbon intensity and CP denotes the carbon margin—the response of carbon intensity to a change in revenue, d(E/Y)/dY, which is distinct from marginal emissions, dE/dY. NP denotes net profit; MP denotes marginal profit, and denotes the marginal effect of profit on carbon intensity. We assume that stronger effective low-carbon governance capacity reduces carbon intensity (). The empirical specification therefore focuses on the reduced-form relationship implied by this assumption. That is, holding the firm’s operating revenue as well as the industry’s energy consumption and operating cost constant, an improvement in effective low-carbon governance capacity reduces the firm’s operating cost and lowers the firm’s carbon intensity.
According to the slack resources theory, superior financial performance increases the resources that a firm can allocate at its own discretion after maintaining normal operations, thereby providing the financial conditions for equipment renewal, production-process adjustment, and low-carbon technology application. This theoretical relationship builds on organizational slack theory and is supported by studies on the relationship between financial performance and slack resources [35,36,37]. Let S denote the firm’s slack resources, and denote the share of incremental net profit available as slack, and let θ denote the efficiency with which slack is converted into low-carbon capacity. Both parameters may vary across firms and institutional settings. Equation defines this relationship within a small variation range dS. By setting , we obtain equation , where dY denotes the change in operating revenue.
When the profit allocation pattern remains relatively stable, higher marginal profit implies greater disposable resources per additional unit of operating revenue, as shown in Equation (5).
Let the conversion efficiency of slack resources into effective low-carbon governance capacity be . This efficiency indicates that, holding other firm conditions constant, an increase in slack resources enhances the firm’s effective low-carbon production and governance capacity. We further derive the effective low-carbon governance capacity formed as operating revenue changes, as shown in Equation (6).
This, in turn, yields the carbon margin, as shown in Equation (7).
To explore the marginal relationship between CP and MP, we differentiate (7) with respect to marginal profit, which yields Equation (8).
Under these assumptions, the model predicts MPCP < 0. Because incremental profit can also finance capacity expansion or distributions, the sign and magnitude remain empirical questions. Accordingly, we propose H1: improvements in marginal profitability are associated with a lower carbon margin.
The effect of firm profit improvement on the carbon margin may not be uniform across all firms [38]. This is because converting additional profits into carbon governance and production capacity depends on firms’ own governance foundations, resource allocation efficiency, and external constraint environments [39]. For firms with greater flexibility in resource allocation, stronger market pressure, or stronger green transition needs, profit improvement is more likely to alleviate the marginal pressure of carbon intensity arising from revenue growth. By contrast, for firms with stronger governance inertia, lower resource-allocation efficiency, or weaker external constraints, profit improvement may not be fully transformed into green governance investment [40]. Therefore, the dampening effect of profit on the carbon margin may be influenced by firm characteristics, operating conditions, and regional environments, and may thus exhibit heterogeneous patterns. Formally, let Z denote the grouping dimension—for example, ownership type, firm size, local policy intensity, or region—as shown in Equation (9).
We thus propose H2: the association between marginal profit and the carbon margin varies across firm characteristics, operating conditions, and regional environments.
Furthermore, the slack generated by marginal profit gains is unlikely to translate into carbon-intensity improvement at a constant rate. When marginal profit is relatively low, firms face stronger financing constraints, and additional profits are more likely to be allocated to urgent and quick-return projects such as energy-saving retrofits, energy-loss control, and production-process optimization. In this case, even a modest improvement in profit may generate a relatively pronounced emission-reduction effect. As marginal profit continues to increase, however, a plausible explanation is that readily available cost-saving projects are exhausted first. Subsequent governance actions often involve higher technological costs, longer payback periods, and more complex organizational adjustments. Meanwhile, additional profits may also be directed toward capacity expansion, debt repayment, and profit distribution. Accordingly, although higher marginal profit still helps reduce the carbon margin, its dampening effect is likely to diminish gradually. Based on this reasoning, we propose H3: the effect of firms’ marginal profit improvement on the carbon margin is nonlinear.
We use market capitalization as a proxy for firms’ access to external finance. If external finance substitutes for internally generated funds, the association between marginal profit and the carbon-intensity response should be weaker among higher-value firms, whose low-carbon investment is less tightly constrained by internal profits. By contrast, low-value firms with tighter external financing constraints rely more heavily on internal profits to fund abatement, so the negative association should be stronger. Accordingly, we propose H4: Market value is associated with a weaker negative relationship between marginal profit and the carbon margin.
4. Materials and Models
4.1. Data and Variable Construction
We use Chinese listed companies as our sample and construct a firm-level panel to examine whether changes in firm profitability affect the marginal sensitivity of carbon intensity during revenue growth. Firm financial data, corporate governance information, and market value data are obtained from the CSMAR database. Industry energy use and operating costs are taken from provincial statistical yearbooks. City green-policy intensity is compiled from local policy documents and matched to firms by registered city and year. The sample period covers 2012 to 2022.
Following the logic of the theoretical model, variables are constructed sequentially. After firm-year uniqueness identification, variable matching, and necessary data cleaning, a final sample of 26,866 firm-year observations is obtained, covering 3,855 firms. In the data processing procedure, we first construct a firm-level panel structure based on firm codes and years, and exclude observations with missing firm identifiers or years, as well as firms designated as Special Treatment (ST and ST*) by the Chinese stock exchanges. To avoid repeated observations affecting the estimation results, uniqueness tests are conducted at the firm-year level. We winsorize the raw continuous variables at the 1st and 99th percentiles and then standardize only Size, Revenue, and CorpC; CP, MP, CurA, Lindex, and VALUE remain in their stated units. Since some variables take non-positive values or exhibit large fluctuations, the inverse hyperbolic sine transformation is further used as a substitute for the core variables in robustness tests to examine whether the conclusions depend on the distributional form of the variables.

Table 1.
Variable Definitions.
| Function | Name | Measure | Source |
| Dependent variable | CP | Annual change in carbon intensity versus annual change in output value | Annual Report CSMAR Statistical Yearbook |
| Explanatory variable | DNP | Change in annual profit | Authors’ calculations |
| Explanatory variable | MP | Annual change in profit versus annual change in output value. | Annual Report CSMAR |
| Dependent variable | DCOI | Change in carbon intensity without the output denominator (i.e., ΔCI), used as the dependent variable in the denominator-free specification. | Authors’ calculations |
| Control variable | CurA | Entropy-weighted linear combination of current assets and current liabilities | Annual Report CSMAR |
| Control variable | Lindex | Lerner index of market power; higher values indicate greater pricing power | CSMAR |
| Control variable | Size | Firm size, transformed as ln(size+1); standardized | CSMAR |
| Control variable | CorpC | Entropy-weighted linear aggregation of asset-liability leverage, total leverage, and local green policy intensity; standardized | CSMAR City policy documents |
| Control variable | GPI | Local green-policy intensity index (×100) | City policy documents |
| Control variable | Revenue | Total operating revenue, transformed as ln(value+1); standardized | Annual Report |
| Moderating variable | VALUE | Firm capitalization | Annual Report CSMAR |
The dependent variable is firms’ carbon margin, which is used to capture the sensitivity of unit carbon intensity to additional output when firms continue to expand production. The core explanatory variable is firms’ marginal profit change, which measures the relationship between year-to-year changes in net profit and year-to-year changes in output, and reflects the incremental profit resources generated during firm revenue growth. According to our theoretical analysis, it represents the marginal profit space available for operational adjustment, green governance investment, and changes in carbon intensity during the process of new output creation.
Table 2.
Descriptive Statistics.
| N | Mean | SD | Min | Max | |
| CP | 26866 | 0.003 | 0.006 | -0.026 | 0.042 |
| MP | 26866 | 0.011 | 0.005 | -0.017 | 0.035 |
| CurA | 26866 | 0.598 | 0.156 | 0.189 | 0.887 |
| Lindex | 26866 | 0.008 | 0.007 | -0.018 | 0.027 |
| CorpC | 26866 | -0.005 | 0.986 | -2.017 | 2.068 |
| GPI | 26866 | 0.171 | 0.036 | 0.100 | 0.361 |
| Size | 26866 | 0.009 | 0.953 | -2.568 | 1.821 |
| Revenue | 26866 | 0.004 | 0.955 | -2.067 | 2.699 |
| VALUE | 26866 | -0.041 | 0.404 | -0.237 | 2.672 |
The control variables capture the following factors: firms’ resource base, operating scale, governance constraints, and regional environment. First, CurA captures firms’ short-term liquidity resource base. We apply the entropy method to linearly aggregate indicators related to current assets and current liabilities to construct an index of firms’ short-term resource allocation capacity. Greater liquidity resources imply stronger short-term operational buffering capacity, which may in turn affect firms’ green governance and carbon-related production behavior. Second, Lindex is the Lerner index of market power; it is included to absorb differences in firms’ pricing power and competitive conditions that may otherwise confound the carbon margin. Third, CorpC captures the overall constraint environment firms face. Based on asset-liability leverage, total leverage, and local green policy intensity, we construct this indicator using the entropy method to capture the combined effects of financial constraints and external green governance pressure. Fourth, Size denotes firm size and is used to control for the influence of size differences on carbon-related behavior and expansion capacity. Fifth, Revenue represents firms’ total operating revenue and is used to control for differences in business activity and the scale of operating revenue. These variables are jointly included in the baseline model to control for differences in firms’ operating foundations, financial constraints, size, and external environment. In addition, VALUE is used as a key variable in the moderating effect analysis to capture firms’ market valuation.
4.2. Empirical Strategy
To estimate the within-firm association between marginal profit and the carbon margin, we use the following baseline regression model :
where denotes the carbon margin of firm i in year t, and denotes the firm’s marginal profit, which serves as our core explanatory variable. denotes the set of control variables, including the firm’s liquidity resource base (CurA), operating or financial structure characteristics (Lindex), the overall constraint environment (CorpC), firm size (Size), and total operating revenue (Revenue). denotes the firm fixed effects, denotes the year fixed effects, and denotes the idiosyncratic error term. Standard errors are clustered at the firm level.
We extend the baseline specification in two directions. First, we estimate a threshold (regime-switching) model to examine whether the effect of MP on CP differs across the MP distribution. Second, we introduce firm market value (VALUE) and its interaction with MP, as shown in Equation (11):
5. Empirical Results
5.1. Baseline
Table 3 reports the baseline regression results on the impact of firms’ marginal profit changes on the carbon margin. Column (1) includes only the control variables, Column (2) further controls for firm fixed effects, and Column (3) additionally controls for both firm and year fixed effects. As shown, the coefficient of the core explanatory variable MP is significantly negative across all three model specifications, and remains significant at the 1% level. Specifically, in the model without fixed effects, the coefficient of MP is -0.247; after controlling for firm fixed effects, the coefficient is -0.236; and after further controlling for year fixed effects, it remains -0.236. This indicates that when firms generate greater incremental profit resources during revenue growth, the sensitivity of unit carbon intensity to additional output declines. This result is consistent with our theoretical expectation and accords with a slack-resource interpretation, whereby improved profitability expands firms’ capacity to finance low-carbon investments, thereby alleviating the pressure of carbon intensity associated with revenue growth.
Figure 1.
Binned residual plot.
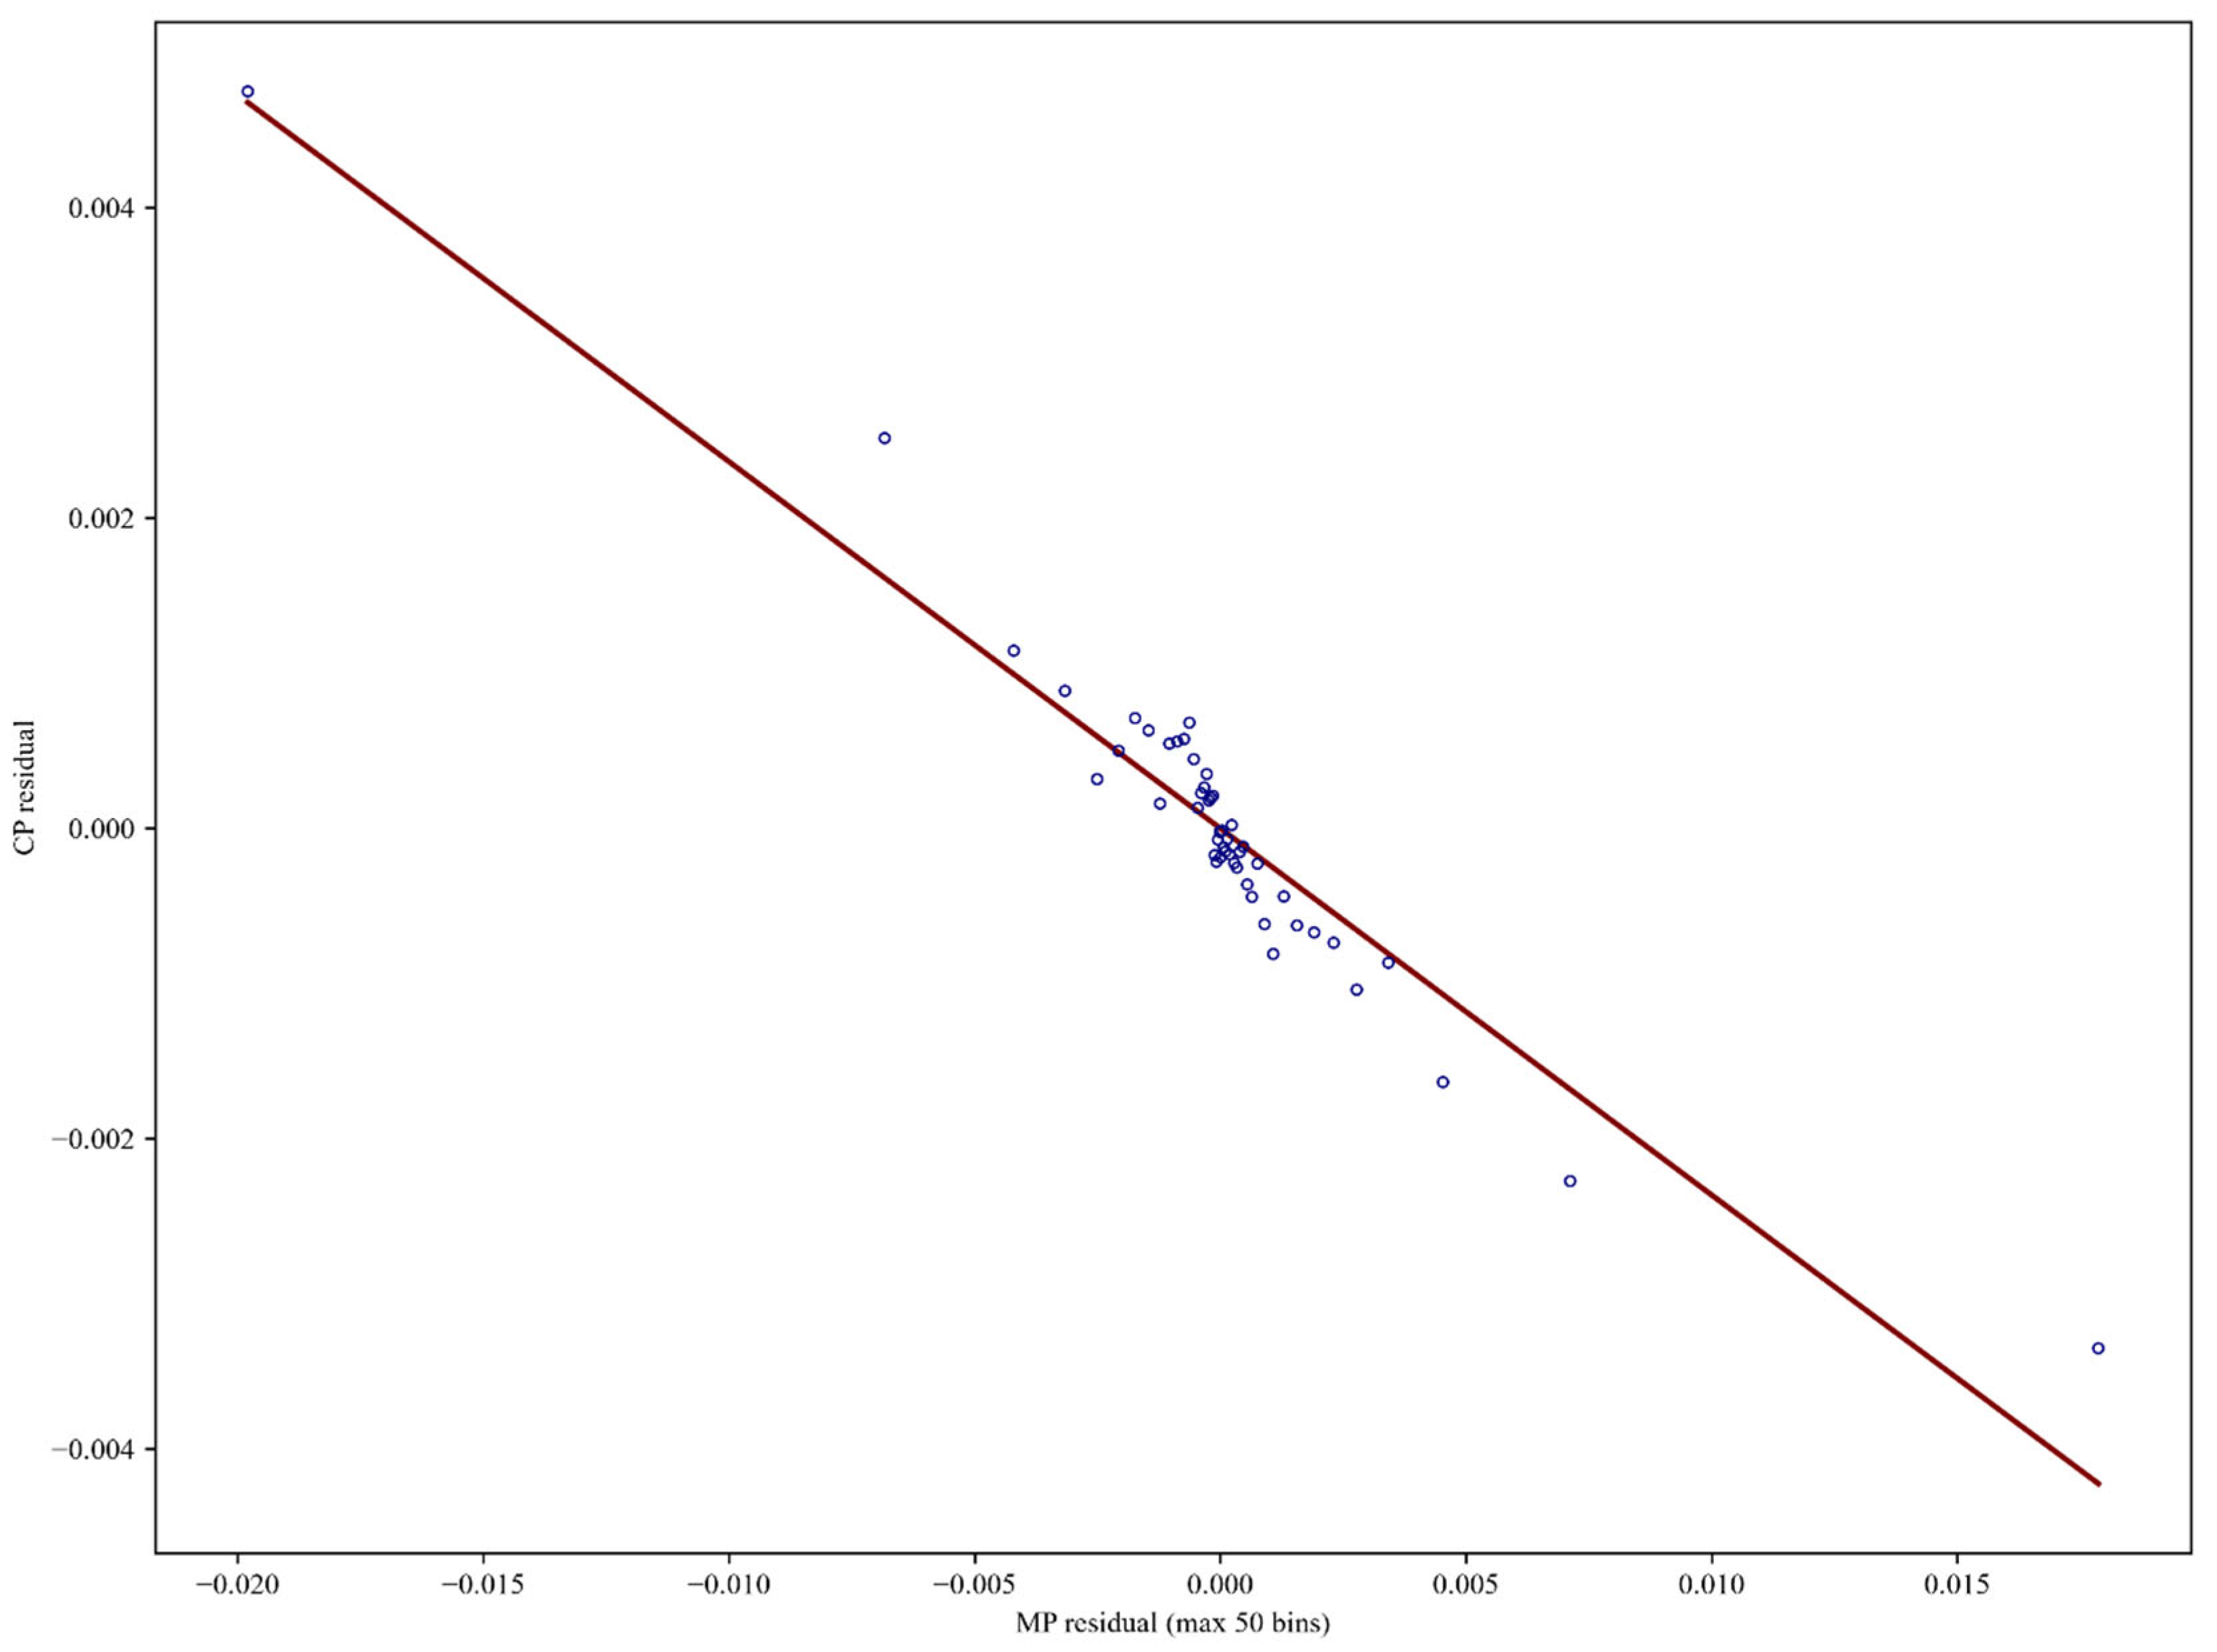
The baseline regression results support H1, namely that firm profit improvement is associated with a lower carbon margin. This finding suggests that the marginal change in firm carbon intensity is not determined solely by revenue growth itself, but is also shaped by firms’ profit resources and operating capacity.
Table 3.
Baseline Results.
| Type | Baseline | Denominator-free | ||
| Model | Controls | Firm FE | Two-way fixed | Two-way fixed |
| Variable | CP | CP | CP | DCOI |
| MP | -0.247*** | -0.236*** | -0.236*** | |
| (0.025) | (0.025) | (0.025) | ||
| DNP | -0.160*** | |||
| (0.020) | ||||
| Control | Y | Y | Y | Y |
| Firm FE | N | Y | Y | Y |
| Year FE | N | N | Y | Y |
| N | 26866 | 26557 | 26557 | 26557 |
| R2 | 0.039 | 0.169 | 0.181 | 0.259 |
Standard errors clustered at the firm level are reported in parentheses. * p < 0.10, ** p < 0.05, *** p < 0.01.
5.2. Robustness and Additional Specification Checks
To test whether the baseline conclusion depends on a specific sample period, variable treatment, or model specification, we further conduct robustness checks, as reported in . First, the sample is restricted to the period from 2017 onward to examine whether the main conclusion still holds in the more recent period, when green transition policies and carbon disclosure requirements had gradually strengthened. The results show that the coefficient of MP is -0.270 and remains significant at the 1% level, indicating that the attenuating effect of profit improvement on the carbon margin persists in the more recent sample.
Second, a first-difference model is employed to further mitigate the influence of omitted time-invariant firm-level factors. The results show that the coefficient of D.MP is -0.236 and remains significant at the 1% level. The negative association between changes in MP and changes in the carbon margin therefore remains statistically significant. This result is consistent with the direction of the baseline regression.
Third, a bootstrap method is used to re-estimate the standard errors in order to examine the robustness of the statistical inference. The results show that the coefficient of MP remains -0.236 and is still significant at the 1% level, indicating that the baseline result is not driven by the method used to estimate standard errors.
Fourth, the core explanatory variable MP is replaced with its inverse hyperbolic sine transformation. The results show that the coefficient of IHS(MP) is -0.001 and remains significant at the 1% level. Fifth, the dependent variable CP is also replaced with its inverse hyperbolic sine transformation, and the results show that the coefficient of MP is -32.472, still significant at the 1% level. These results indicate that the negative association of profit-margin improvement on the carbon margin remains stable, regardless of whether the core explanatory variable or the dependent variable is remeasured.
Overall, the robustness checks are consistent with the baseline regression results, suggesting that our conclusions do not depend on a specific sample period, variable transformation, or standard error estimation method.
Table 4.
Robustness Checks.
| Models | Post-2017 sample | Difference results | Bootstrap | Change MP | Change CP |
| Variable | CP | CP | CP | CP | IHS(CP) |
| MP | -0.270*** | -0.236*** | -32.472*** | ||
| (0.028) | (0.026) | (2.811) | |||
| D.MP | -0.236*** | ||||
| (0.027) | |||||
| IHS(MP) | -0.001*** | ||||
| (0.000) | |||||
| Control | Y | Y | Y | Y | Y |
| Firm FE | Y | Differenced out | Y | Y | Y |
| Year FE | Y | Y | Y | Y | Y |
| N | 17030 | 22969 | 26866 | 26557 | 26557 |
| R2 | 0.245 | 0.043 | 0.181 | 0.182 | 0.199 |
Standard errors clustered at the firm level are reported in parentheses.* p < 0.10, ** p < 0.05, *** p < 0.01.
We further examine the stability of the estimates using lagged terms, time trends, and city-level trends. First, we replace contemporaneous MP with its one-period lag. The results show that the coefficient of the one-period lag of MP is 0.031 and is significant at the 5% level.
Second, we replace year fixed effects with a linear time trend as an alternative treatment of common temporal variation. The results show that the coefficient of MP remains -0.236 and is significant at the 1% level. Third, city-level time trends are further controlled to alleviate omitted-variable concerns arising from changes in local institutional environments, industrial structures, and green policy conditions. The coefficient of MP remains -0.236 and is still significant at the 1% level.
The specifications with linear time trends and city-level trends yield coefficients of −0.236, both significant at the 1% level and consistent with the baseline relationship.
Table 5.
Additional Specification Checks.
| Models | One-period lag | Linear time trend | City trend |
| Variable | CP | CP | CP |
| L.MP | 0.031** | ||
| (0.015) | |||
| MP | -0.236*** | -0.236*** | |
| (0.025) | (0.025) | ||
| Control | Y | Y | Y |
| Firm FE | Y | Y | Y |
| Year FE | Y | N | Y |
| Time linear trend | N | Y | N |
| City trend | N | N | Y |
| N | 22580 | 26557 | 26557 |
| R2 | 0.156 | 0.171 | 0.198 |
Standard errors clustered at the firm level are reported in parentheses.* p < 0.10, ** p < 0.05, *** p < 0.01.
5.3. Heterogeneous Effects
The baseline regression indicates that profit improvement can generally reduce the carbon margin, but this effect may be influenced by firm characteristics, operating conditions, and the external environment. Accordingly, we conduct heterogeneity analyses from four perspectives: ownership type, local green policy intensity, firm size, and regional location. First, by ownership type, the effect of MP is significantly negative for both non-state-owned and state-owned firms. Specifically, in the non-state-owned firm subsample, the coefficient of MP is -0.244 and is significant at the 1% level. In the state-owned firm subsample, the coefficient of MP is -0.217 and is also significant at the 1% level. These results indicate that, regardless of ownership type, profit improvement helps reduce the carbon margin.
However, the absolute value of the coefficient is slightly larger for non-state-owned firms, suggesting that they may be more sensitive to changes in profit resources.
Table 6.
Heterogeneity by Ownership Type.
| Standard | Non-SOEs | SOEs |
| Variable | CP | CP |
| MP | -0.244*** | -0.217*** |
| (0.029) | (0.047) | |
| Control | Y | Y |
| Firm FE | Y | Y |
| Year FE | Y | Y |
| N | 18416 | 8141 |
| R2 | 0.192 | 0.155 |
Standard errors clustered at the firm level are reported in parentheses.* p < 0.10, ** p < 0.05, *** p < 0.01.
Second, according to the grouped results based on local green policy intensity, MP is significantly negative across all four quantile groups.
Specifically, in the samples with GPI at or below the 25th percentile, between the 25th and 50th percentiles, between the 50th and 75th percentiles, and above the 75th percentile, the coefficients of MP are -0.172, -0.172, -0.254, and -0.239, respectively, all significant at the 1% level. The point estimates vary across the GPI distribution and are more negative in the upper two quantiles.
Table 7.
Heterogeneity by Local Green Policy Intensity.
| GPI | ≤P25 | P25-P50 | P50-P75 | >P75 |
| CP | CP | CP | CP | |
| MP | -0.172*** | -0.172*** | -0.254*** | -0.239*** |
| (0.061) | (0.046) | (0.056) | (0.049) | |
| Control | Y | Y | Y | Y |
| Firm FE | Y | Y | Y | Y |
| Year FE | Y | Y | Y | Y |
| N | 5581 | 5955 | 5873 | 6103 |
| R2 | 0.226 | 0.371 | 0.306 | 0.270 |
Standard errors clustered at the firm level are reported in parentheses.* p < 0.10, ** p < 0.05, *** p < 0.01.
Third, the subsample results based on firm size show that the coefficient of MP is also significantly negative across all four size quantile groups. Specifically, the coefficients in the groups with Size at or below the 25th percentile, between the 25th and 50th percentiles, between the 50th and 75th percentiles, and above the 75th percentile are -0.232, -0.179, -0.268, and -0.265, respectively. These results indicate that the negative association exists across firms of different sizes, with larger absolute coefficients in the upper two size quantiles.
Table 8.
Heterogeneity by Firm Size.
| Size | ≤P25 | P25-P50 | P50-P75 | >P75 |
| CP | CP | CP | CP | |
| MP | -0.232*** | -0.179*** | -0.268*** | -0.265*** |
| (0.041) | (0.051) | (0.058) | (0.064) | |
| Control | Y | Y | Y | Y |
| Firm FE | Y | Y | Y | Y |
| Year FE | Y | Y | Y | Y |
| N | 6473 | 6435 | 6408 | 6505 |
| R2 | 0.214 | 0.256 | 0.239 | 0.225 |
Standard errors clustered at the firm level are reported in parentheses.* p < 0.10, ** p < 0.05, *** p < 0.01.
Finally, the coefficient of MP is negative in North, Southeast, Southwest, Northwest, and Northeast China.
Specifically, the coefficient is -0.313 in North China and is significant at the 1% level; -0.215 in Southeast China and is also significant at the 1% level; and -0.202, -0.250, and -0.256 in Southwest, Northwest, and Northeast China, respectively, all significant at the 5% level. The negative association is observed across all five regional subsamples, although its magnitude varies. The absolute value of the coefficient is largest in North China, which may be related to its industrial structure, stronger environmental constraints, and greater pressure for carbon governance. By contrast, although Southeast China has a relatively high level of economic development, its firms may already have more mature green governance systems, leaving less room for additional improvement induced by marginal profitability.
Table 9.
Heterogeneity by Region.
| Region | North | Southeast | Southwest | Northwest | Northeast |
| CP | CP | CP | CP | CP | |
| MP | -0.313*** | -0.215*** | -0.202** | -0.250** | -0.256** |
| (0.054) | (0.031) | (0.080) | (0.114) | (0.107) | |
| Control | Y | Y | Y | Y | Y |
| Firm FE | Y | Y | Y | Y | Y |
| Year FE | Y | Y | Y | Y | Y |
| N | 5145 | 16504 | 2261 | 1470 | 1163 |
| R2 | 0.214 | 0.193 | 0.155 | 0.134 | 0.165 |
Standard errors clustered at the firm level are reported in parentheses.* p < 0.10, ** p < 0.05, *** p < 0.01
Overall, the negative association is observed across ownership types, policy environments, firm sizes, and regional groups. The strength of the estimated association varies across these dimensions.
5.4. Nonlinear Test
We next examine whether the effect of profit improvement on the carbon margin exhibits nonlinear characteristics.
Table 10 reports the threshold regression results. The threshold effect tests in Table 11 strongly support a single threshold: the no-threshold null is rejected (F = 22.99, bootstrap p < 0.001), whereas the single-threshold null is not rejected against the double-threshold alternative (F = 1.94, bootstrap p = 0.922). The estimated threshold is 0.0148, with a 95% confidence interval of [0.0139, 0.0150]. The coefficient on MP is −0.268 (p < 0.01) below the threshold and −0.213 (p < 0.01) above it. The negative association is weaker in the high-profit regime than in the low-profit regime, a pattern of regime-specific attenuation.
Table 10.
Threshold Regression Results.
| CP | |
| MP_regime=0 # MP | -0.268*** |
| (0.038) | |
| MP_regime=1 # MP | -0.213*** |
| (0.029) | |
| Constant | 0.008*** |
| (0.001) | |
| Observations | 16,214 |
| Firms | 1,474 |
| Within R² | 0.057 |
| Threshold | 0.0148 |
| F-statistic | 22.99 |
| Bootstrap p-value | 0.0000 |
Standard errors clustered at the firm level are reported in parentheses. The threshold estimates are based on 16,214 observations from 1,474 firms.* p < 0.10, ** p < 0.05, *** p < 0.01.
The nonlinear test is consistent with H3: the association between marginal profit and the carbon margin differs across regimes, with a weaker negative association above the threshold.
Figure 2.
Threshold Plot.
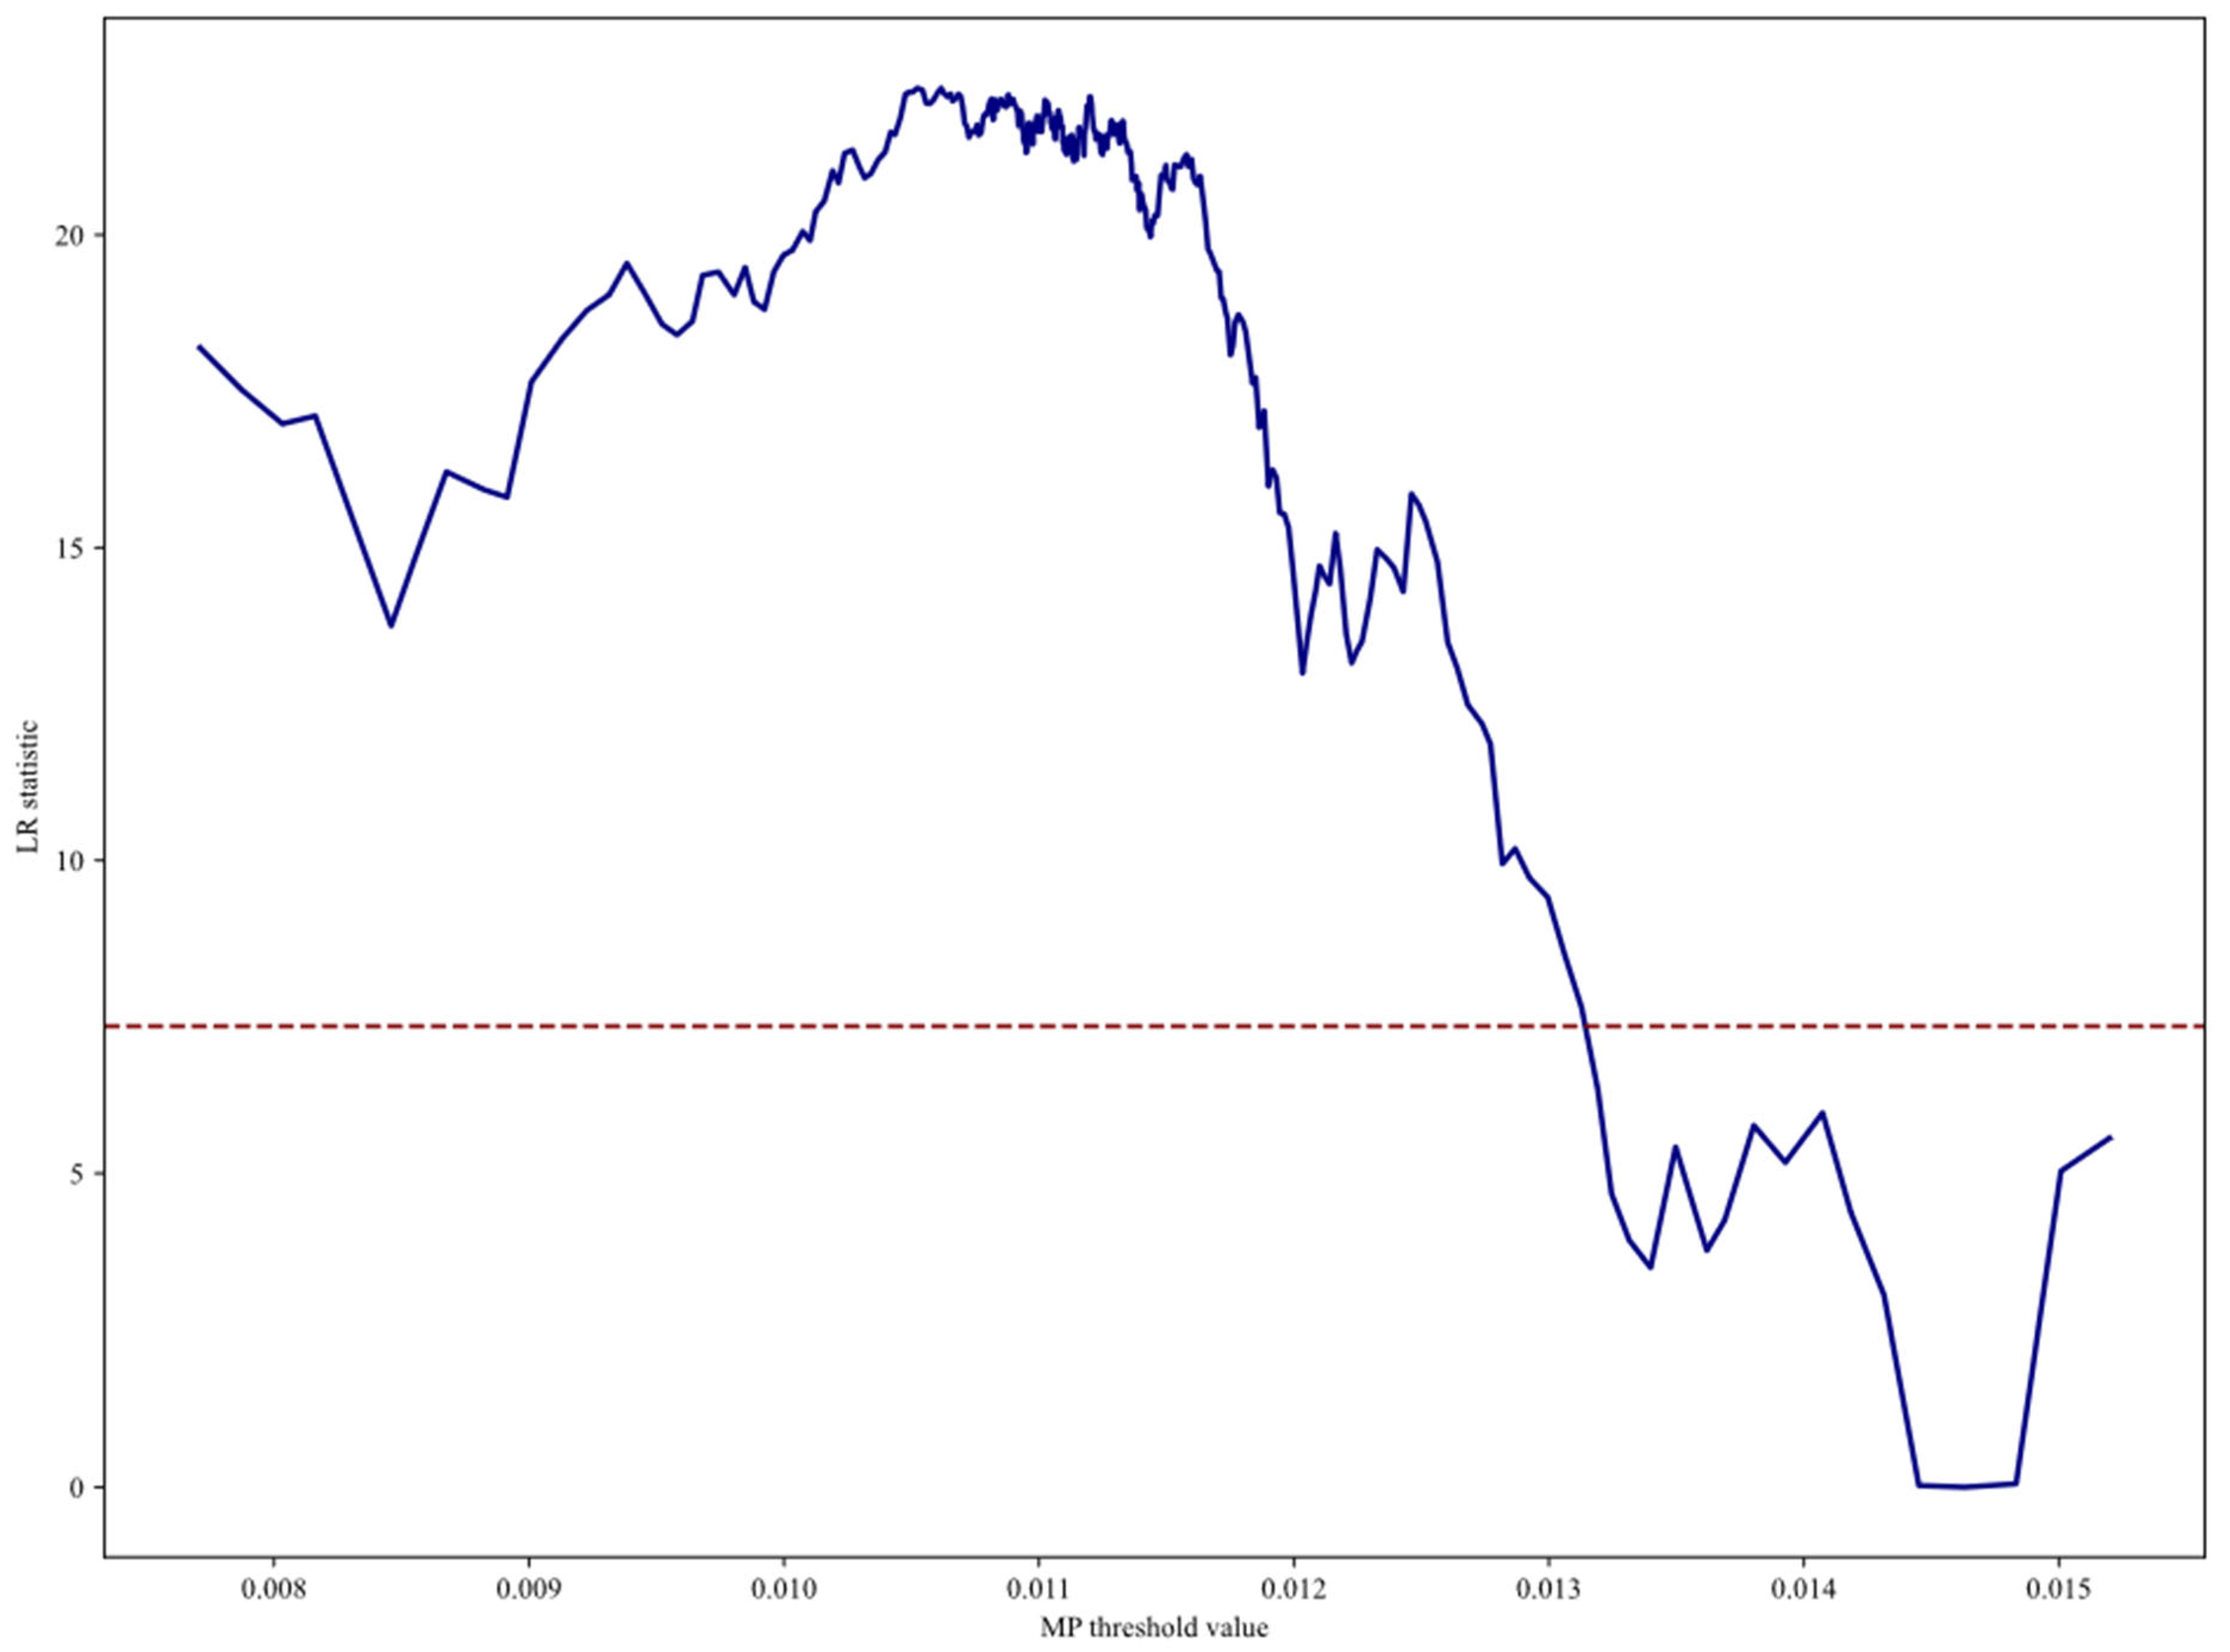
Table 11.
Threshold Effect Tests and Confidence Intervals.
| F-statistic | Bootstrap p-value | 10% critical value | 5% critical value | 1% critical value | |
| No threshold | 22.9872 | 0.0000 | 7.7933 | 10.3334 | 13.1034 |
| Single threshold | 1.9403 | 0.9220 | 9.1119 | 10.8521 | 14.8256 |
| Double threshold | 2.5366 | 0.8400 | 9.2929 | 11.2515 | 13.3447 |
| Threshold | RSS | Grid points | 95% lower bound | 95% upper bound | |
| Threshold | 0.0148 | 0.4835 | 397.0000 | 0.0139 | 0.0150 |
Standard errors clustered at the firm level are reported in parentheses. The threshold estimates are based on 16,214 observations from 1,474 firms.
5.5. Moderating Effect
To further examine whether firm market value affects the relationship between profit improvement and the carbon margin, we introduce VALUE and its interaction term with MP for the moderating effect test. The results show that the coefficient of MP is -0.231 and remains significant at the 1% level, indicating that the negative effect of profit-margin improvement on the carbon margin still holds after including the moderating variable. The coefficient of VALUE is 0.001 and is significant at the 1% level, suggesting that firm market value itself is significantly associated with the carbon margin.
The results indicate that firm market value moderates the effect of MP on CP. Since the main effect of MP is negative while the interaction term is positive, this means that as firm market value increases, the negative effect of MP on CP becomes weaker. In other words, among firms with lower market value, profit improvement has a stronger effect in reducing the carbon margin; whereas among firms with higher market value, this effect still exists but is relatively weaker.
Table 12.
Moderating Effect of Firm Market Value.
| Variable | CP |
| MP | -0.231*** |
| (0.024) | |
| VALUE | 0.001*** |
| (0.000) | |
| MP × VALUE | 0.081* |
| (0.047) | |
| Control | Y |
| Firm FE | Y |
| Year FE | Y |
| N | 26557 |
| R2 | 0.181 |
Standard errors clustered at the firm level are reported in parentheses.* p < 0.10, ** p < 0.05, *** p < 0.01.
This result can be understood from the perspectives of firms’ resource conditions and external evaluation pressure. Firms with lower market value may face stronger resource constraints and financing pressure, so additional profit is more likely to generate marginal improvement effects. By contrast, firms with higher market value typically already possess a stronger governance foundation, leaving less room for additional improvement induced by new profits. Therefore, the moderating effect of VALUE further shows that the process through which profit improvement affects the carbon margin is constrained by firms’ market conditions and does not operate with the same strength across all firms. The results support H4.
6. Conclusion and Discussion
6.1. Conclusion
This paper examines the relationship between firm profitability and the carbon margin. The results show that better profit performance is associated with a lower carbon-intensity response, consistent with a slack-resource channel.
This association varies with firms’ operating conditions and governance environments. The heterogeneity, threshold, and moderation results indicate that the strength of the profitability–carbon-margin relationship differs with firms’ resource conditions, policy environments, and market characteristics. For firms facing stronger resource constraints, the slack generated by profit improvement may be more pronounced; as basic low-carbon projects are gradually implemented, the incremental gains from additional profit may also slow down. Firm market value, which we use as a proxy for access to external finance, further influences this transformation process. At the same time, operating profits provide the resource foundation for firms to carry out low-carbon governance, but the extent to which profits can be converted into marginal improvements in carbon intensity depends on how firms allocate these resources. The relationship among profit, governance capacity, and carbon performance is therefore incremental and conditional. Focusing on this transformation process helps further explain how improved firm performance relates to the path of low-carbon development.
6.2. Discussion
Our contribution is to shift attention from the level of carbon intensity to its marginal response to revenue growth. Compared with total carbon emissions or the level of carbon intensity, the marginal change in carbon intensity places greater emphasis on how carbon intensity varies as firms’ operating revenue continues to grow. The results therefore suggest that the environmental significance of firms’ profitability may lie more in its capacity to transform resources: when additional revenue generates more profit, firms have greater room, beyond meeting routine operating needs, to finance low-carbon activities—a pattern that accords with the proposed slack-resource channel.
This explanation is broadly consistent with the core logic of slack resources theory, but whether the slack created by profits can be transformed into low-carbon governance outcomes still depends on firms’ internal allocation processes. Energy-saving retrofits usually require upfront investment, while their returns may only materialize over a relatively long period. More profitable firms are better able to bear such investments and are also more likely to sustain the continuity of low-carbon projects. However, firms may simultaneously face multiple funding demands, including production expansion, debt repayment, technological research and development, and profit distribution. Therefore, profit improvement provides the resource foundation for low-carbon governance, but its actual effect still depends on the direction in which firms allocate the additional resources and on the implementation efficiency of governance projects.
Differences across firms can also be understood from this transformation process. Ownership type, firm size, regional conditions, and local green policies not only affect the resources firms can access, but also shape the ways in which those resources are used. Firms facing stronger market constraints may place greater emphasis on cost control and production efficiency, while firms with more mature governance systems are more likely to channel additional resources into equipment upgrades and process improvements. The regulatory expectations, incentive mechanisms, and information requirements created by local green policies may also raise the priority of low-carbon projects in firms’ resource allocation decisions. Accordingly, the low-carbon effects of profit improvement are to some extent conditional, and the sources of heterogeneity lie more in resource transformation efficiency than simply in the amount of resources firms possess.
The weaker negative association above the profit threshold further suggests that this resource transformation involves a stage-wise process. When firms’ profit levels are relatively low, some energy-saving and consumption-reduction projects may be delayed due to insufficient funding. Additional profits can ease this constraint, allowing firms to prioritize basic projects with clear needs and substantial cost-saving potential. As these projects are gradually completed, subsequent governance efforts usually require more complex technological upgrades, longer investment cycles, and greater organizational coordination. The improvement brought about by additional profits therefore tends to level off. This change reflects the process by which low-carbon governance projects move from easier to more difficult tasks, and from basic retrofits to deeper adjustments, while also indicating that sustained improvement in carbon performance requires both technological accumulation and organizational capability.
Firm market value provides another perspective for understanding the process described above. Firms with higher market value usually enjoy better financing conditions, more mature governance systems, and greater market attention, so their basic resource constraints may already be partly alleviated. In this case, the additional impetus that profit improvement can provide for low-carbon governance is relatively limited. By contrast, firms with lower market value generally face more pronounced resource constraints, so the supportive role of profit improvement in equipment upgrades and process optimization may be more evident. Accordingly, the effect of market value can be understood as reflecting differences in firms’ existing governance foundations and resource constraints, rather than directly indicating the overall level of firms’ carbon performance.
The discussion above also has policy implications. Green support policies targeting firms can pay closer attention to the specific channels through which operating resources are transformed into low-carbon governance capacity. For firms facing stronger resource constraints, green credit, equipment-upgrade support, and low-carbon technology services can help reduce the startup costs of governance projects. For firms with relatively mature governance foundations, stable environmental standards and investor oversight may be more effective in sustaining continuous improvement. Policy design can also differentiate according to firms’ profit conditions, governance foundations, and project stages, so that financial support is better aligned with technological upgrading, process management, and performance evaluation.
Future research could integrate data on firms’ energy consumption, equipment upgrades, and green investment to examine how profit resources enter specific governance channels.
Author Contributions
Conceptualization, methodology, formal analysis, and writing were performed collaboratively by the authors.
Funding
This research was funded by the National Social Science Fund of China, grant number 20BMZ135.
Institutional Review Board Statement
Not applicable.
Informed Consent Statement
Not applicable.
Data Availability Statement
The data used in this study are available from the corresponding author upon reasonable request.
Conflicts of Interest
The authors declare no conflicts of interest.
References
- Hoffmann, V. H., & Busch, T. (2008). Corporate Carbon Performance Indicators: Carbon Intensity, Dependency, Exposure, and Risk. Journal of Industrial Ecology, 12(4), 505–520. [CrossRef]
- Kateb, I., Abdelqader, M., & Uyar, A. (2026). Growing firms and carbon intensity: Do environmental taxation policy and green technological innovation ecosystems matter? Energy Policy, 218, 115508. [CrossRef]
- Song, Y., Cai, L., & Zhang, M. (2024). Earnings pressure and corporate carbon emissions: Empirical evidence from listed firms in China. Resources, Conservation and Recycling, 206, 107657. [CrossRef]
- Xu, Q., & Kim, T. (2022). Financial Constraints and Corporate Environmental Policies. The Review of Financial Studies, 35(2), 576–635. [CrossRef]
- Lewandowski, S. (2017). Corporate Carbon and Financial Performance: The Role of Emission Reductions. Business Strategy and the Environment, 26(8), 1196–1211. [CrossRef]
- Stachelscheid, S., & Dutzi, A. (2025). Corporate carbon performance metrics in academia: Overcoming carbon accounting issues. Management Review Quarterly. Advance online publication. [CrossRef]
- Zhu, B., & Zhao, Y. (2022). Carbon risk and the cost of bank loans: Evidence from China. Technological Forecasting and Social Change, 180, 121741. [CrossRef]
- Bendig, D., Schulz, C., Erbar, F., & Heubeck, T. (2025). Apples to apples: Accurately assessing corporate carbon performance. Journal of Cleaner Production, 486, 144338. [CrossRef]
- Luo, L., & Tang, Q. (2014). Does voluntary carbon disclosure reflect underlying carbon performance? Journal of Contemporary Accounting & Economics, 10(3), 191–205. [CrossRef]
- Qian, W., & Schaltegger, S. (2017). Revisiting carbon disclosure and performance: Legitimacy and management views. The British Accounting Review, 49(4), 365–379. [CrossRef]
- Ren, S., Wu, Y., Zhao, L., & Du, L. (2024). Third-party environmental information disclosure and firms’ carbon emissions. Energy Economics, 131, 107350. [CrossRef]
- Luo, L., & Tang, Q. (2021). Corporate governance and carbon performance: Role of carbon strategy and awareness of climate risk. Accounting & Finance, 61(2), 2891–2934. [CrossRef]
- Moussa, T., Allam, A., Elbanna, S., & Bani-Mustafa, A. (2020). Can board environmental orientation improve U.S. firms’ carbon performance? The mediating role of carbon strategy. Business Strategy and the Environment, 29(1), 72–86. [CrossRef]
- Haque, F., & Ntim, C. G. (2022). Do corporate sustainability initiatives improve corporate carbon performance? Evidence from European firms. Business Strategy and the Environment, 31(7), 3318–3334. [CrossRef]
- Hang, M., Geyer-Klingeberg, J., & Rathgeber, A. W. (2019). It is merely a matter of time: A meta-analysis of the causality between environmental performance and financial performance. Business Strategy and the Environment, 28(2), 257–273. [CrossRef]
- Alam, M. S., Safiullah, M., & Islam, M. S. (2022). Cash-rich firms and carbon emissions. International Review of Financial Analysis, 81, 102106. [CrossRef]
- Oestreich, A. M., & Tsiakas, I. (2024). Carbon emissions and firm profitability. Journal of Sustainable Finance & Investment, 14(4), 766–786. [CrossRef]
- Borsuk, M., Eugster, N., Klein, P.-O., & Kowalewski, O. (2024). Family firms and carbon emissions. Journal of Corporate Finance, 89, 102672. [CrossRef]
- Yu, C.-H., Wu, X., Zhang, D., Chen, S., & Zhao, J. (2021). Demand for green finance: Resolving financing constraints on green innovation in China. Energy Policy, 153, 112255. [CrossRef]
- Yu, Y., & Zhang, N. (2021). Low-carbon city pilot and carbon emission efficiency: Quasi-experimental evidence from China. Energy Economics, 96, 105125. [CrossRef]
- Huang, N., He, R., Luo, L., & Shen, H. (2024). Carbon emission trading scheme and firm debt financing. Journal of Contemporary Accounting & Economics, 20(1), 100384. [CrossRef]
- Zuo, Y., Zeng, S., & Wu, S. (2025). The impact of institutional investors on firm carbon information disclosure: Evidence from Chinese industrial listed firms. Sustainability, 17, 10624. [CrossRef]
- Chen, Y., Liu, S., Xiao, Y., & Zhou, Q. (2024). Can digital transformation reduce enterprise carbon intensity? An empirical analysis of Chinese manufacturers. Sustainability, 16, 5236. [CrossRef]
- Busch, T., & Lewandowski, S. (2018). Corporate Carbon and Financial Performance: A Meta-analysis. Journal of Industrial Ecology, 22(4), 745–759. [CrossRef]
- Alsaifi, K., Elnahass, M., & Salama, A. (2020). Carbon disclosure and financial performance: UK environmental policy. Business Strategy and the Environment, 29(2), 711–726. [CrossRef]
- Siddique, M. A., Akhtaruzzaman, M., Rashid, A., & Hammami, H. (2021). Carbon disclosure, carbon performance and financial performance: International evidence. International Review of Financial Analysis, 75, 101734. [CrossRef]
- Adu, D. A., Flynn, A., & Grey, C. (2023). Carbon performance, financial performance and market value: The moderating effect of pay incentives. Business Strategy and the Environment, 32(4), 2111–2135. [CrossRef]
- Al-Fakir Al Rabab’a, E., Rashid, A., Shams, S., & Bose, S. (2024). Corporate carbon performance and firm risk: Evidence from Asia-Pacific countries. Journal of Contemporary Accounting & Economics, 20(2), 100427. [CrossRef]
- Läger, F., Bouzzine, Y. D., & Lueg, R. (2025). Carbon performance and corporate financial performance during crises: Evidence from the COVID-19 pandemic and the Global Financial Crisis. Journal of Industrial Ecology, 29(1), 246–263. [CrossRef]
- Liu, Y. S., Zhou, X., Yang, J. H., Hoepner, A. G. F., & Kakabadse, N. (2023). Carbon emissions, carbon disclosure and organizational performance. International Review of Financial Analysis, 90, 102846. [CrossRef]
- Bolton, P., & Kacperczyk, M. (2021). Do investors care about carbon risk? Journal of Financial Economics, 142(2), 517–549. [CrossRef]
- Sautner, Z., van Lent, L., Vilkov, G., & Zhang, R. (2023). Firm-level climate change exposure. The Journal of Finance, 78(3), 1449–1498. [CrossRef]
- Berg, F., Kölbel, J. F., & Rigobon, R. (2022). Aggregate confusion: The divergence of ESG ratings. Review of Finance, 26(6), 1315–1344. [CrossRef]
- Shen, H., & Huang, N. (2019). Will the Carbon Emission Trading Scheme Improve Firm Value?. Finance & Trade Economics, 40(1), 144–161. (In Chinese).
- Bourgeois, L. J., III. (1981). On the Measurement of Organizational Slack. Academy of Management Review, 6(1), 29–39. [CrossRef]
- Cyert, R. M., & March, J. G. (1963). A Behavioral Theory of the Firm. Prentice-Hall.
- Waddock, S. A., & Graves, S. B. (1997). The Corporate Social Performance-Financial Performance Link. Strategic Management Journal, 18(4), 303–319. [CrossRef]
- Martinsson, G., Sajtos, L., Strömberg, P., & Thomann, C. (2024). The Effect of Carbon Pricing on Firm Emissions: Evidence from the Swedish CO2 Tax. The Review of Financial Studies, 37(6), 1848–1886. [CrossRef]
- Ng, L., Wang, X., Yu, J., & Zaiats, N. (2025). Ethical Leadership in Climate Action: Navigating National Government Intervention, Financial Constraints, and Corporate Decarbonization. Journal of Business Ethics. Advance online publication. [CrossRef]
- Bartram, S. M., Hou, K., & Kim, S. (2022). Real effects of climate policy: Financial constraints and spillovers. Journal of Financial Economics, 143(2), 668–696. [CrossRef]
Disclaimer/Publisher’s Note: The statements, opinions and data contained in all publications are solely those of the individual author(s) and contributor(s) and not of MDPI and/or the editor(s). MDPI and/or the editor(s) disclaim responsibility for any injury to people or property resulting from any ideas, methods, instructions or products referred to in the content. |
© 2026 by the authors. Licensee MDPI, Basel, Switzerland. This article is an open access article distributed under the terms and conditions of the Creative Commons Attribution (CC BY) license (http://creativecommons.org/licenses/by/4.0/).
Copyright: This open access article is published under a Creative Commons CC BY 4.0 license, which permit the free download, distribution, and reuse, provided that the author and preprint are cited in any reuse.