

Submitted:
10 September 2026
Posted:
11 September 2026
You are already at the latest version
Abstract
The study aims to improve the procedures of state cadastral valuation of agricultural lands by incorporating spatial information on geo-ecological threats. Mudflow-prone plots of the Talgar District in the Almaty Region are examined as a test site. The methodological framework relies on a GIS-overlay that integrates land-use vector boundaries with the Ile-Alatau Mudflow Hazard Typization Map. The transformation of physical disaster characteristics into an economic indicator is carried out through the mathematical toolkit of value functions v(x). The final stage involves calculating the mudflow hazard discounting coefficient (Kc). An analysis of the current regulatory framework (Art. 11 of the Land Code of the RK) revealed a significant methodological gap: the dynamics of exogenous processes are entirely omitted from calculation algorithms. Testing the updated approach on data from nine land parcels demonstrates the necessity of revising base rates. The application of the Kc parameter results in a 49–80% drop in normative value for transit zones, while foothill risk lands receive a fixed price reduction of 30%. The proposed computational model helps mitigate overestimated cadastral values and land lease fees for agricultural enterprises, synchronizing land prices with their actual productivity. The resulting financial discount takes the form of indirect preventive insurance. Responsibility for potential damage is appropriately distributed between the budget and the tenant. Such a practice can protect the budget from unforeseen compensation costs after mudflow events, while simultaneously motivating farmers to invest in the construction of local mudflow protection barriers.
Keywords:
cadastral value
; mudflow hazard
; risk value function
; GIS overlay
; agricultural lands
; exogenous processes
; fiscal fairness
; Talgar District
1. Introduction
State regulation of land relations in Kazakhstan relies on cadastral valuation as a key fiscal and stimulating instrument. Fixing an asset's value in relation to its natural-economic potential motivates owners toward the rational use of the territory. The financial costs incurred during inappropriate exploitation or land idling accelerate its transfer to more effective owners. The valuation results themselves form the basis for spatial development and investment planning, taking ecological factors into account.
Current mass valuation algorithms inadequately reflect the specifics of the mountainous and foothill landscapes of the Almaty Region. Static financial indicators lose their objectivity in territories prone to systematic mudflow and landslide processes. The formation of an accurate cadastral value requires a transition to flexible spatial models using geographic information systems (GIS).
The purpose of the current study is to develop a methodology for recalculating the cadastral value of agricultural lands located in natural risk zones. The proposed approach is based on the integration of spatial GIS analysis.
The mountainous and foothill land massifs of the Talgar District in the Almaty Region were selected as the object of study. The territory is characterized by a pronounced contrast between the commercial demand for plots and the permanent threat of mudflow formation. Geo-ecological risks act as the primary constraint on the economic potential of the lands, necessitating the application of calculated discounting parameters during state cadastral valuation.
The procedure for fixing the price when transferring state land plots into private ownership or long-term lease relies on the cadastral value indicator. The final value is calculated based on approved rates, which are subject to inflationary indexation and subsequent adjustment through a system of regulatory indices, in accordance with the requirements of land legislation [1]. At the same time, it is legally established that the maximum change in the base rate through the application of correction coefficients cannot exceed double its size [1].
Foreign practice of mass land valuation relies on a comprehensive consideration of the socio-economic and natural characteristics of territories. An industry-wide problem remains the calculation error, which creates a noticeable gap between the normative and market value of assets. The position of O. Yu. Lepikhina and Yu. F. Ososkova directly links such price disparities with an increase in property conflicts and social tension. Overcoming these negative trends requires a qualitative modernization of existing calculation algorithms [2].
Eliminating calculation errors requires the application of verified economic algorithms. The base rate of payment for agricultural assets is historically formed based on the income approach. The functionality of this method is illustrated in the study by K. A. Zhichkin and co-authors when analyzing lands of the first type of permitted use in the territory of the Samara Region [3].
The formation of objective value relies on the synthesis of basic financial algorithms with the local and qualitative characteristics of a specific land tract. Previously published works by the authors describe a set of methodological solutions that allow making calculations for agricultural and garden lands more accurate [4,5,6]. Qualitative parameters of fertility, expressed through the soil bonitet score, serve as a necessary element of calculation models. Accurate recording of negative infrastructural externalities is achieved through automated IT complexes. The deployment of such computing systems based on a "thin client" architecture allows for extremely detailed processing of spatial data arrays [5]. The development of spatial analysis methods requires the application of specialized statistical algorithms proposed by the team of O. Kovalyshyn. Such a computational apparatus helps to calculate in detail the value of property rights and the overall return on the use of agricultural lands at the scale of a specific farm. An additional advantage is the technological compatibility of such approaches with the developing platforms of the 3D cadastre [7,8].
Classification and innovative taxation tools. The effectiveness of tax administration is closely related to the reliability of valuation procedures. U. Tulakov's concept focuses on the preliminary classification of real estate objects. Grouped data arrays are considered by the author as a necessary foundation for building accurate computational cadastre algorithms [9]. Synchronizing the fiscal base with real market conditions and ensuring the transparency of tax collections require a revision of existing mechanisms. The research group of M. P. Ramos proposes combining the analytical capacities of the Rural Real Estate Market Observatory (OMI-Rural) with spatial standardization technologies. Such an interdisciplinary synthesis relies on the active use of 3D cadastral modeling tools [10,11].
Automation and digitalization of cadastral systems.The transition of computational algorithms into a digital format and the application of modern information models define the future vector of development for cadastral systems. U. Tulakov's concept examines ways to adapt successful international experience to the institutional conditions of Uzbekistan. The software consolidation of disparate data arrays into a single automated environment becomes the foundation of the proposed methodology [12]. The design of 3D real estate valuation systems requires a stable architectural base. The research team of M. Buuveibaatar considers the international standard LADM (Land Administration Domain Model) as a key methodological framework, allowing for the correct alignment of multidimensional cadastre algorithms [13].
The structural complexity of modern real estate objects dictates the need for precise computational algorithms. The team of V. D. Kreshchensky formed a mathematical model that allows correctly dividing the total market value of a unified property complex into the price of the land plot and the share of constructed improvements. The relevance of such tools is confirmed in international reports registering systemic shifts in the global practice of cadastral registration [14,15,16].
Accounting for natural risks and externalities in cadastral information systems. The evolution of accounting and registration systems is accompanied by a transition to the mandatory analysis of ecological threats and external territorial constraints. The team of A. P. Gradinaru proposes directly integrating basic spatial registries with seismic zoning maps. The instrument for implementing this concept should be the deployment of integrated web platforms that accumulate disparate data within a unified information architecture [17].
Local geo-ecological factors introduce significant adjustments into the valuation procedure, supplementing the impact of direct natural threats. E. N. Bykova's concept focuses on integrating soil fertility indicators and the characteristics of adjacent territories into the computational algorithms of the cadastre. The financial analysis of negative infrastructural externalities is considered within this approach as a mandatory element of objective pricing [18].
The development of cadastral valuation methods is aimed at minimizing the gap between normative indicators and actual market conditions. Increasing the transparency of fiscal procedures is achieved through the deep integration of spatial characteristics: from assessing the agro-potential of soils to analyzing seismic and mudflow hazards in mountainous terrain.
The impact of natural risks on the cadastral value of agricultural lands. Natural risks act as a powerful factor correcting the investment potential of territories. The specifics of the Almaty Region dictate the need to account for destructive geodynamic processes when calculating asset value. Permanent mudflow activity and seismic instability create rigid barriers to land development, directly limiting the functional purpose and profitability of specific plots [19].
The impact of natural threats on the economic valuation of land assets manifests through four key mechanisms:
- −
- The formation of direct negative externalities, where natural factors directly reduce the base price of real estate [20].
- −
- The emergence of associated financial losses caused by the growth of insurance tariffs amid a high probability of disasters, which worsens the overall investment attractiveness of the plot [21].
- −
- The establishment of zones with special conditions for territory use (ZSCTU) in response to ecological threats, imposing strict legal frameworks and proportionally reducing the commercial value of lands [22].
- −
The complex orography of Kazakhstan acts as a catalyst for active geodynamic processes. Data from M. S. Khaidarov records over 900 potentially dangerous mudflow basins on the territory of the republic, where more than 800 large-scale descents of mud and stone masses have occurred since 1841. The collected historical statistics form a solid foundation for building prognostic models [25]. Territories located in the affected zone require the mandatory inclusion of mathematical discounting parameters into the algorithm for calculating state cadastral value [26].
Maintaining spatial information up-to-date is achieved through tight interaction between CAD systems and GIS platforms [27,28,29]. The projection of digital elevation models (DEM) onto the cadastral division grid allows visualizing the scale of potential damage and reasonably recalculating the state cadastral value for each specific plot [26].
The static algorithms of state valuation applied today create a noticeable gap between the calculated and market price of assets. Overcoming this imbalance requires deep digitalization of accounting procedures, a transition to a 3D cadastre format, and the involvement of a complex mathematical apparatus [14].
The specifics of mountainous and foothill landscapes make geodynamic processes the primary source of negative territorial externalities. Calculating the value of plots under such conditions dictates the need to introduce special discounting coefficients [20]. Ignoring the natural threat factor deprives the fiscal model of any economic relevance.
Combining registry databases with spatial GIS monitoring systems gives valuation procedures the necessary flexibility [30]. The formation of a unified digital environment serves as a key condition for the correct identification of zones with special conditions of use (ZSCTU) and the timely recalculation of tax rates [22].
The development of valuation methodologies is accompanied by a departure from rigid fiscal templates in favor of adaptive spatial models. The integration of geographic information systems and the accurate consideration of ecological externalities are recognized by the international expert community as mandatory conditions for the correct calculation of asset value. The regulatory framework does not yet contain clear algorithms governing the impact of mudflow threats on the cadastral price of agricultural lands. Published works confirm the demand for economic discounting tools for natural risks; however, a universal mathematical apparatus for the cadastral valuation of mountainous and foothill areas has not yet been formed. The identified methodological gap demonstrates the need to create a specialized model that converts the physical parameters of exogenous phenomena into fiscal indicators using spatial data overlay algorithms.
2. Methods
2.1. Object of the Study
The object of the study is the agricultural lands of the Talgar District in the Almaty Region, which are exposed to a high level of seismic threat. Geographically, the territory occupies the southern segment of the region, covering the foothill strip of the Zailiyskiy Alatau. The climatic regime is characterized by sharp continentality, accompanied by significant seasonal temperature drops. The soil cover structure is predominantly formed by dark-chestnut varieties, which transition into chernozems when moving south. The natural environment of the district demonstrates deep landscape differentiation, combining belts from high-mountain-glacial to plain-semidesert complexes [31].
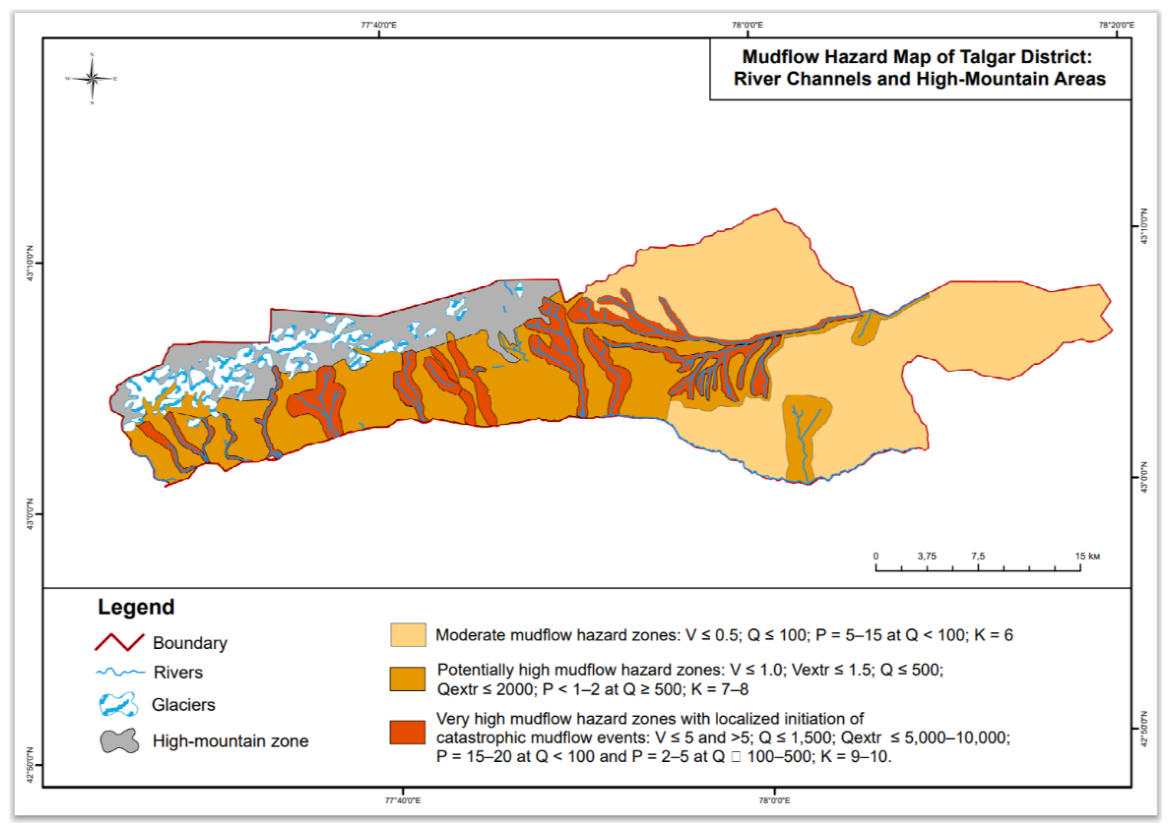
The baseline material for assessing the spatial distribution of natural threats was the Mudflow Hazard Typization Map prepared by the Institute of Geography. This source is characterized by in-depth scientific elaboration, ensuring the accurate assessment of mudflow activity within the boundaries of Almaty and adjacent territories (Figure 2) [25].
Subsequent data processing was performed in a specialized geoinformation environment using the overlay operation. The superimposition of thematic hazard layers onto the vector polygons of land plots in the Talgar District made it possible to precisely correlate the development zones of destructive processes with the boundaries of specific land uses (Figure 1).
Figure 1.
Map of land plots in the Talgar District.
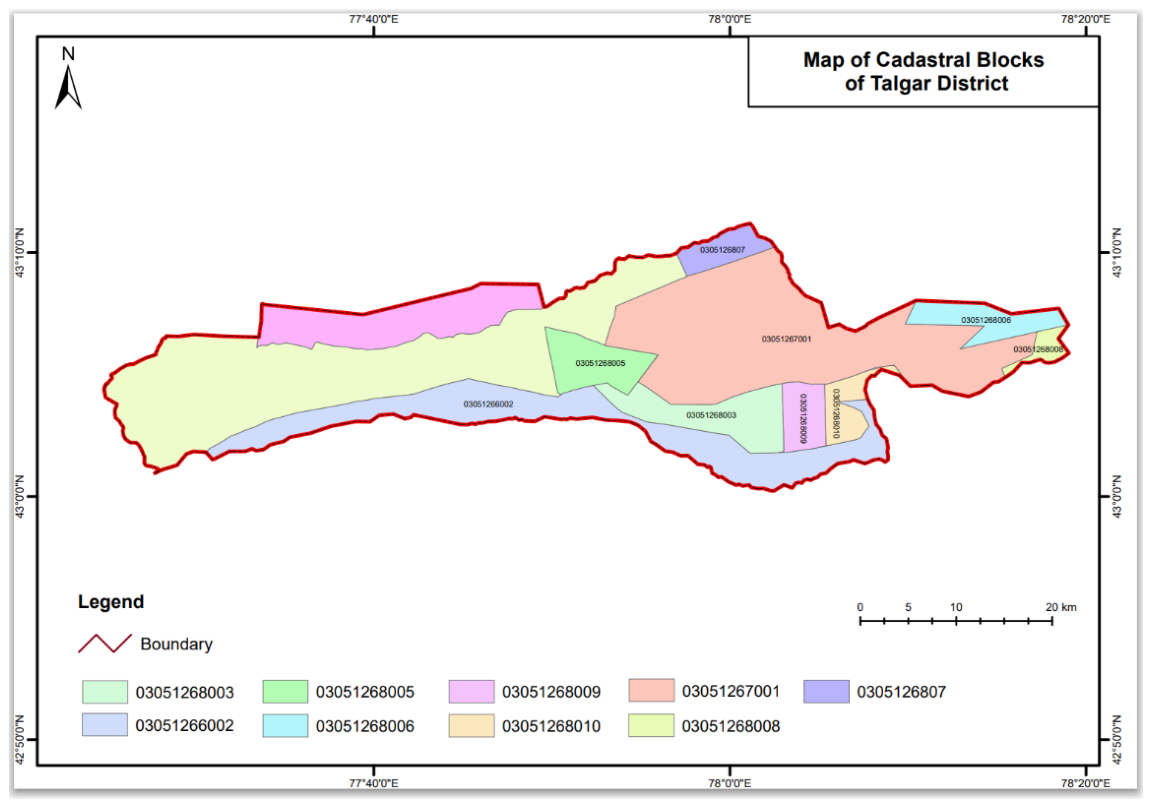
Figure 2.
Mudflow hazard map of the Talgar District by river channels and high-altitude areas.
Official regulations and cartographic databases, including materials on the Ile-Alatau, do not contain strictly established standards for crop loss or the degree of soil washout. The actual scale of destruction is formed under the influence of multiple variables: the type of cultivated crops, the relief slope, and the dynamic power of a specific flow (Table 1). An analysis of hydrological characteristics, expected volumes of solid runoff, and the specifics of exogenous processes allows for the modeling of calculated intervals of probable damage for each identified farming zone (Table 2).
2.2. Methodology for Determining the Mudflow Hazard Correction Coefficient (Kc) for Land Cadastral Value Based on Value Functions
The integration of spatial data regarding mudflow threats into the economic algorithms of the cadastre is carried out through the mathematical apparatus of value functions [32]. Representative market statistics are absent for the territories under consideration, which precludes the application of comparative sales analysis methods. Using the considered method allows for the conversion of physical risk indicators, identified through GIS overlay, into a normalized mathematical scale, creating a reliable basis for fiscal discounting [33].
The practical implementation of the concept is built around the function v(x). The dynamic parameters of mudflows (debris volumes, mass discharge, genetic type) possess incomparable dimensionality, precluding their direct integration into value calculation formulas. The v(x) tool transforms heterogeneous mudflow hazard zones into a universal dimensionless range from 0.0 to 1.0. The lower threshold (v(x) = 0.0) establishes the absolute safety of the land tract, while the upper limit (v(x) = 1.0) indicates a catastrophic level of risk, completely precluding capital construction and agricultural development. The final coefficient is formed based on the results of a spatial GIS overlay of cadastral boundaries with the Ile-Alatau typization maps, calculated as the weighted share of the plot within vulnerable polygons.
where: Szone1 — plot area in Zone 1 (very high/critical degree of mudflow hazard, vzone1 = 1.0); Szone2 — plot area in Zone 2 / IIa (potentially high degree and activation, sporadic debris flows, vzone2 = 0.7); Szone3 — plot area in Zone 3 (medium degree of mudflow hazard, vzone3 = 0.3); Stotal — total area of the evaluated object.
The calculation principle is as follows. A plot that falls entirely within the critical mudflow risk zone (Zone 1) receives a value of v(x) = 1.0. If a plot only partially intersects a medium-risk zone, and the rest of it is located in a safe territory, then v(x) takes an intermediate value — for example, 0.3. The obtained value of the mudflow risk value function v(x) serves as the basis for calculating the final mudflow hazard discounting coefficient (Kc), which is then applied to adjust the cadastral value.
Coefficient range: 0 < Kc ≤1.0. Economic interpretation:
- −
- For absolutely safe plots (v(x) = 0.0), the coefficient is Kc = 1.0 (no discounting is applied).
- −
- For plots in the maximum risk zone (v(x) = 1.0), the coefficient tends toward the minimum value (or zero), reflecting a critical drop in the land's value and its unsuitability for traditional economic turnover without costly protective structures.
The obtained coefficient Kc is integrated into the basic formula for calculating the state cadastral value of land plots:
where:
Ccad — optimized cadastral value of the land parcel;
BS — base rate of payment for the land parcel;
Ki — standard integrated correction coefficient (in accordance with Article 11 of the Land Code of the RK, accounting for location and infrastructure);
S — area of the land parcel;
Kc — the authors' mudflow hazard coefficient, obtained through the value function v(x).
3. Results
3.1. Spatial Analysis of Mudflow Hazard Distribution on Agricultural Lands
Practical verification of the proposed methodological solutions was carried out using vector databases of land parcels in the Talgar District. The projection of the agrarian land grid onto the Ile-Alatau Mudflow Hazard Typization Map allowed for the clear segmentation of the territory according to the level of geodynamic threat.
The agricultural land massifs of the district densely intersect with the development areas of destructive exogenous phenomena. Historically valuable arable lands are fragmentarily localized within the boundaries of the second (potentially high threat) and third (medium hazard) zones. The calculated washout of the fertile layer for these territories reaches 30–80%. The passage of mud and stone masses or large-scale floods can lead to a crop loss of 40% to 100% (according to Table 2).
Current cadastral accounting standards have completely ignored such limiting factors. Vulnerable plots were evaluated at the maximum base rate (BS), without the application of any discounting adjustments.
The processing of spatial data for nine land parcels reveals their large-scale vulnerability to exogenous factors and strong internal heterogeneity. The degree of concentration of geo-ecological threats allows dividing the studied massifs into three typological categories (Figure 3).
The absolute risk category covers plots No. 1 (03051266002) and No. 4 (03051268003). A safe background for agriculture is entirely absent here. The area of these lands is completely consumed by channels with a catastrophic threat of mudflows (Zone I) and adjacent active erosional buffers (Zone II).
Transit massifs of a mixed type form the second group, which includes plots No. 2, 3, and 5. The specificity of these objects lies in the combination of all three hazard levels. Agrarian development is concentrated primarily within Zone III; however, the intersection of the territories by dangerous channels (the share of Zone I varies from 1.8% to 19.1%) generates extensive adjacent strips of potential damage.
The most stable assets for agricultural production are the base (background) risk lands, forming the third group. Plots No. 6, 7, 8, and 9 are clustered on the eastern and southeastern periphery of the studied district. A characteristic feature of these allotments is complete spatial homogeneity — they lie entirely within the boundaries of a moderate mudflow threat (Zone III) (Appendix Table 4).
The calculation of the risk value function v(x) and the integrated discounting coefficient Kc was performed using formulas (1) and (2), relying on the hydrology and agroecology parameters from Table 1 and Table 2.
The integration of spatial fragments into a single financial indicator is implemented through a weighted average assessment of the vulnerability of a specific allotment, taking into account the weight and area of each zone (Formula 1). The calculation algorithm is clearly demonstrated using the example of land plot No. 03051268005, and the final values for all nine objects are summarized in Appendix Table 5.
The territory of plot No. 03051268005 possesses a fragmented vulnerability structure and breaks down into three autonomous sectors. The first zone covers 477.58 ha of transit mudflow-hazardous channels. This massif experiences the direct destructive impact of powerful flows, leading to the destruction of the arable horizon down to the bedrock (90–100%) and the complete loss of crops. The economic use of this territory is impractical; therefore, the lands are removed from crop rotation at the maximum risk marker v1 = 1.0.
Zone 2 occupies an area of 720.66 ha and acts as an erosional buffer. Agrarian activity here is accompanied by the development of deep washouts and a probability of losing 70–100% of the crop during strong floods. The restoration of soil productivity involves capital-intensive melioration measures, which determines the risk level v2 = 0.7.
Zone 3 covers 1301.76 ha and represents the base agrarian background. This sector is distinguished by the greatest stability, although it retains threats typical for foothills in the form of sheet erosion and local flooding capable of destroying 40–60% of the crop. The vulnerability coefficient for this section is assumed to be v3 = 0.3.
The unification of disparate spatial fragments is achieved by calculating the function v(x), which reflects the final share of potential damage to the entire land massif (Formula 1). The calculations are performed based on actual metrics extracted during the GIS analysis.
The obtained value v(x) = 0.55 reflects the loss of 55% of the land massif's agricultural production potential due to the complex pressure of geo-ecological factors. The calculation of the discounting parameter Kc is based on the principle of the residual value of the asset. The proposed mudflow threat coefficient acts as a structural element of the updated methodology for cadastral valuation (Formula 2).
3.2. Economic Rationale for Adjusting Cadastral Value and Protecting the Interests of the Land User
The investment potential of the massif with an area of over 1,300 ha is strictly limited by the routing of active channels (zone I) and adjacent erosional buffers (zone II). Spatial threat analysis indicates the inevitable loss of the entire crop within 20% of the plot's area due to intensive erosional processes. The adjacent 28.8% of the territory is exposed to a high risk of destruction of 70% to 100% of cultivated crops.
Charging rental payments for the entire land use contour without adjusting for geo-ecological restrictions creates an excessive financial burden on the agrarian sector. The integration of the discounting parameter Kc = 0.45 into the cadastral value calculation restores fiscal balance, proportionally reducing the final rental rate by 55%. This approach directly protects the economic interests of farmers, compensating for the limited suitability of the land and regular expenses for liquidating the consequences of natural disasters.
The integration of the proposed coefficient Kc into the normative algorithms for calculating the state cadastral value significantly enhances the economic validity of land asset valuation. Appendix Table 5 clearly demonstrates a comparison of financial indicators calculated using the classical methodology and with the application of the authors' discounting mechanism.
The calculated indicators (Appendix Table 6) reflect the ability of the Kc coefficient to align the cadastral value with the actual level of geo-ecological threats. The results of the financial revaluation of land assets generate three key economic effects. First, a fair valuation of plots with a critical level of risk. The application of Kc for plots No. 1 and No. 4 resulted in a 72–80% decrease in the final value. The classical algorithm of the Land Code of the Republic of Kazakhstan did not account for exogenous processes, generating an excess in land value and rental fees. The use of the discounting parameter reduced the financial valuation to 11.2 million and 5.7 million tenge, synchronizing the fiscal base with the actual production potential of the territories.
The situation with land plot No. 3 illustrates a significant flaw in the baseline methodology, which tends to overestimate the value of prime agricultural lands. Integrating the adjustment for 47.9% of the area that regularly suffers from erosion and mudflows (Kc = 0.45) reduced the calculated value by 55%, fixing it at 208.4 million tenge. Lands of moderate hazard (Zone III) received a thirty percent reduction in the normative price. The established discount assumes the role of a financial stabilizer. The released funds can compensate farmers for annual expenses on anti-erosion measures and the maintenance of soil fertility.
Implementing a mudflow risk assessment system can be an effective mechanism for managing macroeconomic stability. Discounting the value of vulnerable agricultural lands acts as a form of indirect preliminary insurance.
Providing the agrarian sector with financial preferences at the stage of cadastral registration legally establishes the fact of a constant natural threat. The occurrence of destructive floods under such conditions provides the state with legitimate grounds for reducing or completely canceling compensation payments from reserve funds. The projected losses of farmers from crop destruction are covered in advance through reduced rental and valuation rates. Such an algorithm redistributes financial responsibility between the budget and the tenant, protecting the state budget from sudden cash flow gaps during the period of natural disaster relief. The integration of the mudflow threat parameter can transform the very essence of state valuation. The fiscal template acts as an adaptive mechanism capable of maintaining a healthy balance between the interests of the state and the economic viability of agricultural enterprises.
4. Discussion
The results of the study indicate an acute need to modernize the mechanisms for evaluating agricultural lands within geodynamically active zones. The current normative base, including Article 11 of the Land Code of the Republic of Kazakhstan, relies exclusively on static parameters: the quality of the humus horizon, topography, water supply, and proximity to infrastructure hubs. Sudden destructive processes remain outside the legal framework. The descent of mudflow masses can, in a short period, eliminate both the crops and the soil base itself (see Table 2).
4.1. Discrepancy Between the Traditional Valuation Model and Economic Realities
A comparison of financial indicators (Appendix Table 5) demonstrates a massive gap between the classical (Cstandard) and modified (Ccad) cadastral value. The current methodology creates a significant economic paradox. Territories under constant threat from natural elements (plots No. 1 and No. 4 with a share of mudflow-hazardous channels up to 34.7%) are valued on par with stable plain massifs. The artificial inflation of the rental and value base here reaches 72–80%. Such a practice withdraws working capital from agricultural enterprises, contradicting the basic principle of the fiscal system — the proportionality of payments to the actual profitability of the asset.
The high quality of the soil cover does not compensate for spatial threats. The situation with land plot No. 3 (prime irrigated arable land) illustrates the invalidity of a base value of 463 million tenge. The occurrence of erosion processes and the development of the channel network on 47.9% of the area block the possibility of stable extraction of the planned profit. The integration of the discounting parameter (Kc = 0.45) lowers the calculated price to an objective 208.4 million tenge. The obtained sum correctly reflects the true investment potential of the territory through the prism of its geo-ecological vulnerability.
4.2. Advantages of Geoinformational Risk Modeling
The mathematical formalization of natural threats forms a fundamentally new mechanism for cadastral registration. Integrating GIS analysis with the risk value function v(x) allows for the elimination of expert subjectivity in calculation procedures. The weighted model details the spatial heterogeneity of large agricultural massifs. Abandoning the binary division of territories into dangerous and safe in favor of calculating the areal shares of each category (Zones I, II, III) guarantees the individualization of the final value of a specific object.
Territories of background risk (plots No. 6, 7, 8, 9), lying entirely within the boundaries of Zone III, require special consideration. The introduction of a thirty percent discount for such allotments acts as an economic buffer. The released funds cover the regular expenses of farmers for mitigating the consequences of sheet erosion and seasonal flooding, which are characteristic of foothill relief.
4.3. Prospects for Practical Integration
The inclusion of the discounting coefficient Kc in the system of the state land cadastre of Kazakhstan opens paths for optimizing territorial management. The proposed algorithm solves several applied tasks simultaneously:
- −
- Stimulation of rational land use: Reducing the fiscal burden allows agricultural enterprises to redirect capital toward the construction of mudflow protection barriers, slope terracing, and soil melioration.
- −
- Legal protection of agro-industrial complex subjects: A transparent computational model of potential damage creates a reliable legal basis for resolving disputes during the seizure of plots, calculating fair rental rates, and registering crop insurance policies.
- −
- Spatial development management: A differentiated normative price acts as an economic barrier, limiting the involvement of critical risk territories (Zone I) in intensive turnover, thereby supporting the food and physical security of the region.
4.4. Methodological Limitations and Paths for Development
The calculation base of the coefficient Kc relies on hydrological metrics characteristic primarily of the Ile-Alatau basin. Subsequent scaling of the developed methodology to other mountain systems will require structural calibration. It is advisable to focus future research on integrating local exogenous processes (landslide activity, avalanches, wind erosion) and introducing additional variables that capture the degree of sensitivity of various agricultural crops to siltation and the loss of the humus layer.
5. Conclusion
The combination of geoinformational tools with mathematical modeling methods offers a solution to the problem of overestimating agricultural lands subject to natural instability. A comprehensive analysis of the obtained data has made it possible to formulate several key provisions.
The normative algorithm for calculating the cadastral value, enshrined in Article 11 of the Land Code of the Republic of Kazakhstan, is based solely on static indicators. The factor of mudflow hazard remains outside the scope of accounting procedures. Spatial analysis of the Talgar District lands revealed a serious systemic flaw: allotments with the maximum risk of complete crop loss and degradation of the humus layer (Zones I and II) are evaluated by the state similarly to stable plain plots.
The transformation of qualitative spatial information into precise financial metrics is implemented through the developed mathematical discounting mechanism. The integration of the authors' mudflow hazard coefficient (Kc) into the normative calculation formula relies on the weighted average risk value function v(x). The computational model demonstrates applicability in relation to the affected area. The financial reduction for mixed transit territories ranges from 49% to 80%, while background foothill risk lands receive a fixed discount of 30%.
The updated valuation methodology can act as a macro-economic stabilizer in emergency situations. The recalculation of the price of vulnerable assets serves as a tool for indirect preliminary insurance. Fixing financial relaxations during cadastral registration legally establishes the status of the plot as a territory with a natural threat. The occurrence of mudflows in such a case endows state agencies with the legitimate right to reduce or cancel direct compensation. The projected losses of farm enterprises are covered in advance by reducing the rental burden, which properly distributes financial responsibility and protects the budget from sudden cash flow gaps.
Adjusting the valuation indicators stops the unjustified withdrawal of working capital from agricultural sector entities. Reducing the rental cost of large-scale irrigated contours by hundreds of millions of tenge is not a loss for the budget. Such a reduction reflects the rightful alignment of the normative price of land with the level of its actual production output.
The application of the considered methodology can transform state cadastral valuation into an effective lever of spatial planning. Differentiated pricing effectively protects the capital of agricultural enterprises. The emerging economic mechanism motivates farmers to invest in the construction of local protective structures while simultaneously making the development of critical threat zones unprofitable. Integrating the developed algorithm into the infrastructure of the state land cadastre of the Republic of Kazakhstan will form the necessary parity. The proposed approach will harmonize the fiscal needs of the state with the task of preserving agricultural business under conditions of intensifying climate change.
Author Contributions
Conceptualization, G.A. and A.B.; methodology, S.T.; software, N.T.; validation, A.Zh.; formal analysis, G.A.; investigation, A.B.; resources, S.T.; data curation, N.T..; writing—original draft preparation, A.Zh.; writing—review and editing, A.Zh.; visualization, N.T.; supervision, S.T; project administration, A.B.; funding acquisition, G.A. All authors have read and agreed to the published version of the manuscript.
Funding
This work was supported by the Science Committee of the Ministry of Science and Higher Education of the Republic of Kazakhstan within the framework of grant financing for fundamental and applied scientific research of young scientists—postdoctoral students under the "Zhas Galym" project for 2024–2026 (Project IRN AP22683489, "Development of the criterion of efficiency of sustainable land use").
Data Availability Statement
The original contributions presented in the study are included in the article/Supplementary Materials; further inquiries can be directed to the corresponding authors.
Acknowledgments
This work was supported by the Science Committee of the Ministry of Science and Higher Education of the Republic of Kazakhstan within the framework of grant financing for fundamental and applied scientific research of young scientists—postdoctoral students under the "Zhas Galym" project for 2024–2026 (Project IRN AP22683489, "Development of the criterion of efficiency of sustainable land use").
Conflicts of Interest
The authors declare no conflicts of interest. This research was funded by the Science Committee of the Ministry of Science and Higher Education of the Republic of Kazakhstan within the framework of grant financing for fundamental and applied scientific research of young scientists—postdoctoral students under the "Zhas Galym" project for 2024–2026 (Project IRN AP22683489 "Development of the criterion of efficiency of sustainable land use").
Appendix A

Table A1.
Attribute data of land parcels in the test site.
| Parcel No. | Cadastral number | Land category | Type of right | Purpose of use | Area, ha | Rightholder |
| 1 | 03051266002 | Agricultural land | Temporary paid long-term joint land use | For peasant farming | 11944.0000 | Not available |
| 2 | 03051267001 | Agricultural land | Temporary paid long-term joint land use | For peasant farming | 17885.0000 | Not available |
| 3 | 03051268005 | Agricultural land | Temporary paid long-term joint land use | For peasant farming | 2500.0000 | Not available |
| 4 | 03051268003 | Agricultural land | Temporary paid long-term joint land use | For peasant farming | 863.0000 | Not available |
| 5 | 03051268009 | Agricultural land | Temporary paid long-term joint land use | For peasant farming | 1500.0000 | Not available |
| 6 | 03051268010 | Agricultural land | Temporary paid long-term joint land use | For peasant farming | 1241.1115 | Not available |
| 7 | 03051268007 | Agricultural land | Temporary paid long-term joint land use | For peasant farming | 1413.6901 | Not available |
| 8 | 03051268006 | Agricultural land | Temporary paid long-term joint land use | For peasant farming | 1001.4661 | Not available |
| 9 | 03051268008 | Agricultural land | Temporary paid long-term joint land use | For peasant farming | 343.7323 | Not available |
All data were retrieved from the State Corporation 'Government for Citizens' (n.d.), Public Cadastral Map of the Unified State Real Estate Cadastre (Available at: https://map.gov4c.kz/egkn/).
Table A2.
Natural-economic characteristics and base payment rates for land parcels in the test site.
Table A2.
Natural-economic characteristics and base payment rates for land parcels in the test site.
| No. | Cadastral number | Location zone (according to GIS) | Soil type and subtype | Agricultural land type | Base rate (thousand KZT per hectare) |
| 1 | 03051266002 | Southwestern foothills (very high mudflow hazard) | Mountainous dark chestnut and reddish-brown (eroded) | Pasture | 9.4 |
| 2 | 03051267001 | Central-eastern transit zone | Mountainous dark chestnut and reddish-brown | Rainfed arable land | 25.6 |
| 3 | 03051268005 | Central part, optimal foothill relief | Mountainous dark chestnut | Irrigated arable land / Perennial plantings (orchards)* | 126.9 |
| 4 | 03051268003 | Central part, channel-adjacent erosion zone | Mountainous dark chestnut (severely washed-out) | Pasture | 9.4 |
| 5 | 03051268009 | Southeastern plain-foothill zone | Mountainous reddish-brown (chestnut) | Rainfed arable land | 25.6 |
| 6 | 03051268010 | Southeastern plain-foothill zone, stable background | Mountainous reddish-brown (chestnut) | Rainfed arable land | 25.6 |
| 7 | 03051268007 | Northeastern plain margin | Light grey soil (light-chestnut analogues) | Pasture | 8.1 |
| 8 | 03051268006 | Far eastern plain zone | Light grey soil (light-chestnut analogues) | Pasture | 8.1 |
| 9 | 03051268008 | Eastern outer buffer erosion zone | Light grey soil (light-chestnut analogues) | Pasture | 8.1 |
The initial base rates of payment for land plots were determined based on the regulatory guidelines established by the Resolution of the Government of the Republic of Kazakhstan No. 890.
Table A3.
Recalculation of correction coefficients for base payment rates of land parcels.
| No. | Land type | K1 Quality | K2 Slope | K3 Water supply | K4 To economic center | K5 To service center | Calculated total K | Applied limit K (±50 |
| 1 | Pasture | 0.6 (unsatisfactory, erosion) | 0.8 (13–20°) | 1.2 (watered) | 0.7 (>30 km) | 55.78 km (interval 41–60 km) (1.0 ×30 + 0.7 ×25.78)/55.78 = 0.86 |
0.347 | 0.50 |
| 2 | Rainfed arable land | 0.9 (satisfactory) | 0.96 (3–5°) | 0.8 (unwatered) | 0.9 (10–20 km) | 68.43 km (interval 61–80 km) (0.8 × 30 + 0.5 ×38.43)/68.43 = 0.63 |
0.392 | 0.50 |
| 3 | Irrigated arable land | 1.2 (good) | 0.98 (1–3°) | 1.2 (watered) | 1.2 (up to 5 km) |
57.40 km (interval 41–60 km) (1.0 ×30 + 0.7× 27.4)/57.40 = 0.86 |
1.456 | 1.46 |
| 4 | Pasture | 0.6 (unsatisfactory, erosion) | 0.8 (13–20°) | 1.2 (watered) | 1.0 (5–10 km) | 61.57 km (interval 61–80 km) (0.8 × 30 + 0.5 ×31.57)/61.57 = 0.65 |
0.374 | 0.50 |
| 5 | Rainfed arable land | 0.9 (satisfactory) | 0.98 (1–3°) | 0.8 (unwatered) | 1.0 (5–10 km) | 75.00 km (interval 61–80 km) (0.8 × 30 + 0.5 × 45.0)/75.00 = 0.62 |
0.437 | 0.50 |
| 6 | Rainfed arable land | 1.2 (good) | 1.0 (<1°) | 0.8 (unwatered) | 1.2 (up to 5 km) | 75.00 km (interval 61–80 km) (0.8 × 30 + 0.5 × 45.0) /75.00 = 0.62 |
0.714 | 0.71 |
| 7 | Pasture | 0.9 (satisfactory) | 1.0 (<12°) | 0.8 (unwatered) | 0.9 (10–20 km) | 62.00 km (interval 61–80 km) (0.8 × 30 + 0.5 × 32.0)/62.00 = 0.65 |
0.421 | 0.50 |
| 8 | Pasture | 0.9 (satisfactory) | 1.0 (<12°) | 0.8 (unwatered) | 0.8 (20–30 km) | 90.00 km (interval 81–100 km) (0.6 × 30 + 0.5 × 60.0) / 90.00 = 0.53 |
0.305 | 0.50 |
| 9 | Pasture | 0.6 (unsatisfactory, erosion) | 0.8 (13–20°) | 0.8 (unwatered) | 1.0 (5–10 km) | 92.00 km (interval 81–100 km) (0.6 ×30 + 0.5 × 62.0)/ 92.00 = 0.53 |
0.203 | 0.50 |
The recalculation of the base rates relies on a system of correction coefficients, which were determined in strict compliance with the provisions of the Land Code of the Republic of Kazakhstan
Table A4.
Distribution of land plot areas by mudflow hazard categories.
| № | Cadastral numbers of land plots | Risk category (zone) | Total area of the zone, ha (share of the total area, %) | S — total area of the land plot, ha |
| 1 | 03051266002 | Zone I (red) Zone II (orange) |
4144.57 (34.7%) 7799.43 (65.3%) |
11944.00 |
| 2 | 03051267001 | Zone I (red) Zone II (orange) Zone III (yellow) |
391.80 (2.2%) 9761.95 (54.6%) 7731.25 (43.2%) |
17885.00 |
| 3 | 03051268005 | Zone I (red) Zone II (orange) Zone III (yellow) |
477.58 (19.1%) 720.66 (28.8%) 1301.76 (52.1%) |
2500.00 |
| 4 | 03051268003 | Zone I (red) Zone II (orange) |
328.41 (7.5%) 4021.59 (92.5%) |
4350.00 |
| 5 | 03051268009 | Zone I (red) Zone II (orange) Zone III (yellow) |
27.48 (1.8%) 166.14 (11.1%) 1306.38 (87.1%) |
1500.00 |
| 6 | 03051268010 | Zone III (yellow) | 1241.11 (100%) | 1241.11 |
| 7 | 03051268007 | Zone III (yellow) | 1413.6901 (100%) | 1413.6901 |
| 8 | 03051268006 | Zone III (yellow) | 1001.4661 (100%) | 1001.4661 |
| 9 | 03051268008 | Zone III (yellow) | 343.7323 (100%) | 343.7323 |
Table A5.
Calculation of the mudflow hazard coefficient (Kc) based on the value function v(x).
| № | Cadastral number | Total area (Stotal), ha | Area distribution by risk zones (Si), ha (%) | Detailed calculation of the value function v(x) | Value of v(x) | Final coefficient Kc=1−v(x) |
| 1 | 03051266002 | 11944.00 | Zone I: 4144.57 (34.7%) Zone II: 7799.43 (65.3%) |
(4144.57×1.0 + 7799.43× 0.7)/11944.00 | 0.80 | 0.20 |
| 2 | 03051267001 | 17885.00 | Zone I: 391.80 (2.2%) Zone II: 7731.25 (43.2%) Zone III: 9761.95 (54.6%) |
(391.80 × 1.0 + 7731.25 × 0.7 + 9761.95 × 0.3) /17885.00 | 0.49 | 0.51 |
| 3 | 03051268005 | 2500.00 | Zone I: 477.58 (19.1%) Zone II: 720.66 (28.8%) Zone III: 1301.76 (52.1%) |
(477.58 × 1.0 + 720.66 × 0.7 + 1301.76 × 0.3/2500.00 | 0.55 | 0.45 |
| 4 | 03051268003 | 4350.00 | Zone I: 328.41 (7.5%) Zone II: 4021.59 (92.5%) |
(328.41 × 1.0 + 4021.59 × 0.7) /4350.00 | 0.72 | 0.28 |
| 5 | 03051268009 | 1500.00 | Zone I: 27.48 (1.8%) Zone II: 166.14 (11.1%) Zone III: 1306.38 (87.1%) |
(27.48 ×1.0 + 166.14 × 0.7 + 1306.38× 0.3/1500.00 | 0.36 | 0.64 |
| 6 | 03051268010 | 1241.11 | Zone III: 1241.11 (100%) | 1241.11 × 0.3/1241.11 | 0.30 | 0.70 |
| 7 | 03051268007 | 1413.69 | Zone III: 1413.69 (100%) | 1413.69 × 0.3/1413.69 | 0.30 | 0.70 |
| 8 | 03051268006 | 1001.47 | Zone III: 1001.47 (100%) | 1001.47 × 0.3/1001.47 | 0.30 | 0.70 |
| 9 | 03051268008 | 343.73 | Zone III: 343.73 (100%) | 343.73 × 0.3/343.73 | 0.30 | 0.70 |
Table A6.
Comparative analysis of the standard and optimized cadastral value of land plots considering the mudflow hazard coefficient.
Table A6.
Comparative analysis of the standard and optimized cadastral value of land plots considering the mudflow hazard coefficient.
| * Plot No. | S — area of the land plot | Kc — the authors' mudflow hazard coefficient, obtained through the value function v(x) | ** BS — base rate of payment for the land plot, thousand tenge | *** Ki — standard integrated correction coefficient | Ccad — optimized cadastral value of the land plot, thousand tenge | Standard value (Cstandard), thousand tenge | Relative reduction (%) |
| 1 | 11944.00 |
0.20 | 9,4 |
0.50 | 11 227.36 | 56 136.80 | 80% |
| 2 | 17885.00 | 0.51 | 25,6 | 0.50 | 116 753.28 | 228 928.00 | 49% |
| 3 | 2500 | 0.45 | 126.9 | 1.46 | 208 433.25 | 463 185.00 | 55% |
| 4 | 4350 | 0.28 | 9.4 | 0.50 | 5 724.60 | 20 445.00 | 72% |
| 5 | 1500 | 0.64 | 25,6 | 0.71 | 17 448.96 | 27 264.00 | 36% |
| 6 | 1241.11 | 0.70 | 25,6 | 0.50 | 11 120.35 | 15 886.21 | 30% |
| 7 | 1413,6901 | 0.70 | 8.1 | 0.50 | 4 007.81 | 5 725.44 | 30% |
| 8 | 1001,4661 | 0.70 | 8,1 | 0.50 | 2 839.16 | 4 055.94 | 30% |
| 9 | 343,7323 га | 0.70 |
8,1 | 0.50 | 974.48 | 1 392.12 | 30% |
*Plot No. — identifiers of the analyzed land plots. **BS — base rate of payment for the land (thousand tenge), established by the Decree of the Government of the Republic of Kazakhstan No. 890 dated September 2, 2003. The calculation algorithm is presented in Appendix 1, table 1,2 [37]. ***Ki — integrated coefficient accounting for location and infrastructure provision [1]. The detailed calculation methodology is provided in Appendix 1, table 3.
References
- Government of the Republic of Kazakhstan Land code of the Republic of Kazakhstan: Code of the Republic of Kazakhstan No. 442 dated June 20, 2003. Information and legal system of regulatory legal acts of the Republic of Kazakhstan "Adilet" 2003.
- Lepikhina, O.Yu.; Ososkova, Yu.F. On modern problems of state cadastral valuation of real estate. RUDN J. Econ. 2018, 26, 19–27. [CrossRef]
- Zhichkin, K.A.; et al. Cadastral valuation of agricultural land: regional practice. IOP Conf. Ser. Earth Environ. Sci. 2021, 723, 032095. [CrossRef]
- Banikevich, T.D.; Bykova, E.N. Cadastral valuation of agricultural lands and assessment of soil quality: Interrelation and prospects. J. Agric. Environ. 2023, 5. [CrossRef]
- Bykowa, E.; Skachkova, M.; Raguzin, I.; Dyachkova, I.; Boltov, M. Automation of negative infrastructural externalities assessment methods to determine the cost of land resources based on the development of a "thin client" model. Sustainability 2022, 14, 9383. [CrossRef]
- Bykowa, E.; Banikevich, T. Relationship between the integral indicator of soil quality and the cadastral value of agricultural lands. Land 2025, 14, 941. [CrossRef]
- Kovalyshyn, O.; Buśko, M.; Tretiak, N.; Kovalyshyn, O.; Pendzey, L.; Tretiak, R.; Muzyka, N. Valuation approach for assessing efficiency of agricultural land use. Geomat. Environ. Eng. 2025, 19. [CrossRef]
- Grzelka, K.; Pargieła, K.; Jasińska, A.; Warchoł, A.; Bydłosz, J. Registration of objects for 3D cadastre: An integrated approach. Land 2024, 13, 2070. [CrossRef]
- Tulakov, U.T. Title of Presentation. In Proceedings of the International Scientific E-Conference "Human Resources and Modern Professions in the World", Aachen, Germany, 2022.
- Ramos, M.d.P.; Nero, M.A.; Temba, P.d.C. OMI-rural: Valuation of rural properties for taxation purposes based on a rural real estate market observatory. Rev. Gest. Secr. 2026, 20. [CrossRef]
- Rebong, F.R.; Meilano, I.; Sadarviana, V.; Hernandi, A.; Abdulharis, R.; Meilani, R. Strategy for the conversion of 2D to 3D cadastral maps by standardizing the height limit of land rights space based on land use/land cover. Land 2025, 14, 763. [CrossRef]
- Tulakov, U. Integrating the indexation method into Uzbekistan’s cadastral valuation system. Acad. Open 2025, 10. [CrossRef]
- Buuveibaatar, M.; Lee, K.; Lee, W. Developing an LADM valuation information model for Mongolia. Land 2023, 12, 893. [CrossRef]
- Kreshchensky, V.D.; Sharieva, D.M.; Laskin, M.B. Model for allocating the share of the land component from the market value assessment of unified real estate objects. Stat. Econ. 2024, 4–11. [CrossRef]
- Uşak, B.; Çağdaş, V.; Kara, A. Current cadastral trends—a literature review of the last decade. Land 2024, 13, 2100. [CrossRef]
- Zhou, P.; Gai, Y.; Wang, C. Determination of urban land value: A systematic literature review. J. Account. Lit. 2025. [CrossRef]
- Grădinaru, A.P.; Badea, A.-C.; Dragomir, P.I.; Badea, G. Integrating cadastral data with seismic risk data in an online building database for the historical centre of Bucharest city. Land 2023, 12, 1594. [CrossRef]
- Bykowa, E.; Banikevich, T.; Zalivatskaya, N.; Pirogova, O. Modeling the cadastral value of land plots of gardening and horticultural non-profit partnerships taking into account the influence of local factors of the territory. Land 2024, 13, 1004. [CrossRef]
- Vasilyeva, N.V. Cadastres and Cadastral Valuation of Land; Urait Publishing House: Moscow, Russia, 2021.
- Bykova, E.N. Assessment of negative infrastructural externalities in determining the value of land. J. Min. Inst. 2021, 247, 154–170. [CrossRef]
- Petrova, E.E.; Bikezina, T.V.; Arapov, S.V. Real Estate Economics; RSHU: St. Petersburg, Russia, 2022.
- Egorova, A.V.; Zhukovsky, A.Yu. Methodology for accounting for the environmental factor in state cadastral valuation. Int. Res. J. 2022, 12. [CrossRef]
- Simakov, A.V.; Simakova, T.V.; Evtushkova, E.P.; et al. GIS Technologies in Land Management and Cadastre; Northern Trans-Ural State Agricultural University: Tyumen, Russia, 2020.
- Mityagin, S.D. Territorial Planning, Urban Zoning and Territory Planning; Lan: St. Petersburg, Russia, 2019.
- Chs-nik.kz Assessment of mudflow and landslide hazards in Kazakhstan. Available online: https://www.chs-nik.kz/opasnosti/sel/item/575-otsenka-opasnosti-sele-opolznevykh-yavlenij-kazakhstana (accessed on 29 July 2026).
- Talanov, E.A. Mudflow risk: Theoretical foundations and practical significance. In Proceedings of the International Conference "Mudflows: Disasters, Risk, Forecast, Protection", Pyatigorsk, Russia, 2015; Sevkavgiprovodkhoz Institute: Pyatigorsk, Russia, 2015.
- Otvagina, M.G. Updating information and cartographic support of complex cadastral works using GIS technologies. Int. J. Appl. Sci. Technol. Integral 2022, 2, 114.
- GISCloud GIS mapping and benefits of online solutions. Available online: https://www.giscloud.com/blog/gis-mapping-and-benefits-of-onlinesolutions/#evolution (accessed on 15 January 2025).
- Rustam, O.; Sanjarbek, S. Creation of a complex electronic map of agriculture and agro-geo databases using GIS techniques. Title of Abbrev. Journal 2023, 2–5.
- Medeu, A.R.; Blagoveshchenskiy, V.P.; Baimoldaev, T.A.; Kirenskaya, T.L.; Stepanov, B.S. Mudflow Phenomena of South-Eastern Kazakhstan, 2nd ed.; Institute of Geography: Almaty, Kazakhstan, 2016; Volume 2, pp. 1–200.
- Wikipedia Talgar district. Available online: https://ru.wikipedia.org/wiki/Талгарский_райoн (accessed on 23 August 2026).
- Keeney, R.L.; Raiffa, H. Decisions with Multiple Objectives: Preferences and Value Tradeoffs; Cambridge University Press: New York, NY, USA, 1993. [CrossRef]
- Jallow, A.G.; Diongue, D.M.L.; Emvoutou, H.C.; Mama, D.; Faye, S. Groundwater recharge zone mapping using GIS-based analytical hierarchy process and multi-criteria evaluation: Case study of greater Banjul area. Am. J. Water Resour. 2020, 8, 182–190. [CrossRef]
- Buba, F.N. Spatial distribution analysis of soil lead concentration in Anka, Zamfara state, Nigeria. J. Environ. Pollut. Hum. Health 2016, 4, 16–23. [CrossRef]
- Geneletti, D. Multicriteria analysis to compare the impact of alternative road corridors: A case study in northern Italy. Impact Assess. Proj. Apprais. 2005, 23, 135–146. [CrossRef]
- Nyeko, M. GIS and multicriteria decision analysis for land use planning. J. Geogr. Inf. Syst. 2012, 4, 44039. [CrossRef]
- Government of the Republic of Kazakhstan On the approval of base rates of payment for land plots: Resolution of Government of the Republic of Kazakhstan No. 890 dated September 2, 2003. Information and legal system of regulatory legal acts of the Republic of Kazakhstan "Adilet". Available online: https://adilet.zan.kz/rus/docs/P030000890 (accessed on 8 September 2026).
Figure 3.
Mudflow hazard map of the Talgar District by river channels and high-altitude areas.
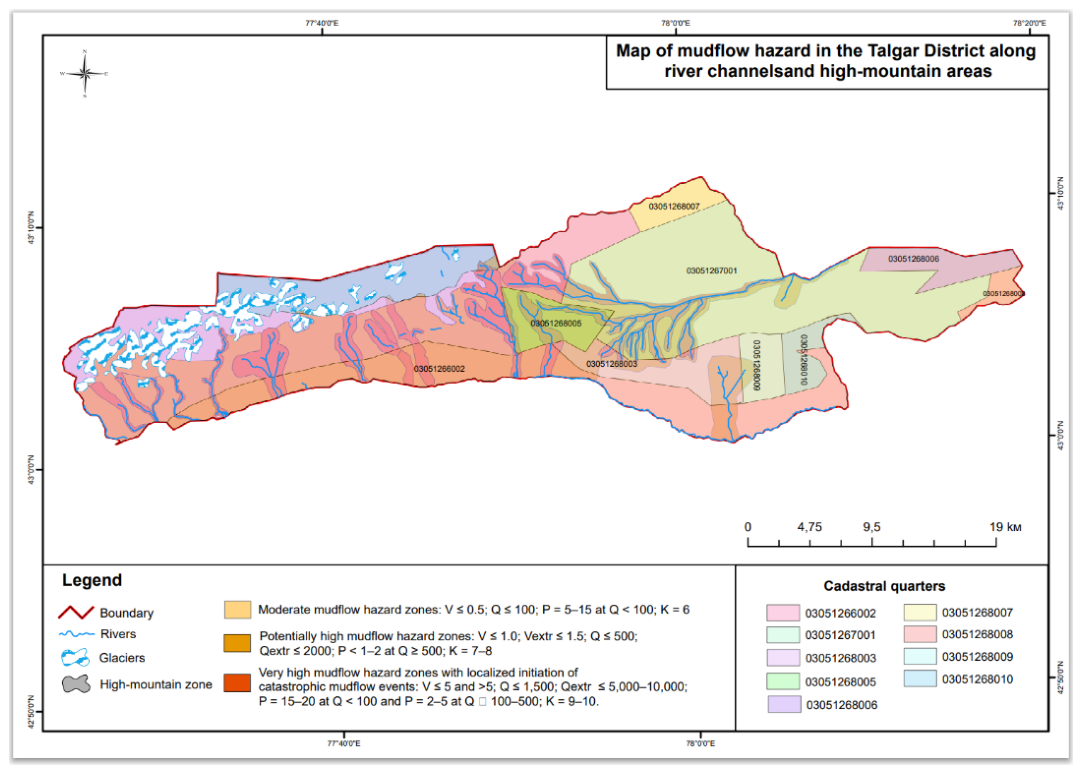
Table 1.
Mudflow hazard categories and projected consequences.
| Category (Zone) | Color | Zone characteristics | Flow parameters | Degree of destruction | Consequences and nature of impact |
| I | Red | Zones of very high mudflow hazard degree with the focal initiation of catastrophic mudflow events. | B up to 5 and >; Q up to 1500; Qextr up to 5000–10000; P-15-20 at Q < 100 and P-2-5 at Q >> 100-500; K up to 9-10. | Critical (100%) | The territory is exposed to the destructive impact of mudflows. Capital objects and standard buildings will be completely destroyed. |
| II | Orange | Zones of potentially high mudflow hazard degree. | B up to 1.0; Bextr up to 1.5; Q up to 500; Qextr up to 2000; P < 1-2 at Q-500 and >; K-7-8. | High (70–90%) | Flows destroy buildings, washing away their lower floors, and destroy infrastructure. |
| IIa | Yellow-orange | Zones of potentially high mudflow hazard degree in the stage of modern activation. | Same as for zone II | High (70–90%) | Zone II is characterized by severe damage and sediment burial of buildings upon flow impact. |
| III | Yellow | Zones of medium mudflow hazard degree. | B up to 0.5; Q up to 100; P-5-15 at Q < 100; K-6. | Moderate (40–60%) | Basement premises are damaged, the territory is subjected to flooding; light structures, fences, and landscaping elements are partially destroyed. |
B – volume of debris flow per single mudflow event (million m³); Q – mudflow discharge (m³/sec); Qextr – the same, extremum (m³/sec); Q water – flood discharge (m³/sec); P – recurrence probability (%); V – potential volume of seismic earthflows (thousand m³); M – earthquake magnitude; I0 – earthquake intensity in macroseismic points; K – energy classes of mudflows (K = \log E, where E is the kinetic energy of the flows in Joules).
Table 2.
Impact of mudflow hazard on agricultural lands.
| Category (zone) and color | Soil washout (%) | Nature of erosion and soil damage | Crop loss (%) | Agronomic consequences and measures |
| I (Very high / Red) |
90–100% | The soil cover is completely destroyed down to the bedrock, along with the root systems of perennial plantings. | 100% | The direct threat of catastrophic mudflows precludes the economic use of arable land. Such lands are subject to complete removal from crop rotation. |
| II and IIa (Potentially high / Orange) |
60–80% | Deep erosion develops, washouts and ravines form, and the arable horizon is destroyed. | 70–100% | In the event of a mudflow or powerful flood, the current crop is completely lost. Costly melioration and grading works are required to restore fertility. |
| III (Medium / Yellow) |
30–50% | Sheet and intense rill erosion develop; the plot is buried with pebble and fine earth of medium thickness. | 40–60% | Crop yields drop sharply: a part of the crops dies from siltation or flooding, while another part can be saved through protective measures. |
Disclaimer/Publisher’s Note: The statements, opinions and data contained in all publications are solely those of the individual author(s) and contributor(s) and not of MDPI and/or the editor(s). MDPI and/or the editor(s) disclaim responsibility for any injury to people or property resulting from any ideas, methods, instructions or products referred to in the content. |
© 2026 by the authors. Licensee MDPI, Basel, Switzerland. This article is an open access article distributed under the terms and conditions of the Creative Commons Attribution (CC BY) license (http://creativecommons.org/licenses/by/4.0/).
Copyright: This open access article is published under a Creative Commons CC BY 4.0 license, which permit the free download, distribution, and reuse, provided that the author and preprint are cited in any reuse.