

Submitted:
10 September 2026
Posted:
11 September 2026
You are already at the latest version
Abstract
Fibrotic interstitial lung disease (f-ILD) progresses at variable rates, and bulk cell densities discard the spatial information behind that variation. Free fatty acid receptor 2 (FFAR2) senses microbial short-chain fatty acids (SCFAs) and restrains macrophage inflammation, but its position in the human fibrotic lung remains unknown. We tested position rather than abundance. In cryobiopsy specimens from 10 patients with fibrotic idiopathic interstitial pneumonia, we combined chromogenic multiplex immunohistochemistry for FFAR2/Iba1 and CD163/Iba1 with deep learning-based image cytometry, mapped single-cell coordinates, and scored each subset’s proximity to stromal cells and the alveolar epithelium with three indices, including the colocalization index (CLI). Proximity of FFAR2-positive macrophages to stromal cells correlated with the 1-year change in forced vital capacity (FVC) (CLI: ρ=0.80, p<0.01) and in diffusing capacity for carbon monoxide (DLco) (CLI: ρ=0.83, p<0.05). Proximity to the alveolar epithelium correlated still more closely with the FVC change (CLI: ρ=0.87, p<0.01). CD163-positive macrophages showed no such association with FVC, and no index correlated with baseline lung function. In this preliminary cohort, the position of FFAR2-positive macrophages, not their abundance, marks a protective niche and nominates the SCFA-FFAR2 axis as a therapeutic target in f-ILD.
Keywords:
free fatty acid receptor 2 (FFAR2)
; macrophages
; interstitial lung disease
; pulmonary fibrosis
; spatial pathobiology
; short-chain fatty acids (SCFAs)
; image cytometry
1. Introduction
Idiopathic pulmonary fibrosis (IPF) and other progressive fibrotic interstitial lung diseases (ILDs) cause aberrant epithelial injury, fibroblast activation, and irreversible extracellular matrix deposition. These changes result in a progressive decline in lung function and respiratory failure [1]. Although antifibrotic agents are available, disease progression remains variable and unpredictable. This variability underscores the need to identify the microenvironmental factors that drive fibrogenesis in fibrotic ILDs (f-ILDs) and to find novel prognostic biomarkers.
Emerging evidence implicates the lung microbiota and its metabolites in the pathogenesis of IPF [2]. Short-chain fatty acids (SCFAs), such as acetate, propionate, and butyrate, represent key microbial fermentation products. These metabolites modulate host immunity by activating G protein-coupled receptors, particularly free fatty acid receptor 2 (FFAR2; also known as GPR43) [3]. Although research has documented the immunomodulatory effects of SCFA-FFAR2 signaling in the gut and systemic inflammatory models, its specific role in the pulmonary microenvironment during active fibrosis remains unexplored. These metabolites, whether derived from local lung microbiota or gut fermentation via the gut-lung axis, are known to regulate the pulmonary immune microenvironment [4].
Macrophages are highly plastic immune cells that regulate tissue homeostasis, inflammation, and fibrosis [5]. In the fibrotic lung, macrophages interact with surrounding structural cells, such as alveolar epithelial cells and fibroblasts, to modulate tissue remodeling. Although CD163-expressing macrophage populations typically exhibit M2-like, pro-fibrotic phenotypes, the functional diversity of macrophages suggests that distinct subsets may exert protective or regulatory effects depending on their spatial niche. Macrophage FFAR2 expression influences cellular polarization and inflammatory responses [6]. Indeed, FFAR2 activation on macrophages suppresses pro-inflammatory polarization and NLRP3 inflammasome activation in non-pulmonary models [7]. Beyond this anti-inflammatory effect, butyrate, a short-chain fatty acid that signals partly through FFAR2, prevents TGF-β1-induced alveolar myofibroblast differentiation and attenuates bleomycin-induced pulmonary fibrosis [8,9]. This axis therefore acts on fibrogenesis itself rather than merely dampening inflammation, which places FFAR2-expressing macrophages apart from CD163-expressing M2-like macrophages, in which anti-inflammatory polarization coexists with a pro-fibrotic remodeling program. However, no studies have investigated the clinical significance and role of FFAR2-expressing macrophages in human fibrotic lung tissue.
We hypothesized that FFAR2-expressing macrophages occupy specific spatial niches within the fibrotic lung and that their proximity to stromal cells and the alveolar epithelium exerts a protective immunomodulatory effect that limits disease progression. To test this hypothesis, we conducted a preliminary study using deep learning-based image cytometry. We quantitatively analyzed the spatial colocalization of FFAR2-positive macrophages with stromal and epithelial cells in lung biopsy specimens from patients with f-ILD. Finally, we evaluated the association of these spatial relationships with baseline lung function and its longitudinal change.
2. Materials and Methods
2.1. Patients
This retrospective, preliminary study enrolled 10 patients who underwent transbronchial cryobiopsy (TBLC) for ILDs between March 2023 and January 2024. A multidisciplinary discussion (MDD) established the diagnosis of fibrotic idiopathic interstitial pneumonia (f-IIP) for all patients in accordance with current clinical practice guidelines [10]. The Ethics Committee of the Kindai University Faculty of Medicine approved the study protocol (Approval No. 2026-114, Date: 28 August 2026) in compliance with the Declaration of Helsinki. The committee waived the requirement for informed consent due to the retrospective study design. We collected demographic and clinical data at diagnosis. We performed baseline pulmonary function tests, including forced vital capacity (FVC) and diffusing capacity for carbon monoxide (DLco), with a CHESTAC-800 spirometer (Chest, Tokyo, Japan) according to standard guidelines [11]. We also measured serum levels of Krebs von den Lungen-6 (KL-6) and surfactant protein D (SP-D). To evaluate disease progression, we calculated the 1-year change in FVC and DLco (absolute change) [12]. Finally, we reviewed all treatments initiated within one year of diagnosis.
2.2. Multiplex Immunohistochemistry (mIHC)
We performed sequential chromogenic multiplex immunohistochemistry (mIHC) on 4-μm-thick formalin-fixed, paraffin-embedded (FFPE) lung tissue sections from TBLC [13,14]. Deparaffinized and rehydrated sections underwent heat-induced epitope retrieval (HIER) in Tris-EDTA buffer (pH 9.0) at 121°C for 20 minutes. We blocked endogenous peroxidase with 3% hydrogen peroxide and applied a protein-blocking solution. To identify distinct macrophage subsets (FFAR2-positive and CD163-positive macrophages), we performed two separate double-staining protocols (FFAR2/Iba1 and CD163/Iba1) on separate slides. We sequentially incubated sections with primary antibodies against either FFAR2 (polyclonal, Proteintech, 19952-1-AP; 1:200) or CD163 (monoclonal, clone EPR19518, Abcam, ab182422; 1:1000) and the pan-macrophage marker Iba1 (monoclonal, clone EPR16589, Abcam, ab221790; 1:5000). We visualized signals with Histofine Simple Stain MAX-PO (peroxidase) and AP (alkaline phosphatase) systems (Nichirei Biosciences, Tokyo, Japan). We developed chromogens sequentially using HistoGreen (Cosmo Bio, Tokyo, Japan) for FFAR2 or CD163, and First Red II (Nichirei Biosciences, Tokyo, Japan) for Iba1. Overlap of the two chromogens, which appears as a dark brown to dark green signal, identified target-positive (FFAR2-positive or CD163-positive) macrophages. Between staining rounds, we stripped antibodies using HIER in citrate buffer (pH 6.0) at 95°C for 10 minutes. We verified stripping efficiency by omitting primary antibodies in subsequent runs. To ensure staining uniformity, we processed all sections in a single batch using an automated stainer and counterstained them with hematoxylin.
2.3. Digital Pathology and Cell Detection
We performed image acquisition and analysis in accordance with previous protocols [13,15]. Following mIHC, we scanned whole-slide digital images via a NanoZoomer-SQ system (Hamamatsu Photonics, Hamamatsu, Japan) at 20× magnification (0.75 numerical aperture [NA]). To quantitatively evaluate the spatial distribution of macrophages, we performed image analysis using Cu-Cyto, a deep learning-based image cytometry system. We initially identified lung tissue areas on the digital slides and manually refined these regions to exclude necrosis, hemorrhage, and artifacts. For cell-level identification and single-cell classification, the Cu-Cyto system employed a human-AI collaborative workflow via the Cu-Cyto Viewer. First, the system performed automated cell detection with a ResNet- or Network-in-Network-based deep learning model on small image patches (40×40 pixels) to classify cell types into macrophages, stromal cells, and alveolar epithelial cells. Furthermore, a bit-pattern kernel-filtering algorithm prevented multi-counted cell determinations across large tissue areas [13]. Expert pulmonologists (O.N. and H.M.), blinded to clinical outcomes, visually verified and corrected the classification accuracy across all specimens based on morphological and phenotypic criteria (e-Figure 1, e-Figure 2). After identifying and classifying single cells, we recorded their coordinates to calculate spatial proximity indices. Because the fibrotic and preserved alveolar fractions differed substantially between cryobiopsy specimens, whole-section macrophage counts and densities were not comparable across patients. We therefore restricted the analysis to proximity indices normalized within each specimen.
We evaluated colocalization using four distinct spatial proximity indices. We defined cell-to-cell proximity using a physical distance threshold of 20 μm from the cell center to represent the immediate spatial neighborhood. The Colocalization Index (CLI) measures the relative density of target macrophages in the immediate vicinity (within 20 μm) of structural cells compared to their overall density [16]. The Jaccard Index (JAC) represents the intersection over union of the spatial areas (defined by a 20-μm radius around cell coordinates) that the two cell types occupy [17]. The modified Jaccard Index (mJAC) represents a variation of JAC adjusted for spatial scaling [18]. The Morisita-Horn Index (MHI) evaluates the overlap in spatial distribution probabilities between the cell populations within local quadrats [19,20]. For the evaluation of spatial relationships among three cell types (macrophages, stromal cells, and alveolar epithelial cells), we calculated a three-way proximity index. This index measures the relative density of target macrophages within the overlapping vicinity of both stromal and alveolar epithelial cells (i.e., within 20 μm from both cell types, which corresponds to the stroma-epithelial junction) compared to their overall density. We evaluated two-cell proximity with CLI, mJAC, and MHI, and three-cell proximity with CLI alone.
2.4. Statistical Analysis
We performed all statistical analyses using JMP Pro version 19.0 (JMP Statistical Discovery LLC, Cary, NC, USA) in accordance with established statistical frameworks [21,22]. We expressed continuous variables as the mean ± standard deviation (SD) or median with interquartile range (IQR). Due to the small sample size (), we utilized non-parametric methods. We compared continuous baseline characteristics between patient subgroups using the Mann-Whitney test, and categorical variables using Fisher’s exact test. We compared the paired proximity indices of FFAR2-positive and CD163-positive macrophages within each patient using the Wilcoxon signed-rank test. To evaluate the relationships between spatial colocalization metrics and clinical variables (baseline values and their 1-year changes), we calculated Spearman’s rank correlation coefficient (). We defined statistical significance as a two-sided -value of less than 0.05.
3. Results
3.1. Patient Characteristics
In this preliminary cohort of 10 patients, the mean age was 71.0 ± 8.1 years, and seven were male (Table 1). The cohort included patients with IPF (n = 4) and unclassifiable IIP (n = 6). Baseline demographics, pulmonary function, and biomarker levels did not differ significantly between these subgroups. MDD established all diagnoses following TBLC. At baseline, the mean FVC was 2.6 ± 0.6 L (82.2 ± 17.2% predicted), and the mean DLco was 11.9 ± 2.1 mL/min/mmHg (72.5 ± 16.6% predicted). The mean serum KL-6 and SP-D levels were 1125 ± 540 U/mL and 258 ± 152 U/mL, respectively. Over a one-year follow-up, we observed a mean FVC change of -2.6 ± 10.7% (n = 9) and a mean DLco change of 0.1 ± 9.3% (n = 8). One patient could not undergo DLco testing at follow-up due to lung function deterioration. Another patient missed follow-up testing due to a pneumothorax. Within one year of diagnosis, four patients received nintedanib, two received nerandomilast in a clinical trial, one received prednisolone, and one received prednisolone plus tacrolimus. Two patients received no treatment. Nine patients showed either decreased FVC and DLco or less than 5% improvement. In contrast, the patient treated with nerandomilast demonstrated FVC and DLco improvements of 18.4% and 22.9%, respectively. Prednisolone monotherapy did not improve FVC or DLco. The patient receiving prednisolone plus tacrolimus could not undergo follow-up tests. The small sample size precluded statistical analysis of the relationships between treatments and lung function changes.
This table summarizes the demographic and baseline physiological parameters of the study cohort, as well as the 1-year longitudinal changes in lung function. Data are presented as mean ± SD or absolute numbers. Note that the sample sizes for the 1-year changes are n=9 for FVC and n=8 for DLco due to missing follow-up data. FVC: forced vital capacity; DLco: diffusing capacity for carbon monoxide; ILD: interstitial lung disease; IPF: idiopathic pulmonary fibrosis; IIP: idiopathic interstitial pneumonia; SP-D: surfactant protein D; KL-6: Krebs von den Lungen-6.
3.2. Spatial Distribution and Proximity of Macrophage Subpopulations
Deep learning-based image cytometry mapped the spatial localization of target cells in the lung tissues. We performed standard hematoxylin and eosin (HE) staining (Figure 1A, Figure 2A) and spatial cell distribution mapping of detected cell coordinates (Figure 1B, Figure 2B). Sequential chromogenic mIHC resolved the two macrophage subsets at the single-cell level. FFAR2-positive macrophages carried overlapping FFAR2 and Iba1 signals and lay within the fibrotic stroma and along the alveolar walls (Figure 1C). CD163-positive macrophages showed the same dual labeling pattern and occupied both the fibrotic stroma and the alveolar spaces (Figure 2C). Quantitative spatial proximity metrics between FFAR2-positive macrophages and adjacent structural cells varied across specimens, as visualized by colocalization mapping with stromal cells (Figure 1D) and alveolar epithelium (Figure 1E). Similarly, CD163-positive macrophages showed variable proximity to these structural components, as shown by colocalization mapping with stromal cells (Figure 2D) and alveolar epithelium (Figure 2E). Computerized colocalization mapping visualized hot spots with high CLI values throughout the lung tissue.
A quantitative analysis of these spatial relationships demonstrated variable colocalization across the cohort (Table 2). We found both FFAR2-positive and CD163-positive macrophages in proximity to stromal and alveolar epithelial cells, although the indices varied widely among patients. For example, the median CLI for FFAR2-positive macrophages was 0.38 with stromal cells and 1.04 with alveolar epithelial cells. In contrast, CD163-positive macrophages exhibited median CLIs of 1.75 and 1.77, respectively. A paired comparison of the two macrophage populations, however, showed no significant difference in any of the seven proximity metrics (Wilcoxon signed-rank test; -), although the two markers were stained on separate sections.
This table presents the quantitative results of the spatial proximity analysis between target macrophage populations and structural lung cells. Values represent the calculated index of the degree of spatial overlap or proximity, shown as medians with inter-quartile ranges (IQR) in parentheses. A higher index value generally indicates closer spatial proximity or higher colocalization. CLI: Colocalization Index; mJAC: modified Jaccard Index; MHI: Morisita-Horn Index.
3.3. Association of FFAR2-Positive Macrophage Spatial Proximity with Longitudinal Pulmonary Function Decline
The spatial proximity of FFAR2-positive macrophages to stromal cells correlated positively with the 1-year change in FVC (CLI: , ; mJAC: , ; MHI: , ) and DLco (CLI: , ; mJAC: , ; MHI: , ) (Table 3). These results indicate that a higher colocalization of FFAR2-positive macrophages with the stroma correlates with an attenuated decline in lung function (Figure 3A).
This table displays the correlations between the calculated spatial indices of FFAR2-positive macrophages and baseline or longitudinal pulmonary function parameters. Data represent Spearman’s rank correlation coefficients () with the corresponding -value in parentheses. Positive values in the “Change in FVC/DLco” columns indicate that higher spatial proximity correlates with a less negative (i.e., more favorable) change in lung function over one year. The sample sizes are for FVC change and for DLco change. * , ** .
We observed a similar positive correlation between the spatial proximity of FFAR2-positive macrophages to the alveolar epithelium and the 1-year change in FVC (CLI: , ; mJAC: , ; MHI: , ) (Figure 3B). The correlation with the 1-year change in DLco reached significance for mJAC and MHI (, ) but not for CLI (, ). The three-way spatial proximity index, which reflects the colocalization of FFAR2-positive macrophages at the junction of the fibrotic stroma and alveolar epithelium, correlated significantly with the 1-year changes in both FVC (CLI: , ) and DLco (CLI: , ) (Table 3). In contrast, these spatial proximity metrics showed no correlation with baseline FVC or DLco at diagnosis. Excluding the one patient who showed marked improvements in FVC (18.4%) and DLco (22.9%) did not alter the significance of FVC correlations. Specifically, the spatial proximity of FFAR2-positive macrophages to stromal cells and the alveolar epithelium, as well as the three-way proximity at the stroma-epithelium junction, remained significantly correlated with the 1-year change in FVC. Conversely, all correlations with the 1-year change in DLco became non-significant positive trends, except for MHI with stromal cells.
3.4. Spatial Proximity of CD163-Positive Macrophages and Longitudinal Pulmonary Function Change
Unlike the FFAR2-positive subset, the spatial proximity of CD163-positive macrophages to stromal cells showed no correlation with 1-year changes in FVC (CLI: , ; mJAC and MHI: , ) or DLco (CLI: , ; mJAC and MHI: , ) (Table 4, Figure 4A). The colocalization of CD163-positive macrophages with the alveolar epithelium correlated positively with the change in DLco (, for all three indices), but the correlation with the change in FVC was weak and non-significant ( = 0.32-0.45) (Figure 4B).
This table displays the correlations between the spatial indices of CD163-positive macrophages and pulmonary function parameters. Data represent Spearman’s rank correlation coefficients () with the corresponding -value in parentheses. Stromal colocalization of CD163-positive macrophages shows no significant correlation with lung function changes, whereas colocalization with the alveolar epithelium correlates positively with the change in DLco. The sample sizes are for FVC change and for DLco change. * .
The three-way spatial proximity for CD163-positive macrophages showed a trend identical to that of their colocalization with the alveolar epithelium alone; it correlated with the 1-year change in DLco (, ) but not with the change in FVC (, ) (Table 4). Similar to the FFAR2 data, none of the CD163-associated spatial metrics correlated with baseline pulmonary function. These results indicate that the spatially protective niche observed for FFAR2-positive macrophages was absent in the CD163-positive population.
4. Discussion
In this preliminary study, we analyzed the spatial organization of pulmonary macrophage subsets and evaluated their association with clinical disease progression in f-IIP. Deep learning-based image cytometry mapped the distinct microenvironmental niches of FFAR2-expressing macrophages and revealed their variable proximity to stromal and epithelial cells (Figure 1). We similarly mapped CD163-positive macrophages, which represent a classically remodeling-associated population (Figure 2). The spatial proximity of FFAR2-positive macrophages to the stromal cells, alveolar epithelium, and their junction correlated positively with the 1-year change in FVC (and with DLco to a lesser extent), indicating an association with slower disease progression (Table 3 and Figure 3). Although the colocalization of CD163-positive macrophages with stromal cells and alveolar epithelium did not correlate with the 1-year change in FVC. The colonaization of CD163-positive macrophages with stromal cells did not correlated with the 1-year change in FVC, , its correlation with the change in DLco was positive but weaker (Table 4 and Figure 4). These findings suggest that FFAR2-positive macrophages occupy a protective spatial niche that distinguishes their spatial-clinical behavior from that of the CD163-positive population.
The microenvironmental organization of FFAR2-positive macrophages showed that these cells resided in close proximity to both stromal and epithelial structures (Figure 1). FFAR2 is a G-protein-coupled receptor for microbiota-derived SCFAs [23,24], and gut microbiota dysbiosis has been documented in IPF patients [25]. SCFAs are not confined to the gut. They have been measured directly in the airway secretions of patients with cystic fibrosis and in the sputum of patients with obstructive airway disease [26,27], indicating that FFAR2 ligands can be generated within the airway itself. The gut-lung axis represents a further route by which circulating SCFA signals modulate the pulmonary immune microenvironment, and disruption of this axis has been linked to respiratory disease progression [28,29]. Consistent with a local source of ligand, we have detected Fusobacterium species, butyrate-producing anaerobes, in the bronchoalveolar lavage (BAL) fluid of a separate cohort of patients with ILD (unpublished observations); SCFAs themselves remained below the detection limit of our assay in BAL fluid, which is heavily diluted relative to epithelial lining fluid. The presence of these organisms therefore indicates a capacity for local SCFA production without establishing the concentrations reached at the tissue level. The close physical contact of FFAR2-positive macrophages with structural cells suggests that they participate in local cellular communication within these SCFA-accessible niches. Activation of FFAR2 in pulmonary compartments may prompt macrophages to release regulatory factors that limit fibrogenic activity in adjacent structural cells [6]. The spatial distribution of these cells thus represents a structural basis for local metabolic-immune interactions, though the precise spatial scales at which SCFA concentrations activate FFAR2 within the fibrotic microenvironment remain to be determined experimentally.
We also observed a widely distributed pattern of CD163-positive macrophages within the fibrotic stroma and alveolar areas (Figure 2). Macrophages expressing CD163 typically represent the M2-like phenotype, which plays a major role in tissue remodeling and collagen deposition [5]. In fibrotic lungs, these cells accumulate in areas of active tissue repair. The abundant presence of CD163-positive macrophages in the stroma aligns with their classical role as drivers of fibrogenesis. Unlike the FFAR2-positive subset, CD163-positive cells appeared to participate primarily in extracellular matrix deposition and tissue remodeling rather than homeostatic regulation. The spatial characteristics of CD163-positive macrophages supported the hypothesis that they contribute to the persistent fibrotic process in the lung tissue [30]. One observation did not fit this interpretation. Unlike their proximity to the stroma, the proximity of CD163-positive macrophages to the alveolar epithelium correlated positively with the 1-year change in DLco (, ; Table 4). CD163 does not mark a single functional entity: monocyte-derived macrophages recruited into the fibrotic stroma and tissue-resident alveolar macrophages both express it, yet differ in origin and function [31]. The divergent clinical associations of stromal versus alveolar CD163-positive macrophages are consistent with this heterogeneity and indicate that the spatial compartment, rather than the marker alone, determines the functional read-out. This interpretation remains provisional and requires transcriptomic or multi-marker phenotyping to confirm.
The strong positive correlation between FFAR2-positive macrophage proximity to stromal or epithelial cells and the 1-year change in pulmonary function suggested a protective role for this subset (Figure 3). Specifically, macrophages located near stromal cells may release factors that inhibit fibroblast activation and myofibroblast differentiation. Consistent with this, butyrate, a principal SCFA and FFAR2 ligand, has prevented TGF-β1-induced alveolar myofibroblast differentiation in vitro and has attenuated pulmonary fibrosis in bleomycin models [8,9]. FFAR2 activation on macrophages also suppresses the release of pro-inflammatory cytokines and limits tissue remodeling [6]. Furthermore, the proximity of these macrophages to the alveolar epithelium may support epithelial survival and prevent aberrant epithelial-mesenchymal transition [32]. The three-way proximity index also correlated with preserved lung function (Table 3). These findings suggest that the stroma-epithelial junction serves as a spatial compartment where FFAR2-positive macrophages modulate the pathological crosstalk between damaged epithelial cells and activated fibroblasts to preserve respiratory function. This junction marks the front along which fibrosis extends into preserved alveoli, and therefore represents the region where disease progression occurs. FFAR2-positive macrophage proximity tracked with lung function preservation at this front. These cells thus reside where regulatory activity would be most consequential.
In contrast to the FFAR2-positive population, the spatial proximity of CD163-positive macrophages to the stroma failed to correlate with the 1-year change in FVC (Figure 4). The two populations did not differ in any of the seven proximity metrics (Table 2), so this divergence does not follow from one subset simply lying closer to structural cells than the other. What separated them was the clinical correlate rather than the spatial measurement: proximity tracked with preserved FVC for the FFAR2-positive subset alone [31]. These differences suggested that CD163-positive macrophages primarily engaged in the fibrotic remodeling process, whereas FFAR2-positive macrophages acted as regulatory cells that limit tissue decline. The absence of an association between CD163-positive macrophage proximity to stromal cells and lung function decline may reflect the treatment background, because six of the ten patients received antifibrotic agents. Withholding these agents from patients with established pulmonary fibrosis would be unethical, so this explanation cannot be tested directly. Targeting the specific pathways that distinguish these two subsets of macrophages could lead to new therapeutic interventions in f-ILD [33].
These spatial associations identify the SCFA-FFAR2 axis as a candidate therapeutic target in pulmonary fibrosis. Gut-derived SCFAs already circulate in the bloodstream, and their concentration is pharmacologically tractable. Whether raising SCFA availability translates into antifibrotic activity in the human lung requires direct testing.
This study has several limitations that limit the generalizability of the findings. First, the small cohort size (; Table 1) and retrospective design limit statistical power, and these findings require validation in larger patient cohorts. Second, the treatment background was heterogeneous (Table 1); notably, one patient treated with nerandomilast [34] showed lung function improvement (FVC 18.4%, DLco 22.9%), which could disproportionately influence the correlation analyses. However, using non-parametric Spearman’s rank correlation minimized the impact of this outlier. Furthermore, sensitivity analysis excluding this patient confirmed that the proximity correlations with the 1-year change in FVC remained significant, whereas the correlations with the 1-year change in DLco (except for MHI with stromal cells) became non-significant trends due to the reduced sample size (n = 7). Third, the missing follow-up DLco data for one patient due to clinical deterioration (Table 1) represents a non-random clinical event, which could lead to an underestimation of overall disease progression. Fourth, we could not determine how antifibrotic or anti-inflammatory treatments (Table 1) affect the spatial proximity of these macrophage subsets over time. Fifth, these correlational observations do not establish direct causal relationships. Because this study is observational and based on correlation analysis of tissue specimens at a single timepoint, we cannot exclude the possibility of reverse causality. For instance, a more stable, slowly progressing lung microenvironment might simply allow FFAR2-positive macrophages to remain adjacent to structural cells (Figure 1), rather than their proximity driving the preservation of lung function (Figure 3, Table 3). Direct functional investigations using in vitro or in vivo models are necessary to establish a causal relationship. Sixth, we stained FFAR2/Iba1 and CD163/Iba1 on separate sections and therefore could not determine the extent to which the two populations overlap at the single-cell level. Whether FFAR2-positive and CD163-positive macrophages represent largely distinct subsets, or a partially shared population in which FFAR2 marks a functionally divergent state within M2-like macrophages, requires triple staining in future work. This uncertainty limits how strongly the two populations can be contrasted. Finally, future laboratory studies must clarify the precise source of SCFAs and the molecular pathways downstream of FFAR2 activation in pulmonary macrophages [3,6].
5. Conclusions
In conclusion, our spatial pathology analysis provides preliminary evidence that the proximity of FFAR2-positive macrophages to stromal and epithelial cells is associated with an attenuated decline in pulmonary function in patients with f-ILD. This spatial association highlights FFAR2 signaling as a potential protective pathway in fibrotic lung disease. Furthermore, the findings demonstrate the utility of deep learning-based spatial cytometry in identifying microenvironmental cellular interactions that correlate with clinical outcomes. Future prospective studies and functional assays are necessary to validate these spatial findings and explore the therapeutic potential of targeting the SCFA-FFAR2 axis.
Supplementary Materials
The following supporting information can be downloaded at the website of this paper posted on Preprints.org: e-Figure 1, representative image of lung tissue with cells annotated by the pathologist; e-Figure 2, representative image of the same lung tissue with cells identified by the Cu-Cyto system.:
Author Contributions
O.N. and M.F. conceptualized and designed the study. O.N. provided patient specimens and clinical data. M.F, T.N., M.O., and H.M. assisted with methodology. T.N. performed spatial image cytometry analysis and spatial graph construction. O.N. performed statistical calculations. O.N. and M.F. wrote the original draft. All authors reviewed, edited, and approved the final manuscript.
Funding
This work was supported by JSPS KAKENHI (Grant Numbers 26K11152 to O.N., 25K12376 to M.O., and 24K10381 to T.N.).
Institutional Review Board Statement
The Ethics Committee of the Kindai University Faculty of Medicine approved the study protocol (Approval No. 2026-114, Date: 28 August 2026) in compliance with the Declaration of Helsinki.
Informed Consent Statement
The Institutional Review Board waived the requirement for patient consent due to the retrospective nature of the study. We provided an opt-out option on the department website in accordance with ethics committee guidelines.
Data Availability Statement
The datasets generated and analyzed during this study are not publicly available due to patient privacy constraints in this small cohort. De-identified data are available from the corresponding author upon reasonable request and with permission from the Institutional Review Board.
Acknowledgments
During the preparation of this manuscript, Gemini 3.1 Pro, Perplexity AI (version 2.87.0), and DeepL (version 26.21.0) were used solely for language editing and stylistic improvements in select paragraphs. The authors thank Aichi Pathological Diagnostic Clinic (https://www.aichi-path-cl.com/) for the IHC staining and Ms. Heather A. McDonald for native English proofreading.
Conflicts of Interest
The authors declare no conflicts of interest.
Abbreviations
This manuscript uses the following abbreviations:
| Abbreviation | Definition |
| AP | Alkaline phosphatase |
| CLI | Colocalization Index |
| DLco | Diffusing capacity for carbon monoxide |
| EDTA | Ethylenediaminetetraacetic acid |
| FFAR2 | Free fatty acid receptor 2 |
| FFPE | Formalin-fixed, paraffin-embedded |
| f-ILD | Fibrotic interstitial lung disease |
| f-IIP | Fibrotic idiopathic interstitial pneumonia |
| FVC | Forced vital capacity |
| HIER | Heat-induced epitope retrieval |
| ILD | Interstitial lung disease |
| IIP | Idiopathic interstitial pneumonia |
| IPF | Idiopathic pulmonary fibrosis |
| JAC | Jaccard Index |
| KL-6 | Krebs von den Lungen-6 |
| MDD | Multidisciplinary discussion |
| MHI | Morisita-Horn Index |
| mIHC | Multiplex immunohistochemistry |
| mJAC | Modified Jaccard Index |
| NA | Numerical aperture |
| PO | Peroxidase |
| SCFA | Short-chain fatty acid |
| SD | Standard deviation |
| SP-D | Surfactant protein D |
| TBLC | Transbronchial cryobiopsy |
References
- Wijsenbeek, M.; Suzuki, A.; Maher, T.M. Interstitial Lung Diseases. Lancet 2022, 400, 769–786. [Google Scholar] [CrossRef]
- Invernizzi, R.; Barnett, J.; Rawal, B.; Nair, A.; Ghai, P.; Kingston, S.; Chua, F.; Wu, Z.; Wells, A.U.; Renzoni, E.R.; et al. Bacterial Burden in the Lower Airways Predicts Disease Progression in Idiopathic Pulmonary Fibrosis and Is Independent of Radiological Disease Extent. Eur. Respir. J. 2020, 55, 1901519. [Google Scholar] [CrossRef]
- Koh, A.; De Vadder, F.; Kovatcheva-Datchary, P.; Bäckhed, F. From Dietary Fiber to Host Physiology: Short-Chain Fatty Acids as Key Bacterial Metabolites. Cell 2016, 165, 1332–1345. [Google Scholar] [CrossRef]
- Dang, A.T.; Marsland, B.J. Microbes, Metabolites, and the Gut-Lung Axis. Mucosal Immunol. 2019, 12, 843–850. [Google Scholar] [CrossRef]
- Wynn, T.A.; Vannella, K.M. Macrophages in Tissue Repair, Regeneration, and Fibrosis. Immunity 2016, 44, 450–462. [Google Scholar] [CrossRef]
- Maslowski, K.M.; Vieira, A.T.; Ng, A.; Kranich, J.; Sierro, F.; Yu, D.; Schilter, H.C.; Rolph, M.S.; Mackay, F.; Artis, D.; et al. Regulation of Inflammatory Responses by Gut Microbiota and Chemoattractant Receptor GPR43. Nature 2009, 461, 1282–1286. [Google Scholar] [CrossRef]
- Macia, L.; Tan, J.; Vieira, A.T.; Leach, K.; Stanley, D.; Luong, S.; Maruya, M.; Ian McKenzie, C.; Hijikata, A.; Wong, C.; et al. Metabolite-Sensing Receptors GPR43 and GPR109A Facilitate Dietary Fibre-Induced Gut Homeostasis Through Regulation of the Inflammasome. Nat. Commun. 2015, 6, 6734. [Google Scholar] [CrossRef]
- Lee, H.Y.; Nam, S.; Kim, M.J.; Kim, S.J.; Back, S.H.; Yoo, H.J. Butyrate Prevents TGF-Β1-Induced Alveolar Myofibroblast Differentiation and Modulates Energy Metabolism. Metabolites 2021, 11, 258. [Google Scholar] [CrossRef]
- Park, H.J.; Jeong, O.-Y.; Chun, S.H.; Cheon, Y.H.; Kim, M.; Kim, S.; Lee, S.-I. Butyrate Improves Skin/Lung Fibrosis and Intestinal Dysbiosis in Bleomycin-Induced Mouse Models. Int. J. Mol. Sci. 2021, 22, 2765. [Google Scholar] [CrossRef]
- Raghu, G.; Remy-Jardin, M.; Richeldi, L.; Thomson, C.C.; Inoue, Y.; Johkoh, T.; Kreuter, M.; Lynch, D.A.; Maher, T.M.; Martinez, F.J.; et al. Idiopathic Pulmonary Fibrosis (an Update) and Progressive Pulmonary Fibrosis in Adults: An Official ATS/ERS/JRS/ALAT Clinical Practice Guideline. Am. J. Respir. Crit. Care Med. 2022, 205, e18–e47. [Google Scholar] [CrossRef]
- Stanojevic, S.; Kaminsky, D.A.; Miller, M.R.; Thompson, B.; Aliverti, A.; Barjaktarevic, I.; Cooper, B.G.; Culver, B.; Derom, E.; Hall, G.L.; et al. ERS/ATS Technical Standard on Interpretive Strategies for Routine Lung Function Tests. Eur. Respir. J. 2022, 60, 2101499. [Google Scholar] [CrossRef]
- Richeldi, L.; Ryerson, C.J.; Lee, J.S.; Wolters, P.J.; Koth, L.L.; Ley, B.; Elicker, B.M.; Jones, K.D.; King, T.E., Jr.; Ryu, J.H.; et al. Relative Versus Absolute Change in Forced Vital Capacity in Idiopathic Pulmonary Fibrosis. Thorax 2012, 67, 407–411. [Google Scholar] [CrossRef]
- Abe, T.; Yamashita, K.; Nagasaka, T.; Fujita, M.; Agawa, K.; Ando, M.; Mukoyama, T.; Yamada, K.; Miyake, S.; Saito, M.; et al. Deep Learning-Based Image Cytometry Using a Bit-Pattern Kernel-Filtering Algorithm to Avoid Multi-Counted Cell Determination. Anticancer Res. 2023, 43, 3755–3761. [Google Scholar] [CrossRef]
- Ohno, M.; Kuramitsu, S.; Yamashita, K.; Nagasaka, T.; Haimoto, S.; Fujita, M. Tumor-Infiltrating B Cells and Tissue-Resident Memory T Cells as Prognostic Indicators in Brain Metastases Derived from Gastrointestinal Cancers. Cancers 2024, 16, 3765. [Google Scholar] [CrossRef]
- Tachibana, T.; Nagasaka, T.; Adachi, Y.; Kagiyama, H.; Ito, R.; Fujita, M.; Yamashita, K.; Kakeji, Y. Reliability Assessment Framework Based on Feature Separability for Pathological Cell Image Classification under Prior Bias. Intell. Based Med. 2026, in press. [Google Scholar] [CrossRef]
- Yamashita, K.; Nagasaka, T.; Abe, T.; Adachi, Y.; Ito, R.; Tachibana, T.; Takahashi, T.; Kagiyama, H.; Imai, M.; Tsuneki, T.; et al. From Cell Counts to Cellular Interactions: Cu-Cyto and the Co-Localization Index as a Spatial Framework for the Tumor Immune Microenvironment of Rectal Cancer. Int. J. Clin. Oncol. 2026, in press. [Google Scholar] [CrossRef]
- Jaccard, P. THE DISTRIBUTION OF THE FLORA IN THE ALPINE ZONE.1. New Phytol. 1912, 11, 37–50. [Google Scholar] [CrossRef]
- Chao, A.; Chazdon, R.L.; Colwell, R.K.; Shen, T.-J. Abundance-Based Similarity Indices and Their Estimation When There Are Unseen Species in Samples. Biometrics 2006, 62, 361–371. [Google Scholar] [CrossRef]
- Horn, H.S. Measurement of “Overlap” in Comparative Ecological Studies. Am. Nat. 1966, 100, 419–424. [Google Scholar] [CrossRef]
- Maley, C.C.; Koelble, K.; Natrajan, R.; Aktipis, A.; Yuan, Y. An Ecological Measure of Immune-Cancer Colocalization as a Prognostic Factor for Breast Cancer. Breast Cancer Res. 2015, 17, 131. [Google Scholar] [CrossRef]
- Shiraishi, M.; Higashimoto, Y.; Sugiya, R.; Mizusawa, H.; Takeda, Y.; Noguchi, M.; Nishiyama, O.; Yamazaki, R.; Kudo, S.; Kimura, T.; et al. Diaphragmatic Excursion Is Associated with Longitudinal Changes in Erector Spinae Muscle in Patients with Chronic Obstructive Pulmonary Disease. Respir. Investig. 2026, 64, 101456. [Google Scholar] [CrossRef]
- Nonoyama, T.; Hanada, M.; Nishiyama, O.; Arizono, S.; Kataoka, K.; Nakazawa, A.; Yanagita, Y.; Morishita, T.; Morino, A.; Kawagoshi, A.; et al. Rehabilitative Intervention of Frailty for Patients with Chronic Respiratory Disease (REINFORCE Study): Research Protocol for a Multicentre, Randomised Controlled Trial. J. Thorac. Dis. 2026, 18, 533. [Google Scholar] [CrossRef]
- Le Poul, E.; Loison, C.; Struyf, S.; Springael, J.-Y.; Lannoy, V.; Decobecq, M.-E.; Brezillon, S.; Dupriez, V.; Vassart, G.; Van Damme, J.; et al. Functional Characterization of Human Receptors for Short Chain Fatty Acids and Their Role in Polymorphonuclear Cell Activation. J. Biol. Chem. 2003, 278, 25481–25489. [Google Scholar] [CrossRef]
- Kim, M.; Friesen, L.; Park, J.; Kim, H.M.; Kim, C.H. Microbial Metabolites, Short-Chain Fatty Acids, Restrain Tissue Bacterial Load, Chronic Inflammation, and Associated Cancer in the Colon of Mice. Eur. J. Immunol. 2018, 48, 1235–1247. [Google Scholar] [CrossRef]
- Göktürk, K.; Tülek, B.; Kanat, F.; Maçin, S.; Arslan, U.; Shahbazova, M.; Göktürk, Ö. Gut Microbiota Profiles of Patients with Idiopathic Pulmonary Fibrosis. Exp. Lung Res. 2024, 50, 278–289. [Google Scholar] [CrossRef]
- Mirković, B.; Murray, M.A.; Lavelle, G.M.; Molloy, K.; Azim, A.A.; Gunaratnam, C.; Healy, F.; Slattery, D.; McNally, P.; Hatch, J.; et al. The Role of Short-Chain Fatty Acids, Produced by Anaerobic Bacteria, in the Cystic Fibrosis Airway. Am. J. Respir. Crit. Care Med. 2015, 192, 1314–1324. [Google Scholar] [CrossRef]
- Tanabe, N.; Matsumoto, H.; Morimoto, C.; Hirai, T. Sputum Short-Chain Fatty Acids, Microbiome, Inflammation, and Mucus Plugging in Obstructive Airway Disease. J. Allergy Clin. Immunol. 2025, 155, 1675–1680. [Google Scholar] [CrossRef]
- Verma, A.; Bhagchandani, T.; Rai, A.; Nikita; Sardarni, U.K.; Bhavesh, N.S.; Gulati, S.; Malik, R.; Tandon, R. Short-Chain Fatty Acid (SCFA) as a Connecting Link Between Microbiota and Gut-Lung Axis-A Potential Therapeutic Intervention to Improve Lung Health. ACS Omega 2024, 9, 14648–14671. [Google Scholar] [CrossRef]
- Trompette, A.; Gollwitzer, E.S.; Yadava, K.; Sichelstiel, A.K.; Sprenger, N.; Ngom-Bru, C.; Blanchard, C.; Junt, T.; Nicod, L.P.; Harris, N.L.; et al. Gut Microbiota Metabolism of Dietary Fiber Influences Allergic Airway Disease and Hematopoiesis. Nat. Med. 2014, 20, 159–166. [Google Scholar] [CrossRef]
- Yamashita, M.; Saito, R.; Yasuhira, S.; Fukuda, Y.; Sasamo, H.; Sugai, T.; Yamauchi, K.; Maemondo, M. Distinct Profiles of CD163-Positive Macrophages in Idiopathic Interstitial Pneumonias. J. Immunol. Res. 2018, 2018, 1436236. [Google Scholar] [CrossRef]
- Misharin, A.V.; Morales-Nebreda, L.; Reyfman, P.A.; Cuda, C.M.; Walter, J.M.; McQuattie-Pimentel, A.C.; Chen, C.-I.; Anekalla, K.R.; Joshi, N.; Williams, K.J.N.; et al. Monocyte-Derived Alveolar Macrophages Drive Lung Fibrosis and Persist in the Lung over the Life Span. J. Exp. Med. 2017, 214, 2387–2404. [Google Scholar] [CrossRef]
- Willis, B.C.; Liebler, J.M.; Luby-Phelps, K.; Nicholson, A.G.; Crandall, E.D.; du Bois, R.M.; Borok, Z. Induction of Epithelial-Mesenchymal Transition in Alveolar Epithelial Cells by Transforming Growth Factor-Beta1: Potential Role in Idiopathic Pulmonary Fibrosis. Am. J. Pathol. 2005, 166, 1321–1332. [Google Scholar] [CrossRef]
- Sun, Y.; Xu, H.; Lu, T.; Li, T.; Wang, Y.; Fan, X.; Jiang, Y.; Cai, M.; He, P.; Liu, J. Progress in Understanding the Role and Therapeutic Targets of Polarized Subtypes of Macrophages in Pulmonary Fibrosis. Cell Biochem Biophys. 2023, 81, 673–682. [Google Scholar] [CrossRef]
- Richeldi, L.; Azuma, A.; Cottin, V.; Kreuter, M.; Maher, T.M.; Martinez, F.J.; Oldham, J.M.; Valenzuela, C.; Clerisme-Beaty, E.; Gordat, M.; et al. Nerandomilast in Patients with Idiopathic Pulmonary Fibrosis. N Engl. J. Med. 2025, 392, 2193–2202. [Google Scholar] [CrossRef]
Figure 1.
Spatial colocalization mapping of FFAR2-positive macrophages in lung tissues. Representative images from deep learning-based spatial analysis. (A) Standard Hematoxylin and Eosin (HE) staining of the lung biopsy specimen. (B) Spatial cell distribution map showing single-cell coordinates (Background). (C) High-magnification view of the sequential chromogenic double staining for FFAR2 (HistoGreen, green) and the pan-macrophage marker Iba1 (First Red II, red), with hematoxylin counterstain. Macrophages scored as FFAR2-positive carry both chromogens and therefore appear as dark brown to dark green cells, whereas Iba1-single-positive macrophages remain red. Arrows indicate representative FFAR2-positive (double-positive) macrophages. White and black arrowheads indicate stromal cells and alveolar epithelial cells, respectively. (D) Computerized colocalization mapping of the specific micro-anatomical proximity (CLI) between FFAR2-positive macrophages and stromal cells. (E) Computerized colocalization mapping of the specific micro-anatomical proximity (CLI) between FFAR2-positive macrophages and alveolar epithelium. The pseudocolor scale in panels (D) and (E) encodes the local CLI value: warm colors (red) mark hot spots of high colocalization, and cool colors (blue) indicate low colocalization. Scale bars = 1 mm in (A), (B), (D), and (E); 100 μm in (C).
Figure 1.
Spatial colocalization mapping of FFAR2-positive macrophages in lung tissues. Representative images from deep learning-based spatial analysis. (A) Standard Hematoxylin and Eosin (HE) staining of the lung biopsy specimen. (B) Spatial cell distribution map showing single-cell coordinates (Background). (C) High-magnification view of the sequential chromogenic double staining for FFAR2 (HistoGreen, green) and the pan-macrophage marker Iba1 (First Red II, red), with hematoxylin counterstain. Macrophages scored as FFAR2-positive carry both chromogens and therefore appear as dark brown to dark green cells, whereas Iba1-single-positive macrophages remain red. Arrows indicate representative FFAR2-positive (double-positive) macrophages. White and black arrowheads indicate stromal cells and alveolar epithelial cells, respectively. (D) Computerized colocalization mapping of the specific micro-anatomical proximity (CLI) between FFAR2-positive macrophages and stromal cells. (E) Computerized colocalization mapping of the specific micro-anatomical proximity (CLI) between FFAR2-positive macrophages and alveolar epithelium. The pseudocolor scale in panels (D) and (E) encodes the local CLI value: warm colors (red) mark hot spots of high colocalization, and cool colors (blue) indicate low colocalization. Scale bars = 1 mm in (A), (B), (D), and (E); 100 μm in (C).
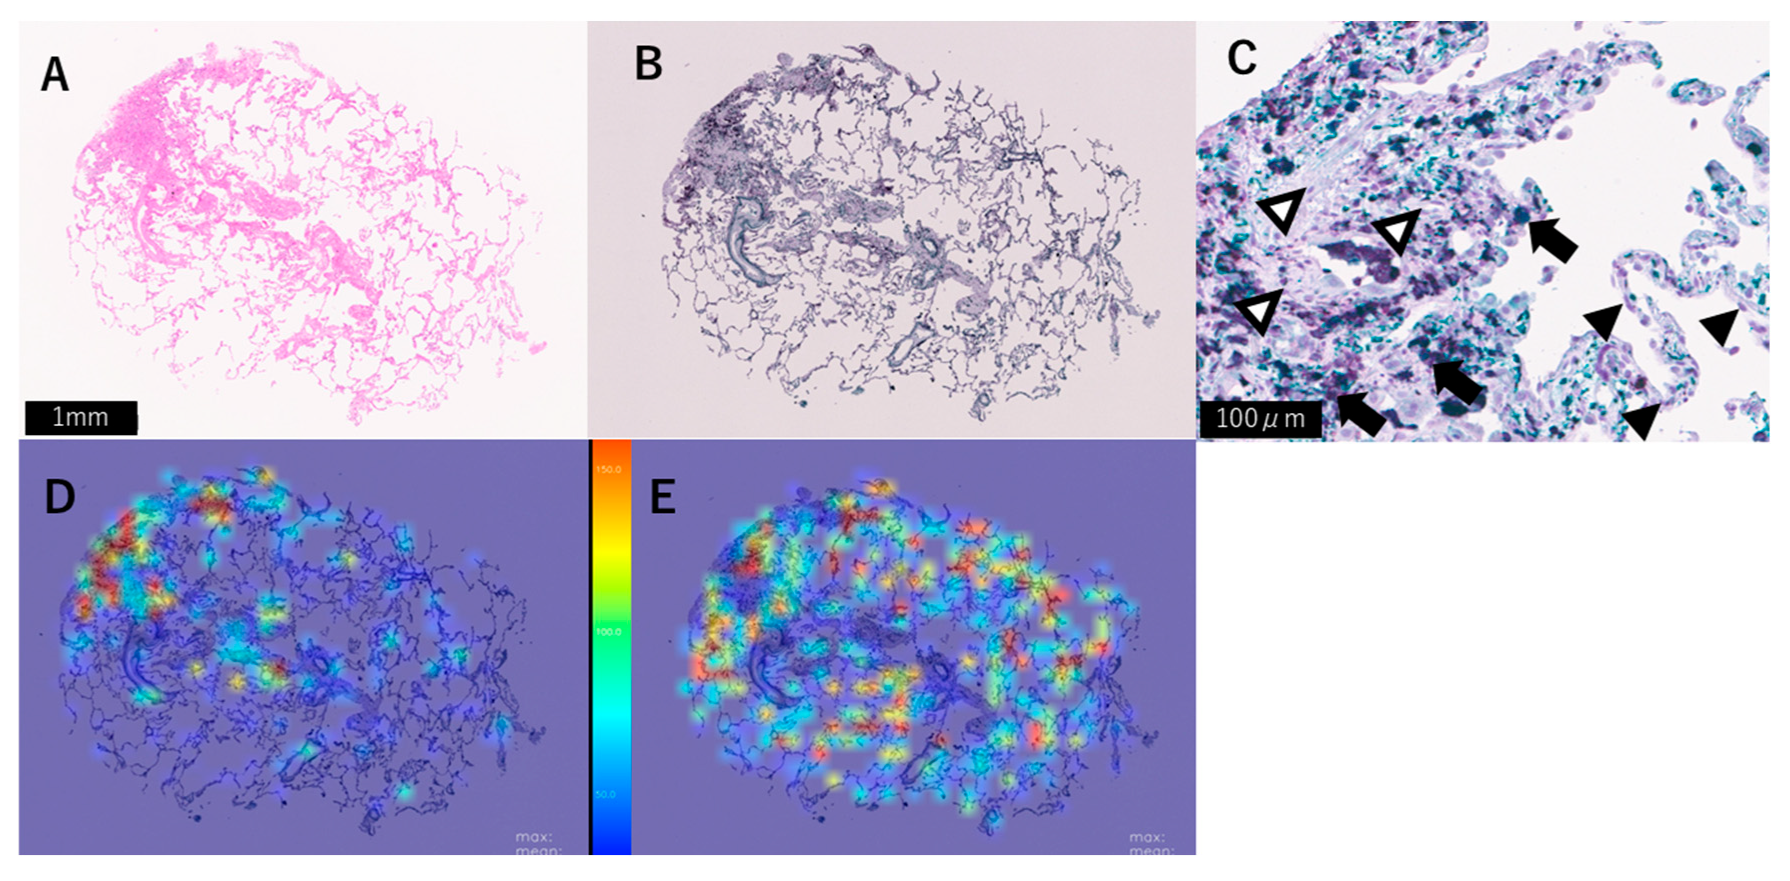
Figure 2.
Spatial colocalization mapping of CD163-positive macrophages in lung tissues. Representative images of the spatial analysis of CD163-positive macrophages. (A) Standard Hematoxylin and Eosin (HE) staining of the lung biopsy specimen. (B) Spatial cell distribution map showing single-cell coordinates (Background). (C) High-magnification view of the sequential chromogenic double staining for CD163 (HistoGreen, green) and the pan-macrophage marker Iba1 (First Red II, red), with hematoxylin counterstain. Macrophages scored as CD163-positive carry both chromogens and therefore appear as dark brown to dark green cells, whereas Iba1-single-positive macrophages remain red. Arrows indicate representative CD163-positive (double-positive) macrophages. White and black arrowheads indicate stromal cells and alveolar epithelial cells, respectively. (D) Computerized colocalization mapping (CLI) illustrating the spatial relationship of CD163-positive macrophages with stromal cells. (E) Computerized colocalization mapping (CLI) illustrating the spatial relationship of CD163-positive macrophages with alveolar epithelium. The pseudocolor scale in panels (D) and (E) encodes the local CLI value: warm colors (red) mark hot spots of high colocalization, and cool colors (blue) indicate low colocalization. Scale bars = 1 mm in (A), (B), (D), and (E); 100 μm in (C).
Figure 2.
Spatial colocalization mapping of CD163-positive macrophages in lung tissues. Representative images of the spatial analysis of CD163-positive macrophages. (A) Standard Hematoxylin and Eosin (HE) staining of the lung biopsy specimen. (B) Spatial cell distribution map showing single-cell coordinates (Background). (C) High-magnification view of the sequential chromogenic double staining for CD163 (HistoGreen, green) and the pan-macrophage marker Iba1 (First Red II, red), with hematoxylin counterstain. Macrophages scored as CD163-positive carry both chromogens and therefore appear as dark brown to dark green cells, whereas Iba1-single-positive macrophages remain red. Arrows indicate representative CD163-positive (double-positive) macrophages. White and black arrowheads indicate stromal cells and alveolar epithelial cells, respectively. (D) Computerized colocalization mapping (CLI) illustrating the spatial relationship of CD163-positive macrophages with stromal cells. (E) Computerized colocalization mapping (CLI) illustrating the spatial relationship of CD163-positive macrophages with alveolar epithelium. The pseudocolor scale in panels (D) and (E) encodes the local CLI value: warm colors (red) mark hot spots of high colocalization, and cool colors (blue) indicate low colocalization. Scale bars = 1 mm in (A), (B), (D), and (E); 100 μm in (C).
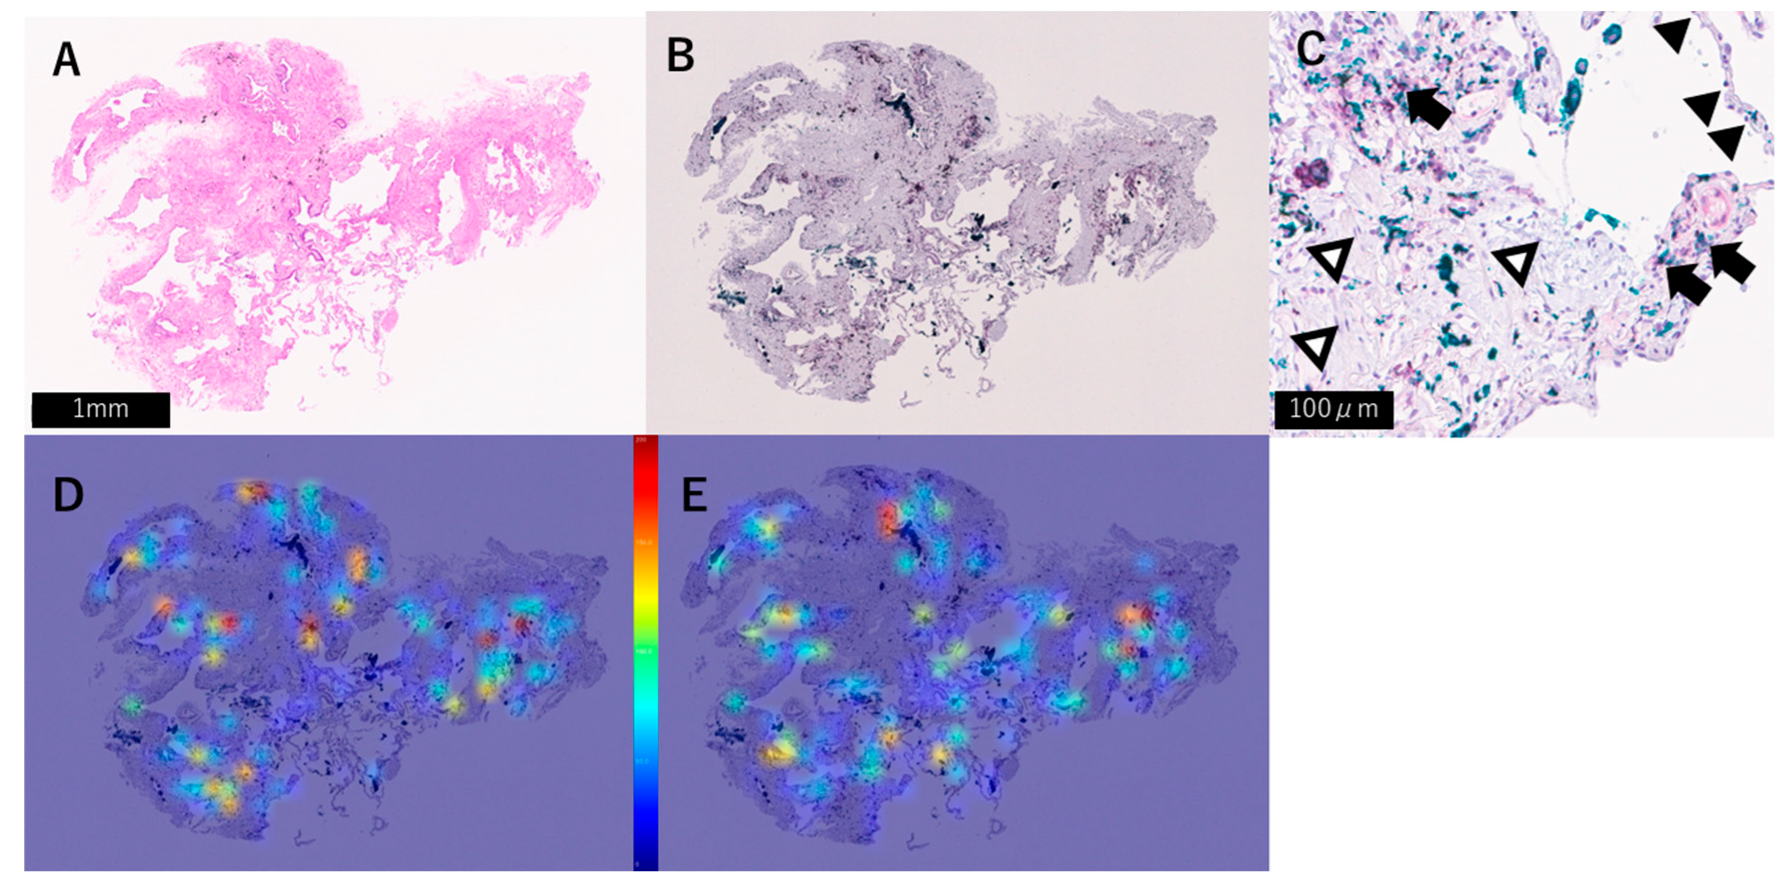
Figure 3.
FFAR2-positive macrophage proximity correlates with preserved lung function. Scatter plots of the relationships for the FFAR2 subset. (A) The relationship between the median CLI of FFAR2-positive macrophages with stromal cells and the 1-year change in %FVC. (B) The relationship between the median CLI of FFAR2-positive macrophages with alveolar epithelium and the 1-year change in %FVC. We determined statistical significance using Spearman’s rank correlation test ((A) , ; (B) , ).
Figure 3.
FFAR2-positive macrophage proximity correlates with preserved lung function. Scatter plots of the relationships for the FFAR2 subset. (A) The relationship between the median CLI of FFAR2-positive macrophages with stromal cells and the 1-year change in %FVC. (B) The relationship between the median CLI of FFAR2-positive macrophages with alveolar epithelium and the 1-year change in %FVC. We determined statistical significance using Spearman’s rank correlation test ((A) , ; (B) , ).
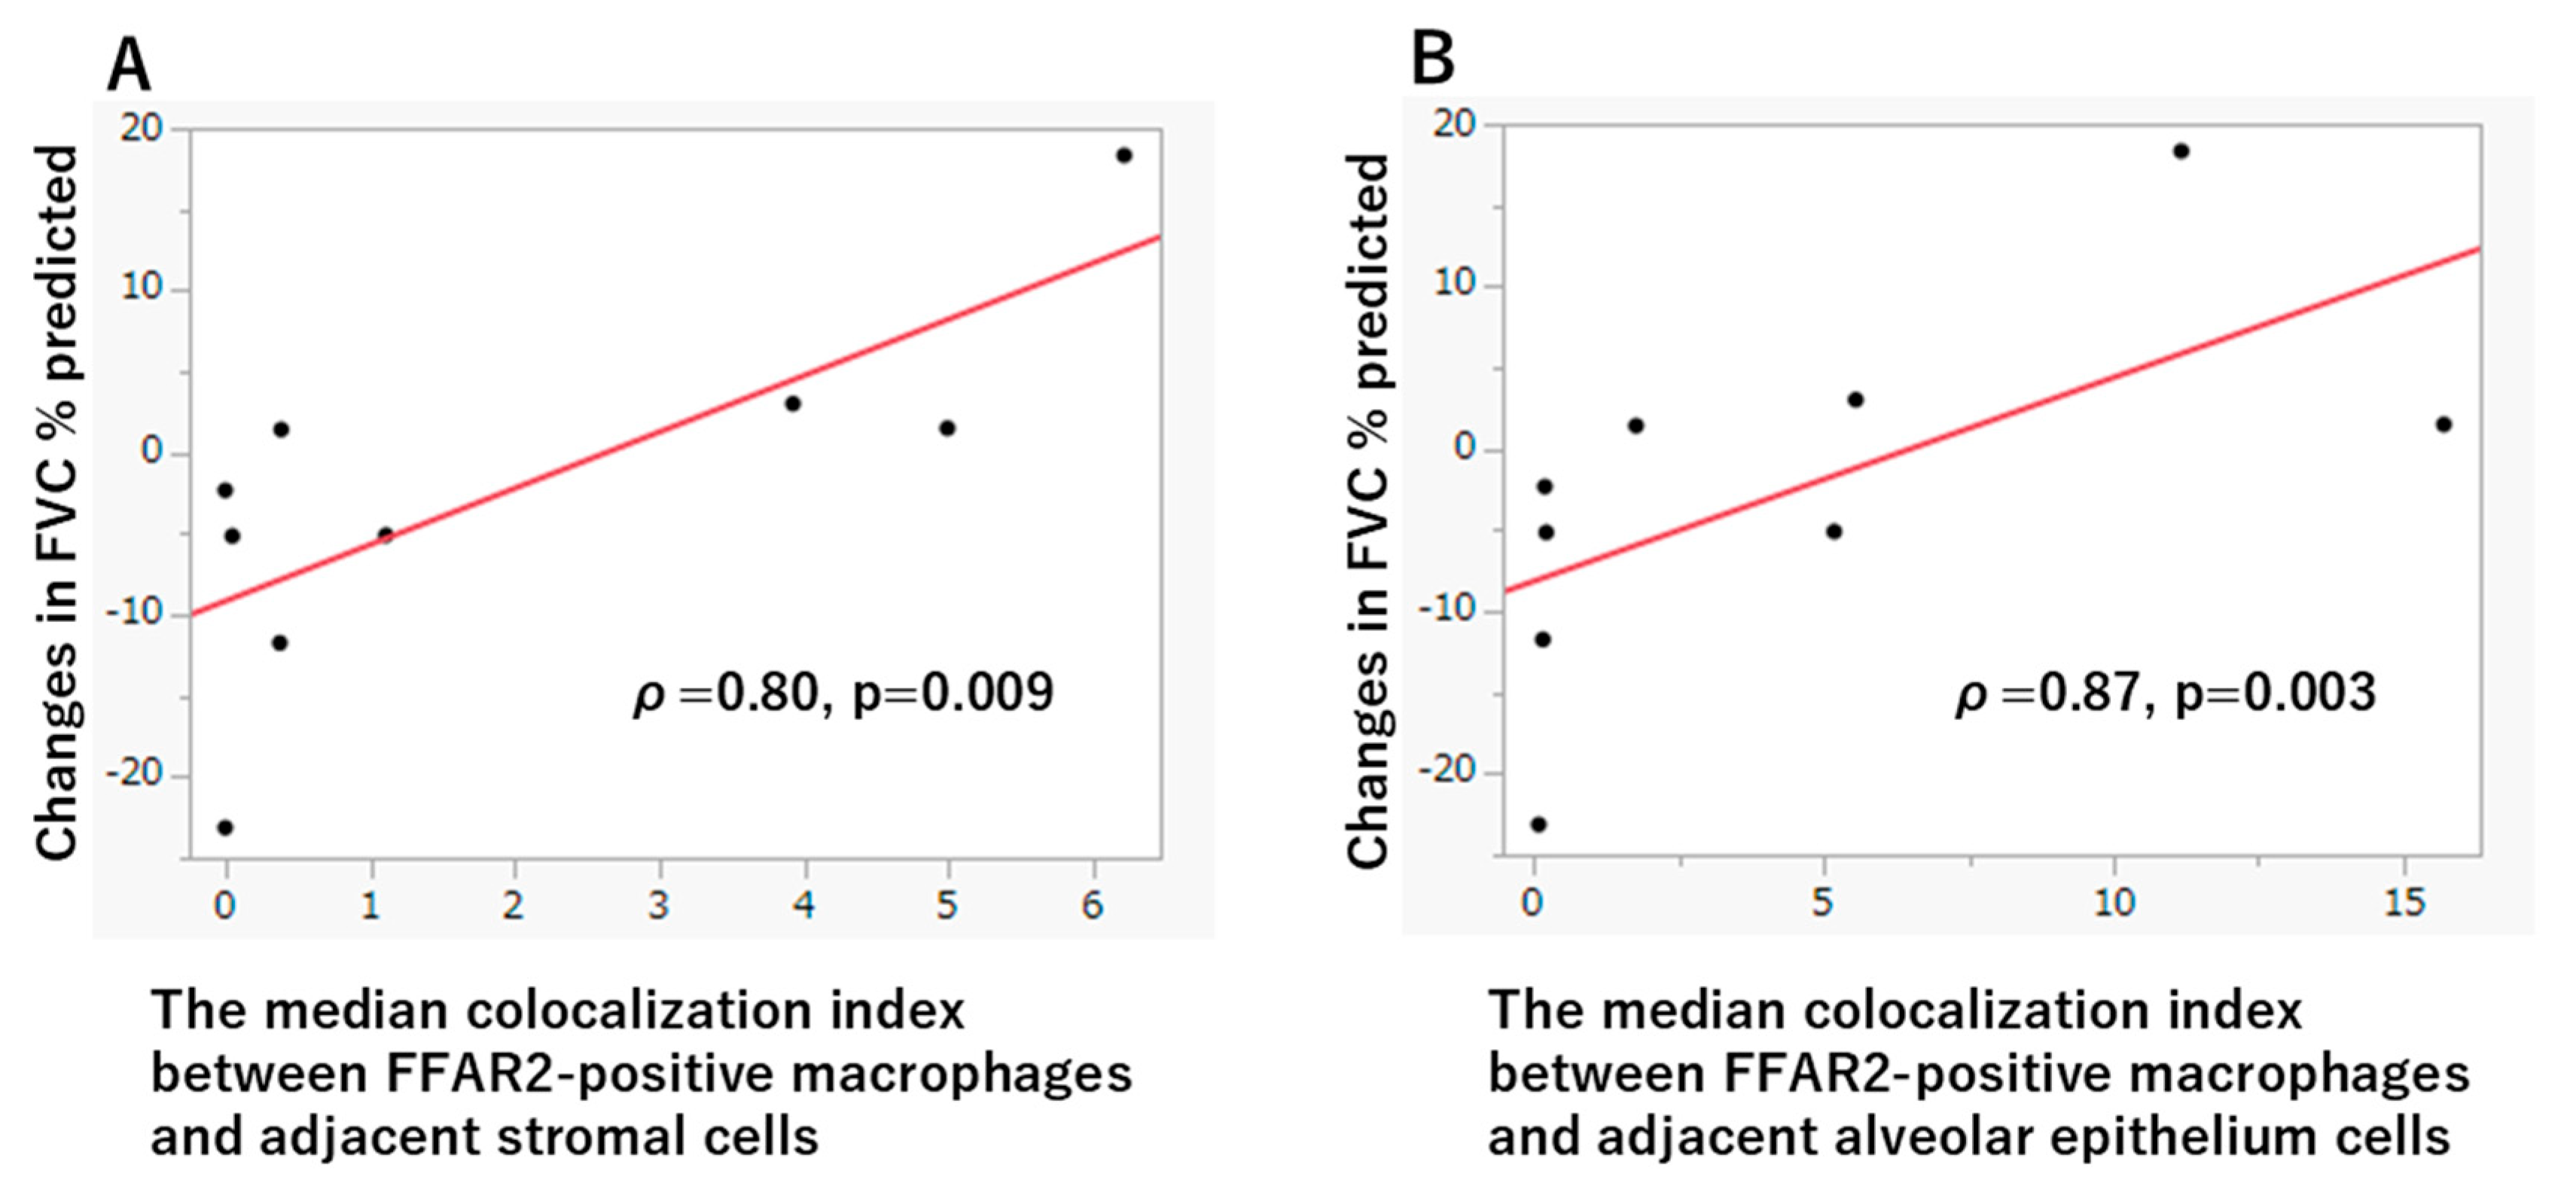
Figure 4.
CD163-positive macrophage proximity exhibits weak correlations with lung function changes. Scatter plots of the relationships for the CD163 subset. (A) The relationship between the median CLI of CD163-positive macrophages with stromal cells and the 1-year change in %FVC, which shows no significant correlation. (B) The relationship between the median CLI of CD163-positive macrophages with alveolar epithelium and the 1-year change in %FVC. We determined statistical significance using Spearman’s rank correlation test ((A) , ; (B) , ).
Figure 4.
CD163-positive macrophage proximity exhibits weak correlations with lung function changes. Scatter plots of the relationships for the CD163 subset. (A) The relationship between the median CLI of CD163-positive macrophages with stromal cells and the 1-year change in %FVC, which shows no significant correlation. (B) The relationship between the median CLI of CD163-positive macrophages with alveolar epithelium and the 1-year change in %FVC. We determined statistical significance using Spearman’s rank correlation test ((A) , ; (B) , ).
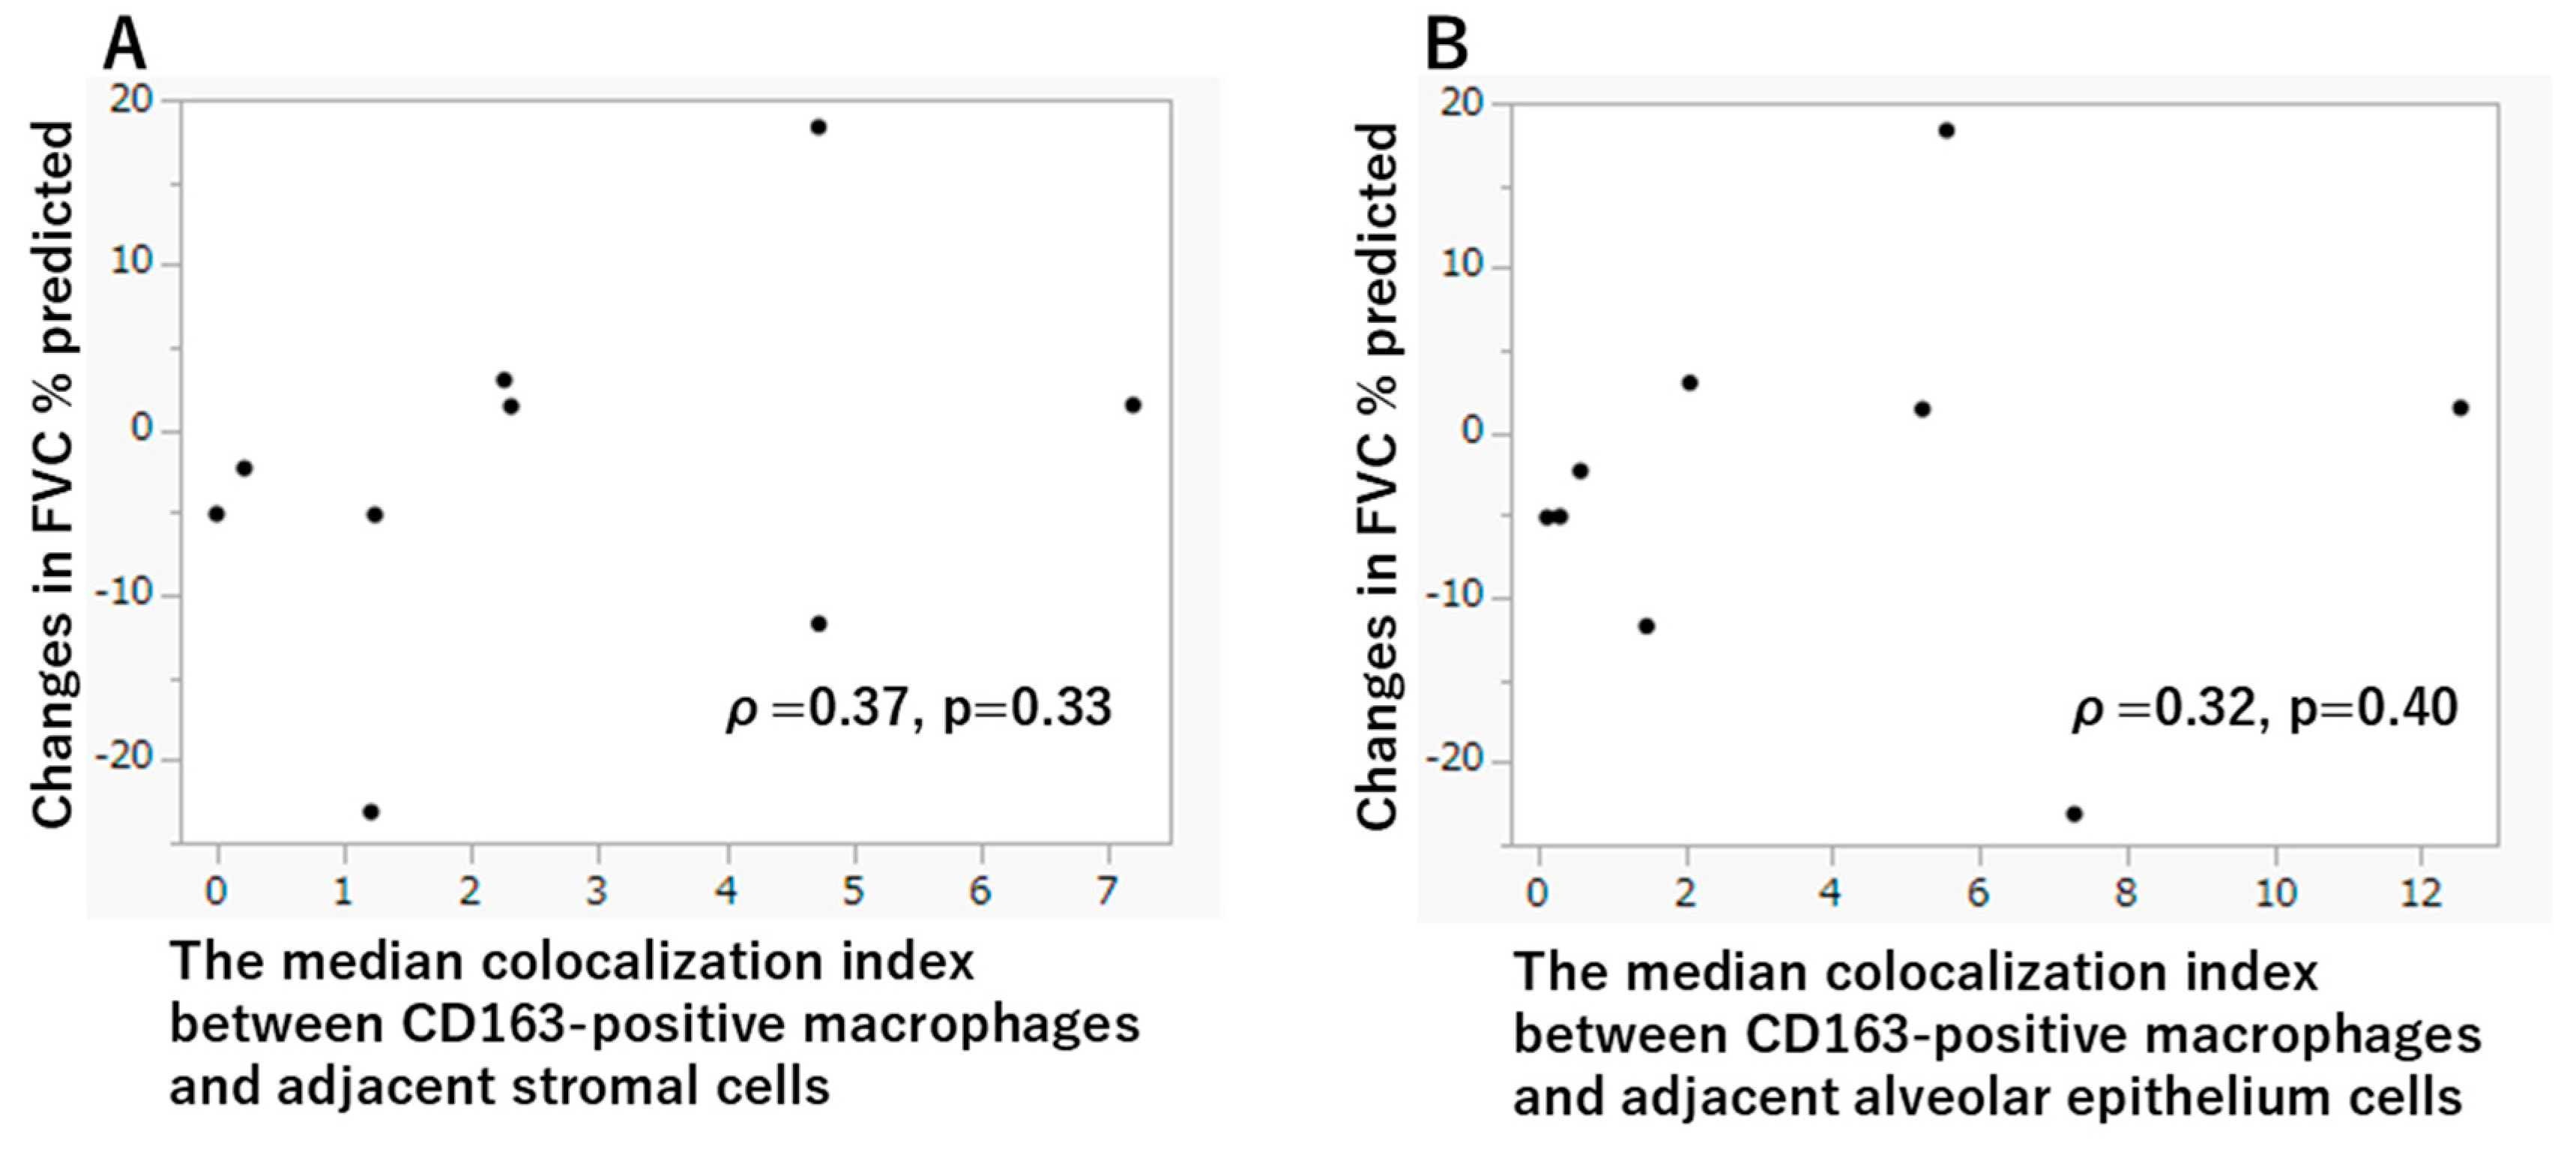

Table 1.
Baseline patient characteristics (n=10).
| Age | 71.0 ± 8.1 |
|---|---|
| M/F | 7/3 |
| ILD type | |
| IPF/unclassifiable IIP | 4/6 |
| FVC, L | 2.6 ± 0.6 |
| FVC, % | 82.2 ± 17.2 |
| DLco, mL/min/mmHg | 11.9 ± 2.1 |
| DLco, % | 72.5 ± 16.6 |
| KL-6, U/mL | 1125 ± 540 |
| SP-D, U/mL | 258 ± 152 |
| Change in FVC, % | -2.6 ± 10.7 |
| Change in %DLco | 0.1 ± 9.3 |
| Treatment | |
| Nintedanib | 4 |
| Nerandmilast | 2 |
| Prednisolone | 1 |
| Prednisolone plus Tacrolimus | 1 |
| None | 2 |
Table 2.
Spatial colocalization indices for FFAR2- and CD163-positive macrophages (n=10).
| With FFAR2 positive macrophages | With CD163 positive macrophages | |||
|---|---|---|---|---|
| Variables | Stromal cells | Alveolar cells | Stromal cells | Alveolar cells |
| CLI Median | 0.38 (0.04 – 4.19) | 1.04 (0.17 – 6.96) | 1.75 (0.30 – 4.73) | 1.77 (0.25 – 5.98) |
| mJAC Median | 0.14 (0 – 0.28) | 0.11 (0.03 – 0.29) | 0.30(0.08 – 0.41) | 0.19 (0.03 – 0.27) |
| MHI Median | 0.21 (0 – 0.35) | 0.14 (0.05 – 0.33) | 0.41 (0.14 – 0.51) | 0.26 (0.04 – 0.37) |
Table 3.
Correlation of FFAR2-positive macrophage spatial niches with physiological variables.
| Colocalization analysis | FVC | DLco | Change in FVC | Changes in DLco |
|---|---|---|---|---|
| value | (% predicted) | (% predicted) | (%) | (%) |
| With stromal cells | ||||
| CLI median | -0.13 (0.71) | -0.40 (0.25) | 0.80 (0.009)** | 0.83 (0.01)* |
| mJAC median | -0.12 (0.77) | -0.41 (0.24) | 0.81 (0.008)** | 0.83 (0.01)* |
| MHI median | -0.10 (0.77) | -0.35 (0.32) | 0.81 (0.008)** | 0.83 (0.01)* |
| With alveolar epithelium | ||||
| CLI median | 0.04 (0.91) | -0.07 (0.86) | 0.87 (0.003)** | 0.64 (0.09) |
| mJAC median | -0.11 (0.76) | -0.27 (0.44) | 0.79 (0.01)* | 0.71 (0.047)* |
| MHI median | -0.09 (0.79) | -0.23 (0.32) | 0.79 (0.01)* | 0.71 (0.047)* |
| With stromal cells | ||||
| and alveolar epithelium | ||||
| CLI median | -0.10 (0.77) | -0.33 (0.36) | 0.81 (0.01)** | 0.83 (0.01)* |
Table 4.
Correlation of CD163-positive macrophage spatial niches with physiological variables.
| Variables | FVC | DLco | Change in FVC | Changes in DLco |
|---|---|---|---|---|
| (% predicted) | (% predicted) | (%) | (%) | |
| With stromal cells | ||||
| CLI median | -0.44 (0.56) | -0.58 (0.14) | 0.37 (0.55) | 0.55 (0.12) |
| mJAC median | -0.44 (0.20) | -0.60 (0.07) | 0.33 (0.38) | 0.55 (0.16) |
| MHI median | -0.44 (0.20) | -0.60 (0.07) | 0.33 (0.38) | 0.55 (0.16) |
| With alveolar epithelium | ||||
| CLI median | -0.45 (0.15) | -0.50 (0.14) | 0.32 (0.41) | 0.76 (0.03)* |
| mJAC median | -0.47 (0.17) | -0.51 (0.13) | 0.45 (0.22) | 0.76 (0.03)* |
| MHI median | -0.49 (0.15) | -0.50 (0.14) | 0.33 (0.41) | 0.76 (0.03)* |
| With stromal cells | ||||
| and alveolar epithelium | ||||
| CLI median | -0.60 (0.07) | -0.55 (0.10) | 0.38 (0.32) | 0.71 (0.045)* |
Disclaimer/Publisher’s Note: The statements, opinions and data contained in all publications are solely those of the individual author(s) and contributor(s) and not of MDPI and/or the editor(s). MDPI and/or the editor(s) disclaim responsibility for any injury to people or property resulting from any ideas, methods, instructions or products referred to in the content. |
© 2026 by the authors. Licensee MDPI, Basel, Switzerland. This article is an open access article distributed under the terms and conditions of the Creative Commons Attribution (CC BY) license (http://creativecommons.org/licenses/by/4.0/).
Copyright: This open access article is published under a Creative Commons CC BY 4.0 license, which permit the free download, distribution, and reuse, provided that the author and preprint are cited in any reuse.