

Submitted:
09 September 2026
Posted:
11 September 2026
You are already at the latest version
Abstract
India has not held a decennial census since 2011, leaving the 2015–2025 decade without a population count against which claims of small-town urbanisation can be verified. This study tests whether such growth is empirically demonstrable along a sixty-kilometre stretch of National Highway 63 in Jagtial district, Telangana, covering three corridor towns: Jagtial, Korutla and Metpally. Sentinel-2A and LISS-4 imagery for December 2015, 2020 and 2025 were segmented using Large Scale Mean Shift and classified with nine independently trained Random Forest models, achieving overall accuracies of 72.73 to 90.59 per cent. Results were cross-checked against electricity, motor-vehicle and beedi-establishment records sharing no error structure with the imagery. Built-up area grew 80.2 per cent at Jagtial, 62.6 per cent at Korutla and 31.5 per cent at Metpally between 2015 and 2025, a gradient tracking administrative rank rather than a corridor-wide wave; Korutla combines the fastest growth in service connections and load intensity with the weakest formal streetlight-network expansion, consistent with its home-based beedi cottage-industry base. An XGBoost-anchored trend model extends the built-up, electricity and vehicle series to 2040, corroborated by the Union Cabinet's June 2026 approval of highway widening for the corridor, expressly justified by congestion from this built-up growth.
Keywords:
corridor urbanisation
; NH-63
; random forest classification
; land use and land cover change
; administrative data validation
; densification
; beedi cottage industry
; urban growth forecasting
; Telangana
1. Introduction
Urbanisation in India is conventionally tracked through the decennial census, an instrument unavailable for fifteen years: the 2021 census was postponed after the onset of COVID-19, the first such postponement since 1872, and its replacement was notified only in June 2025, with enumeration scheduled for early 2027 (Ministry of Home Affairs 2025). The 2015–2025 decade, arguably the most transformative for India’s secondary urban system, therefore contains no population count, and any claim of rapid small-town urbanisation during it must rest on proxy measurement.
Remote sensing offers the most tractable proxy, but satellite-derived built-up area is blind to vertical growth and sensitive to spectral confusion between impervious surface and bright bare soils (Bhatta 2010). Studies reporting built-up growth from a single classified series, validated only against the classifier’s own training data, carry a structural vulnerability: the classifier’s error behaviour determines whether the reported growth is real. Corroboration from non-spatial administrative data, collected for unrelated purposes and unable to share the classifier’s error structure, is this study’s central methodological contribution rather than an afterthought.
A substantial literature identifies the road corridor as the relevant unit of contemporary Indian urbanisation. Maparu and Mazumder (2017) find a causal link between transport infrastructure and urbanisation in India over 1990–2011; Balakrishnan (2019) describes corridors as the dominant spatial form of recent Indian urban transformation; Basu, Das and Pereira (2023) show road proximity becoming a progressively stronger predictor of new built-up development, and Sheladiya and Patel (2023) rank it among the leading drivers of city expansion. Van Duijne and Nijman (2019) and Denis and Zerah (2017) show that considerable growth in ordinary towns goes unnoticed in official hierarchies. Highways, the consistent finding runs, organise where growth occurs, not merely serve it.
National Highway 63 passes through Jagtial district along Armoor, Metpally, Korutla, Jagtial, Dharmapuri and Mancherial (National Highways Authority of India 2024). Metpally, Korutla and Jagtial lie within sixty kilometres of one another under the same utility and district administration, sharing soil type and cropping calendar, but differ in administrative rank and dominant economic sector: Jagtial is the district headquarters, Korutla the beedi manufacturing hub, and Metpally the market town nearest Armoor. Jagtial district itself was constituted only on 11 October 2016 (Telangana Government 2016), so district-level records begin no earlier than that date. On 3 June 2026, during preparation of this study, the Union Cabinet approved four-laning of the Armoor–Jagtial–Mancherial section of NH-63, justified by congestion from built-up growth at Korutla and Jagtial (Press Information Bureau 2026), an independent, external corroboration of the transformation measured here.
2. Objectives
The study pursues six linked objectives: to quantify built-up change at the three towns between 2015 and 2025 using object-based random forest classification, characterising accuracy and error direction for each town and epoch; to test the classified trajectory against three independent administrative data families — electricity, motor-vehicle and cottage-industry registrations; to quantify the accompanying land-use transition and its statistical relationship with built-up expansion; to distinguish horizontal expansion from internal densification using footprint growth against load intensification; to project built-up extent and the corroborating series to 2030, 2035 and 2040; and to translate the findings into planning recommendations for the approved four-laning of the corridor.
3. Research Methodology
3.1. Study Area
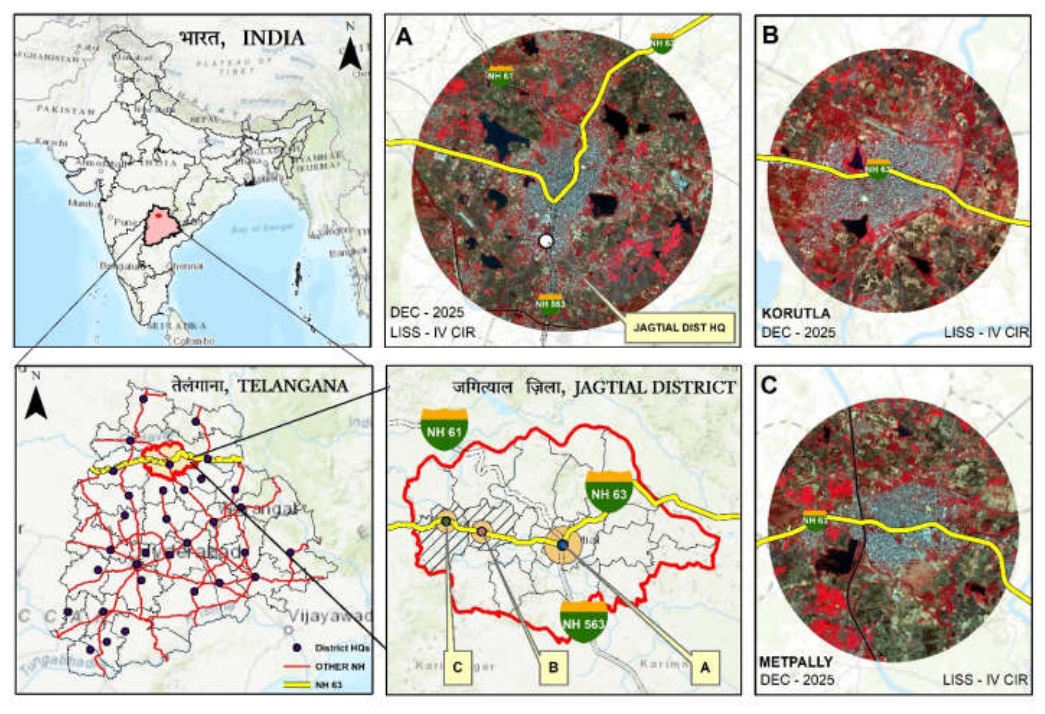
The three study units are the urban areas of Jagtial, Korutla and Metpally, Jagtial district, Telangana, all sited directly on NH-63 at roughly twenty-kilometre intervals. Each town’s analysis extent is a circular buffer centred on the town centre, radius five kilometres for Jagtial and three for Korutla and Metpally, giving fixed extents of 78.54 and 26.71 sq km respectively, invariant across all three epochs for valid cross-year comparison, in the WGS 84/UTM Zone 44N coordinate system. Jagtial is the administrative centre, Korutla the cottage-industry hub and Metpally the outer market town; Korutla was the larger settlement at the 2011 Census, so administrative rank and demographic weight are not aligned in this corridor.
Figure 1.
Study area map. Jagtial, Korutla and Metpally along the NH-63 corridor in Jagtial district, Telangana, with the fixed analysis extents used for all three epochs. (A), (B) and (C) show colour-infrared composites of Jagtial, Korutla and Metpally with five, three and three kilometres of buffer radius respectively; the thick yellow line is NH-63. Source: Authors’ compilation.
Figure 1.
Study area map. Jagtial, Korutla and Metpally along the NH-63 corridor in Jagtial district, Telangana, with the fixed analysis extents used for all three epochs. (A), (B) and (C) show colour-infrared composites of Jagtial, Korutla and Metpally with five, three and three kilometres of buffer radius respectively; the thick yellow line is NH-63. Source: Authors’ compilation.
3.2. Satellite Data Acquisition
Sentinel-2A multispectral imagery (10 m resolution in the visible/near-infrared bands, 20 m in the shortwave infrared bands) and LISS-4 imagery (5 m resolution in the green, red and near-infrared bands) were acquired for December 2015, 2020 and 2025. LISS-4 supported the primary object-based segmentation, while Sentinel-2A’s shortwave infrared bands enabled built-up and bare-soil indices unavailable from LISS-4 alone. December acquisition was held constant across years to preserve the post-kharif, pre-rabi phenological window, avoiding confounding of agricultural and bare-soil classes by crop-cycle timing. Both sensors were geometrically corrected, co-registered to a common grid for each epoch, and atmospherically corrected before index computation.
Figure 2.
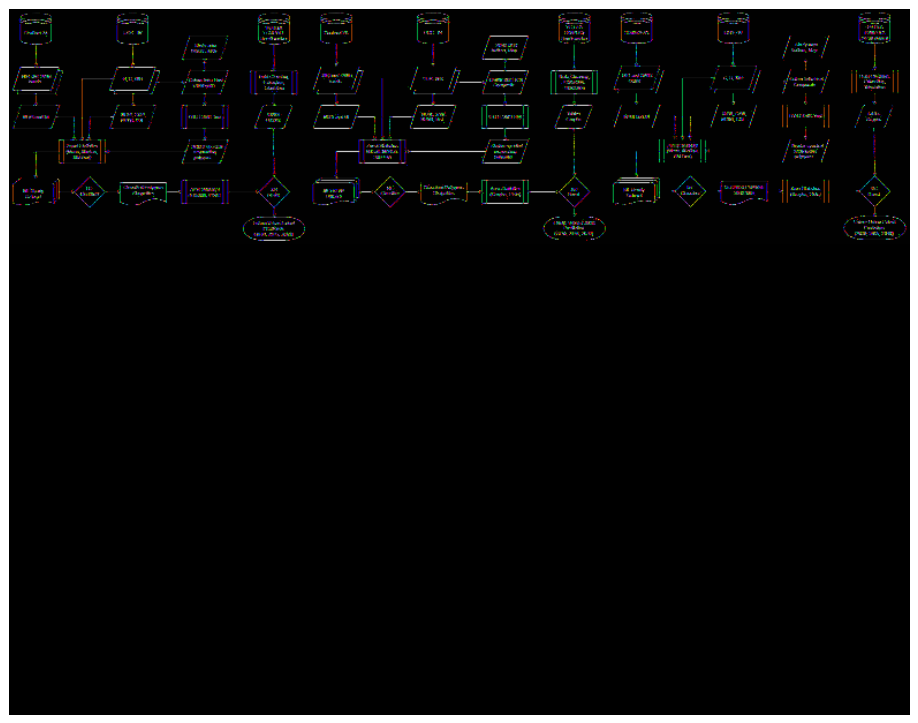
Methodology flowchart indicating the steps followed to accomplish future urban-extent prediction. Source: Authors’ compilation.
Figure 2.
Methodology flowchart indicating the steps followed to accomplish future urban-extent prediction. Source: Authors’ compilation.
3.3. Band Extraction and Spectral Index Computation
Bands were extracted and clipped to each buffer extent. Six spectral indices were computed following established formulations (Table 2): the Normalised Difference Vegetation Index (Rouse et al. 1974) and Soil-Adjusted Vegetation Index (Huete 1988) for vegetation; the Normalised Difference Water Index (McFeeters 1996) for open water; the Bare Soil Index (Rikimaru, Roy and Miyatake 2002) for exposed soil; and the Normalised Difference Built-up Index (Zha, Gao and Ni 2003) and Urban Index (Kawamura, Jayamana and Tsujiko 1996), from Sentinel-2A shortwave infrared bands, for impervious surface. LISS-4 bands supplied per-polygon reflectance statistics and false-colour composites for training-sample interpretation. All six were retained as classifier features rather than hard thresholds, since values in this semi-arid, mixed-use landscape cluster well inside their theoretical bounds.
3.4. Object-Based Segmentation Using LSMS
Object-based analysis was chosen over pixel-based classification to suppress salt-and-pepper noise in heterogeneous semi-arid terrain and to ensure each classified entity corresponds to a meaningful ground unit. The Large Scale Mean Shift algorithm of the Orfeo Toolbox, run through its QGIS plugin, was applied to the LISS-4 false-colour composite for each town and year, combining mean-shift filtering with region-growing to merge adjacent similar pixels into polygons. Identical parameters were used across all town-year combinations for comparable granularity. The resulting polygon layers, clipped to the analysis extents, contained between 5,099 and 20,608 objects per town per year (Figure 3 and Figure 4).
3.5. Feature Extraction into the Attribute Table
The six indices and three LISS-4 bands were summarised per polygon by zonal statistics (mean, median, standard deviation), yielding twenty-seven predictor attributes per polygon written directly into the shapefile attribute table to form the analysis-ready dataset for each town and year.
3.6. Classification Scheme and Training Samples
Seven land-cover classes were defined: Water Body, Agriculture (Active), Agriculture (Fallow), Bare Soil/Quarry, Built-up, Vegetation, and Wet/Black Soil. A dedicated Wet/Black Soil class was essential because dry Vertisol closely mimics concrete and asphalt reflectance; separating it was the principal control on spectral confusion with built-up. Training samples were assigned by visually inspecting segmentation polygons and labelling those clearly representing a single class directly in the attribute table, without digitising new polygons, using the LISS-4 false-colour composite as primary reference, supplemented by Sentinel-2A composites and Google Earth Pro high-resolution imagery for verification.
3.7. Random Forest Classification and Accuracy Assessment
Classification used the Random Forest ensemble (Breiman 2001) implemented in scikit-learn (Pedregosa et al. 2011): 500 trees, square-root maximum features, unrestricted depth, bootstrap sampling with out-of-bag scoring, and balanced class weighting. Each town and epoch was classified by its own independently trained model, labelled polygons split seventy-thirty into training and test partitions by stratified random sampling, with no training data transferred between towns, producing nine independently trained and validated classifications. Accuracy was assessed on the thirty per cent hold-out, reporting overall accuracy, Cohen kappa (interpreted per Landis and Koch 1977), producer’s and user’s accuracy, F1 score, a confusion matrix, and five-fold cross-validation; both Gini and permutation importance were computed for the twenty-seven predictors.
3.8. Post-Classification Processing and Area Derivation
The classified shapefile for each town and epoch was dissolved by class in QGIS to produce seven dissolved polygons representing the total extent of each class (Figure 5). Class areas in square kilometres were compiled alongside the non-spatial series, and the three epoch extents for each town were verified to sum to the same total mapped area before any result was interpreted, with residual variation below 0.001 per cent attributable to floating-point rounding.
3.9. Non-Spatial Data
Three non-spatial data families were compiled from the Telangana Open Data Portal: electricity records from the Northern Power Distribution Company of Telangana, covering connections, units consumed and sanctioned load by sector, continuously from 2019 to 2025; vehicle-registration records for the Jagtial and Korutla registering offices by fuel and wheel type over the same span, Metpally having no dedicated office and falling under the Jagtial district office; and beedi-establishment records under the Beedi and Cigar Workers (Conditions of Employment) Act for 2023–2025, used to compare industrial structure across towns rather than to assert a trend.
3.10. Derived Metrics
Five derived quantities carry the interpretive weight: class share of mapped extent; the compound annual growth rate; load intensity, that is, sanctioned load divided by connections, the principal discriminator between horizontal expansion and internal densification; the commercial-to-domestic connection ratio, indexing tertiarisation; and the ratio of four-wheeler to tractor/agricultural-vehicle registrations, indexing the agrarian-to-urban transition in household asset preference.
3.11. Forecasting to 2030, 2035 and 2040
Three indicator families — land-cover shares, electricity consumption and vehicle registrations — were extended to 2030, 2035 and 2040 using a two-layer hybrid. A gradient-boosted tree ensemble (XGBoost; Chen and Guestrin 2016), trained on historical rows pooled across towns, produced a smoothed anchor value at 2025, damping single-year noise; since tree ensembles cannot extrapolate beyond their training years, a second, per-series layer supplies the future trend. For land-cover classes, a linear trend in logit(share) is fitted to the three historical points, projected forward from the anchor, and renormalised across all seven classes to sum to 100 per cent; the logit transform lets a share approach 0 or 100 per cent asymptotically rather than overshooting, avoiding an artificial floor. This is the lowest-confidence forecast, resting on only three historical anchors per town. For electricity and vehicles, seven historical anchors (2019–2025) support a compound annual growth rate from log-linear regression, applied with damped-trend extrapolation (Gardner and McKenzie 1985): each year beyond 2025 receives the fitted rate multiplied by 0.85 raised to its distance from 2025, avoiding the implausible compounding a trial with plain exponential growth produced. Metpally has no vehicle forecast (Section 3.9). In-sample XGBoost R2 was 0.662 for land-cover share and 0.997–1.000 for electricity and vehicles, describing historical fit rather than forecast accuracy.
3.12. Use of AI-Assisted Tools
A generative artificial intelligence tool (Claude, Anthropic) was used during preparation of this manuscript to assist with language editing to British English, formatting to journal style, and independent verification of reported statistics against the underlying datasets described in Section 4. The tool was not used to generate the study’s analytical findings, interpretations, or conclusions, which are the authors’ own. The authors reviewed all AI-assisted edits and take full responsibility for the accuracy and integrity of the final text.
4. Data Used
Table 1 summarises the datasets compiled for the study.
5. Results
5.1. Classifier Performance and the Direction of Error
Nine independently trained classifications were assessed (Table 3). Overall accuracy ranges from 72.73 to 90.59 per cent and Cohen kappa from 0.680 to 0.883; eight of nine fall in the almost-perfect agreement band of the Landis and Koch (1977) scale, and one, Korutla 2015, in the substantial band, with cross-validated scores tracking hold-out accuracies closely, indicating no material overfitting (Figure 6). Built-up was consistently the best-classified category (F1: 0.874–1.000); Bare Soil/Quarry was consistently weakest, reflecting the spectral proximity of dry Vertisol to impervious surface. The residual error favours this study’s central claim: across the Jagtial and Metpally 2025 models, the classifier omits more built-up than it commits, so the growth figures reported below are conservative rather than inflated. Feature importance is dominated by water and vegetation indices in every model, ahead of the shortwave-infrared ratios.
5.2. Built-Up Expansion
Built-up area increased in all three towns with a consistent rank order (Table 4). Jagtial grew 80.2 per cent, from 6.06 to 10.93 sq km, lifting its share of mapped extent from 7.7 to 13.9 per cent. Korutla grew 62.6 per cent, from 2.54 to 4.13 sq km, reaching the highest built-up share of the three towns by 2025 (15.5 per cent) despite the smallest extent. Metpally grew least, 31.5 per cent, from 2.65 to 3.48 sq km (Figure 7). All three towns grew fastest before 2020, with the partial exception of Metpally, whose growth mildly accelerated in the second half-decade. Growth intensity ranks Jagtial above Korutla above Metpally in every window except 2020–25, where Korutla’s 24.6 per cent narrowly exceeds Jagtial’s 22.4 per cent, a rank-ordered gradient tracking administrative role rather than a travelling wave (Section 6).
5.3. Land-Use Transition
Built-up growth is part of a wider transition in which the three towns diverge (Table 5). At Jagtial, agriculture fell 67.6 per cent and bare soil 73.7 per cent, the classic signature of cropland and waste ground yielding to built-up, vegetation and Wet/Black Soil. Metpally shows the same direction at smaller magnitude. Korutla does not fit this pattern: bare soil/quarry collapsed 95.5 per cent, the sharpest of the three towns, but combined agriculture rose 33.1 per cent, driven by a more than threefold rise in Agriculture (Active), implying Korutla’s urbanisation drew disproportionately on bare, fallow and quarried ground rather than productive cropland, while some fringe land was simultaneously brought into cultivation (Figure 8). Water body rose at Jagtial and fell at Korutla and Metpally between the 2015 and 2025 endpoints, but all three show a non-monotonic path through 2020, read as seasonal irrigation-tank variation, so comparisons are drawn only between the endpoints. Vegetation and Wet/Black Soil expanded in every town, partly genuine plantation conversion but also exposed to residual phenological variation, and are reported descriptively rather than causally.
5.4. Electricity: Connections, Consumption, Load and Sectoral Composition
The electricity series is the strongest non-spatial dataset, with seven continuous annual observations across four sectors and no dependency on the classification (Table 6). Service connections grew 19.4 per cent at Jagtial, 26.1 at Korutla and 23.4 at Metpally over six years, and load per connection rose 45.7, 58.4 and 74.5 per cent respectively, the closest available proxy for internal intensification of the built environment (Figure 9). Commercial connections outgrew domestic connections in all three towns, and commercial consumption grew 33 to 44 per cent, evidencing tertiarisation: local economies adding shops and services faster than homes. Industrial consumption fell 18.8 to 32.4 per cent, while at Korutla industrial connections rose even as industrial consumption fell, consistent with more, smaller service points each drawing less power. Streetlight connections, a direct index of municipal road-network extension, grew 7.6 per cent per annum at Jagtial and 8.6 at Metpally, both at or above their own built-up CAGR, but only 0.2 per cent per annum at Korutla, whose built-up CAGR of 4.98 per cent is more than twenty times its streetlight growth.
5.5. Beedi Manufacture and Cottage-Industry Structure
Cross-sectional comparison of beedi registrations for 2023–2025 reveals a structural difference the satellite and electricity data alone could not resolve (Table 7). Korutla accounts for fifty-four per cent of the corridor’s registered beedi workforce across nine firms, against three at Jagtial and four at Metpally (Figure 10). Beedi rolling is home-based piece work; the registered establishment is a collection centre, while production occurs in workers’ dwellings, so a town built on this system accumulates dwellings within walking distance of collection points, generates domestic, not industrial, demand, and has little reason to extend the formal street-lighting network as its footprint grows, matching Korutla’s measured profile.
5.6. Motor-Vehicle Registrations
Vehicle registrations fell 38.9 per cent at Jagtial and 37.4 at Korutla between 2019 and 2025, reflecting compositional transition rather than reduced ownership. At Jagtial, four-wheeler registrations rose 51.7 per cent while tractor and agricultural-vehicle registrations fell 44.7 per cent, inverting the car-to-tractor ratio from 0.42 to 1.16 (Table 8), corroborating the agricultural-land loss measured independently from imagery. Electric-vehicle penetration reinforces this, rising from near zero in 2019 to 8.6 per cent of Jagtial and 11.4 per cent of Korutla registrations by 2025 (Figure 11), a level requiring charging access and dealer presence that a dispersed rural mobility pattern does not support.
5.7. Convergence Across Data Families
Table 9 assembles the verdicts across data families sharing no error structure. Built-up, connection and load-intensity growth all move upward in every town, and Korutla’s fastest connection and load growth belongs to the town with the second-fastest, not slowest, built-up growth. The one indicator breaking step is the streetlight network: Korutla’s footprint grew roughly twenty-five times faster than its streetlights, while Jagtial’s and Metpally’s networks grew as fast as or faster than their own footprints, a specific, policy-relevant gap.
5.8. Correlation Analysis
Pooling all nine town-epoch observations, built-up area correlates strongly with vegetation (r = 0.91, p = 0.001) and water body (r = 0.89, p = 0.001), moderately with Wet/Black Soil (r = 0.70, p = 0.035), and only weakly and non-significantly with agriculture (r = 0.42) or bare soil (r = 0.09) (Table 10). This does not mean built-up growth causes vegetation or water-body growth; all three rise across the same observations because the decade brought greening and tank-filling alongside urban growth, more plausibly a shared decadal trend than a causal link. The more informative result is negative: agriculture and bare soil, which a simple ‘built-up consumes farmland’ model would expect to correlate most strongly and negatively with built-up, in fact show the weakest relationships (Figure 12).
5.9. Forecast to 2030, 2035 and 2040
Extending the historical series (Section 3.11) projects continued but decelerating divergence on built-up area and continued, accelerating divergence on electrical load (Table 11, Figure 13). Jagtial’s built-up area is projected to reach 16.13 sq km by 2040, a 47.7 per cent increase over 2025 and roughly one-fifth of its mapped extent; Korutla and Metpally grow more slowly in absolute area (11.5 and 13.1 per cent), reflecting the model’s structural property that a class already occupying a larger local share has more room to grow in logit space, not necessarily its underlying trajectory. Metpally’s central projection is non-monotonic, an artefact of renormalising seven independently trended classes, not a forecast of physical shrinkage. Connected load is projected to roughly double at Korutla and Metpally by 2040 (+115.3 and +101.5 per cent) against a smaller but still substantial rise at Jagtial (+74.3 per cent), while service connections grow far more moderately (15.8–24.6 per cent): the densification signature is projected to persist. Vehicle registrations are projected to continue their post-2019 decline in raw count, better read as a compositional shift towards four-wheelers and electric vehicles within a shrinking fleet than a literal count.
6. Discussion
Built-up growth intensity ranks consistently with each town’s administrative and economic role: Jagtial, the district headquarters, grows fastest; Korutla, the cottage-industry hub, second-fastest; Metpally, slowest, holding for the decade, the CAGR and the first half-decade, consistent with the corridor literature reviewed in Section 1 (Balakrishnan 2019; Basu, Das and Pereira 2023). Two features complicate a purely monotonic reading: in 2020–25 alone Korutla narrowly exceeds Jagtial, and Metpally’s growth mildly accelerates rather than decelerates across the half-decades, consistent with modest catch-up growth from a low base.
All three towns expanded their footprint, yet separate cleanly on the relationship between footprint growth and load intensification: the ratio of load-intensity growth to built-up growth is 0.57 at Jagtial, 1.19 at Korutla and 1.85 at Metpally, indicating predominantly horizontal growth at Jagtial against intensification-led growth at Metpally, whose smallest footprint gain conceals the corridor’s near-fastest load intensification; Korutla combines above-average footprint growth with the fastest intensification of all, its municipal infrastructure lagging (Section 5.7). Because built-up omission exceeds commission in the key models (Section 5.1) and user’s accuracy runs 90–100 per cent across the nine models, the reported figures are floors, not ceilings.
The beedi data supply a mechanism for Korutla’s distinctive signature: home-based piece work anchors population to walking distance of collection centres, generates domestic rather than industrial demand, and predicts infill on existing lanes rather than newly platted colonies, matching Korutla’s profile precisely, though it also carries a forward risk, since beedi production is in long-run national decline. Agricultural land followed three distinct paths rather than one shared decline, sharp contraction at Jagtial, moderate contraction at Metpally, and a rise at Korutla alongside collapsing bare soil, the clearest evidence for why per-town rather than corridor-pooled classification was the correct choice.
The Cabinet’s four-laning approval, naming congestion from built-up growth at Korutla and Jagtial as its justification (Press Information Bureau 2026), provides external corroboration and makes the 2025 classification a dated pre-intervention baseline; whether the approved bypasses consolidate growth within the existing towns or generate a fresh ribbon of frontage development is an open, answerable question. Five caveats bound these conclusions: bias-corrected area estimation (Olofsson et al. 2014) was not applied, so reported areas are conservative rather than statistically bounded; electricity feeder boundaries are operational rather than municipal; Bare Soil remains the weakest-resolved confusion partner of built-up; the beedi series supports only cross-sectional inference; and the forecast rests on as few as three historical anchors for land-use share, so its in-sample R2 (Section 3.11) describes historical fit, not forecast accuracy.
7. Recommendations
Six recommendations follow. Korutla’s streetlight network, water, sewerage, drainage and fire access should be audited against current built-up and load growth rather than historical extension rates. Metpally’s master plan should be reviewed against its measured growth and the 2040 forecast, preceding the corridor upgrade. Frontage controls, setback lines and access-control points on the approved bypass alignments should be gazetted before land values respond. Carriageway relieved in the existing cores of Korutla and Jagtial should be reallocated to pedestrian space, organised parking and market frontage. Korutla’s exposure to the long-run decline of the beedi sector should be assessed and diversification planning sequenced with, not after, the upgrade. Finally, water, sewerage and drainage capacity for Korutla and Metpally should be sized against the load trajectory in Table 11 rather than footprint.
8. Conclusions
This study set out to test whether rapid urbanisation along the NH-63 corridor is empirically demonstrable in a decade for which no census exists. Within the evidence assembled, it is: built-up area grew 80.2 per cent at Jagtial, 62.6 per cent at Korutla and 31.5 per cent at Metpally between 2015 and 2025, each town and epoch classified by its own independently trained and validated model at overall accuracies of 72.73 to 90.59 per cent. Three findings extend beyond the case. First, growth is rank-ordered by administrative and economic role, not a wave travelling the highway. Second, footprint growth and electrical-load intensification are partially decoupled and run in opposite directions across the three towns, with Korutla’s streetlight network lagging its own footprint by a wide, policy-relevant margin. Third, built-up omission exceeding commission in the key models means the reported figures are demonstrably conservative. Convergent validation across independent administrative families, transferable to any Indian small-town setting where census data are unavailable but administrative data are open, was this study’s central method, not a supplementary check. Whether the approved four-laning consolidates or redistributes this growth is now an answerable empirical question for post-widening imagery.
Author Contributions
Conceptualisation, methodology, software, formal analysis, data curation, and writing – original draft, S.T.P.; analysis, validation, writing – review and editing, K.S.T. Both authors have read and agreed to the published version of the manuscript.
Data Availability Statement
Sentinel-2A imagery is available from the Copernicus Open Access Hub; LISS-4 imagery is available from the Bhoonidhi Portal (NRSC/ISRO). Electricity, motor-vehicle and beedi-establishment records were obtained from the Telangana Open Data Portal. Derived classification outputs and the compiled non-spatial datasets are available from the corresponding author on reasonable request.
Conflicts of Interest
The authors declare no conflicts of interest.
References
- Balakrishnan, Sai. Shareholder Cities: Land Transformations along Urban Corridors in India; University of Pennsylvania Press: Philadelphia, 2019. [Google Scholar]
- Basu, Tirthankar; Das, Arijit; Pereira, Paulo. Exploring the Drivers of Urban Expansion in a Medium-Class Urban Agglomeration in India using Remote Sensing Techniques and Geographically Weighted Models. Geogr. Sustain. 2023, 4(2), 150–160. [Google Scholar] [CrossRef]
- Bhatta, Basudeb. Analysis of Urban Growth and Sprawl from Remote Sensing Data; Springer: Berlin, 2010. [Google Scholar]
- Breiman, Leo. Random Forests. Mach. Learn. 2001, 45(1), 5–32. [Google Scholar] [CrossRef]
- Chen, Tianqi; Guestrin, Carlos. XGBoost: A Scalable Tree Boosting System. In Proceedings of the 22nd ACM SIGKDD International Conference on Knowledge Discovery and Data Mining; Association for Computing Machinery: San Francisco, 2016; pp. 785–794. [Google Scholar]
- Denis, Eric; Zerah, Marie-Helene (Eds.) Subaltern Urbanisation in India: An Introduction to the Dynamics of Ordinary Towns; Springer: New Delhi, 2017. [Google Scholar]
- Gardner, Everette S.; McKenzie, Ed. Forecasting Trends in Time Series. Manag. Sci. 1985, 31(10), 1237–1246. [Google Scholar] [CrossRef]
- Huete, Alfredo R. A Soil-Adjusted Vegetation Index (SAVI). Remote Sens. Environ. 1988, 25(3), 295–309. [Google Scholar] [CrossRef]
- Kawamura, Masanobu; Jayamana, Sithara; Tsujiko, Yoshifumi. Relation between Social and Environmental Conditions in Colombo Sri Lanka and the Urban Index Estimated by Satellite Remote Sensing Data. Int. Arch. Photogramm. Remote Sens. 1996, 31, 321–326. [Google Scholar]
- Landis, J. Richard; Koch, Gary G. The Measurement of Observer Agreement for Categorical Data. Biometrics 1977, 33(1), 159–174. [Google Scholar] [CrossRef]
- Maparu, Tuhin Subhra; Mazumder, Tarak Nath. Transport Infrastructure, Economic Development and Urbanization in India (1990–2011): Is There Any Causal Relationship? Transp. Res. Part A Policy Pract. 2017, 100, 319–336. [Google Scholar] [CrossRef]
- McFeeters, Stuart K. The Use of the Normalized Difference Water Index (NDWI) in the Delineation of Open Water Features. Int. J. Remote Sens. 1996, 17(7), 1425–1432. [Google Scholar] [CrossRef]
- Ministry of Home Affairs. ‘Population Census–2027 to be Conducted in Two Phases along with Enumeration of Castes; Press Information Bureau, Government of India, 4 June 2025. [Google Scholar]
- National Highways Authority of India. List of National Highways in India; Ministry of Road Transport and Highways, Government of India: New Delhi, 2024. [Google Scholar]
- Olofsson, Pontus; Foody, Giles M.; Herold, Martin; Stehman, Stephen V.; Woodcock, Curtis E.; Wulder, Michael A. Good Practices for Estimating Area and Assessing Accuracy of Land Change. Remote Sens. Environ. 2014, 148, 42–57. [Google Scholar] [CrossRef]
- Pedregosa, Fabian; et al. Scikit-learn: Machine Learning in Python. J. Mach. Learn. Res. 2011, 12, 2825–2830. [Google Scholar]
- Press Information Bureau. Cabinet Approves the Widening of the Armoor–Jagtial–Mancherial Section of National Highway (NH)-63; Government of India, 3 June 2026. [Google Scholar]
- Rikimaru, Akihiro; Roy, Prakash S.; Miyatake, Sanath. Tropical Forest Cover Density Mapping. Trop. Ecol. 2002, 43(1), 39–47. [Google Scholar]
- Rouse, John W.; Haas, Robert H.; Schell, John A.; Deering, Donald W. Monitoring Vegetation Systems in the Great Plains with ERTS. In Third Earth Resources Technology Satellite-1 Symposium, NASA SP-351; National Aeronautics and Space Administration: Washington, DC, 1974; pp. 309–317. [Google Scholar]
- Sheladiya, Kalpesh P.; Patel, Chetan R. The Impacts of Urban Growth Drivers on the Spatial and Temporal Pattern of City Expansion. J. Indian Soc. Remote Sens. 2023, 51, 1631–1655. [Google Scholar] [CrossRef]
- Telangana Government. Formation of New Districts, Revenue Divisions and Mandals in the State of Telangana — Notification. In Revenue Department, Government of Telangana; 11 October 2016. [Google Scholar]
- van Duijne, Robbin Jan; Nijman, Jan. ‘India’s Emergent Urban Formations. Ann. Am. Assoc. Geogr. 2019, 109(6), 1978–1998. [Google Scholar] [CrossRef]
- Zha, Yong; Gao, Jay; Ni, Shaoxiang. Use of Normalized Difference Built-up Index in Automatically Mapping Urban Areas from TM Imagery. Int. J. Remote Sens. 2003, 24(3), 583–594. [Google Scholar] [CrossRef]
Figure 3.
Time-series colour-infrared composites of the Jagtial, Korutla and Metpally town areas for December 2015, 2020 and 2025. Source: Authors’ compilation from Sentinel-2A/LISS-4 imagery.
Figure 3.
Time-series colour-infrared composites of the Jagtial, Korutla and Metpally town areas for December 2015, 2020 and 2025. Source: Authors’ compilation from Sentinel-2A/LISS-4 imagery.
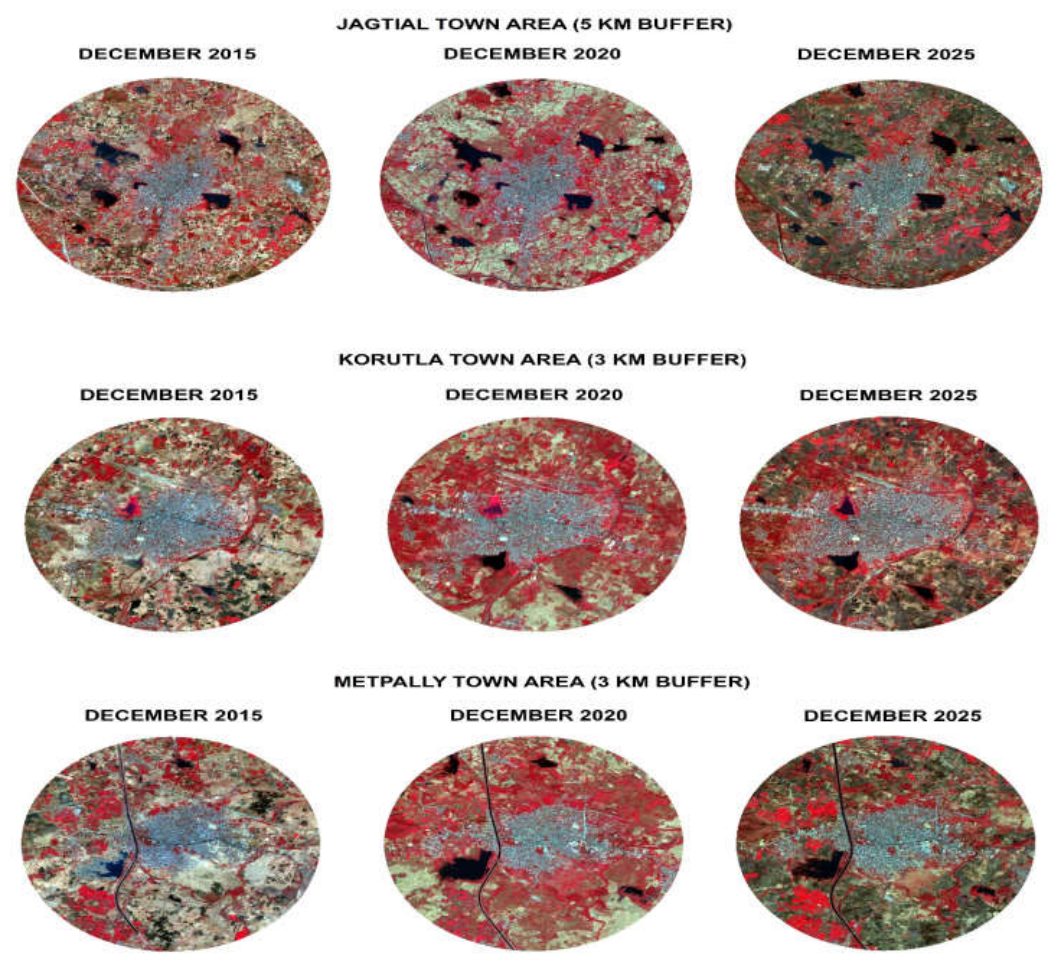
Figure 4.
Object-based (OTB Large Scale Mean Shift) segmentation polygons overlaid on LISS-4 colour-infrared composites for Metpally, Korutla and Jagtial, 2015 and 2025. Source: Authors’ segmentation output; LISS-4 imagery, Bhoonidhi Portal.
Figure 4.
Object-based (OTB Large Scale Mean Shift) segmentation polygons overlaid on LISS-4 colour-infrared composites for Metpally, Korutla and Jagtial, 2015 and 2025. Source: Authors’ segmentation output; LISS-4 imagery, Bhoonidhi Portal.
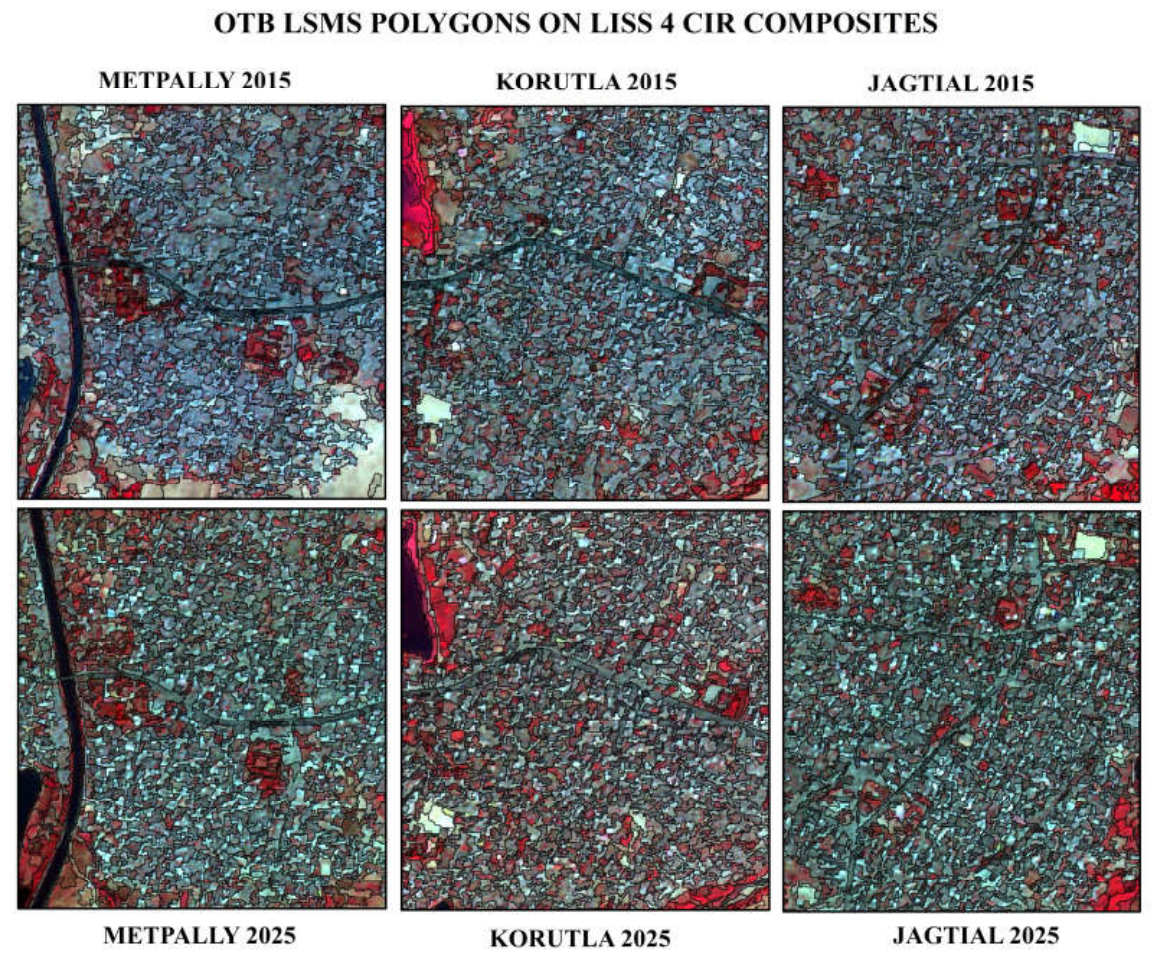
Figure 5.
Classified segmentation polygons for Metpally, Korutla and Jagtial, 2015 and 2025, showing the seven land-cover classes used in this study. Source: Authors’ classification output.
Figure 5.
Classified segmentation polygons for Metpally, Korutla and Jagtial, 2015 and 2025, showing the seven land-cover classes used in this study. Source: Authors’ classification output.
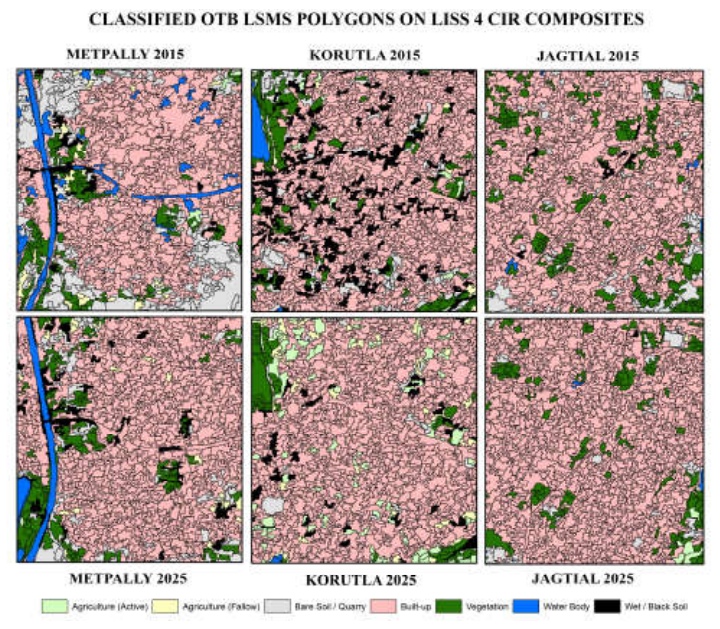
Figure 6.
Classification accuracy across the nine town-epoch models. (a) Overall accuracy, dotted line at 85 per cent. (b) Cohen kappa, dotted line at the 0.81 almost-perfect threshold. Source: Authors’ classification.
Figure 6.
Classification accuracy across the nine town-epoch models. (a) Overall accuracy, dotted line at 85 per cent. (b) Cohen kappa, dotted line at the 0.81 almost-perfect threshold. Source: Authors’ classification.
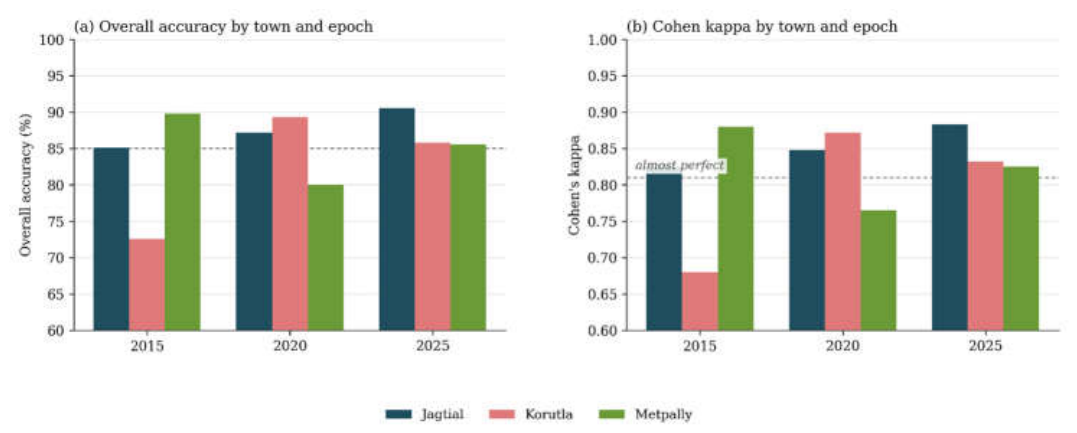
Figure 7.
Built-up expansion, 2015 to 2025. (a) Absolute extent. (b) Share of the mapped extent. (c) Growth by half-decade. Source: Authors’ classification.
Figure 7.
Built-up expansion, 2015 to 2025. (a) Absolute extent. (b) Share of the mapped extent. (c) Growth by half-decade. Source: Authors’ classification.
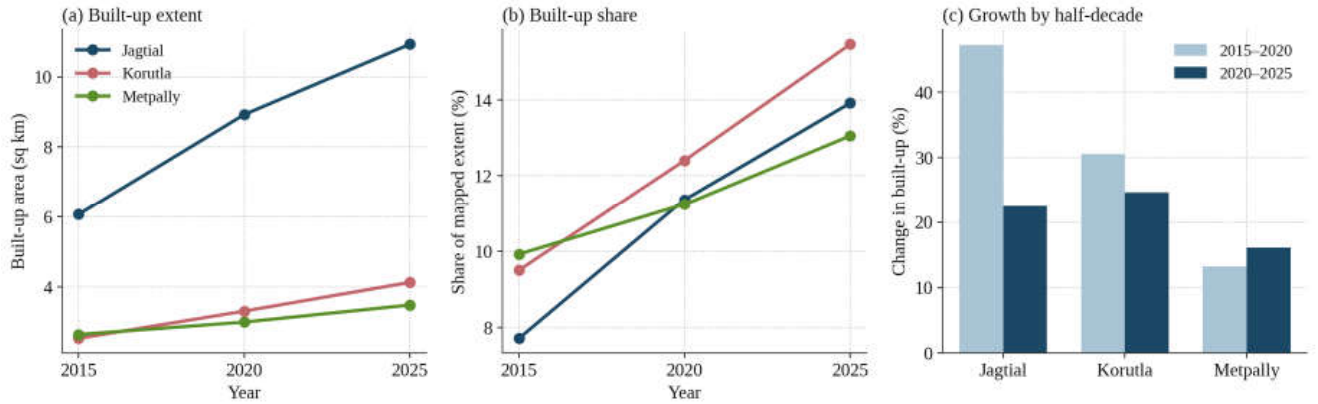
Figure 8.
Land-use composition at the 2015 and 2025 endpoints, as a share of each town’s mapped extent. Source: Authors’ classification.
Figure 8.
Land-use composition at the 2015 and 2025 endpoints, as a share of each town’s mapped extent. Source: Authors’ classification.
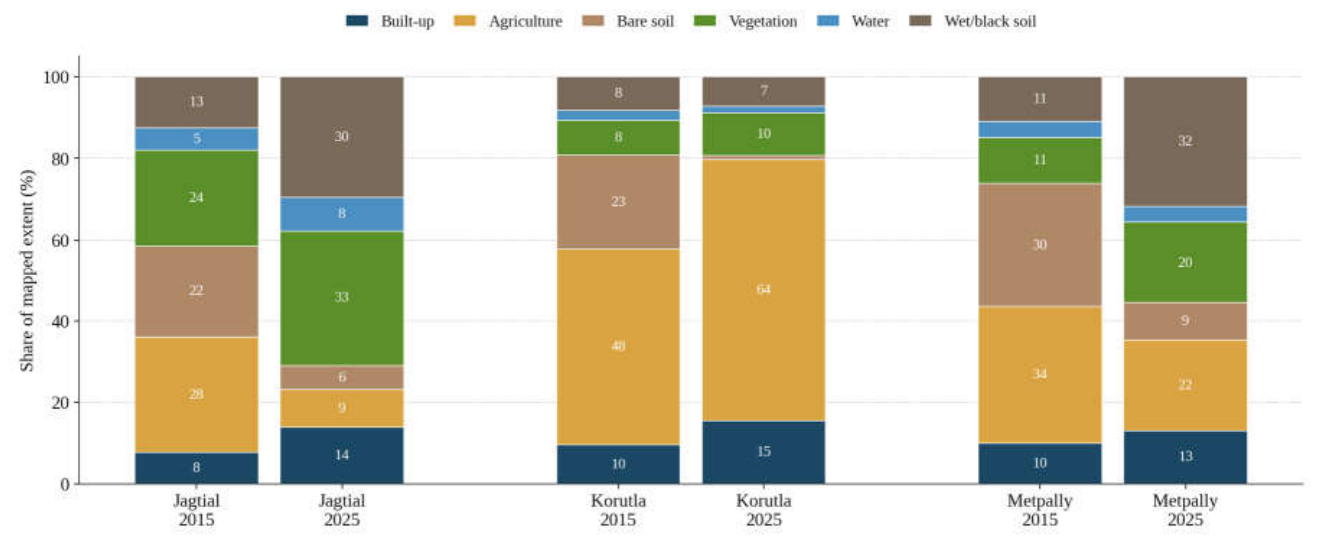
Figure 9.
Electricity indicators, 2019 to 2025. (a) Service connections indexed to 2019. (b) Load intensity in kilowatts per connection. (c) Commercial connections per hundred domestic connections. Source: TGNPDCL, Telangana Open Data Portal.
Figure 9.
Electricity indicators, 2019 to 2025. (a) Service connections indexed to 2019. (b) Load intensity in kilowatts per connection. (c) Commercial connections per hundred domestic connections. Source: TGNPDCL, Telangana Open Data Portal.
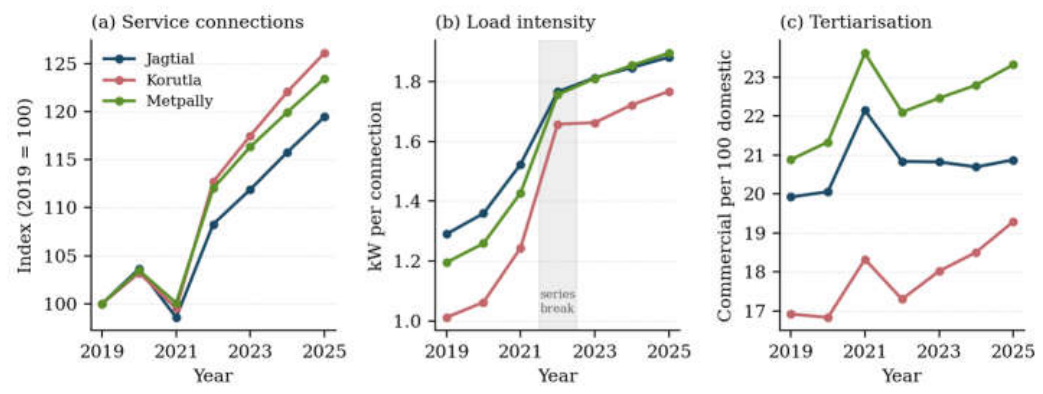
Figure 10.
Registered beedi manufacture across the corridor, 2023 to 2025 combined. Source: Telangana Open Data Portal.
Figure 10.
Registered beedi manufacture across the corridor, 2023 to 2025 combined. Source: Telangana Open Data Portal.
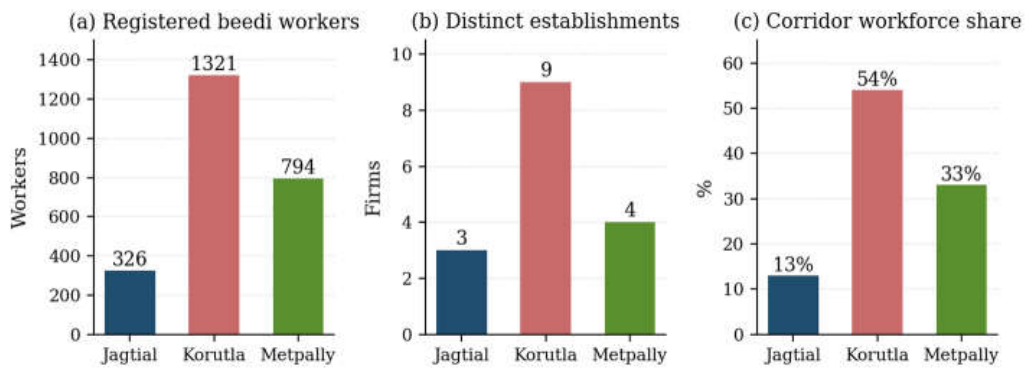
Figure 11.
Vehicle registrations, 2019 to 2025. (a) Total registration volume. (b) The Jagtial car-to-tractor ratio. (c) Electric-vehicle share of registrations. Source: TG RTA, Telangana Open Data Portal.
Figure 11.
Vehicle registrations, 2019 to 2025. (a) Total registration volume. (b) The Jagtial car-to-tractor ratio. (c) Electric-vehicle share of registrations. Source: TG RTA, Telangana Open Data Portal.
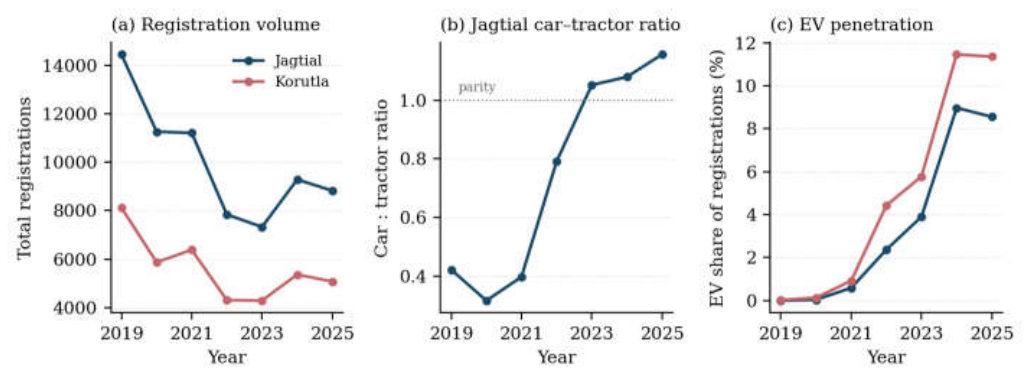
Figure 12.
Correlation analysis. (a) Pearson correlation of built-up area with other land-cover classes. (b) Built-up area against vegetation, with fitted trend line. (c) Built-up growth against load-intensity growth, by town. Source: Authors’ calculation.
Figure 12.
Correlation analysis. (a) Pearson correlation of built-up area with other land-cover classes. (b) Built-up area against vegetation, with fitted trend line. (c) Built-up growth against load-intensity growth, by town. Source: Authors’ calculation.
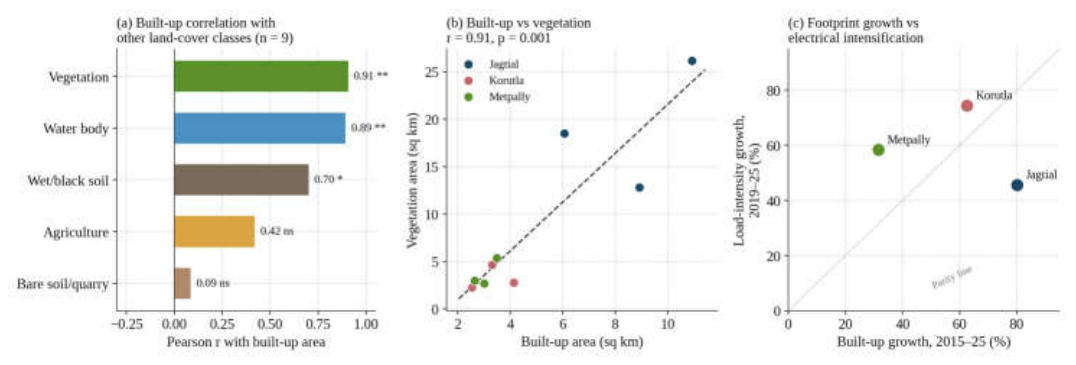
Figure 13.
Forecast to 2040. Solid lines are historical values; dashed lines are forecast values. (a) Built-up area. (b) Connected load. (c) Vehicle registrations (Metpally excluded; no dedicated registering office). Source: Authors’ forecast.
Figure 13.
Forecast to 2040. Solid lines are historical values; dashed lines are forecast values. (a) Built-up area. (b) Connected load. (c) Vehicle registrations (Metpally excluded; no dedicated registering office). Source: Authors’ forecast.
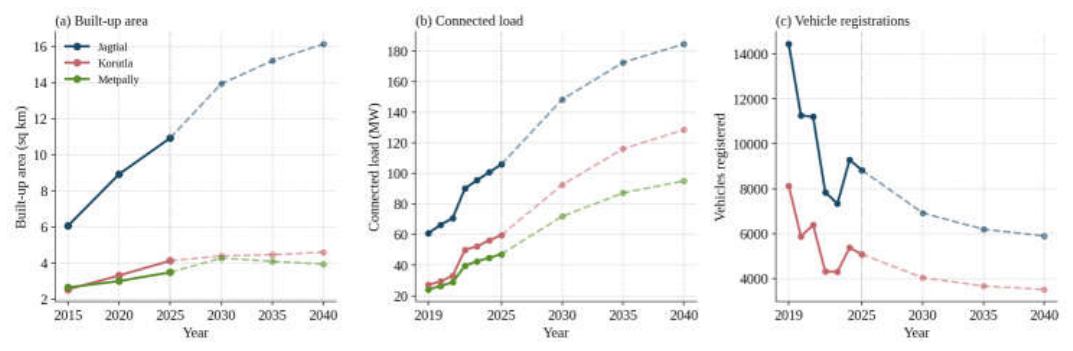

Table 2.
Spectral indices used for feature extraction.
| Index | Formula | Source | Interpretation |
|---|---|---|---|
| NDVI | (NIR − Red)/(NIR + Red) | Rouse et al. (1974) | Distinguishes vegetation from built-up/bare surfaces |
| NDWI | (Green − NIR)/(Green + NIR) | McFeeters (1996) | Positive values indicate open water |
| SAVI | [(NIR−Red)/(NIR+Red+L)]×(1+L), L=0.5 | Huete (1988) | Soil-adjusted vegetation index for semi-arid terrain |
| BSI | [(SWIR+Red)−(NIR+Blue)]/[(SWIR+Red)+(NIR+Blue)] | Rikimaru, Roy and Miyatake (2002) | Higher values indicate exposed soil/quarry |
| NDBI | (SWIR1−NIR)/(SWIR1+NIR) | Zha, Gao and Ni (2003) | Positive values indicate impervious surface |
| UI | (SWIR2−NIR)/(SWIR2+NIR) | Kawamura, Jayamana and Tsujiko (1996) | Separates built-up from bare soil using the SWIR2 band |
Source: Formulas as cited. SWIR1 and SWIR2 are Sentinel-2A bands B11 and B12.
Table 1.
Data sources and coverage.
| Dataset | Source | Coverage | Use in study |
|---|---|---|---|
| Sentinel-2A imagery | ESA Copernicus | Dec 2015, 2020, 2025 | Spectral indices, including SWIR-based NDBI and UI |
| LISS-4 imagery | Bhoonidhi Portal | Dec 2015, 2020, 2025 | Segmentation; band statistics; false-colour reference |
| Electricity records | TGNPDCL, TG Open Data Portal | 2019–2025; all towns | Connections, load intensity, sector structure; forecast to 2040 |
| Beedi worker registrations | TG Open Data Portal | 2023–2025; all towns | Cross-sectional cottage-industry structure |
| Vehicle registrations | TG RTA, TG Open Data Portal | 2019–2025; Jagtial, Korutla | Fleet composition, agrarian transition; forecast to 2040 |
Source: Compiled by the authors. Vehicle data for 2015 are not applicable because Jagtial district was constituted on 11 October 2016.
Table 3.
Classification accuracy for the nine town-epoch models.
| Town and epoch | Overall accuracy | Cohen kappa | CV balanced accuracy | Built-up F1 |
|---|---|---|---|---|
| Jagtial 2015 | 85.15% | 0.825 | 83.51% | 0.874 |
| Jagtial 2020 | 87.28% | 0.849 | 85.51% | 0.906 |
| Jagtial 2025 | 90.59% | 0.883 | 87.46% | 0.949 |
| Korutla 2015 | 72.73% | 0.680 | 76.29% | 1.000 |
| Korutla 2020 | 89.29% | 0.872 | 88.86% | 0.968 |
| Korutla 2025 | 85.86% | 0.833 | 85.86% | 0.947 |
| Metpally 2015 | 89.80% | 0.881 | 85.33% | 0.968 |
| Metpally 2020 | 80.00% | 0.765 | 80.73% | 0.903 |
| Metpally 2025 | 85.59% | 0.825 | 80.46% | 0.943 |
Source: Authors’ classification. CV = five-fold stratified cross-validation, balanced accuracy.
Table 4.
Built-up extent and change, 2015 to 2025.
| Town | 2015 | 2020 | 2025 | 2015–25 | 2015–20 | 2020–25 | CAGR |
|---|---|---|---|---|---|---|---|
| Jagtial | 6.062 | 8.923 | 10.925 | +80.2% | +47.2% | +22.4% | 6.07% |
| Korutla | 2.538 | 3.312 | 4.128 | +62.6% | +30.5% | +24.6% | 4.98% |
| Metpally | 2.650 | 3.001 | 3.485 | +31.5% | +13.2% | +16.1% | 2.77% |
Source: Authors’ classification. Areas in sq km over invariant extents of 78.54 (Jagtial) and 26.71 (Korutla, Metpally) sq km.
Table 5.
Land-use composition, 2015 and 2025 (sq km).
| Class | JGTL 2015 | JGTL 2025 | KTL 2015 | KTL 2025 | MET 2015 | MET 2025 |
|---|---|---|---|---|---|---|
| Built-up | 6.06 | 10.93 | 2.54 | 4.13 | 2.65 | 3.48 |
| Agriculture (combined) | 22.20 | 7.20 | 12.88 | 17.15 | 8.96 | 5.94 |
| Bare soil/quarry | 17.66 | 4.64 | 6.15 | 0.27 | 8.12 | 2.45 |
| Vegetation | 18.49 | 26.15 | 2.27 | 2.79 | 2.99 | 5.35 |
| Water body | 4.29 | 6.43 | 0.66 | 0.45 | 1.06 | 0.99 |
| Wet/black soil | 9.84 | 23.20 | 2.21 | 1.92 | 2.92 | 8.49 |
Source: Authors’ classification. Agriculture combines active and fallow sub-classes.
Table 6.
Electricity indicators, 2019 and 2025.
| Town | Indicator | 2019 | 2025 | Change | Rate |
|---|---|---|---|---|---|
| Jagtial | Service connections | 47,122 | 56,286 | +19.4% | 3.0% p.a. |
| Load per connection (kW) | 1.290 | 1.881 | +45.7% | — | |
| Korutla | Service connections | 26,784 | 33,768 | +26.1% | 3.9% p.a. |
| Load per connection (kW) | 1.013 | 1.767 | +74.5% | — | |
| Metpally | Service connections | 20,189 | 24,918 | +23.4% | 3.6% p.a. |
| Load per connection (kW) | 1.196 | 1.894 | +58.4% | — |
Source: TGNPDCL, Telangana Open Data Portal. Connected load shows a step increase between 2021 and 2022, most likely a utility load reassessment.
Table 7.
Registered beedi establishments and workforce, 2023 to 2025 combined.
| Town | Distinct firms | Registration records | Registered workers | Share of corridor workforce |
|---|---|---|---|---|
| Jagtial | 3 | 6 | 326 | 13% |
| Korutla | 9 | 35 | 1,321 | 54% |
| Metpally | 4 | 15 | 794 | 33% |
Source: Beedi and Cigar Workers establishment registrations, Telangana Open Data Portal.
Table 8.
Vehicle composition transition, Jagtial and Korutla, 2019 and 2025.
| Indicator | 2019 | 2025 | Change | Reading |
|---|---|---|---|---|
| Jagtial four-wheelers | 987 | 1,497 | +51.7% | Rising urban asset |
| Jagtial tractor/agri. | 2,340 | 1,295 | −44.7% | Agrarian retreat |
| Jagtial car-to-tractor ratio | 0.42 | 1.16 | — | Cars overtake tractors |
| Jagtial EV share | 0.0% | 8.6% | — | Rapid EV uptake |
| Korutla EV share | 0.0% | 11.4% | — | Rapid EV uptake |
Source: TG RTA, Telangana Open Data Portal. Metpally has no dedicated registering office.
Table 9.
Convergence across independent data families.
| Evidence family | Jagtial | Korutla | Metpally | Independence |
|---|---|---|---|---|
| Built-up, 2015–25 | +80.2% | +62.6% | +31.5% | Classification |
| Built-up, 2020–25 | +22.4% | +24.6% | +16.1% | Classification |
| Agricultural land, decade | −67.6% | +33.1% | −33.7% | Classification |
| Service connections | +19.4% | +26.1% | +23.4% | Utility billing |
| Load per connection | +45.7% | +74.5% | +58.4% | Load registry |
| Streetlight CAGR | 7.6% p.a. | 0.2% p.a. | 8.6% p.a. | Municipal infrastructure |
| Cottage-industry base | 13% | 54% | 33% | Labour-welfare registry |
Source: Compiled by the authors from the datasets inTable 1.
Table 10.
Correlation of built-up area with other land-cover classes (n = 9).
| Land-cover class | Pearson r | p-value | Interpretation |
|---|---|---|---|
| Vegetation | 0.91 | 0.001 | Strong positive; shared decadal trend |
| Water body | 0.89 | 0.001 | Strong positive; shared decadal trend |
| Wet/black soil | 0.70 | 0.035 | Moderate positive |
| Agriculture (combined) | 0.42 | 0.262 | Weak, not significant |
| Bare soil/quarry | 0.09 | 0.828 | Negligible, not significant |
Source: Authors’ calculation fromTable 5 and the corresponding 2020 classification values (n = 9).
Table 11.
Forecast of built-up area, electricity indicators and vehicle registrations to 2040..
| Indicator | Town | 2025 | 2030 | 2035 | 2040 | 2025–40 |
|---|---|---|---|---|---|---|
| Built-up area (sq km) | Jagtial | 10.925 | 13.930 | 15.203 | 16.134 | +47.7% |
| Built-up area (sq km) | Korutla | 4.128 | 4.391 | 4.462 | 4.603 | +11.5% |
| Built-up area (sq km) | Metpally | 3.485 | 4.275 | 4.093 | 3.942 | +13.1% |
| Connections | Jagtial | 56,286 | 61,081 | 63,877 | 65,163 | +15.8% |
| Connected load (kW) | Jagtial | 105,852 | 148,345 | 172,452 | 184,539 | +74.3% |
| Connections | Korutla | 33,768 | 38,520 | 40,948 | 42,080 | +24.6% |
| Connected load (kW) | Korutla | 59,654 | 92,579 | 116,000 | 128,443 | +115.3% |
| Connections | Metpally | 24,918 | 28,517 | 30,132 | 30,881 | +23.9% |
| Connected load (kW) | Metpally | 47,202 | 71,916 | 87,182 | 95,112 | +101.5% |
| Vehicle registrations | Jagtial | 8,826 | 6,918 | 6,191 | 5,896 | −33.2% |
| Vehicle registrations | Korutla | 5,081 | 4,036 | 3,664 | 3,511 | −30.9% |
Source: Authors’ forecast, anchored to XGBoost-smoothed 2025 values (Section 3.11); indicative only, seeSection 6. Metpally has no vehicle forecast.
Disclaimer/Publisher’s Note: The statements, opinions and data contained in all publications are solely those of the individual author(s) and contributor(s) and not of MDPI and/or the editor(s). MDPI and/or the editor(s) disclaim responsibility for any injury to people or property resulting from any ideas, methods, instructions or products referred to in the content. |
© 2026 by the authors. Licensee MDPI, Basel, Switzerland. This article is an open access article distributed under the terms and conditions of the Creative Commons Attribution (CC BY) license (http://creativecommons.org/licenses/by/4.0/).
Copyright: This open access article is published under a Creative Commons CC BY 4.0 license, which permit the free download, distribution, and reuse, provided that the author and preprint are cited in any reuse.