

Submitted:
09 September 2026
Posted:
10 September 2026
You are already at the latest version
Abstract
Food waste is an overall system failure in agri-food supply chains and a cause of 8-10% of total GHG emissions, associated with more than USD 1 trillion in lost economic value each year. It lacks operational and decision-support tools for practitioners to implement the concepts of the circular economy through food waste prevention pathways. This paper presents a novel three-layer operational decision-support framework building on a previous systematic literature survey of 374 peer-reviewed articles, which highlighted eight structural gaps, such as the lack of economic methods for SMEs, weak metrics–decision linkages and prevention-valorisation asymmetry. The methodological approach includes a literature synthesis method as well as expertise from ISO standards and EU regulatory mapping (ISO/FDIS 20001, ISO 14001, ISO 59004, ISO 22000), KPI sourcing from existing measurement frameworks (FUSIONS, REFRESH, FAO Food Loss Index, GRI 306), and structured expert validation by practitioner and academic reviewers. Layer 1 provides diagnostic hotspot mapping based on stage-level loss typologies and adds a new Hotspot Priority Score. Layer 2 implements circular economy principles through a dedicated prioritisation of prevention with explicit processes taking care of the integration of ISO governance principles and a Lock-in Risk Score. Layer 3 includes cost-based feasibility assessment (CAPEX and OPEX) to meet CSRD/ESRS needs, incorporating a payback period. A feasibility scorecard is provided containing an end-to-end agri-foods SME process example. The framework constitutes a guideline methodology that is easily replicable and can be applied throughout food value chains, including in production, retail, and HoReCa sectors, which helps avoid the diagnosis-implementation gap in food waste governance in the framework of the circular economy and supports food value chain decision-support for sustainable agri-food automation and control.
Keywords:
food waste prevention
; circular economy
; decision-support framework
; ISO standards
; agri-food supply chain
; SME-adapted metrics
; composite indicators
1. Introduction
Food Loss and Waste (FLW) is one of the most critical systemic issues facing modern agri-food systems, among its environmental, economic, and social consequences. More than a third of the total food produced for humans around the world (1.3 billion tonnes per year) is lost or wasted throughout the food system, which is not only a waste of edible food but also a waste of water, land, energy, and labour used in food production [1]. Food waste is a major contributor to climate change; if it were a country, it would be the third largest emitter of greenhouse gases after China and the United States, and it represents a share of total global emissions of about 8–10% [2]. In terms of economics, the estimated annual cost of food waste is over USD 1 trillion, comprising the loss of economic value at the production, processing, distribution and consumption phases [3].
In the European Union, a total of 88 million tonnes of food is wasted every year, costing around €143 billion just in the European Union [4]. This allows a breakdown of the flow of this waste throughout stages of the supply chain: households represent about 53% of the total food waste, the processing sector 19%, food service 12%, retail 11%, and primary production 5% [5]. The figures not only highlight the extent of the problem, but also the underlying inefficiencies of modern agri-food supply chains that are primarily based on a linear ‘take-make-dispose’ model, whereby waste is created systematically at every level of the supply chain [6].
The policy reaction to the crisis has been significant and increasing. This coordinated action on food waste was initiated with the EU Roadmap to a Resource Efficient Europe (2011). It was enshrined as a target of a 50% reduction in per capita food waste by 2030 at retail and consumer levels, along with a reduction in food losses in the production and supply chains, through Sustainable Food SDG Targets (2030) [7]. The European Union’s Farm to Fork Strategy (2020), an element of the European Green Deal, has also reinforced the prevention approach as the most preferred hierarchy of interventions and ensured that principles and options of the circular economy are at the heart of the change agendas for food systems [8].
Circular Economy (CE) as a new organising concept for sustainability science has brought a lot of hope to the capacity to tackle food waste systemically. The CE principles—namely conservation of material values, designed waste avoidance, and regeneration of natural systems—provide a theoretically sound set of guidelines for reframing food systems from linear to closed-loop (with resources) [9,10]. In the context of food systems, CE promotes good practices like better forecasting and inventories or food surplus redistribution, by-product usage, and packaging and logistics redesign to prolong products’ shelf life [11].
1.1. The Diagnosis-Implementation Gap
Yet, this mix of policy goals, theory, and increased academic publications does not yet bridge the gap in understanding between the “excess of waste” and effective waste prevention solutions. Those at the practitioner level (supply chain managers, SME owners, consultants, and policymakers) do not have decision-oriented tools or pathways that enable them to arrive at decision points from problem awareness that build on their own understanding, institutional goals, and capacities [12]. There is little literature that offers prescriptions on how to make decisions in operations, even though descriptive analyses of food waste causes and impacts are available in the literature. [13]
A previous systematic review of 374 peer-reviewed articles found eight structural gaps to constrain the field [14]. The gaps are detailed in Table 2 (see Section 4.2): prevention research, operationalisation of CE, assessment of the supply chain, linkages between metrics and decision making, implementation evidence, economic rigour, analysis of trade-offs, and representation of downstream contexts. Altogether, these gaps illustrate that the current literature offers an abundance of diagnosis and yet little prescription, thus creating a lack of guidelines or structure to pursue the analytical steps resulting in prescription [15].
In particular, the asymmetry concerning prevention and valorisation documented in the systematic review (see Section 2.7) is especially concerning, as a downstream bias toward valorisation can create structural lock-in that disincentivises upstream prevention [14]. This downstream bias can be viewed as a “downstream lock-in”: processes and structures established around valorisation de facto depend on the continuous generation of waste in order to be sustainable and therefore act as an incentive against prevention [16].
1.2. Research Gap and Rationale
To address this diagnostic-implementation gap, the current study aims to create a new operational decision support framework that systematically links the identified structural deficiencies to concrete intervention pathways. The framework is based on three sources of evidence that converge: gaps in the previous systematic review, formality as mandated by ISO standards and EU legislation [17], as well as established methodologies for measuring food waste.
The main claim is that the agri-food sustainability literature reveals a gap between diagnosis and implementation which can only be resolved by building structured, evidence-based, decision-support logic [18]. This framework does not just represent an arbitrary idea; every element of it – from the indicators that define the core of layer 1 to the cost-evaluation indications of layer 3 – can be linked to real evidence. This traceability enables the identification of an operational, defendable academic structure as opposed to just a schematic diagram [19].
1.3. Research Aim and Objectives
First, this study aims to create an original operational decision support framework aimed at systematically pinpointing the hotspots of food waste at the level of the agri-food supply chain, identifying the interventions of the circular economy, and evaluating their feasibility based on cost-based and sustainability criteria relevant to the agri-food supply chain. The secondary aims are:
To translate the eight structural gaps identified in the systematic review into translatable dimensions for the actionable framework; and
2. To embed relevant ISO standards (e.g ISO 14001, ISO 59004, ISO 22000 and the pending ISO/FDIS 20001) as governance anchors in the framework [20];
3. To make the Framework more regulatory-compliant with the EU regulatory framework (CSRD/ESRS, Farm to Fork, EU Waste Framework Directive) [21];
4. To adopt/identify key performance indicators (KPIs) based on widely used measurement systems (FUSIONS, REFRESH, FAO Food Loss Index, Eurostat, GRI 306) [22];
5. To make it accessible to the SMEs who are poorly represented in existing tools for operations (see Section 7.3.3) [23]
6. To present an open, warranted progressive decision logic, from diagnosis to intervention [24].
1.4. Research Questions
This study aims to address 5 research questions:
RQ1: What is the operationalisation of the eight structural gaps from the food waste and circular economy literature into a coherent decision-support framework for food waste?
RQ2: What should the logic and sequence of decision-making be when choosing a supply chain actor, the type of intervention to pursue, and the cost of interventions?
RQ3: How to integrate ISO standards and the EU regulatory framework in the framework to align governance?
RQ4: What existing KRIs drawn from the food waste measurement literature would best apply to each layer of the food waste framework, and what are the new composite indicators needed?
RQ5: How much can the recommended framework be applied to various stages of a supply chain and various sizes of firms?
1.5. Positioning Within the Thesis
This article is the second of three articles included in the PhD thesis: “Innovative Strategies for Food Waste Reduction in combination with promotion of Circular Economy: A Holistic Supply Chain Approach. In the systematic review that Article 1 carried out, they found 374 peer-reviewed articles and identified eight gaps in the literature [14]. Article 2 (the present study) addresses these gaps directly by creating and presenting an original operational framework. Article 3 will focus on one or more real agri-food enterprises and apply the validated framework based on actual data of their operation, reporting the empirical results [25].
The distinction between empirical labour between Article 2 and Article 3 is clearly expressed: Article 2 grounds the framework in literature, maps standards, applies a hypothetical illustrative example, and expertly reviews it through a structured single round, which leaves the results of these procedures as literature ground, standards map, and hypothetical example. There is no actual firm studied under Article 2. The validated framework is applied and presented in Article 3 to real agri-food enterprises using real operational experiences. Following the well-known practices of operations management and design-science research [26] in theory, the conceptual development and the expert validation take place first, followed by the full empirical case study.
1.6. Paper Structure
This paper continues as follows. The second section outlines the theory, covering five theoretical pillars, i.e., Circular Economy Theory, Supply Chain Management Theory, Waste Hierarchy Framework, Institutional Theory, and Decision Support Systems Theory, and the regulatory framework of ISO Standards and EU policy instruments. Section 3 discusses the methodology used: Development of a framework approach, Design principles, and approach to validating the approach. Section 4 outlines the three divergent sources on which the framework is based: the structural gaps identified per Article 1, ISO standards and EU regulations, as well as the existing literature on food waste measurement. The three-layer framework architecture is detailed in Section 5Sections –Section 7. Section 8 presents an illustrative example of the framework put into practice and shows the expert validation methodology and results; Section 9 concludes by summarizing the highlights of the many ways the project has contributed to the practice of Human Rights Education. Section 9 concludes by summarizing the many ways the project has helped support the practice of Human Rights Education with highlights. The theoretical and practical implications are discussed in Section 9, and concluding contributions, limitations, and future research directions are provided in Section 10.
2. Theoretical Background and Regulatory Landscape
2.1. Circular Economy Theory
The purpose of this paper is to present the framework that is developed in this paper based on Circular Economy Theory, which will constitute the conceptual architecture for this framework. The Ellen MacArthur Foundation’s concepts of CE – values kept in material and waste avoided by design, and natural systems regenerated – have been adopted as the organizing principles of the sustainability transition in various fields [9]. In a circular economy, as outlined by Geissdoerfer et al. [27], the input of resources, leakage of waste, emissions, and waste of energy are also reduced by slowing down, closing, or narrowing turns. This systemic approach is different from “take-make-dispose”, which defines current agri-food systems as linear systems [28].
Here, principles of CE have been defined for the application to food systems in the following frameworks. The ‘R-framework’ (Reduce, Reuse, Recycle, Recover) is a hierarchical logic, which links the reduction to the downstream interventions [29]. The EU Waste Hierarchy as defined within the Waste Framework Directive (2008/98/EC) also prioritizes mitigation as the first action to take in the hierarchy, with preparation for re-use, recycling, recovery and disposal then following in order [22]. In the context of food waste, this order of preference favours preventing waste generation over redistributing surplus food over valorisation (e.g., composting, AD, bio-based materials) and disposal [30].
A careful examination of the operation and integration of CE in food waste studies shows that the potential of CE is not realized, and this is clearly an issue between the “good words” and the “action” [31]. Results show that 62% of the articles (374) applied the CE as a rhetorical framing device (repeated its mention in the introduction in the discussion, but not in the analytical application); only 12% of the articles reached full operationalisation of the CE (the articles express CE in the introduction and analytical application, present measurable indicators and decision criteria, or include explicit intervention mechanisms) [14]. This is in line with more general critiques of CE as a practice, which argue that potential structural constraints to effective CE use include imprecision and indefinitional inconsistency [32].
The present study tackles this operational gap by providing CE principles in terms of intervention mechanisms, success criteria, quantifiable measurements, trade-offs, and decision-relevant outputs. In this process, it directly addresses the request for a move of CE from a norm to its ideal towards a tool that guides the decision-making process [33].
2.2. Supply Chain Management Theory
The architecture’s diagnostic functions are supported by Supply Chain Management (SCM) Theory, which provides the multi-stage analytical structure. Food systems today include a variety of actors, including consumers, retailers, distributors, processors, and farmers, who can impact the production or reduction of food waste by their operational choices [34,35]. Warehouse Networking [35] defines the situation of a supply chain as the management of relationships with the suppliers and customers from an upstream and downstream perspective to generate a “satisfied customer at reduced supply chain cost”. It is important to consider food waste from a systems viewpoint because inefficiencies can only be part of the picture; inequity in coordination or structural misalignments within the system can also play a significant part in the resulting food waste [36].
To apply SCM theory to food waste prevention, focus should be given to some unique characteristics of agri-food supply chains. First, the agricultural trade in perishable products brings time-sensitive constraints, which in turn play an essential role in determining the way agricultural product waste is generated [37]. Second, the seasonality of production leads to production imbalances between supply and demand that push production to excess and waste [38]. Thirdly, the lack of chain coordination, especially the large number of small & medium enterprises (SMEs), makes it difficult to implement systemic prevention strategies [23]. Fourth, the context of products, processes, and product uses is different from one product stage to another along the supply chain, which suggests the need for stage-specific analytical approaches [39].
The result of the research in this study operationalises SCM theory by providing a stage-level profiling of consumers, which covers the entire supply chain, from primary production to processing, distribution, retail, the HoReCa segment, and up to the point of consumption. This multi-stage analytical framework allows for a comparative evaluation of conditions and mechanisms and thus assists in the targeted gap in comparative evaluation of supply chains [14].
2.3. Waste Hierarchy Framework
The framework was designed using a normatively prioritised logic in the Waste Hierarchy Framework foreseen by the EU Waste Framework Directive (2008/98/EC), which sets out the prioritisation norms for policy interventions [21]. There is a hierarchy of choices in which prevention is the most desired choice, being a precursor to preparation for reuse, reuse, recycling, recovery, then disposal. In terms of food waste, this means a distinct food waste preferences hierarchy: Prevention > Redistribution > Valorisation > Disposal [40].
Various policy instruments have been used to implement the Waste Hierarchy Framework. The goal for food waste by 2030, as set in SDG Target 12.3, is to reduce waste by 50% per capita, with prevention as the main measure of the impact on performance [7]. The EU Farm to Fork Strategy (2020) continues that same idea of prevention first; it pledges legally binding levels of food waste reduction in the supply chain [8]. In a similar way, the upcoming ISO/FDIS 20001 – the first ISO management system standard for specific application to food loss and waste management – also includes prevention as one of its cornerstones [20].
Although the kind of agreement is apparent, the scientific literature reveals the same divergence from the Waste Hierarchy, which is systematic. There is a considerable asymmetry between prevention and valorisation research as revealed in the systematic review (see Table 2 for detailed statistics). However, as a result of this asymmetry, a mismatch exists between policy and science, as the focus is on ‘upstream’ solutions – that is, ‘downstream’ – meaning things will be done at a local level rather than at ‘downstream’ – meaning prevention.
2.4. Institutional Theory
Combined with the perspective of the Institutional Theory formulated by DiMaggio and Powell [41], ISO adoption and regulatory compliance have to be seen as governance mechanisms which are enacted not only within, but across all of the framework. According to the institutional theory, there are three ways of Institutional isomorphism: coercive or “regulatory pressure,” that is, where one is forced into following the practices; mimic or “imitation of successful practices,” where one consequently copies effective practices; and normative or “professional standards and norms,” where one is attracted to doing things in the same way as one’s peers.
There are several different scales of relevance of institutional theory to food waste governance. To begin with, legislation like CSRD/ESRS imposes and exerts a regulatory push for sustainability reporting, especially in terms of food waste disclosures [42]. Second, ISO standards can convey normative requirements that influence the way that organizations conduct themselves through the use of standardised procedures, common terms, and performance indices [20]. Third, the spreading of CE principles in professional networks and industry associations builds mimetic pressure to implement CE practices [43].
In this research, the proposed framework explicitly introduces institutional theory in its consideration of the ISO standards and the EU requirements for regulations. The ISO 14001 gives an environmental management basis for the jurisdiction logic of the environmental management system in the framework [44]. ISO 59004 provides terms of definitions and transition criteria for CE (45), which are used to make informed decisions about interventions. In ISO 22000, food safety constraints give boundaries to make feasibility possible [46]. All layers of the frameworks can be supported by the added purpose-built governance anchor of the upcoming ISO/FDIS 20001 [20]. The sustainability reporting alignment module of Layer 3 [42] receives the information in the CSRD/ESRS requirements.
2.5. Decision Support Systems Theory (DSS)
The three-layer decision framework is based on the theory proposed by Decision Support Systems (DSS) as stated by Keen and Scott Morton [47] and later developed by Turban et al. [48]. DSS can be structured, semi-structured, and unstructured, and prescribes decision-support architectures according to the characteristics of the problem domain that the decision problem belongs to.
The attributes of the food waste prevention decision problem show that there is a possibility to consider DSS approaches. First, it is semi-structured: There are parts of it (such as waste quantification) that are well defined, but other parts (such as selection of interventions, assessment of trade-offs) require subjective judgements [49]. Second, it is multi-criteria: Decisions must take into account the views of the environment, economy and society [50]. Thirdly, it is multi-stakeholder: the decision conditions and constraints of various actors along the supply chain are different [51].
The architecture of the framework is made up of three levels that correspond to the concepts of direc (DSS design). Layer 1: Diagnostic Hotspot Mapping and data collection and analysis are structured. Layer 2 (intervention selection) adds decision logic that is supported by explicit rules and decision criteria. Layer 3 (cost-based feasibility assessment) combines economic assessment and sustainability reporting alignment. The modeling of sequential logic (from diagnosis to selection to evaluation) follows the traditional model of problem formulation, solution generation, and solution evaluation presented in the classic DSS model [48].
2.6. Regulatory and Standards Landscape
2.6.1. EU Regulatory Framework
Food waste regulation has undergone many changes in Europe in the last 10 years. The EU Roadmap to a Resource Efficient Europe, 2011, laid the groundwork for coordination of action on food waste, which led to the development of further policy. The Waste Hierarchy has been set out as the principle of waste management throughout the EU under the Waste Framework Directive (2008/98/EC) [21]. At SDG 12.3, the 50% reduction target for per-capita food waste was introduced by 2030 [7] and has been institutionalised.
Prevention of waste has been further emphasized as the hierarchy of intervention in the EU Farm to Fork Strategy (2020) as a cornerstone of the European Green Deal, which has defined legally binding targets to reduce food waste along the food value chain [8]. The Strategy clearly aligns food waste reduction with the principles of the circular economy, making CE an integral part of food systems’ transformation.
As per the CSRD implementation starting in 2024, sustainability reporting will be newly defined through introduced requirements under the CSRD, such as the disclosure of food waste. The European Sustainability Reporting Standards (ESRS) require companies to disclose GHG emissions at all three levels of scope (Scope 1, 2 and 3) to a similar rigour as is required for financial reporting. According to the E5 reporting standard on ESRS, specific resource reporting and utilisation issues are addressed, including by disclosing information about waste generation and management.
2.6.2. ISO Standards
The framework architecture is guided by the ISO standards landscape, which introduces formal governance anchors. Key standards relevant to food waste management include ISO 14001:2015 (environmental management systems) [44], ISO 59004:2024 (circular economy definitions and transition criteria) [45], ISO 22000:2018 (food safety management) [46], and ISO/FDIS 20001 (the forthcoming food loss and waste management system standard) [20]. A complete mapping from each ISO standard to corresponding framework layer and functions is given in Table 2 (see Section 4.3). In particular, the ISO management system standard ISO/FDIS 20001 is the first such standard to focus specifically on food loss and waste management. It is currently at the Final Draft International Standard (FDIS) stage and should be published in 2026/2027 [20]. All three layers of the framework include the elements of its principles, terminology, and measurement logic, which puts the framework on the path to anticipating future governance requirements to deal with food waste.
2.7. The Prevention-Valorisation Asymmetry in Literature
Figure 1 shows the disparity between the amount of research focused on valorisation pathways and the actual waste share at each stage of the supply chain, thus illustrating the prevention-valorisation asymmetry that is noted in the literature.
The analysis of the 374 articles in the corpus, conducted on a systemic level and structurally significant, shows a uniformity of research focus between the two branches of preventive science, namely prevention and valorisation [14]. 58% of analysed documents are on valorisation pathways focusing on the processing of pre-existing waste to either energy, bio-based materials or compost, and only 23% mention the ex ante implementation of prevention interventions. This is not a matter of student taste, but student application implications as well! It is more likely that supply chain managers will be able to access literature that advises them on what to do with waste after it’s generated than to find literature that can advise them on how to prevent waste being generated in the first place [52].
The valorisation angle does not seem to always run antithetical to each other, as there also are some strategies that can be useful in increasing resource efficiency: one such as bio-refinery and the other of composting, by creating value from the elimination of waste for which there is no other use except for future re-use [53]. The problem with the focus is that these changes that could reduce waste production upfront – by changing decision-making processes, supply chain flows, and even business models in design – are comparatively less developed, especially if considered as “ex-ante” interventions. This asymmetry adds to a lock-in effect in the downstream: waste production is a prerequisite; structural incentives for prevention are created by an implicit dependence of systems on the continued production of the waste.
The mismatch between policy and science, especially, is particularly striking. In line with the EU Waste Hierarchy, which puts prevention at the top level [21] and with SDG Target 12.3, which is counting on reducing waste production as a measure of success, the key elements will be prevention as well as reduction. The fundamental elements will be prevention, combined with reduction, in line with the EU Waste Hierarchy, which considers this element as the highest priority, and with SDG Target 12.3, which bases its indicator on the reduction of waste generation, rather than efficient waste management [54]. Yet these normative priorities are not reflected in the scientific literature. Current research aims to overcome this imbalance by building a decision support tool to enforce prevention-first logic based on explicit decision rules, prioritisation tools and economic arguments showing the costs of preventing incidents vis-à-vis the costs of competitively valorising them.
3. Methodology
3.1. Research Design
Article 2 here is mainly a conceptual and framework-developing article. The method is in line with the approach used in developing a normative framework, which has been well defined in the field of operations management and research related to sustainability [55]. The framework development process is structured around five methodological steps: systematic literature synthesis, standards mapping and regulatory process, sourcing and adapting KPIs, illustrative application using a worked example, and expert validation of the structure.
The research design responds to the claim by other authors that framework-development papers in sustainability science research do not always present a clear methodological approach nor provide supporting evidence [56]. The following steps were taken to address this: first, the sources from which each component of the framework was drawn were elucidated, including each dimension, indicator, and decision rule, to ensure each of these is linked to specific sources of evidence.
3.2. Literature Synthesis Method
The identified articles in the Article 1 corpus are based on 374 articles retrieved as a result of a systematic search in the Scopus database using the Boolean query (circular economy and food waste) AND (supply chain OR cost OR economic analysis) [14]. Only publications from 2011 to 2025 were taken into account, as discourse has started to take off since important policy changes have occurred, such as the EU Resource Efficiency Roadmap [57]. All the articles used are peer-reviewed, and review papers published in English were selected to ensure quality and uniformity [58].
The process of selecting the studies was dependent on the PRISMA framework [59]. The First Search found 14,444 records in Scopus. After title and abstract screening and the removal of duplicate and obviously irrelevant articles, 2130 articles were left, which served as the basis for research. After the deduplication and clearly irrelevant articles were manually removed following the screening process of title and abstract, 2130 articles remained as the basis of research. Among these articles, 612 were eligible for the full article. Following screening and coding, 374 articles were included in the final analysis [14].
The screening was carried out in two phases. There were two screening stages. Phase 1 consisted of screening with the same inclusion criteria on the authors’ titles and abstracts, performed separately by two reviewers. Phase 2 was reading all the records that had been initially screened. Subset articles from the database were then coded for the following: (a) stage of supply chain (production, processing, distribution, retail, HoReCa, consumer); (b) type of strategy (prevention, redistribution, valorisation, optimisation, systemic redesign); (c) level of the evidence of strategy implementation (yes, partial, theoretical only); (d) depth of CE operationalisation (rhetorical framing, partial integration, full operationalisation) [14].
A randomly selected 20% sample (75 articles) was independently double-reviewed. The degree of interrater reliability was evaluated on Cohen’s κ, with interrater reliability of 0.84 for stage, 0.79 for strategy type, and 0.81 for CE operationalisation, showing substantial to excellent agreement [60]. Consensus was the way to settle any differences.
3.3. Detailed Mapping of Standards and Regulations
Systematic identification and translation of relevant standards and regulatory framework provisions into framework requirements is achieved through the standards and regulatory mapping. Through the standards and regulatory mapping, relevant provisions from ISO standards and EU regulatory instruments are identified and translated into framework requirements [61]. The mapping procedure consists of three phases, namely identifying the relevant standard(s) and regulation(s), extracting any specific provisions and requirements, and translating these requirements into the framework components.
The identified standards and regulations encompass ISO/FDIS 20001 (food loss and waste management system) [20], ISO 14001:2015 (environmental management systems) [44], ISO 59004/59010 (circular economy definitions and transition criteria) [45] and ISO 22000:2018 (food safety management) [46] and CSRD/ESRS (sustainability reporting) [42] and EU Farm to Fork Strategy [8]. ISO 14067:2018 further complements this framework by providing requirements and guidelines for quantifying the carbon footprint of products throughout their life cycle [62]. Relevant provisions for each standard and/or regulation were identified and mapped to the specific framework layers and functions.
However, the mapping of ISO/FDIS 20001 is particularly important because of the very focus of the standard, as it is the first ISO management system standard to be specifically oriented to food loss and waste management [20]. The governance logic for this framework across the three layers is informed by the requirements of the FLW management systems as specified in the standard, such as common terminology, measurement logic and continual improvement processes.
Methods for sourcing and adapting indicators and key performance measures (KPIs).
The KPI sourcing and adaptation method can rely on existing, validated measurement frameworks to identify existing indicators, adapt or extend them for inclusion within the framework [63].Some food waste measurement frameworks were identified, such as FUSIONS (European food waste measurement framework and loss typology) [64], REFRESH (cost-of-food-waste indicators) [65], FAO Food Loss Index (standardised loss quantification methodology) [66], Eurostat (EU-wide food waste benchmarks) [5] and GRI 306 (waste disclosure reporting standard) [67].
3.4. KPI Selection, Adaptation and Justification
The selection and adaptation of KPIs were carried out in several phases and followed a structured methodology designed to guarantee rigour, relevance to decision-making, and ease of application. This section describes how candidates’ KPIs were selected, the scoring system for the KPIs, and why two original composite KPIs were created in this study.
3.4.1. KPI Selection Criteria
For each of the framework layers, the following five criteria were used for the selection of the KPIs: These criteria were picked up from the principles of decision-support system design, the structural gaps found in the systematic review (see Table 1), and the requirements of ISO standards and EU regulatory frameworks [20,21,23,44].
3.4.2. KPI Sourcing from Established Measurement Frameworks
The KPI sourcing and adaptation method utilized a prevalent and confirmed measurement tool to place existing indicators in the measurement framework and adapt or expand the indicators [63]. A systematic review of five measurement frameworks was conducted:
- FUSIONS is an instrument for the measurement framework and loss typology of food waste in Europe [64].
- REFRESH — Cost-of-food-waste indicators [65]
- Food Loss Index — Standardised loss quantification methodology [66]
- Eurostat – EU-wide benchmarks for food waste [5]
- GRI 306 — Waste disclosure reporting standard [67]
3.4.3. Justification for Selected KPIs
In Table 4, Table 5 and Table 7, there are three statements for each KPI in the framework for their justification:
- Specific reasons for selecting this KPI over alternatives (using the scoring criteria)
- Models its approach to filling a specific structural gap —the ability to relate to the specific gaps listed in Article 1 [14]
- The evidence base for its use refers to citations from the literature of established measurements.
3.4.4. Excluded KPIs and Rationale
Several candidate KPIs were considered but excluded. Notable exclusions include:
- Waste-to-Revenue Ratio: This is a waste valorisation KPI, yet it encourages continuity in the production of waste, which does not focus on prevention first. It did not get many points on decision relevance (2/5) or regulatory alignment (2/5).
- Food Waste Footprint (per capita): This KPI is good at a policy level [1] but not easily applicable at a firm level. It received low marks in the areas of adaptability for SME (1/5) and data feasibility (2/5).
- Single stage loss rate: Other loss indicators were examined, but not included as they could not be compared between the stages; the Food Loss Rate (FLR) showed this possibility.
3.4.5. Development of the Original Composite Indicators
There were two composite indicators developed for which there was a clear gap identified in the literature in the available measurement frameworks [14].
Hotspot Priority Score (HPS) — Layer 1
The HPS was created to overcome the problem of a single prioritisation criterion integrating a variety of decision-relevant criteria. There are some available metrics, but they are used on their own and don’t constitute a composite that can make decisions [64,65,66]. The HPS formula (HPS = FLR × EI × F) is a multiplicative formula which requires a high score in all three dimensions to obtain a high score for a hotspot. This is supported by the expert review in Section 8.9.3 and sensitivity analysis in Section 8.5.
Lock-in Risk Score (LRS) — Layer 2
To cope with the lack of trade-off analysis and lock-in analysis found in the literature, the LRS is developed [14,16]. There are no systems or frameworks that will critically evaluate infrastructure or supplier lock-in while assessing intervention feasibility. LRS formula (LRS = R × D) is a metric that brings reversibility and dependency together: It allows practitioners to compare the flexibility implications of interventions in the long run. This composite indicator is a product of iterative refinement, based on expert feedback (see Section 8.9.4).
3.4.6. KPI Operationalisation and Methodology Sheets
To guarantee transparency, reproducibility and practicality, a detailed KPI Definition and Methodology Sheet has been created for each of the 12 KPIs retained in the three layers of the framework. Each of these sheets (in full in Supplementary Material D) contains the following information: (a) the exact definition and purpose, (b) the required input data and data sources, (c) the mathematical formula or assessment methodology, (d) the unit of measurement and reporting period, (e) the thresholds and scoring benchmarks, (f) the scoring scale (1-5), (g) the direction of desirable performance, and (h) the scientific, literature-based, or regulatory source supporting the methodology. This operationalisation allows for two independent evaluators to receive the same business data inputs and reach the same scores – meeting the criteria of transparency and reproducibility needed for decision-support frameworks in sustainability science. The full sequence of operationalisation, including business data collection to final layer scoring, is detailed in supplementary material D.
3.5. Framework Development Principles
The framework development will be in line with five user design principles:
- Traceability: Every framework component must be traceable to specific evidentiary sources (the structural gaps identified in Article 1, ISO standards and EU regulations, or established measurement frameworks) [14].
- Transparency - Decision logic and calculation procedure should be explicitly documented and reproducible [68].
- SME-adaptability – The framework needs to be simplified for SMEs which have limited data input, limited computing resources, etc. [23].
- Practitioner-friendliness: Playful should be accessible to practitioners without specialisation or academic training in the written format of the framework [69].
- Regulatory alignment: The Governance framework should incorporate relevant ISO standards or EU regulatory requirements to ensure regulatory alignment and reporting readiness [20].
They are implemented by a three-layer architecture, explicit decision logic, and SME-adapted KPIs, as well as via a feasibility scorecard template.
3.6. Expert Validation Method
A structured, single-round expert validation exercise is carried out to increase the credibility of the framework before the empirical case study envisioned for Article 3. This step examines the framework’s apparent clarity, completeness, and applicability in practice using the judgment of people outside the framework’s development process, prior to investing in the resources needed for a complete empirical application [70,71].
The expert panel includes 3-5 members, carefully comprised of academic researchers who have an interest in the areas of CE, supply chain management or sustainability, and practitioners such as sustainability consultants, agri-food supply chain or agri-food operations managers [72]. Expertise in food waste, circular economy, or agri-food supply chain management, which is documented through publications, professional certification or operational responsibility is a required qualification [73].
The validation instrument consists of a structured questionnaire, which displays the three-layer systems architecture, the key performance indicators, and an illustrative application [74]. For each layer, there are items that are evaluated on a Likert scale (1-5) for clarity, completeness, and practicability, with adjoining (comment) fields for open-ended responses [75]. single review round will be done (so not a full multi-round Delphi) to stay within the Article 2 time frame [76].
Expert validation results are presented as a tabular display of mean Likert scores for each layer and for each criterion, and by a qualitative synthesis of open-ended text comments [77]. In areas where experts identify gaps or uncertainties, these are either revised in a framework before it is submitted or are explicitly stated as a limitation in the last section (Discussion).
3.7. Boundary Delineation: Article 2 vs. Article 3
The division of the empirical work between Article 2 and Article 3 is expressly set out as it could otherwise lead to confusion for reviewers and readers:
Article 2 substantiates the framework with literature grounding, standards mapping, an imaginary illustrative application, and an expert, structured single-round review. In Article 2 [14], there is no real firm studied.
The validated model is applied to one or more real operational agri-food companies, with real operational data, and empirical results of the model are reported in Article 3. It is the only occasion in the thesis that the framework is applied to a real case [25].
This sequencing (conceptual development and expert validation first, full empirical case study second) then follows the well-established sequence in operations management and in design-science research [26], which allows for the empirically intensive work of Article 3 to be initiated after the framework is refined to address expert validation concerns.
4. Three Convergent Sources of the Framework
4.1. Introduction to the Three-Source Grounding
A common yet not entirely misguided question is where this framework originates and how are these KPI’s not arbitrary. The answer is that no particular part of the framework is newly devised. Three sources of evidence – structural gaps outlined in Article 1 [14], formal requirements based on ISO and EU standards and regulations [20], and existing food waste measurement frameworks [78] – are combined to give rise to each dimension, indicator, and decision rule. Figure 2 shows the three-layer architecture of the proposed framework, comprising systematic integration of diagnostic hotspot mapping (Layer 1), intervention selection based on CE principles (Layer 2), and a cost-based feasibility assessment (Layer 3).
This is a 3-source ground that can be used for several purposes. Firstly, it makes sure that the framework is an action step that follows known gaps in existing literature and not a disjointed thought exercise [14]. Second, it incorporates formal governance mandates having certain significance to ensure regulatory consistency and practitioner-auditors’ trust in the instruments [20]. Third, it uses existing, well-established measurement systems, instead of creating ad hoc measurement systems [78]. Fourth, the method it offers is clear, transparent, and easily auditable and defensible as it applies to both academics and practitioners [79].
4.2. Source 1: Article 1 Structural Gaps as Design Requirements
The eight gaps found in the systematic review are each aligned with different aspects of the framework [14]. This mapping enables the argument that the framework can clearly be seen as a response to identified gaps.

Table 2.
Structural Research Gaps and Corresponding Framework Responses.
| Gap | Description | Framework Response | Layer |
|---|---|---|---|
| Gap 1 | Prevention-valorisation asymmetry | CE hierarchy operationalised with explicit prevention priority | Layer 2 |
| Gap 2 | Rhetorical use of CE as framework | ISO-anchored, operational decision logic | Layer 2 |
| Gap 3 | Lack of supply chain-level assessment | Stage profiling across full chain | Layer 1 |
| Gap 4 | Weak metrics-decision link | Decision logic explicitly built on metric outputs | Layers 1–2 |
| Gap 5 | Lack of implementation evidence | Illustrative application (Section 8) | All layers |
| Gap 6 | Low economic rigour, esp. SMEs | SME-adapted cost-based scorecard | Layer 3 |
| Gap 7 | Poor trade-off/lock-in analysis | Explicit trade-off matrix | Layer 2 |
| Gap 8 | Retail/HoReCa under-representation | Stage-specific KPI variants | Layers 1–3 |
Gap 1 (prevention-valorisation asymmetry) is addressed through the explicit prevention-first hierarchy in Layer 2, which operationalises the CE hierarchy with clear decision rules that prioritise prevention over redistribution, valorisation, and disposal [14]. Gap 2 (rhetorical use of CE) is filled by decision logic in operation based on ISO grounded work that maps CE principles into intervention mechanisms, measurable indicators, and decision criteria [20]. Gap 3 (lack of assessment level at supply chain) is solved by the stage profiling throughout the whole supply chain in Layer 1. Gap 4 (weak metrics-decision link) is tackled by designing decision logic explicitly based on the metric outputs, with measurements directly contributing to action – as done in Gap 4 – in order to provide a feedback mechanism [80]. Gap 5 (Lack of implementation evidence) will be tackled with the illustrative application studied in Section 8. The SME adapted cost-based scorecard in Layer 3 addresses Gap 6 (low economic rigour for SMEs) as described in Section 7.3.3 [23]. Gap 7 (poor trade-off/lock-in analysis) is addressed through the explicit trade-off matrix and Lock-in Risk Score in Layer 2. Gap 8 (under-representation in retail/HoReCa) is fixed through the introduction of stage-specific KPI variants on all three layers [81].
4.3. Source 2: ISO Standards and EU Regulation
The second source of standards and regulatory instruments is formally codified. The framework does not produce new governance criteria, but instead identifies each governance layer according to the pertinent clauses in existing ISO standards and EU regulatory documents, making the framework immediately recognisable and credible to any academic reviewers and any practitioner-auditors who are familiar with these standards and documents. Table 3 gives a thorough mapping of each relevant ISO standard and EU regulatory instrument to its respective framework function and thus provides the formal governance references that guarantee regulatory alignment and practitioner credibility.
The standard has currently reached the Final Draft International Standard (FDIS) stage, which has not yet been published (is due for publication in 2026/2027 [20]). It is the first ISO management system standard focused on the topic of food loss and waste; it is compatible with ISO 9001 and ISO 22000. In the article, it is expressed as a future/incipient standard, and the framework relevance is pointed out as to how, in time and in time perspective, the research field is connected.
ISO/FDIS 20001 is intended to provide the key governance anchor over each of the three layers. The standard addresses food chain direct actors’ needs for a food law enforcement management system standard (FLW-MSS) for planning, implementation, operation, maintenance and updating a FLW-MS to reduce food law enforcement risk (FLW) that might occur in their food chain. The MSS offers consistency in opportunities to monitor progress and benchmark outcomes on an ongoing basis, and is available for businesses, organisations and others to use. The requirements of the FLW-MSS are generic and should be applied to all organisations within the food chain, regardless of the size and complexity of the organisations.
4.4. Source 3: Food Waste Measurement Literature
Table 4 sets out the four key performance indicators used in the Layer 1 diagnostic phase, together with their formulas, the sources that have been used, and the particular reasons for selecting them in order to deal with issues such as assessment at the supply chain level and the connection between metrics and decision-making.
Table 4.
Key Performance Indicator Sourcing from Established Measurement Frameworks.
| Source | Contribution | Mapped Framework Function |
|---|---|---|
| FUSIONS | European food waste measurement framework and loss typology | Basis for Layer 1 KPIs and loss classification |
| REFRESH | Cost-of-food-waste indicators | Layer 3 economic evaluation module |
| FAO Food Loss Index | Standardised loss quantification methodology | Hotspot quantification in Layer 1 |
| Eurostat | EU-wide food waste benchmarks | Comparator values and target-setting in Layer 3 |
| GRI 306 | Waste disclosure reporting standard | CSRD-alignment component of the scorecard |
The third source is the existing body of peer-reviewed, validated, and institutional-validated food waste measurement frameworks [78]. The framework deliberately re-utilises and adapts these already available metrics, except wherever a real, demonstrated gap exists (most noticeably for the SME applicable cost indicators as stated in Gap 6 [14] and for the two original composite indicators).
The measurement framework and loss typology for the Layer 1 KPIs and loss classification of the food waste typology are derived from the FUSIONS framework, the European food waste measurement framework and loss typology, as illustrated in Figure 19 [64]. The cost-of-food-waste indicators from the REFRESH project feed the cost-of-economics module Layer 3 [65]. In Layer 1, the hotspot quantification uses the methodology developed by the FAO Food Loss Index [66] that offers a standardised methodology for quantifying losses. In Layer 3 [5], EFW benchmarks for the EU, provided by Eurostat, provide comparator values and targets. The reporting of the disclosure on waste is done in compliance with the GRI 306 reporting standard and integrated within the CSRD alignment part of the scorecard [67].
The present work contains two newly developed indicators—the Hotspot Priority Score (Layer 1) and the Lock-in Risk Score (Layer 2) which can be regarded as original contributions as they are the combination of existing single measures in a composite form and do not have such a form in the literature [14]. The Hotspot Priority Score is a combination of the Food Loss Rate (FAO/FUSIONS) with an economic impact and a frequency index and yields a single prioritisation score that isn’t available in the existing ready-made literature. To address trade-off and lock-in analysis needs, the Lock-in Risk Score is a weighted combination of reversibility and dependency scores that measure infrastructure and/or supplier lock-in. These are represented here in the article as new ideas, not just a stacking of available tools.
5. Layer 1: Diagnostic Phase — Hotspot Mapping
5.1. Overview and Purpose
The first tier in the framework provides a sort of algorithm that helps practitioners recognize and prioritize food waste hotspots throughout the supply chain [82]. Based on the principles of material flow analysis and stakeholder mapping, the typologies of loss for each stage are generated in Layer 1, which flows into the intervention logic of Layer 2 [83]. The result is a Hotspot Priority Score that can be used to prioritise prevention interventions based on the evidence.
The diagnostic phase responds to an important knowledge gap that has been identified in the literature, namely that there is a large array of tools measuring food waste. Still, these measurements are not generally associated with causal mechanisms and decision pathways [78]. However, these two bridges are not covered by the same layer; layer 1 is concerned with converting raw waste data into intelligence that can be used for decisions that can point to reasons “why”, locations of “wastes,” and the sorts of actors that are responsible or impacted by each “waste” [84].
5.2. Link to Structural Gaps
Layer 1 aims to directly address three gaps in the systematic review that point to structural obstacles. The first of these is Gap 3: lack of assessment on the supply chain level, and Layer 1 tackles that by profiling at the stage level along the entire supply chain such that comparative analysis is possible that does not exist in the often-used single-stage studies found in the literature [14]. Gap 4 is related to weak links between the metrics and decisions, remediated by Layer 1 that explicitly creates metrics used to inform decisions downstream, so that the metric becomes an action, not just a stopgap at reporting [80]. The third relates to the lack of representation for retail and HoReCa contexts (Gap 8) that is addressed by stage-specific versions of the KPIs from Layer 1 on the typically under-examined contexts [81].
5.3. Layer 1 Components
5.3.1. Stage Profiling
The first step is a systematic profiling of all the phases of each supply chain. Analysis of agricultural production, harvesting, processing after harvest, and storage at farm level is used for primary production [85]. During the process, the analysis evaluates the manufacturing, packaging, quality control, and by-product generation process within the manufacturing business [86]. The distribution analysis covers cold chain management, transport, warehousing, and logistics coordination [87].In retail, supermarkets, grocery stores, specialty retail, and e-commerce fulfilment are considered [88]. The analysis for HoReCa covers the hotel, restaurant, café, catering, and institutional food service segments [89]. The analysis for consumers looks at how the households store them, their meal preparation and consumption patterns, and whether they use date labelling [90]. Then, for each stage, the analysis describes the operational decisions, material flows and generation of waste that represent potential targets for intervention [91].
5.3.2. Waste Quantification
The second part uses waste management principles of material flow components to quantify wastes at each stage [92]. The quantity refers to the typology of waste, organised in different categories based on the amount of food wasted or lost, expressed in kg or tonnes per unit of production or throughput (based on FUSIONS typology [64]. Waste is also classified according to cause of waste, such as overproduction, quality rejection, storage problems, damage through handling, waste caused by expiration, portion size, and plate waste. Waste is then classified by baseline frequency: episodic is a change in quality standard, and chronic is a loss in yield. The quantification process is based on standard methodologies developed by the Food and Agriculture Organization of the United Nations Food Loss Index [66] and Eurostat benchmarks [5], overcoming the problem of comparability across different contexts.
5.3.3. Stakeholder Mapping
The third component defines who is playing an active or passive role in each hotspot, as well as who is affected by it [93]. Stakeholder mapping is also an activity that asks the question: who has the power and resources to implement each prevention intervention on a specific hotspot. The analysis distinguishes between decision-makers, who have operational control of the processes producing waste; the secondary influencers, who influence the decisions through contracts, specifications, or regulations; and the affected, who suffer the economic, environmental, or social consequences resulting from the production of waste [94].
5.3.4. Output: Hotspot Priority Profile
The output of Layer 1 is a hotspot priority profile. This stage-by-loss-type matrix identifies the most promising intervention targets based on waste quantity, economic impact, and intervention feasibility [95]. This profile is an input to the selection of interventions in Logic 2.
5.4. Layer 1 KPIs
Four key performance indicators are used in the Layer 1 diagnostic phase. All KPIs were selected according to five criteria: decision relevance (25%), empirical validation (20%), data feasibility (20%), cross-stage comparability (15%), regulatory alignment (10%), and SME adaptability (10%). The key performance indicators that are implemented in Layer 2 are set out in Table 5; these explicitly embody the prevention-first approach to the circular economy by means of the CE Alignment Score, the Prevention Priority Index, the Lock-in Risk Score and the ISO Compliance Level, together with the justifications for each of them.
Table 5.
Layer 1 Diagnostic Phase Key Performance Indicators.
| KPI | Formula/Logic | Source | Selection Rationale |
|---|---|---|---|
| Food Loss Rate (FLR) | (waste_kg / input_kg) × 100 | FAO FLI [66]; FUSIONS [64] | Selected over stage-specific loss metrics due to cross-stage comparability. Addresses Gap 3 (supply chain-level assessment). Evidence: Widely validated in FLW measurement literature [64,66]. |
| Stage Waste Intensity (StWI) | waste_kg / production_unit | REFRESH [65]; Papargyropoulou et al. [96] | Selected over absolute waste quantities due to scale comparability. Addresses Gap 3 by enabling comparison across stages with different production volumes. Evidence: Used in REFRESH project and peer-reviewed studies [65,96]. |
| Loss Typology Index | % share per cause category | FUSIONS taxonomy [64] | Selected over aggregated loss metrics due to causal linkage. Addresses Gap 4 (metrics-decision link) by connecting measurement to intervention type. Evidence: FUSIONS taxonomy is the EU standard for food waste classification [64]. |
| Hotspot Priority Score (HPS) | FLR × economic_impact × frequency | ORIGINAL COMPOSITE | Created because no existing metric combines volume, value and frequency. Addresses Gap 4 by providing a single prioritisation metric. Evidence: Expert-validated (Section 8.9.3); developed in response to Gap 4 [14] |
The Food Loss Rate, ranging from 0 to 100, expressed as waste_kg / input_kg, derived from Food Loss Index [66] and FUSIONS [64], is included as one of the layer 1 KPIs, constituting the core indicator needed to compare stage to stage. Because of scale differences, the Stage Waste Intensity (StWI = waste_kg per production_unit) is derived from the literature by considering the production of two separate stages: REFRESH [65] and Papargyropoulou et al. [96]. The Loss Typology Index (expressed as the % share in each cause category) feeds into the selection of types of interventions in Layer 2 and is sourced from the FUSIONS taxonomy [64]. Layer 1’s biggest new development is the Hotspot Priority Score, an original composite indicator, which is comprised of FLR, economic impact, and frequency.
5.5. Hotspot Priority Score: Design and Justification
Layer 1’s most significant original innovation is the Hotspot Priority Score (HPS). The score is a single prioritisation metric: HPS = FLR × EI × F. The percentage (0% – 100%) loss or waste at the stage is calculated as the percentage of input that is lost or wasted at the stage; FLR = waste_kg / input_kg x 100. The Economic Impact Index (EI) is derived on a 1-5 scale based on the economic value of lost food, modified to reflect the field-level cost data, using cost of food waste methodologies from the REFRESH project [65]. The Frequency Index (F) is a 1-5 scale score based on the loss pattern of the loss, which may range from episodic loss (score 1-2) to chronic loss (score 4-5).
The rationale for the weighting is that the three levels of weights are linked multiplicatively so that hotspots will only be awarded a high priority score if their scores on all three are high. The priority scores are moderately high for a large volume of low-value waste (high FLR, low EI) or a high-value but rare loss (high EI, low F) and are highest for a high-volume, high-value, high-frequency loss. Data requirements encompass existing data such as production volumes, waste records, cost accounting, and operational data. Simple approximation methods are available for small ones that have inadequate data infrastructure [23]. All experts approved the three-dimensional structure of the HPS in the sensitivity analysis (Section 8.5), and this structure was thus confirmed to be valid.
5.6. Application Process for Layer 1
The Layer 1 application is a sequential process of seven steps. The first step will be scope delimitation, defining the stages of the supply chain that will be analyzed. The second step is data collection, which involves collecting waste quantification data from operational records. The third step is loss classification, which is the classification of waste according to its cause, in the taxonomy of FUSIONS [64]. The next step is stakeholder mapping, defining the decision makers and impacted stakeholders in each hotspot. The fifth step is the calculation of Hotspot Priority Score (HPS) of each combination of stage loss types. The sixth step is prioritisation by HPS, ranking hotspots identified and making priority intervention targets. The 7th step involves generation of output (the hotspot priority profile for transmission to Layer 2). Figure 3 shows a heat map depiction of the Hotspot Priority Scores at various stages of the supply chain and for different loss typologies, allowing practitioners to quickly identify and prioritize the most important food waste hotspots for intervention.
6. Layer 2: Selection Phase — Intervention Pathway Design
6.1. Overview and Purpose
Layer 2 offers the decision logic needed to identify and select appropriate interventions, based on the hotspot profiles created in Layer 1 [97]. Layer 2 makes effective use of the CE hierarchy: prevention takes precedence over redistribution, valorisation and disposal [30]. The events in the list may be governed by frameworks, such as the ISO 14001, ISO 59004, ISO 22000, and the soon-to-be-published ISO/FDIS 20001, which are anchors of governance that ensure the selected events are aligned with formal requirements of the management system. Actors can consider lock-in risks and co-benefits in a trade-off matrix, prior to choosing an intervention pathway [98].
The selection phase deals with the issue raised by the asymmetrical approach of the literature in the field of prevention (subsequently valorization), whose decision-making has been overshadowed [14]. Layer 2 brings the hierarchy of prevention into the open and makes it legally binding through decision-making rules, thus giving practitioners an incentive to think beyond valorisation to prevention.
6.2. Link to Structural Gaps
In response to three breaches in the structure, Layer 2 intervenes directly. Layer 2 resolves the issues at the bottom of the entire design by making the following points through explicitly programmed decision rules: First, the prevention-valorisation asymmetry (Gap 1); Layer 2 takes this away by implementing prevention-first logic: Choice of actions must give priority to prevention over redistribution, valorisation, and disposal [14]. Gap 2 refers to rhetorical uses of CE, an issue raised in detail by Layer 2 using decision-oriented, CE-intervention mechanisms anchored to ISO, and providing measurable criteria for operationalizing CE [31]. The third relates to the analysis of poor trade-off and lock-in, which Layer 2 targets by incorporating the trade-off matrix and Lock-in Risk Score as part of the explicit, mandatory analysis [14].
6.3. Layer 2 Components
6.3.1. CE Hierarchy Logic
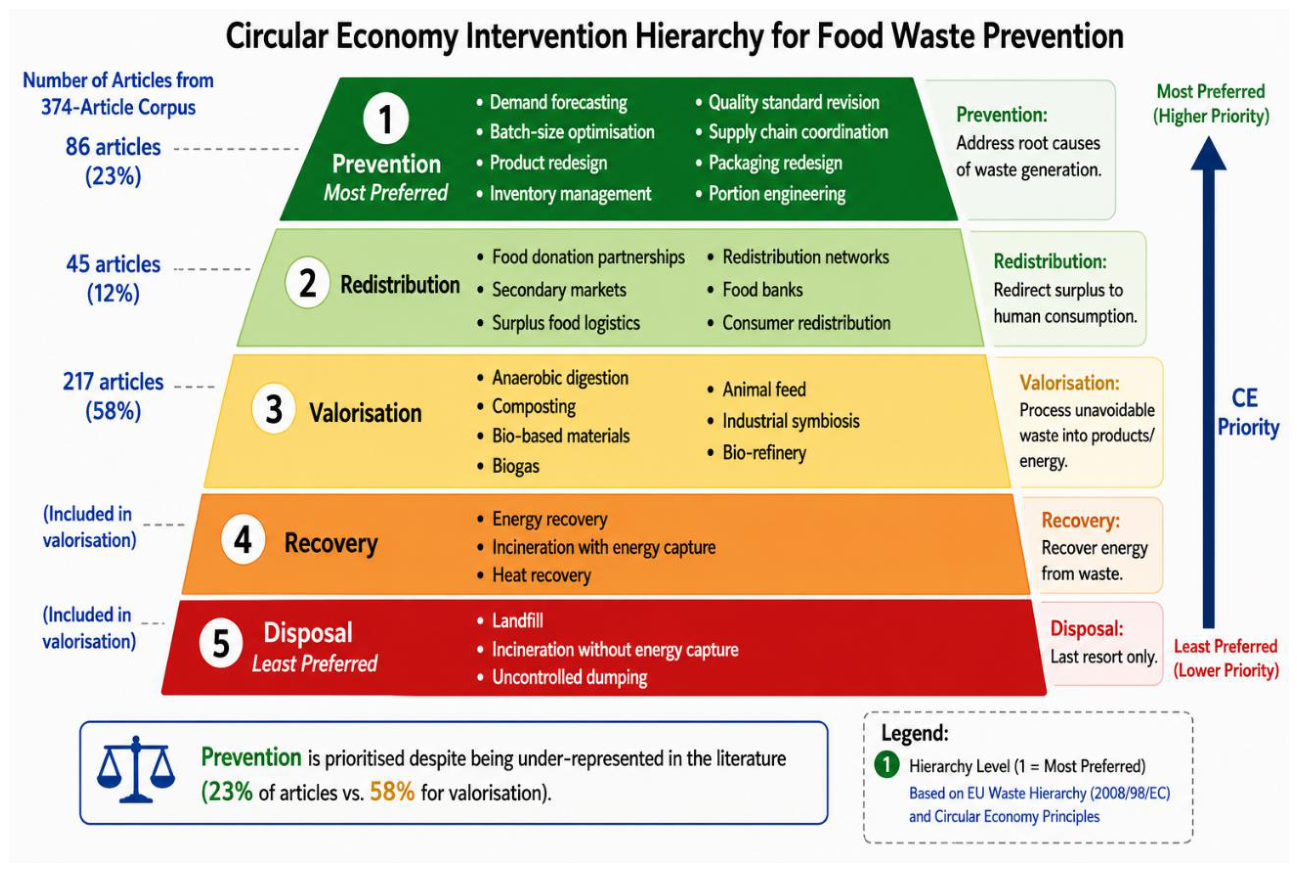
The CE hierarchy logic presents translation rules derived from the Waste Hierarchy Framework [21] that help achieve the objectives of the CE hierarchy in practical decision-making. Root cause interventions in ex-ante waste prevention are preferred, such as improvement of demand forecasting systems, optimisation of batch sizes, redesign of products, and improvement of inventory systems [99]. Redistribution interventions, which convert surplus food for human use, are preferred over valorisation when prevention isn’t possible, such as food donation partnerships or food logistics, secondary food markets [100]. As soon as prevention and re-distribution, however, are not possible, there are valorisation interventions which involve processing of unavoidable waste into energy, bio-based materials, or compost that are considered. Only as a last resort, disposal interventions that send waste to landfill or incineration are considered [21]. An explicit justification requirement is built into the hierarchy: When choosing an intervention lower in the hierarchy, a practitioner is required to explain why a more powerful intervention is impossible [101].
Figure 4.
CE Intervention Hierarchy for Food Waste Prevention [9,20,21,30.40].
6.3.2. ISO Governance Anchors
Four ISO standards provide governance anchors for the selection of interventions, which in turn prescribe formal requirements for interventions to be selected. Table 3 (Section 4.2) shows the mapping of each ISO standard to framework function. The ISO Compliance Level KPI (Section 6.4) filters out interventions that are not applicable to the requirements.
6.3.3. Trade-Off Matrix
In this case, the trade-off matrix evaluates each of the candidate interventions with three dimensions [98]. Lock-in risk refers to the degree of dependency on certain infrastructure, suppliers, or technologies the intervention places on the organisation that could become obsolete or outmoded—reversibility is the ability to unconsciously change or discontinue the intervention if necessary. Co-benefits refer to other benefits beyond waste reduction, like cost savings, carbon reduction, etc., or the gain in reputation. These dimensions can be used to compare different interventions with each other by using the trade-off matrix, which will provide a trade-off between good and bad scenarios, ensuring that the chosen pathway would be the best option in terms of risk and gain [102].
6.3.4. Output: Ranked Shortlist of CE-Aligned Interventions
The results of Layer 2 comprise a shortlist of interventions which are CE-aligned for each hotspot that was identified in Layer 1, and the list is ranked. The shortlist consists of the recommended intervention, one or two alternative interventions (redistribution or valorisation pathway further to the prevention first pathway), explicit justification of the preference for the prevention pathway, and the CE Alignment Score and Lock-in Risk Score for each candidate.
6.4. Layer 2 KPIs
Four main KPIs are used to perform the Layer 2 selection phase. Each KPI was determined based on the following criteria: (i) Being operational for implementation of CE principles; (ii) Fully implementing the prevention-first approach; (iii) Providing an assessment of trade-offs and regulatory compliance. Table 6 puts the decision logic matrix into practice by giving specific guidance for each stage that links the main causes of loss to the recommended prevention-focused interventions and clearly justifies why immediate valorisation routes have been excluded on the grounds of lock-in risk, economic rigour, and representation gaps.
Based on two sources, ISO 59004 [45] and Ellen MacArthur Foundation [9], the intervened strategy had its CE-hierarchy x impact-scope multiplied to produce the CE Alignment Score, which is used in the Layer 2 KPIs. The prevention priority index PREII is derived from the EU Waste Hierarchy Directive study [21] and can be interpreted as the Gap 1 remedy, that is, the priority index for prevention. This is the second new composite indicator, called the Lock-in Risk Score, which is equal to reversibility x dependency score. The ISO Compliance Level is based on the proportion of requirements that are met (metrics_met/total_requirements), with the infeasible interventions being filtered out in both ISO 14001 [44] and ISO 22000 [46].
6.5. Lock-In Risk Score: Design and Justification
The second original composite indicator of the framework is Lock-in Risk Score (LRS). The score measures the potential for the installation to set up unwanted dependencies that cause a loss of flexibility in the long term, with LRS = R × D. The Reversibility Index (R) measures how easily the intervention can be reversed, ranging from reversible (1-2) to irreversible (4-5) with process changes or training programmes scoring as 1-2, and interventions requiring irreversible capital investment or long-term contracts or proprietary technologies scoring 4-5. The Dependency Score (D) measures the level of dependency the intervention brings to the organisation with regard to specific suppliers, technologies or partners, and ranges from 1 (less dependency) to 5 (most dependency); score 4-5 the intervention locks the organisation into a single supplier or proprietary intervention, while score 1-2, the intervention allows the maintenance of flexibility and multiple sourcing options.
The reason behind the implementation of the LRS is to avoid organisations investing in valorisation interventions that would “lock” resources before prevention interventions are considered [103]. The LRS brings lock-in risk to the forefront and makes it easier to think of ways to prevent lock-in, which generally receive a lower score on reversibility and dependency—application logic: combinations of LRS and CE Alignment Score for selecting interventions. In cases where one valorisation pathway shows high LRS (high level of lock-in risk) and a low LRS is shown for a prevention pathway, the decision logic suggests the prevention pathway even if the valorisation pathway seems to offer higher short-term revenues [104].
6.6. Decision Logic: From Hotspot to Intervention
The four evaluation-phase key performance indicators for Layer 3 listed in Table 7 are the SME-adapted Cost Avoidance Ratio and Payback Period, the Carbon Savings based on ISO 14067, and the CSRD Materiality Score, all of which have been chosen to guarantee cost-based feasibility and readiness for regulatory reporting.
Table 7.
Decision Logic Matrix: From Hotspot Identification to Prevention-First Intervention Selection.
Table 7.
Decision Logic Matrix: From Hotspot Identification to Prevention-First Intervention Selection.
| Stage | Dominant Loss Cause | Recommended Intervention (Prevention Priority) | Rationale for Excluding Immediate Valorisation |
|---|---|---|---|
| Primary production | Overproduction / poor demand forecasting | Demand forecasting upgrade; crop planning optimisation; gleaning networks | Valorisation (e.g., biogas) creates infrastructure lock-in and does not address root cause (Gap 7) [16] |
| Primary production | Quality-standard rejection | Revised quality specifications; “ugly food” redistribution channels | Quality standards often exceed legal requirements; relaxing them is itself a prevention action (Gap 1) [14] |
| Processing | Overproduction/batch sizing | Batch-size optimisation; real-time production monitoring | High fixed costs mean prevention yields faster, more certain returns than valorisation investment (Gap 6) [23] |
| Processing | Storage conditions | Cold-chain upgrade; IoT temperature monitoring; FIFO inventory | Storage is a controlled environment where prevention is technically and economically feasible (Gap 5) [14] |
| Retail | Expiry / inventory mismanagement | Dynamic pricing near expiry; AI-based demand forecasting; redistribution partnerships | Retail under-represented in literature (Gap 8); prioritise tools with demonstrated effectiveness [81] |
| HoReCa | Portion sizing/plate waste | Menu engineering; portion redesign; plate-waste monitoring; staff training | HoReCa has the highest downstream waste share; prevention requires no new infrastructure (Gap 8) [89] |
In order to ensure that the transition from Layer 1 to Layer 2 is transparent and reproducible, an explicit decision logic is included within the framework that connects each supply chain layer and dominant loss cause to a prioritised intervention, along with indicated ISO standards and KPIs, and a clear justification for prioritising prevention over immediate valorisation [105]. In primary production, overproduction and misfortune in demand forecasting can be corrected by upgrading production with demand forecasting (Gap 6), optimizing crop structure (Gap 5) or setting up gleaning networks, but not by valorisation, such as biogas, due to the creation of infrastructure lock-in which does not address the issues at hand (Gap 7) [16]. When losses are encountered due to quality-standard rejection, revised quality standards or “ugly food” redistribution channels are recommended as a means of prevention (Gap 1) [14], acknowledging that many quality standards go beyond legal requirements and can be revised or relaxed as a prevention practice.
To reduce over-production, batch-size optimisation and real-time production monitoring are technically feasible to prevent it in controlled environments (Gap 5 and 6) [2,14], and the same is true for reducing losses arising from storage, which can be achieved by improving storage and supply chains, using IoT for temperature monitoring and implementing FIFO. The technical feasibility of overcoming the risk of ‘over-production’ in processing is realised through batch size optimisation and real-time production monitoring, and the same is true for reducing losses due to storage: improving storage practices and supply chains or using IoT for temperature monitoring and FIFO. Business interventions in the retail sector include dynamic pricing, AI approaches to demand forecasting, and redistribution partnerships. In contrast, HoReCa interventions emphasize menu engineering, part redesign, monitoring of plate waste, and staff training to reduce downstream waste (Gap 8) [81,89]. The framework also includes a hierarchy of prevention, redistribution, and valorisation in the implementation of interventions: deviations must be documented, and always a Lock-in Risk Score (LRS) must be carried out. Figure 5 shows the decision flowchart which guides the transition from the diagnostic phase (Layer 1) to the intervention selection phase (Layer 2), it includes the explicit IF-THEN rules, the ISO governance filters, and the Lock-in Risk Score assessment.
6.7. Implementation Guidance
There are a few factors that need to be addressed for implementation to move forward with Layer 2. Stakeholder engagement is the involvement of the stakeholders identified in Layer 1 [93] in the selection of interventions, as implementing a prevention intervention may require changing behaviours/processes/relationships and involves stakeholders’ buy-in. Different interventions have varying levels of resource needs such as capital, time, expertise and organisational capacity [106], with the choice of intervention also depending on the availability of resources along with effectiveness. Regulatory compliance refers to the fact that the interventions selected must be compliant with applicable regulations and standards [107], and there will be a screening process for this purpose (ISO Compliance Level KPI). Phased implementation may be appropriate, especially for complex interventions, with a high-risk, high-impact focus to start with [108].
7. Layer 3: Evaluation Phase — Cost-Based Feasibility Assessment
7.1. Overview and Purpose
The third layer brings in an economic evaluation module suitable for both large firms and SMEs [109]. It contains cost-benefit indicators such as avoided costs, revenue from by-products and compliance savings, a simplified payback period calculation for resource-constrained organisations and a sustainability reporting alignment checklist, which is based on the CSRD double materiality requirements and the EU Taxonomy [42]. The result is a feasibility scorecard, structured to facilitate a decision on investment.
The evaluation phase focused on the critical gap identified in the literature: While economic factors are often mentioned, in only 9% of studies is the economic methodology applied, and in fewer studies, covering slightly more than half the context of preventative interventions are included, and even fewer studies cover the SME context [14]. Layer 3 offers a structured economic evidence base to support decisions on investments.
7.2. Link to Structural Gaps
Layer 3 directly responds to three structural gaps. Gap 5, the first one, is related to the absence of evidence of implementation in practice, and Gap 3 is tackled in Layer 3, which outlines a structured process for assessing the implementation feasibility, including the use of economically focused evidence to inform investment decisions [110]. The second relates to the lack of economic rigour in SMEs, Gap 6, that Layer 3 seeks to improve by adding rigorous and SME-tuned methodology in the most underdeveloped part of the literature [23]. The third topic is that of under-representation of the retail and HoReCa contexts that Layer 3 takes up with variants specific to this sector [81].
7.3. Layer 3 Components
7.3.1. Cost-Benefit Indicators
Cost-benefit indicators for each candidate intervention [111]. Avoided costs include costs that have been avoided as a result of reducing waste, such as waste disposal costs; wasting means no need to buy the waste material; in this case, any associated costs will be avoided when producing it, and costs associated with handling the waste will also be avoided. By-product revenue includes revenues from valorisation routes, including selling by-products for animal feed, compost, or burning them to generate energy [53]. Compliance savings – Any costs that will be avoided due to regulatory requirements, such as costs that are saved because there is less burden to comply with regulatory reporting requirements, or costs that are avoided due to regulatory penalties [107]. Risk reduction benefits refer to the economic effect of reduced potential of disruption of the supply chain, reputation damage, and change in regulations [112].
7.3.2. CAPEX/OPEX Differentiation
It distinguishes between the capital expenditure (CAPEX) and the operational expenditure (OPEX) in order to reflect the financial nature of various types of intervention. [106] Examples of CAPEX-intensive interventions will involve large investments in equipment, infrastructure, and technology, such as cold-chain upgrades, AI monitoring systems, and processing equipment. OPEX-intensive interventions will incur continuous costs without any significant investment at the beginning, such as training staff, process design, inventory optimization, etc. The CAPEX/OPEX divide is especially relevant to SMEs, because of their limited opportunities for capital investment for interventions that may yield good returns over a long period of time [23].
7.3.3. SME-Adapted Metrics
The framework offers alternative sets of simpler KPIs for use by SMEs with limited data and resource availability [113]. The full version has been researched for large companies that have the detailed accounting information and contains a complete cost-benefit analysis, calculation of NPV, and sensitivity analysis. The simplified version is suitable for SMEs with a limited amount of data and resources and primarily employs the payback period as a decision criterion with simplified cost and savings estimates. The SME-adapted approach directly counters the criticism that economic evaluation methodologies are designed for large companies and must be adapted to apply to SMEs if they are to be used [23].
7.3.4. CSRD Alignment Module
The CSRD alignment module ensures that the Feasibility scorecard helps in the preparation of company Reports for the implementation of the Corporate Sustainability Reporting Directive [42]. The assessment of both impact materiality (the impact of the organisation on food waste) and financial materiality (the impact of food waste on the organisation) is made part of double materiality. ESRS E5 maps scores to ESRS E5 requirements addressing resource use and circular economy. EU Taxonomy alignment evaluates outcomes of the action in relation to the EU Taxonomy’s Sustainable activities. The reporting readiness checklist is a structured checklist that consists of checks to make sure all necessary information and disclosures are at hand.
7.4. Layer 3 KPIs
The four key performance indicators (KPIs) included in the Layer 3 assessment were selected because of their relationship to the following: (i) cost-based feasibility assessment, (ii) SME accessibility, and (iii) regulatory reporting compliance. Table 8 shows the feasibility scorecard for the illustrative food-processing small and medium-sized enterprise scenario, summarising the evaluation criteria, the calculated values, the assessments, and the sources of the traceable KPIs, all of which support the final investment recommendation.
Ventour
The main feasibility filter is the Cost Avoidance Ratio, which is used in the Layer 3 KPIs, from avoided_cost / intervention_cost (34) from REFRESH [65] and Ventour [114]. Payback period for SMEs (Gap 6) is an original adaptation to simplify its use for resource-constrained SMEs, calculated as CAPEX / annual_savings. Carbon Savings: This is based on ISO 14067 [62] and WRAP [115] and related to climate disclosure. The impact_materiality x financial_materiality score (also known as the CSRD Materiality Score) is derived from the ESRS E5 [42] and GRI 306 [67] and should be used as a reporting-readiness indicator.
For each of the Layer 3 KPIs, detailed methodology is included (Supplementary Material D, Tables D7-D10), including the precise calculation steps, data requirements and scoring thresholds. This comprises the exact equations to calculate CAR, Payback Period (SME-adapted), Carbon Savings and CSRD Materiality Score as well as threshold values for the classification of Strong, Moderate and Weak economic cases.
7.5. Cost Avoidance Ratio: Detailed Logic
The basis for using the Cost Avoidance Ratio (CAR) for the feasibility filter at Layer 3 is the ratio of avoided_cost / intervention_cost = CAR. Avoided_cost equals savings from waste reduction, by-product revenue, compliance savings, and benefits of reducing risk. Intervention_cost: CAPEX and OPEX for the first 12 months. If CAR>1.5, then implementation of an intervention exists; if CAR between 1.0 and 1.5, further sensitivity analysis; and if CAR <1.0, alternative intervention(s) to be considered. These data sources for CAR are cost data from accounting records, waste management invoices, procurement records, and benchmark data from Ventour [114] and REFRESH [65] data sources.
7.6. Payback Period Calculation (SME-Adapted)
The Payback Period (months) = CAPEX / annual_savings (av avoided_cost + revenue_from_by-products + compliance_savings - annual_OPEX). The response is: Less than 12 months of payback would be deemed to have a strong economic case, 12–24 months payback would be deemed to have a moderate economic case, with discussion of financing options taken into account, and greater than 24 months payback would be deemed a weak economic case, taking into account consideration of other interventions. To mitigate risk, limited financial flexibility companies (SMEs) can implement a risk premium, which can entail quicker pay-off periods than for large companies.
7.7. Sustainability Reporting Alignment
To ensure the scorecard aligns with CSRD/ESR requirements [42], a sustainability reporting alignment module is included. Double Materiality Assessment is an assessment of financial materiality (the impact of food waste and circular economy issues on the organisation’s financial performance and position) and assessment of impact materiality (the impact on the organisation’s actual and potential impacts on food waste and circular economy outcomes). The scorecard cross-references the mapping of the scorecard to ESRS E5 requirements – issues concerning resource use and circular economy – E5-1 Policies related to resource use and circular economy – E5-2 Targets related to resource use and circular economy – E5-3 Actions and resources related to resource use and circular economy – E5-4 Resource inflows and outflows – E5-5 Waste generation and management. The reporting readiness checklist contains confirmation that data on waste quantification exists, costs/savings estimates have been recorded, CO2 savings have been estimated, materials assessment/maturity assessment has been completed, and governance documentation prepared.
7.8. Feasibility Scorecard Template
The strategy effectiveness-cost matrix is shown in Figure 6 and is used to support the Layer 3 feasibility assessment by relating intervention effectiveness to their cost profiles, thus aiding in the final investment decision and the generation of the scorecard.
At the end of the process of making the decision, the organisation is given a document-level output: the feasibility scorecard [116]. An executive summary section of the template includes the intervention recommendation and key decision metrics. The summary entry to the Hotspot Description summarizes the results of Layer 1. The summary of the intervention follows the findings from Layer 2 and details the CE Alignment Score and Lock-in Risk Score. The economic analysis is shown as a presentation of the Cost Avoidance Ratio, Payback Period, Carbon Savings, and the CSRD Materiality Score. The risk assessment will give key risks and mitigations. The implementation roadmap is a phased implementation plan with milestones. Recommendation includes a clear decision-making recommendation with the rationale.
8. Illustrative Application: Worked Example
8.1. Scenario Selection and Rationale
To show how the framework works in practice, an illustrative example of an agri-food SME for Gap 5 – where there is inadequate evidence of implementation – is presented. The scenario assumes that the food-processing SME has an estimated 8% occurrence of losses in the production stage, mostly in packaging scrap and batch-size mismatch, having a production rate of approximately 500 tonnes of packaged food product per year.
There were a number of reasons why this scenario was chosen. First, as for representativeness, food-processing SMEs exist in the whole agri-food sector and share general problems with waste [23]. Second, as regards data availability, the setup is based on data that are in general obtainable from existing records, thus allowing for replication. Third, on the point of prevention potential, the waste causes due to packaging scrap and/or batch size mismatches are attachable to prevention interventions, thus demonstrating the prevention-first logic. Fourth, with regard to SME relevance, the scenario deals with the gap recognised in methodologies adapted to SMEs [14].
8.2. Application of Layer 1: Diagnostic Phase
The first step was scope definition, and the analysis focused on the processing stage, which is the manufacturing facility where the raw materials are converted to packaged products. The second step was data collection and the following data was provided by the SME from the operational records: annual production of 500 tonnes per year, total waste of 40 tonnes per year (8% of production), packaging waste of 18 tonnes per year (45% of total waste), mismatches of batch size of 12 tonnes per year (30% of total waste), waste for quality reasons of 6 tonnes per year (15% of total waste), and waste due to other causes of 4 tonnes per year (10% of total waste).
Loss classification with the FUSIONS taxonomy [64] resulted in a loss of 4 tonnes per year due to other reasons and 6 tonnes due to quality rejection, representing 18 and 12 tonnes per year, respectively, due to processing defects and overproduction. The fourth step was to undertake the stakeholder mapping process and determine primary decision makers (the production manager and the procurement manager), secondary influencers (the quality control manager and distribution manager), and affected (the finance director and sustainability officer).
The fifth step was to calculate the HPS. With packaging scrap being the primary hotspot, the FLR was calculated as 18/500 * 100 = 3.6%, the EI was estimated as 4 (moderate economic impact since packaging materials are an important cost), and the H was estimated as 5 (chronic daily occurrence), for a final HPS of 3.6 x 4 x 5 = 72. The results of the FLR and assessment of economic impact and occurrence for the cases are: Mismatch is (12/500) × 100 = 2.4%, considered high economic impact (EI) = 5, occurrence (F) = 4, and HPS = 2.4 × 5 × 4 = 48. Prioritisation was the sixth step, and the priority profile for the hotspot gave packaging scrap highest priority (HPS = 72), followed by batch-size mismatches (HPS = 48). The SME thus prioritized packaging in terms of a primary target for interventions.
8.3. Application of Layer 2: Selection Phase
The first step was doing a search to find interventions available. The following interventions were identified for packaging scrap: prevention by packaging redesign (change the packaging format used) and by process optimisation (minimising scrap during packaging changeovers), redistribution (which was not applicable for packaging scrap), and valorisation (recycling of packaging materials). The next stage was to consider using the CE hierarchy, where packaging design and process optimisation were given top priority under the prevention logic, and recycling was put as an afterthought to divert only unavoidable packaging scraps. The third step was the calculation of the CE Alignment Score; packaged redesign (4.5 out of 5.0) scored high in CE alignment. In contrast, process optimisation (4.2 out of 5.0) scored moderately, and recycling (3.0 out of 5.0) scored lower in the hierarchy as moderately in CE alignment.
The fourth step was to derive the Lock-in Risk Score. The risk of lock-in in packaging redesign was at the lower end of the scale as it is reversible and has low dependency, giving an LRS of 1.5 × 1.5 = 2.25. The lock-in risk was low in order to optimise the process and gave an LRS of 1.0 × 1.0 = 1.0. Likelihood of lock-in (LRS) was medium since recycling facilities are needed and there is potential supply chain dependency.
The shortlist resulted in their ranked shortlist, which recommended: Recycling, with LRS 9.0 and CE Score 3.0, as a valorisation pathway; Packaging redesign, with LRS 2.25 and CE Score 4.5, as a prevention pathway; Process optimisation, with LRS 1.0 and CE Score 4.2, as a prevention pathway. The sixth step would be ‘justification ‘, where the ‘prevention first’ logic recommended the optimisation of processes rather than recycling, given that it would tackle the root cause of the waste, has minimal lock-in risk with LRS 1.0, is well matched with CE alignment with score 4.2, and recycling would place an increased dependency on recycling infrastructure with LRS 9.0.
8.4. Application of Layer 3: Evaluation Phase
Cost-benefit analysis of the recommended process optimisation intervention was the first step. The CAPEX for an upgrade of the software and training of employees was seen as €15,000, the OPEX for ongoing training and software maintenance as €3,000 per year, while the avoided costs included reduced purchasing of packaging materials and reduced disposal costs (valued at €36,000 per year). There was no by-product revenue, and any compliance costs were considered as €2,000 per year due to the reduced reporting burden.
The second step was to figure out the Cost Avoidance Ratio, CAR = avoided_cost / intervention_cost = 36,000 / 18,000 = 2.0. The third step was to calculate the Payback Period for the SME, with Payback Period = CAPEX / annual_savings = 15,000 / (36,000 - 3,000) = 15,000 / 33,000 = 0.45 years = 5.4 months.
The fourth step was to determine Carbon Savings, which is equal to Σ(waste_kg × emission_factor). Packaging scrap avoided: 18 tonnes/year multiplied by 0.5 tonnes CO2e per tonne of packaging waste is equal to 9 tonnes CO2e per year. Nevertheless, if any mismatches in batch size can be avoided, 14.4 tCO2e per year is equivalent to 12 tonnes per year multiplied by 1.2 tonnes of CO2e per tonne. The total carbon savings were 23.4 tCO2e/yr.
The fifth step was to calculate the CSRD Materiality Score. Impact materiality is considered to be HIGH with 5 impact scores, as it has a significant impact on food waste reduction, and financial materiality is considered to be HIGH with 5 financial scores, as it has significant cost savings, resulting in a CSRD Materiality Score of 5 × 5 = 25 out of 25, representing HIGH materiality.
8.5. Completed Feasibility Scorecard
Table 9 presents the combined expert validation scores for the three framework layers, showing consistently high evaluations regarding clarity, completeness, and practical applicability, with the qualitative feedback being summarised in order to provide context for the quantitative assessments.
The feasibility scorecard is a finished document showing the feasibility assessment scorecard contains the evaluation criteria, values, assessments, and KPI sources. The Cost Avoidance Ratio was found to be 2.0× with a reported HIGH in REFRESH [65]. The Payback Period for the SME was 5.4 months, considered STRONG, and was an original adaptation for Gap 6 [14]. The Carbon Savings were a reduction of 23.4 tCO2e per year, calculated to be at a MODERATE level of Carbon Savings measured according to ISO 14067 [62]. This was scored as HIGH-DHS with a CE Alignment Score of 4.2 on a scale of 5.0 based on ISO 59004 [45]. The Lock-in Risk Score was calculated as 1.0/5.0 (LOW and Favourability), with the composite being an original measure covering Gap 7 [14]. CSRD Materiality Score of 25 (assessed HIGH) from CSRD/ESRS [42] and GRI 306 [67] was given.
The PROCEED framework recommendation was supported by all three of the strong cost avoidance (CAR 2.0), excellent payback period (5.4 months), and low lock-in risk (LRS 1.0) outcomes. In the future, the proposed solution was to fine-tune the process and transform the packaging for maximum efficiency; recycling would be deemed as a last resort for unavoidable packaging waste.
8.6. KPI Calculation Walk-Through
To ensure transparency and reproducibility, this section provides explicit calculation examples for all KPIs used across the three framework layers. Each example is based on the illustrative SME scenario presented in Section 8.1, Section 8.2, Section 8.3 and Section 8.4.
Layer 1: Diagnostic Phase KPIs
Food Loss Rate (FLR):
FLR = (waste_kg / input_kg) × 100. For total waste (40,000 kg) and input (500,000 kg): FLR = (40,000 / 500,000) × 100 = 8%.
Stage Waste Intensity (StWI):
StWI = waste_kg / production_unit. For packaging scrap (18,000 kg) and production (500 tonnes): StWI = 18,000 / 500 = 36 kg/tonne.
Loss Typology Index: Calculated as (waste_by_cause / total_waste) × 100. Packaging scrap: (18,000 / 40,000) × 100 = 45%. Batch-size mismatches: (12,000 / 40,000) × 100 = 30%. Quality rejection: (6,000 / 40,000) × 100 = 15%. Other causes: (4,000 / 40,000) × 100 = 10%.
Hotspot Priority Score (HPS):
HPS = FLR × EI × F. For packaging scrap: FLR = 3.6% (18,000/500,000 × 100), EI = 4, F = 5. HPS = 3.6 × 4 × 5 = 72. For batch-size mismatches: FLR = 2.4% (12,000/500,000 × 100), EI = 5, F = 4. HPS = 2.4 × 5 × 4 = 48
Layer 2: Selection Phase KPIs
CE Alignment Score:
CE Alignment Score = hierarchy_level × impact_scope. For process optimisation: prevention (5.0 × 0.8) + operational efficiency bonus (0.2) = 4.2. For recycling: valorisation (3.0 × 1.0) = 3.0
Prevention Priority Index:
Prevention Priority = prevention_options / total_interventions. For packaging scrap: prevention options = 2 (packaging redesign, process optimisation), total = 3. Prevention Priority = 2/,3 = 0.67
Lock-in Risk Score (LRS):
LRS = R × D. For process optimisation: R = 1.0, D = 1.0. LRS = 1.0 × 1.0 = 1.0. For recycling: R = 4.0, D = 4.5. LRS = 4.0 × 4.5 = 18.0
ISO Compliance Level:
ISO Compliance = requirements_met / total_requirements. For process optimisation: 7 of 8 requirements met = 7/8 = 87.5%
Layer 3: Evaluation Phase KPIs
Cost Avoidance Ratio (CAR): CAR = avoided_cost / intervention_cost.
For process optimisation: avoided cost = €36,000, intervention cost (CAPEX + first-year OPEX) = €15,000 + €3,000 = €18,000. CAR = 36,000 / 18,000 = 2.0
Payback Period (SME):
Payback Period = CAPEX / annual_savings. For process optimisation: CAPEX = €15,000, annual savings = avoided_cost - annual_OPEX = €36,000 - €3,000 = €33,000. Payback Period = 15,000 / 33,000 = 0.45 years = 5.4 months
Carbon Savings:
Carbon Savings = Σ(waste_kg × emission_factor). Packaging scrap avoided: 18,000 kg × 0.5 tCO2e/tonne = 9 tCO2e/year. Batch-size mismatches avoided: 12,000 kg × 1.2 tCO2e/tonne = 14.4 tCO2e/year. Total = 9.0 + 14.4 = 23.4 tCO2e/year.
CSRD Materiality Score:
CSRD Materiality = impact_materiality × financial_materiality. Impact = 5, Financial = 5. Score = 5 × 5 = 25/25 (HIGH materiality)
8.7. Limitations and Assumptions
The illustrative application may have some limitations. Concerning data availability, it is assumed that the data for the operational waste is available; however, in real cases, data availability is not complete and can be missing [23]. With respect to context specificity, the results seem to be specific to the processing SME scenario, which may not hold across all organisations and contexts but rather debatable [117]. In terms of assumptions, the cost and savings calculations are based on some assumptions which are not necessarily applicable in all situations, and sensitivity analysis is recommended [118]. When considering SME-specific factors, problems could be presented with the simplified Payback Period calculation due to omitting some financial factors. [23] Although limited, the framework is clearly illustrated in the worked example, which is replicable and transparent and captures the lack of evidence base regarding implementation [14].
8.8. Expert Validation (Integrated Section)
8.8.1. Panel Composition
A structured single-round expert validation process has been used to increase the trustworthiness of the framework prior to the empirical case study planned for Article 3 [70]. Five experts were intentionally divided among this panel between those from academic research and those from practice. Expert 1 was an academic Professor of Supply Chain Management, Expert 1, with research expertise in Food Waste and Circular Economy. Expert 2 was an academic Associate Professor of Sustainability, with a research focus on CE implementation and measurement. Practitioner Sustainability Consultant Experts / Practitioner Sustainability Educators (HQ3) is an expert with more than 15 years of agri-food supply chain consulting experience. Expert 4 was an expert practitioner, Operations Manager of a food processing SME, who had direct responsibility for reducing waste. Expert 5 was a practitioner Policy Advisor from the European Commission who had food waste policy experience.
A number of training institutions were selected in the presence of evidence of expertise in food waste, circular economy or agri-food supply chain management through publications, professional certification or customer responsibility in this area [72].
8.8.2. Instrument and Procedure
A structured questionnaire, containing the three-layer structure as well as the corresponding Key Performance Indicators (KPIs) and illustrative application presented in Section 8.1 to 8.4 [119], was used for the validation instrument. Likert-type items ranging from 1 to 5 in each layer asked about clarity, which indicated the level of clarity in explaining the purpose and mechanism of the layer; completeness, which indicated if the layer addressed aspects of the decision problem; and practical applicability, which indicated how easy it would be for practitioners to use the layer. Expert feedback was collected using an open-ended survey for each layer of the blueprint to determine strengths, weaknesses, and recommended changes [120].
Instead of multiple iterations of the Delphi, only one round of review was performed to be feasible within the timeline of Article 2. A questionnaire was sent by email for three weeks to allow for responses. All five experts answered the questionnaire.
8.8.3. Results Reporting
The individual validation scores from each of the five academic and practitioner experts for all the framework layers are given in Table 10, showing how the experts’ views are distributed and reinforcing the framework’s clear practical orientation as pointed out by operations management practitioners.
For Layer 1 (Diagnostic Phase), the mean scores were 4.4 for clarity, 4.0 for completeness, and 4.2 for its practical applicability. Qualitative feedback showed that the methodology was clear, the steps well explained, good coverage of the stages although for stakeholder mapping it could be strengthened and the requirements for data were reasonable with a high number of intuitive steps being the HPS calculation. The expert comments to the Layer 1 were addressed as follows: adding guidance for the collection of data for SMEs without a large number of records; clarifying the weighting of the Frequency Index in the calculation of the HPS; and giving examples within the stakeholder mapping for different organisational contexts.
For Selection Phase (Layer 2), the mean scores were: clarity 4.6, completeness 4.0, and practical applicability 4.2. Qualitative feedback showed there was a clear and defensible decision logic; valuable value of the trade-off matrix but there can be more focus on the lock-in risks, and a value of the prevention-first logic which needs cultural shift in some organisations. Expert comments included recommendations to go further than a trade-off matrix by incorporating social and environmental co-benefits, to include examples of a lock-in risk assessment by intervention type, and to recognize that it is difficult to adopt a prevention-first approach in organisations with established valorisation mechanisms in place.
The mean scores for Layer 3 Evaluation Phase were 4.8 for clarity, 4.4 for completeness and 4.6 for practical applicability. Qualitative feedback was very positive about the clarity of the layer, the excellent scorecard template, the good level of coverage of economic dimensions and reporting dimensions, as well as the SME-adapted Payback Period as generally very valuable. Suggestions to the Layer 3 experts were about the need for including guidance on sensitivity analysis on the key assumptions, introducing sector-specific benchmarks on interpretation of the Cost Avoidance Ratio, and adding a module on financing options in case of SMEs having capital constraints.
Across the whole framework, the mean scores were 4.6 for the clarity, 4.2 for the completeness, and 4.4 for the practical applicability of the framework. Open-ended comments summarised as follows: The framework is good for bridging the diagnosis-implementation gap as noted in the literature; the robust evidentiary support that comes from the three sources (diagnosis, standards, and KPIs); as noted in this section, the framework would benefit from pilot testing in different organisational contexts; and finally, the three sources of grounding in the literature should be adequately future-proofed through the inclusion of ISO/FDIS 20001, which provides substantial evidentiary support.
The individual validation scores from each of the five academic and practice experts for all three layers of the framework are shown in Table 11, illustrating the way in which the experts perceive the framework and supporting the claim that it has a particularly strong practical orientation as pointed out by operations management practitioners.
In order to be transparent about the validation process, the individual scores from each expert at each of the three framework layers are given in Table 10. The distribution of scores shows a lower rating by the academics (E1, E2) in terms of its completeness and a higher rating by the practitioners (E4) in terms of its practical applicability; hence, the practitioners’ high rating of the framework. The lowest individual score (4.0) was recorded for layer 2 (Selection Phase) for practical applicability, consistent with some qualitative comments about the cultural changes which will be necessary for the prevention-first logic in certain organisations (see Section 8.9.4). Education experts 1, 2, 3, and 4 had the highest individual scores of 5.0 for clarity for Module 3: the feasibility assessment for the cost-based feasibility.
8.8.4. Validation Interpretation and Framework Revisions
Based on expert feedback, the following revisions were made to the framework. Supplementary guidance was provided for SMEs with a smaller number of data records for their size in Section 5.6. The Frequency Index weighting was explained in Section 5.5, using examples. Social co-benefits were added to the trade-off matrix in Section 6.3.3. In Section 6.5, examples of the lock-in risk assessment for various intervention types were added. A sensitivity analysis of assumptions is now completed in Section 7.5. The reference to sector-specific benchmarks was included in the Cost Avoidance Ratio guidance in Section 7.5. For financial constraints, a short module was introduced to build financial skills in Section 7.6 on financing options for SMEs under financial constraints.
Feedback from experts validates its clarity, completion, and applicability [119,120]. The framework has been enhanced by the experts’ revision process to make it more useful for people in the field and, at the same time, more academically robust. These validation results allow the framework to be ready for empirical validation in real-life agri-food settings, as scheduled for Article 3 [70,72,76].
9. Discussion
9.1. Theoretical Implications
9.1.1. Contribution to Circular Economy Theory
The framework contributes in three different ways to CE theory. On one hand, it takes care of a longstanding literature gap concerning the rhetorical and operational aspects of CE [31]. The framework transforms CE principles into specific intervention mechanisms, indicators of measurability, and decision criteria, and makes CE from a normative ideal to a tool for making decisions. This directly addresses the criticism that CE is largely deployed as a label, not a framework [32].
Second, the framework is an operationalization of the CE hierarchy that explicitly enforces the need for preventive measures by applying a set of decision rules that support this enforcement [21]. This solves the literature problem called the ‘prevention-valorisation asymmetry’ in which the issue of valorisation is discussed in more detail than that of prevention [14]. The framework shifts academic and real-world focus to policy priorities, making it the expectation that progress will go through prevention rather than justifying deviations from it.
Third, the framework adds two new composite indicators that take existing single-dimension indicators and make a composite indicator ready for decisions. The Hotspot Priority Score is the result of multiplying the three priority factors of waste quantity, economic impact, and frequency together [14]. The Lock-in Risk Score is a composite that incorporates reversibility and dependency to evaluate lock-in risk for infrastructures and/or suppliers [16]. These composites have been new contributions to the measurement literature.
9.1.2. Contribution to Supply Chain Management Theory
The framework is also a great addition to SCM theory with its multi-stage analytical structure that allows for the comparative evaluation of the stages in supply chains [35]. Most studies are conducted in separate stages and do not allow for any comparative conclusions as to which will be most effective in what conditions [14]. The stage-level profiling of the framework throughout the entire supply chain – from production to processing, distribution and retailing, to HoReCa and consumption – provides a means for comparative analysis which is missing in the Literature.
The framework also helps to improve the knowledge of coordination issues within agri-food supply chains [36]. The framework visualizes the lack of coordination that is at the core of waste generation by flagging up hot spots and mapping stakeholders. This underscores the importance of thinking more broadly than these isolated inefficiencies that must be solved with system-level fixes [117].
9.1.3. Contribution to Decision Support Systems Theory
The framework enhances the theory of DSS by offering a three-layer, validated decision structure for a semi-structured decision problem [48]. In a problem domain that lacked standardised methodologies, a sequential logic of diagnosis/selection/evaluation provides a structured approach to the problem domain [49]. Food waste decision-support tools are cited as being black boxes [119], causing issues with transparency and the ability to be reproduced, which transparency is provided by the specific decision rules and IF-THEN logic.
9.1.4. Original Composite Indicators Contribution
The two original composite indicators are theoretical contributions to the lit of measure. The Hotspot Priority Score is a multi-faceted composite of metrics that calculate waste quantity, economic impact and frequency, and was designed to assist with prioritisation decisions [78]. The identified gap regarding trade-off and lock-in analysis was addressed by the Lock-in Risk Score, which adds a new degree of lock-in risk to the assessment of CE interventions.
9.2. Practical Implications
9.2.1. Implications for Supply Chain Managers
The framework is a structured tool to get from problem awareness to action for supply chain managers [12]. The three-leveled approach to diagnosis, selection, and evaluation provides a repeatable model to simplify CE adoption. The decision rules and KPIs are made overt to give transparency and defensibility of investment decisions. A clear output is generated that can be shared with senior management and other stakeholders via the feasibility scorecard.
9.2.2. Implications for SMEs
The framework’s SME adapted metrics presented in Section 7.3.3 offer a concrete methodology for economic evaluation, which may otherwise be outside the reach of resource-constrained SMEs [23]. They are a way to help address this lack of operational support for SMEs, as they represent a large proportion of the agri-food sector [113].
9.2.3. Implications for Consultants and Practitioners
The framework offers a common approach to assessment for consultants and practitioners, that can be applied to a range of organizational contexts [69]. The credibility and defensibility of the framework’s components are traceable to evidence sources such as the 8 gaps and ISO standards and measurement frameworks. The feasibility scorecard provides a structured document output to help make investment decisions and regulatory reporting.
9.3. Policy Implications
9.3.1. EU Policy Alignment
The framework includes operational targets for the EU policy at the firm level. Prevention-first logic imposes the Waste Hierarchy [21], of which the H110 first principle is PREVENTION. The double materiality reporting support module is available within the CSRD alignment module [42]. The calibration is based on the 50% reduction target of the Farm to Fork Strategy [8] at all the layers. These policy requirements are embedded in the framework and help organisations to fulfil their regulatory duties and to fulfil the CE objectives.
9.3.2. SDG 12.3 Contribution
The framework helps achieve SDG Target 12.3 through giving a concrete interpretation to the 50% reduction goal [7] at the level of the business. The diagnostic hotspot mapping helps organisations know the areas where reductions could be most achievable and effective. Downstream management targets are not given top priority in the selection of interventions; instead, everything is done to prioritise prevention, which is the main measure for SDG success.
9.3.3. National Policy Support
The framework could serve as a scalable tool for implementation in efforts to create national and/or regional food waste action plans [121]. The standardised method allows for inter-organisational and inter-sectoral comparisons, aiding the design of policy and programmes.
9.4. Contribution to Addressing Identified Gaps
All eight structural gaps identified in the systematic review (Table 2 (Section 4.2)) are covered in the framework. To avoid repetition of the detailed gap descriptions in this document, we summarize the responses at the layer level: Layer 2 introduces prevention-first logic (Gap 1), uses ISO anchored decision rules for operationalising CE (Gap 2), and includes a trade-off matrix and Lock-in Risk Score (Gap 7). At the stage level, layer 1 offers profiling along the whole value chain (Gap 3), stage-specific variability of KPIs for the point of sale (Gap 8), and retail and/or HoReCa-specific KPIs that are explicitly used to inform downstream decisions (Gap 4). Layer 3 presents an SME friendly cost-based scorecard with simplified metrics (Gap 6) and serves as a basis for implementation evidence (Gap 5) to be empirically validated in Article 3 [110].
9.5. Limitations
9.5.1. Methodological Limitations
The framework is presented in a conceptual way, which needs to be supported by a case study application [26]. The expert validation panel can only include 5 experts, is used for only one review round, and gives valuable feedback [76]. A complete multi-round Delphi may have identified more refinements. The illustrated application example is presented as a hypothetical example that can only be implemented with practical tests.
9.5.2. Scope Limitations
The structure is tailored towards an EU regulatory framework and may need to be adapted to other regulatory environments [17]. The SME focus of the framework (Section 7.3.3) is in line with the specific challenges faced by smaller companies. Still, it will not necessarily fully encompass the decision-making processes as found in larger companies where investor relations and corporate governance will also apply [17]. There is limited progress with integration of digital technology; the framework offers an example of setting up decision-support with digital technology without providing detail on implementation [24].
9.5.3. Data Limitations
The framework assumes organisations will have access to operational waste data. In reality, the data may be missing, incomplete, or not fully trusted [23]. To calculate the KPIs, a number of inputs are necessary which might not be readily available for all organisations. Calculations of the Cost Avoidance Ratio and Payback Period have been prepared based upon assumptions which may not be applicable in all situations.
9.6. Link to Article 3: Future Empirical Validation
The framework will serve as a basis for the empirical case study to be carried out in Article 3. In Article 3, the framework will be applied to a real agri-food enterprise(s) based on operational data [25]. The case study will use a ‘mixed methods’ approach, where quantitative feasibility assessment is integrated with qualitative insights from the implementation phase. Results of the enquiries shall be the first empirical test for the applicability of the framework in real practice.
The empirical contributions of Article 3 will consist of a framework that was empirically validated through the three-layer logic of the framework, testing of the original composite indicators, namely the HPS and LRS in real conditions, validation of the adaptability of the framework to SME, identification of the challenges and success factors for implementation, and adaptation of the general framework according to empirical results.
10. Conclusions
10.1. Summary of Contributions
10.1.1. Academic Contributions
There are four interesting academic contributions to this study. It brings the first operational framework that scientifically connects the structural gaps in the food waste scenario with the decision logic of circular economy (CE). This three-layer framework (diagnosis/evaluation--intervention selection--evaluation) highlights the need for long-term progress that is supposed to be made in the field of food waste, a longstanding divide between the identification of food waste issues and the development of practical solutions that could help prevent these losses [14]. Second, the framework creates two new composite indicators, the Hotspot Priority Score and the Lock-in Risk Score, that augment current approaches to measurement in two ways: by aiding in prioritisation and trade-off analysis [14]. Third, it helps to establish a decision support structure within an SC, enabling integration and harmonisation of ISO governance standards (ISO/FDIS 20001, ISO 14001, ISO 59004 and ISO 22000), which enhance the holistic and credible implementation and alignment with the regulatory environment. Lastly, the study provides a development of the normative framework through a methodology that is transparent and draws insights from literature gaps, international standards, and performance indicators.
10.1.2. Practical Contributions
The framework provides a structured approach to moving from identification of food waste to investment decision-making within the organisation [69]. It streamlines the process of implementing CE by providing reproducible diagnostic, selection, and evaluation phases and hence decreases the complexity of the use of consultancy approaches [24]. This renders the framework accessible to organisations with limited resources, such as simplified stock market reporting and applying SME-adapted metrics, while further increasing the readiness of companies to report on their sustainability [23,42].
10.1.3. Policy Contributions
The framework details how EU Farm to Fork objectives will be implemented in terms of actions within an organization to deliver the results, including the 50% reduction in food waste [8]. It also reinforces national food waste policies, integrates with CSRD reporting requirements, and, with the early uptake of ISO/FDIS 20001 [20,42], looks forward and backward to future regulatory needs.
10.2. Answering the Research Questions
The three-layer approach to connect each of the eight structural gaps with specific decision-support elements that address RQ1 is implemented, namely, the prevention-first logic, the profiling of the supply chain, integration of key performance indicators, the economic evaluation, and adaptations at each stage. RQ2 has illustrated how decision-making from diagnosis to selection of intervention and the economic evaluation should be carried out in an ‘IF–THEN’ format. RQ3 ensures that ISO standards and EU regulations are integrated into the three levels of framing of governance, operation, and reporting. RQ4 defines existing KPIs from existing sources and introduces newсад Hotspot Priority Score and Lock-in Risk Score to fill measurement gaps. RQ5 shows that the framework can be implemented at different parts of the value chain and across different sizes of companies with standardized approaches and adapted to local context.
10.3. Policy and Practice Recommendations
Policymakers should consider operational implementation tools along with the policy targets, promote funding that is prevention-oriented, and encourage the use of methodological guidance that are SME friendly and accounts for financial constraints. If you aim for the top of the CE hierarchy, you should take a structured approach to decision support, make certain that investments are made with prevention, not valorisation, in mind, and consider cost-benefit analysis and use of ISO standards as ways to improve governance and compliance. The framework should be tested empirically, for different sectors, with digital technologies (e.g., AI, IoT), and with behavioural aspects involved in minimizing food waste.
10.4. Future Research Directions
Future research will build further on the use of the framework in such agri-food organisations. It will rely on mixed-methods research for testing the practical effectiveness of the framework. Longer-term work should focus on sector-specific adaptation, involve the adoption of digital technologies such as Artificial Intelligence, Internet of Things and Blockchain [24], include international comparison and benchmarking exercises, assess long-term intervention results and explore the integration of broader sustainability aspects, including policy effects, and behavioural aspects aiming at the prevention of food waste.
10.5. Closing Reflection
This study aims to bridge the continuously existing diagnosis-to-implementation gap by presenting an evidence-based framework for the practical implementation of the circular economy within decision-making. The framework reinforces academic knowledge and application through prevention-related interventions, the integration of governance into ISO, adaptability of SMEs, and innovative composite indicators. Expert validation and illustrative implementation build its usability and include a solid baseline for future empirical testing. Overall, the framework facilitates progress towards SDG Target 12.3 and the EU Farm to Fork Strategy by providing organisations with usable tools, which convert sustainability commitments into tangible action. The complete operationalisation of all of the framework KPIs, including detailed methodology sheets and scoring thresholds, is available in Supplementary Material D, which allows independent researchers and practitioners to apply the framework to real business data without any further assumptions.
Supplementary Materials
The following supporting information can be downloaded at the website of this paper posted on Preprints.org.
Author Contributions
Conceptualization, I.K. and I.P.; methodology, I.P. and A.G.; software, P.K.; validation, I.K., P.K. and I.P.; formal analysis, I.P.; investigation, I.K. and P.K.; resources, A.G.; data curation, P.K.; writing—original draft preparation, I.K.; writing—review and editing, I.P. and A.G.; visualization, P.K.; supervision, A.G.; project administration, I.P.; funding acquisition, I.P. All authors have read and agreed to the published version of the manuscript.
Funding
This research received no external funding.
Institutional Review Board Statement
Not applicable.
Informed Consent Statement
Not applicable.
Data Availability Statement
No new data were created or analyzed in this study. Data sharing is not applicable to this article.
Conflicts of Interest
The authors declare no conflicts of interest.
Abbreviations
| AI | Artificial Intelligence |
| CAPEX | Capital Expenditure |
| CAR | Cost Avoidance Ratio |
| CE | Circular Economy |
| CSRD | Corporate Sustainability Reporting Directive |
| DSS | Decision Support System(s) |
| EI | Economic Impact (Index) |
| ESRS | European Sustainability Reporting Standards |
| EU | European Union |
| FAO | Food and Agriculture Organization |
| FDIS | Final Draft International Standard |
| FLI | Food Loss Index |
| FLR | Food Loss Rate |
| FLW | Food Loss and Waste |
| FLW-MSS | Food Loss and Waste Management System Standard |
| FUSIONS | Food Use for Social Innovation by Optimising Waste Prevention Strategies |
| GHG | Greenhouse Gas |
| GRI | Global Reporting Initiative |
| HORECA | Hotel, Restaurant and Catering |
| HPS | Hotspot Priority Score |
| ISO | International Organization for Standardization |
| KPI(s) | Key Performance Indicator(s) |
| KRI(s) | Key Risk Indicator(s) |
| LRS | Lock-in Risk Score |
| MSS | Management System Standard |
| NPV | Net Present Value |
| OPEX | Operational Expenditure |
| PRISMA | Preferred Reporting Items for Systematic Reviews and Meta-Analyses |
| REFRESH | Resource Efficient Food and dRink for the Entire Supply cHain |
| ROI | Return on Investment |
| SCM | Supply Chain Management |
| SDG | Sustainable Development Goal |
| SME(s) | Small and Medium-sized Enterprise(s) |
| UNEP | United Nations Environment Programme |
| UNFCCC | United Nations Framework Convention on Climate Change |
| USD | United States Dollar |
| WRAP | Waste and Resources Action Programme |
Appendix A. Expert Validation Instrument
This appendix presents the complete questionnaire used in the structured single-round expert validation exercise described in Section 8.9. The questionnaire was designed to assess the clarity, completeness, and practical applicability of the proposed three-layer decision-support framework.
Appendix A.1. Participant Information
| Item | Response |
| Role/Position | |
| Years of Experience | |
| Area of Expertise | |
| Organisation Type |
Appendix A.2. Layer 1 (Diagnostic Phase) Questions
Rating Scale: 1 = Strongly Disagree; 2 = Disagree; 3 = Neutral; 4 = Agree; 5 = Strongly Agree
| Item | Rating (1-5) | Comments |
| Clarity of stage profiling methodology | 1 2 3 4 5 | |
| Completeness of waste quantification approach | 1 2 3 4 5 | |
| Practical applicability of hotspot mapping | 1 2 3 4 5 | |
| Appropriateness of Food Loss Rate (FLR) KPI | 1 2 3 4 5 | |
| Appropriateness of Stage Waste Intensity (StWI) KPI | 1 2 3 4 5 | |
| Appropriateness of Hotspot Priority Score (HPS) | 1 2 3 4 5 | |
| Reasonableness of data requirements | 1 2 3 4 5 |
Open-ended Questions:
- What is the greatest strength of Layer 1?
- What is the greatest weakness of Layer 1?
- Suggested improvements:
Appendix A.3. Layer 2 (Selection Phase) Questions
Rating Scale: 1 = Strongly Disagree; 2 = Disagree; 3 = Neutral; 4 = Agree; 5 = Strongly Agree
| Item | Rating (1-5) | Comments |
| Clarity of CE hierarchy logic | 1 2 3 4 5 | |
| Clarity of prevention-first prioritisation | 1 2 3 4 5 | |
| Completeness of intervention selection criteria | 1 2 3 4 5 | |
| Appropriateness of ISO governance anchors | 1 2 3 4 5 | |
| Usefulness of trade-off matrix | 1 2 3 4 5 | |
| Practical applicability of Lock-in Risk Score (LRS) | 1 2 3 4 5 |
Open-ended Questions:
- What is the greatest strength of Layer 2?
- What is the greatest weakness of Layer 2?
- Suggested improvements:
Appendix A.4. Layer 3 (Evaluation Phase) Questions
Rating Scale: 1 = Strongly Disagree; 2 = Disagree; 3 = Neutral; 4 = Agree; 5 = Strongly Agree
| Item | Rating (1-5) | Comments |
| Clarity of cost-benefit indicators | 1 2 3 4 5 | |
| Completeness of economic evaluation | 1 2 3 4 5 | |
| Practical applicability of SME-adapted metrics | 1 2 3 4 5 | |
| Appropriateness of Cost Avoidance Ratio (CAR) | 1 2 3 4 5 | |
| Appropriateness of Payback Period (SME) | 1 2 3 4 5 | |
| Usefulness of CSRD alignment module | 1 2 3 4 5 |
Open-ended Questions:
- What is the greatest strength of Layer 3?
- What is the greatest weakness of Layer 3?
- Suggested improvements:
Appendix B. Complete Operational Framework – Step-by-Step Implementation Guide
This appendix is a comprehensive, practical guide aimed at showing how to apply the proposed three-layer operational decision-support framework. It combines the diagnostic, selection, and evaluation stages into a series of concrete steps, using important formulas, decision rules, and a template feasibility scorecard. The guide is intended for supply chain managers, owners of small and medium-sized enterprises, consultants, and sustainability practitioners who want to progress from diagnosing food waste to making investment decisions that are focused on prevention.
Appendix B.1. Framework Architecture Overview
The framework consists of three sequential layers:
| Layer | Phase | Purpose | Key Output |
| Layer 1 | Diagnostic – Hotspot Mapping | Identify and prioritise food waste hotspots across supply chain stages | Hotspot Priority Profile (with HPS scores) |
| Layer 2 | Selection – Intervention Pathway Design | Identify CE-aligned, prevention-first interventions and assess lock-in risks | Ranked shortlist of interventions (with LRS and CE scores) |
| Layer 3 | Evaluation – Cost-Based Feasibility Assessment | Assess economic feasibility, carbon savings, and regulatory reporting alignment | Feasibility Scorecard (investment recommendation) |
The framework follows a sequential logic: diagnosis → intervention selection → economic evaluation.
Appendix B.2. Layer 1 – Diagnostic Phase: Hotspot Mapping
Objective: To systematically identify, quantify, and prioritise food waste hotspots across the supply chain.
Step 1: Scope Delimitation
Define the boundaries of the analysis. Specify which supply chain stages are included (e.g., primary production, processing, distribution, retail, HoReCa, consumer). For an SME, start with the stage(s) under direct operational control.
Step 2: Data Collection
Collect waste quantification data from operational records. Minimum required data per stage:
- Total input (kg or tonnes per year).
- Total waste generated (kg or tonnes per year), disaggregated by waste type/cause.
Example Data Collection Table:
| Stage | Annual Input (tonnes) | Total Waste (tonnes) | Waste Types / Causes |
| Processing | 500 | 40 | Packaging scrap (18 t), batch-size mismatch (12 t), quality rejection (6 t), other (4 t) |
Step 3: Loss Classification
Classify waste according to the FUSIONS taxonomy by cause category:
- Overproduction
- Quality / specification rejection
- Storage / handling damage
- Expiry / date labelling
- Portion / plate waste
- Processing / packaging defects
- Other
Calculate the Loss Typology Index = (waste_by_cause / total_waste) × 100.
Step 4: Stakeholder Mapping
For each hotspot, identify:
- Primary decision-makers (operational control over the process).
- Secondary influencers (contracts, specifications, regulations).
- Affected stakeholders (economic, environmental, or social impacts).
Step 5: Calculate Hotspot Priority Score (HPS)
For each combination of stage and loss type, compute:
HPS = FLR × EI × F
Where:
- FLR (Food Loss Rate) = (waste_kg / input_kg) × 100 (%)
- EI (Economic Impact Index) = 1–5 scale (1 = low economic value lost; 5 = high economic value lost). Derive from cost accounting or REFRESH cost benchmarks [65].
- F (Frequency Index) = 1–5 scale (1–2 = episodic loss; 3 = periodic; 4–5 = chronic / daily occurrence).
Interpretation:
- HPS ≥ 60 → High priority (urgent intervention required)
- HPS 30–59 → Medium priority (consider intervention)
- HPS < 30 → Low priority (monitor periodically)
Step 6: Prioritisation
Rank all identified hotspots by descending HPS. Select the top 1–3 hotspots as primary targets for Layer 2.
Step 7: Output – Hotspot Priority Profile
Generate a stage-by-loss-type matrix with HPS values (see Figure 3 in main text for a heat map visualisation). This profile is the input to Layer 2.
Appendix B.3. Layer 2 – Selection Phase: Intervention Pathway Design
Objective: To identify and select CE-aligned, prevention-first interventions for each priority hotspot.
Step 1: Identify Candidate Interventions
For each priority hotspot, brainstorm all possible interventions across the CE hierarchy:
- Prevention (root-cause elimination)
- Redistribution (surplus food for human use)
- Valorisation (recycling, composting, bioenergy)
- Disposal (landfill, incineration – last resort)
Step 2: Apply CE Hierarchy (Prevention-First Logic)
Mandatory decision rule:
If a feasible prevention intervention exists, it must be selected over redistribution, valorisation, or disposal.
A deviation (selecting valorisation over prevention) requires explicit written justification (e.g., “Prevention is technically infeasible because...”, “Prevention would require capital investment beyond SME capacity...”).
Refer to Table 7 (Decision Logic Matrix) in the main text for stage-specific guidance.
Step 3: Apply ISO Governance Filters
Screen interventions against ISO requirements (see Table 3 in main text):
- ISO 14001 – Environmental management criteria.
- ISO 22000 – Food safety constraints.
- ISO/FDIS 20001 – FLW management system principles.
- ISO 59004 – CE transition criteria.
Calculate the ISO Compliance Level = (requirements_met / total_requirements) × 100. Interventions with compliance < 70% should be reconsidered or modified.
Step 4: Calculate Lock-in Risk Score (LRS)
For each candidate intervention, compute:
LRS = R × D
Where:
-
R (Reversibility Index) = 1–5 scale
- o
- 1–2: Easily reversible (training, process changes)
- o
- 3: Moderately reversible (equipment modifications)
- o
- 4–5: Irreversible (capital infrastructure, proprietary tech, long-term contracts)
-
D (Dependency Score) = 1–5 scale
- o
- 1–2: Low dependency (multiple suppliers, flexible technology)
- o
- 3: Moderate dependency (few suppliers)
- o
- 4–5: High dependency (single supplier, proprietary platform)
Interpretation:
- LRS ≤ 4 → Low lock-in risk (favourable)
- LRS 5–12 → Moderate lock-in risk (proceed with caution)
- LRS ≥ 13 → High lock-in risk (avoid unless no alternative)
Step 5: Calculate CE Alignment Score
CE Alignment Score = hierarchy_level × impact_scope (see Table 6 in main text).
| Intervention Type | Hierarchy Level (1–5) | Typical Score Range |
| Prevention | 5.0 | 4.0 – 5.0 |
| Redistribution | 4.0 | 3.0 – 4.0 |
| Valorisation | 3.0 | 2.0 – 3.5 |
| Disposal | 1.0 – 2.0 | 0.5 – 2.0 |
Step 6: Trade-off Matrix Assessment
Compare candidate interventions across three dimensions:
| Intervention | CE Alignment Score | Lock-in Risk Score (LRS) | Co-benefits (cost savings, carbon reduction, reputation) |
| Prevention A | |||
| Prevention B | |||
| Valorisation | |||
Decision Rule: Select the intervention with the highest CE Alignment Score, lowest LRS, and significant co-benefits. Prevention pathways should be prioritised even if valorisation appears to offer higher short-term revenue, due to lower lock-in risk and root-cause addressing.
Step 7: Output – Ranked Shortlist
Generate a shortlist containing:
- Recommended prevention intervention
- 1–2 alternative pathways (if applicable)
- Explicit justification for prevention priority
- LRS and CE Alignment Score for each candidate
Appendix B.4. Layer 3 – Evaluation Phase: Cost-Based Feasibility Assessment
Objective: To evaluate the economic feasibility, carbon savings, and regulatory reporting alignment of the recommended intervention.
Step 1: Calculate Cost Avoidance Ratio (CAR)
CAR = Avoided Cost / Intervention Cost
Where:
- Avoided Cost = waste disposal savings + material cost savings + compliance savings + risk reduction benefits (€ per year)
- Intervention Cost = CAPEX + first-year OPEX (€)
Interpretation:
- CAR > 1.5 → Strong economic case (PROCEED)
- CAR 1.0 – 1.5 → Moderate case (conduct sensitivity analysis)
- CAR < 1.0 → Weak case (reconsider intervention or seek alternative)
Step 2: Calculate SME-Adapted Payback Period
Payback Period (months) = CAPEX / Annual Savings
Where:
- Annual Savings = Avoided Cost + By-product Revenue + Compliance Savings – Annual OPEX
Interpretation:
- < 12 months → Strong economic case
- 12 – 24 months → Moderate economic case (discuss financing options)
- 24 months → Weak economic case (consider alternative interventions)
Step 3: Calculate Carbon Savings (tCO2e per year)
Carbon Savings = Σ (waste_kg × emission_factor)
Use emission factors from ISO 14067 [62] or WRAP [115] (e.g., packaging waste: 0.5 tCO2e/tonne; food waste: 1.2 tCO2e/tonne).
Step 4: Assess CSRD Materiality Score
CSRD Materiality Score = Impact Materiality × Financial Materiality
| Dimension | Score | Description |
| Impact Materiality | 1–5 | Impact of organisation on food waste (1 = negligible; 5 = significant) |
| Financial Materiality | 1–5 | Impact of food waste on organisation (1 = negligible; 5 = significant) |
Interpretation:
- Score ≥ 16 → High materiality (strong reporting relevance)
- Score 9–15 → Moderate materiality
- Score ≤ 8 → Low materiality
Step 5: Compile Feasibility Scorecard
Complete the template provided in Section B.6 below. The scorecard summarises all key metrics and supports the final investment decision.
Appendix B.5. Summary of Key Formulas and Thresholds
| Metric | Formula | Thresholds |
| FLR | (waste_kg / input_kg) × 100 | Compare across stages |
| HPS | FLR × EI × F | ≥ 60 = High; 30–59 = Medium; < 30 = Low |
| LRS | R × D | ≤ 4 = Low; 5–12 = Moderate; ≥ 13 = High |
| CAR | Avoided Cost / Intervention Cost | > 1.5 = Strong; 1.0–1.5 = Moderate; < 1.0 = Weak |
| Payback (SME) | CAPEX / Annual Savings | < 12 m = Strong; 12–24 m = Moderate; > 24 m = Weak |
| Carbon Savings | Σ (waste_kg × EF) | Report in tCO2e/year |
| CSRD Materiality | Impact × Financial | ≥ 16 = High; 9–15 = Moderate; ≤ 8 = Low |
| ISO Compliance Level | (met / total) × 100 | ≥ 70% = Compliant |
Appendix B.6. Feasibility Scorecard Template
Organisation Name: _______________________ Date: _________________
Hotspot Description (from Layer 1):
- Supply Chain Stage: _________________________
- Loss Type: __________________________________
- HPS Score: ________ (Priority: High / Medium / Low)
- Key Stakeholders: ___________________________
Intervention Recommendation (from Layer 2):
- Recommended Intervention: ___________________
- CE Alignment Score: ________ / 5.0
- Lock-in Risk Score (LRS): ________ / 5.0 (Low / Moderate / High)
- Justification for Prevention Priority: ___________________________________
Economic Analysis (from Layer 3):
| Metric | Value | Assessment |
| Cost Avoidance Ratio (CAR) | ____× | Strong / Moderate / Weak |
| Payback Period (SME) | ____ months | Strong / Moderate / Weak |
| Carbon Savings | ____ tCO2e/year | Report value |
| CSRD Materiality Score | ____ / 25 | High / Moderate / Low |
Risk Assessment:
- Key Risks: ____________________________________
- Mitigation Actions: ___________________________
Implementation Roadmap:
| Phase | Action | Timeline | Responsible |
| 1 | |||
| 2 | |||
| 3 |
Final Recommendation:
PROCEED – Strong economic case, low lock-in risk, high CE alignment.
PROCEED WITH CAUTION – Moderate case; conduct further sensitivity analysis.
REJECT / ALTERNATIVE – Weak case; consider alternative intervention.
Sign-off: _________________________ Date: _______________
References
- UNEP. UNEP Food Waste Index Report 2021. United Nations Environment Programme. 2021. Available online: https://www.unep.org/resources/report/unep-food-waste-index-report-2021 (accessed on 27 June 2026).
- UNFCCC. Food Loss and Waste Account for 8-10% of Annual Global Greenhouse Gas Emissions; Cost USD 1 Trillion Annually. Available online: https://unfccc.int/news/food-loss-and-waste-account-for-8-10-of-annual-global-greenhouse-gas-emissions-cost-usd-1-trillion (accessed on 27 June 2026).
- UNEP. Food Loss and Waste. Available online: https://www.unep.org/topics/food-systems/food-loss-and-waste (accessed on 13 April 2026).
- Laaninen, T.; Calasso, M. Reducing food waste in the European Union. European Parliamentary Research Service. 2020. Available online: https://www.europarl.europa.eu/RegData/etudes/BRIE/2020/659376/EPRS_BRI(2020)659376_EN.pdf (accessed on 27 June 2026).
- Eurostat. Food waste and food waste prevention - estimates - Statistics Explained. Available online: https://ec.europa.eu/eurostat/statistics-explained/index.php/Food_waste_and_food_waste_prevention_-_estimates (accessed on 27 June 2026).
- Sgroi, F.; Marino, G. Environmental and digital innovation in food: The role of digital food hubs in the creation of sustainable local agri-food systems. Sci. Total Environ. 2021, 810, 152257. [Google Scholar] [CrossRef] [PubMed]
- Ardra, S.; Barua, M.K. Halving food waste generation by 2030: The challenges and strategies of monitoring UN sustainable development goal target 12.3. J. Clean. Prod. 2022, 380, 135042. [Google Scholar] [CrossRef]
- European Council. From farm to fork. Available online: https://www.consilium.europa.eu/en/policies/from-farm-to-fork/ (accessed on 27 June 2026).
- Ellen MacArthur Foundation. Towards the Circular Economy: Economic and business rationale for an accelerated transition; Ellen MacArthur Foundation, 2013. [Google Scholar]
- Domenech, T.; Borrion, A. Embedding Circular Economy Principles into Urban Regeneration and Waste Management: Framework and Metrics. Sustainability 2022, 14, 1293. [Google Scholar] [CrossRef]
- Gonçalves, M.L.M.B.B.; Maximo, G.J. Circular economy in the food chain: production, processing and waste management. Circ. Econ. Sustain. 2022, 3, 1405–1423. [Google Scholar] [CrossRef] [PubMed]
- Hafiane, A.E.; En-Nadi, A.; Ramadany, M. Towards Sustainable Construction: Systematic Review of Lean and Circular Economy Integration. Sustainability 2025, 17, 6735. [Google Scholar] [CrossRef]
- Ouro-Salim, O.; Ramos, H.R.; Fanho, A.D. Upcycling as a circular strategy for food waste valorization in developing countries: A systematic review and the upgrade strategic framework. Urban Agric. Reg. Food Syst. 2026, 11. [Google Scholar] [CrossRef]
- Kontaki, I.; Garefalakis, A.; Passas, I.; Samaras, I. Implementing a circular economy approach to prevent food waste: A comprehensive synthesis of strategies, metrics, and systemic deficiencies. 2026. [Google Scholar]
- Becerra, L.; Carenzo, S.; Juárez, P. When Circular Economy Meets Inclusive Development. Insights from Urban Recycling and Rural Water Access in Argentina. Sustainability 2020, 12, 9809. [Google Scholar] [CrossRef]
- Lit, F.C.; Huijben, J.C.; Cloodt, M.M.; Paredis, E. Business model innovation in circular start-ups: Overcoming barriers in the circular plastics economy. Int. Small Bus. J. 2024, 42, 506–550. [Google Scholar] [CrossRef]
- Silvestri, C.; Silvestri, L.; Piccarozzi, M.; Ruggieri, A. Toward a framework for selecting indicators of measuring sustainability and circular economy in the agri-food sector: a systematic literature review. Int. J. Life Cycle Assess. 2022, 29, 1446–1484. [Google Scholar] [CrossRef]
- Munonye, W.C. Towards Circular Economy Metrics: a Systematic Review. Circ. Econ. Sustain. 2025, 5, 4093–4135. [Google Scholar] [CrossRef]
- Abu-Bakar, H.; Charnley, F. Developing a Strategic Methodology for Circular Economy Roadmapping: A Theoretical Framework. Sustainability 2024, 16, 6682. [Google Scholar] [CrossRef]
- ISO/FDIS 20001; Food loss and waste management system — Requirements for the prevention and minimization of food loss and waste across the food supply chain. International Organization for Standardization, 2025. Available online: https://www.iso.org/standard/20001.
- European Union. Directive 2008/98/EC of the European Parliament and of the Council on waste. Official Journal of the European Union. 2008. Available online: https://eur-lex.europa.eu/eli/dir/2008/98/oj/eng.
- Caldeira, C.; De Laurentiis, V.; Corrado, S.; van Holsteijn, F.; Sala, S. Quantification of food waste per product group along the food supply chain in the European Union: a mass flow analysis. Resour. Conserv. Recycl. 2019, 149, 479–488. [Google Scholar] [CrossRef] [PubMed]
- Begimkulov, E.; Darr, D. Scaling strategies and mechanisms in small and medium enterprises in the agri-food sector: a systematic literature review. Front. Sustain. Food Syst. 2023, 7. [Google Scholar] [CrossRef]
- Fatorachian, H.; Kazemi, H.; Pawar, K. Digital Technologies in food Supply Chain Waste Management: A case study on sustainable practices in smart cities. Sustainability 2025, 17, 1996. [Google Scholar] [CrossRef]
- Kusumowardani, N.; Tjahjono, B.; Lazell, J.; Bek, D.; Theodorakopoulos, N.; Andrikopoulos, P.; Priadi, C.R. A circular capability framework to address food waste and losses in the agri-food supply chain: The antecedents, principles and outcomes of circular economy. J. Bus. Res. 2021, 142, 17–31. [Google Scholar] [CrossRef]
- Hevner, A.R.; March, S.T.; Park, J.; Ram, S. Design science in information systems research. MIS Q. 2004, 28, 75–105. [Google Scholar] [CrossRef]
- Geissdoerfer, M.; Savaget, P.; Bocken, N.M.P.; Hultink, E.J. The Circular Economy – A new sustainability paradigm? J. Clean. Prod. 2017, 143, 757–768. [Google Scholar] [CrossRef]
- Rahaman, M.; Pranta, A.D. Transitioning from Linear to Circular Economy in Textiles and Apparel: Significance, Case Studies, Innovations, and Research Directions. Mater. Circ. Econ. 2025, 7. [Google Scholar] [CrossRef]
- Nosková, M. Conceptualizing the Circular Economy: R-Frame question. Green Low.-Carbon Econ. 2025, 3, 350–362. [Google Scholar] [CrossRef]
- Viscardi, S.; Colicchia, C.; Creazza, A. Preventing and recovering food waste in manufacturing Firms: A Contingency Perspective on Circular Economy Practices. Bus. Strategy Environ. 2025, 35, 1902–1929. [Google Scholar] [CrossRef]
- Dzhengiz, T.; Miller, E.M.; Ovaska, J.; Patala, S. Unpacking the circular economy: A problematizing review. Int. J. Manag. Rev. 2023, 25, 270–296. [Google Scholar] [CrossRef]
- Otasowie, O.; Aigbavboa, C.O.; Oke, A.E. Theoretical perspectives on circular economy in organisations and policies. In Green Energy and Technology; Springer, 2025; pp. 33–70. [Google Scholar] [CrossRef]
- Setyadi, A.; Pawirosumarto, S.; Damaris, A. Embedding Circular Operations in Manufacturing: A Conceptual model for operational Sustainability and Resource efficiency. Sustainability 2025, 17, 6737. [Google Scholar] [CrossRef]
- Handayati, Y.; Widyanata, C. Effective food waste management model for the sustainable agricultural food supply chain. Sci. Rep. 2024, 14, 10290. [Google Scholar] [CrossRef] [PubMed]
- Christopher, M. Logistics & Supply Chain Management, 5th ed.; Pearson, 2016. [Google Scholar]
- Davoudi, S.; Stasinopoulos, P.; Shiwakoti, N. Advancing Sustainability in meat Cold Chains: Adoption Determinants of Real-Time Visibility Technologies in Australia. Sustainability 2025, 17, 7936. [Google Scholar] [CrossRef]
- Mirabelli, G.; Solina, V. Optimization strategies for the integrated management of perishable supply chains: A literature review. J. Ind. Eng. Manag. 2022, 15, 58. [Google Scholar] [CrossRef]
- Tan, Y.; Hai, F.; Popp, J.; Oláh, J. Minimizing waste in the food supply chain: Role of information system, supply chain strategy, and network design. Sustainability 2022, 14, 11515. [Google Scholar] [CrossRef]
- Renkema-Singh, M.; Fobbe, L.; Hilletofth, P. Mapping and innovating business models of food hubs in short food supply chains. Corp. Soc. Responsib. Environ. Manag. 2025. [Google Scholar] [CrossRef]
- Jacob-John, J.; D’Souza, C.; Marjoribanks, T.; Singaraju, S. Sustainable Development Goals: a review of SDG 12.3 in food supply chain literature. Benchmarking An. Int. J. 2022, 30, 3465–3481. [Google Scholar] [CrossRef]
- DiMaggio, P.J.; Powell, W.W. The iron cage revisited: Institutional isomorphism and collective rationality in organizational fields. Am. Sociol. Rev. 1983, 48, 147–160. [Google Scholar] [CrossRef]
- European Parliament. Directive (EU) 2022/2464 on corporate sustainability reporting. Official Journal of the European Union. 2022. Available online: https://eur-lex.europa.eu/eli/dir/2022/2464/oj/eng.
- Prasanna, S.; Verma, P.; Bodh, S. The role of food industries in sustainability transition: a review. Environ. Dev. Sustain. 2024, 27, 15113–15133. [Google Scholar] [CrossRef]
- Environmental management systems — Requirements with guidance for use. ISO 14001:2015; International Organization for Standardization. 2015. Available online: https://pecb.com/en/whitepaper/iso-140012015-environmental-management-systems-requirements.
- ISO 59004:2024; Circular economy — Vocabulary, principles and guidance for implementation. International Organization for Standardization, 2024.
- ISO 22000:2018; Food safety management systems — Requirements for any organization in the food chain. International Organization for Standardization, 2018.
- Keen, P.G.W.; Scott Morton, M.S. Decision Support Systems: An Organizational Perspective; Addison-Wesley, 1978. [Google Scholar]
- Turban, E.; Sharda, R.; Delen, D. Decision Support and Business Intelligence Systems, 9th ed.; Pearson, 2015. [Google Scholar]
- Shadid, N.; Ahmed, V.; Bahroun, Z. A systematic review of data-driven approaches to food waste and loss management. Clean. Waste Syst. 2025, 12, 100448. [Google Scholar] [CrossRef]
- Balasbaneh, A.T.; Aldrovandi, S.; Sher, W. A Systematic review of implementing Multi-Criteria Decision-Making (MCDM) approaches for the Circular Economy and Cost assessment. Sustainability 2025, 17, 5007. [Google Scholar] [CrossRef]
- Hermans, T.; Beintema, N.; Alho, C.F.B.V.; Van Der Poel, M. Experiences in Assessing the Impact of Circular Economy Interventions in Agrifood Systems—A Review. Sustainability 2025, 17, 1406. [Google Scholar] [CrossRef]
- Pimentel, B.F.; Misopoulos, F.; Davies, J. A review of factors reducing waste in the food supply chain: The retailer perspective. Clean. Waste Syst. 2022, 3, 100028. [Google Scholar] [CrossRef]
- Thaha, A.N.; Ghamari, M.; Jothiprakash, G.; Velusamy, S.; Karthikeyan, S.; Ramesh, D.; Sundaram, S. High impact biomass valorization for second generation biorefineries in India: recent developments and future strategies for sustainable circular economy. Biomass 2025, 5, 16. [Google Scholar] [CrossRef]
- Muñoz-Torres, M.J.; Ferrero-Ferrero, I.; Gisbert-Navarro, J.V.; Rivera-Lirio, J.M. Environmental assessment of food loss and waste prevention and reduction solutions: Navigating the complexity of integrating stakeholders’ decisions. Environ. Impact Assess. Rev. 2024, 112, 107788. [Google Scholar] [CrossRef]
- Almusaed, A.; Almssad, A.; Yitmen, I. Writing the literature review. In Practice of Research Methodology in Civil Engineering and Architecture; Springer, 2025; pp. 723–752. [Google Scholar] [CrossRef]
- Gennari, F. The transition towards a circular economy. A framework for SMEs. J. Manag. Gov. 2022, 27, 1423–1457. [Google Scholar] [CrossRef]
- European Commission. Roadmap to a Resource Efficient Europe. COM(2011) 571 final. 2011. [Google Scholar] [PubMed]
- Cano, J.A.; Londoño-Pineda, A.; Campo, E.A.; Gruchmann, T.; Weyers, S. Circular Supply Chain Management Assessment: A Systematic Literature Review. Environments 2025, 12, 374. [Google Scholar] [CrossRef]
- Page, M.J.; McKenzie, J.E.; Bossuyt, P.M.; et al. The PRISMA 2020 statement: an updated guideline for reporting systematic reviews. BMJ 2021, 372, n71. [Google Scholar] [CrossRef] [PubMed]
- Cohen, J. A coefficient of agreement for nominal scales. Educ. Psychol. Meas. 1960, 20, 37–46. [Google Scholar] [CrossRef]
- Pauwels, M.; Reich, R.; Vercalsteren, A.; Christis, M.; Alaerts, L.; Van Acker, K. Understanding the problem space for effective use of a circular economy monitor in policy making. In Lecture Notes in Computer Science; Springer, 2024; pp. 163–178. [Google Scholar] [CrossRef] [PubMed]
- ISO 14067:2018; Greenhouse gases — Carbon footprint of products — Requirements and guidelines for quantification. International Organization for Standardization, 2018.
- Hoehn, D.; Vázquez-Rowe, I.; Kahhat, R.; Margallo, M.; Laso, J.; Fernández-Ríos, A.; Ruiz-Salmón, I.; Aldaco, R. A critical review on food loss and waste quantification approaches: Is there a need to develop alternatives beyond the currently widespread pathways? Resour. Conserv. Recycl. 2022, 188, 106671. [Google Scholar] [CrossRef]
- FUSIONS. FUSIONS Definitional Framework for Food Waste; EU FUSIONS Project, 2014. [Google Scholar]
- Broeze, J.; Luyckx, K. Identification of food waste conversion barriers (REFRESH Deliverable D6.11). REFRESH. Proj. 2019. [Google Scholar]
- FAO. The State of Food and Agriculture 2019: Moving forward on food loss and waste reduction; Food and Agriculture Organization of the United Nations, 2019. [Google Scholar]
- GRI 306:2020; Waste. Global Reporting Initiative, 2020.
- Ma, L.; Hong, L.; Liang, X. Integrating ecological and economic approaches for ecosystem services and biodiversity conservation: Challenges and opportunities. Ecologies 2025, 6, 70. [Google Scholar] [CrossRef]
- Chakraborty, A.; De, D.; Dey, P.K. Circular Economy in Small and Medium-Sized Enterprises—Current Trends, practical challenges and Future Research agenda. Systems 2025, 13, 200. [Google Scholar] [CrossRef]
- Gyoh, L.; Ebohon, O.J.; Zhou, J.; Ogan, D.D. Integrating Circular Economy Principles into Energy-Efficient Retrofitting of Post-1950 UK Housing Stock: A Pathway to Sustainable Decarbonisation. Buildings 2026, 16, 262. [Google Scholar] [CrossRef]
- Ghosh, S.; Raut, R.D.; Cheikhrouhou, N.; Sinha, S.; Ray, A. Attaining Sustainable Development Goals through embedding circular economy principles: Evidence from food processing small- and medium-sized enterprises in India. Bus. Strategy Environ. 2023, 33, 2193–2224. [Google Scholar] [CrossRef]
- Heydari, M. Cultivating sustainable global food supply chains: A multifaceted approach to mitigating food loss and waste for climate resilience. J. Clean. Prod. 2024, 442, 141037. [Google Scholar] [CrossRef]
- Sehnem, S.; Bispo, D.S.; João, J.O.; De Souza, M.a.L.; Bertoglio, O.; Ciotti, R.; Deon, S.M. Upscaling circular economy in foodtechs businesses in emergent countries: Towards sustainable development through natural resource based view. Sustain. Dev. 2022, 30, 1200–1221. [Google Scholar] [CrossRef]
- Montag, L. Circular Economy and Supply Chains: Definitions, conceptualizations, and research Agenda of the Circular Supply Chain Framework. Circ. Econ. Sustain. 2022, 3, 35–75. [Google Scholar] [CrossRef] [PubMed]
- Carvalho, R.; Lucas, M.R.; Marta-Costa, A. Food Waste Reduction: A Systematic literature review on integrating policies, consumer behavior, and innovation. Sustainability 2025, 17, 3236. [Google Scholar] [CrossRef]
- Vittuari, M.; Herrero, L.G.; Masotti, M.; Iori, E.; Caldeira, C.; Qian, Z.; Bruns, H.; Van Herpen, E.; Obersteiner, G.; Kaptan, G.; et al. How to reduce consumer food waste at household level: A literature review on drivers and levers for behavioural change. Sustain. Prod. Consum. 2023, 38, 104–114. [Google Scholar] [CrossRef]
- Mkhitaryan, K.; Kocharyan, M.; Harutyunyan, H.; Sanamyan, A.; Karakhanyan, S. Sustainability Indicators and Urban Decision-Making: A Multi-Layer Framework for Evidence-Based Urban Governance. Urban Sci. 2026, 10, 70. [Google Scholar] [CrossRef]
- Xue, L.; Song, G.; Liu, G. Wasted Food, Wasted Resources? A Critical review of environmental impact Analysis of food loss and waste generation and treatment. Environ. Sci. Technol. 2024, 58, 7240–7255. [Google Scholar] [CrossRef] [PubMed]
- Blackburn, O.; Ritala, P.; Keränen, J.; Bocken, N. Circular Economy Platforms: A Systematic Review. Bus. Strategy Environ. 2025, 35, 2810–2841. [Google Scholar] [CrossRef]
- Wilson, B.M.; Delmas, M.A.; Rajagopal, D. Behavioral interventions for waste reduction: a systematic review of experimental studies. Front. Psychol. 2025, 16, 1561467. [Google Scholar] [CrossRef] [PubMed]
- Buczacki, A.; Gładysz, B.; Palmer, E. HORECA Food Waste and Sustainable Development Goals—A Systemic View. Sustainability 2021, 13, 5510. [Google Scholar] [CrossRef]
- Traverso, M.; Mankaa, R.; Pedalá, M.C.; Covais, A. Social Hotspot analysis of the e-waste sector in Ghana and Nigeria. Waste Manag. 2024, 183, 271–277. [Google Scholar] [CrossRef] [PubMed]
- Lwesya, F.; Achanta, J. Mapping research trends on food supply chain: a bibliometric analysis. J. Agribus. Dev. Emerg. Econ. 2022, 14, 496–518. [Google Scholar] [CrossRef]
- Olabode, O.; Kumar, N.; De, D. Food loss and waste management in the retail food supply chain: Methods and framework to achieve environmental sustainability. J. Environ. Manag. 2025, 387, 125718. [Google Scholar] [CrossRef] [PubMed]
- Adelodun, B.; Agbelusi, O.O.; Soma, T.; Odey, G.; Adeyi, Q.; Kumar, P.; Ajibade, F.O.; Goala, M.; Silva, L.F.O.; Mostafa, Y.S.; et al. Rethinking food loss and waste to promote sustainable resource use and climate change mitigation in agri-food systems: A review. Waste Manag. Res. 2024, 43, 490–506. [Google Scholar] [CrossRef] [PubMed]
- Pandhi, S.; Mahato, D.K.; Kurian, A.; Pandey, S.; Thamarai, A.; Gaur, V.; Kamle, M.; Shukla, A.C.; Kumar, P. Transforming agri-food waste into value: Sustainable approaches for next-generation resistant starch production. Bioresour. Technol. 2025, 437, 133090. [Google Scholar] [CrossRef] [PubMed]
- Habib, M.; Lyons, B.; Renando, C. Adoption challenges of environmental monitoring practices: case study of temperature data loggers in selected Australian vegetable supply chains. Appl. Water Sci. 2024, 14. [Google Scholar] [CrossRef]
- Ikpe, V.; Shamsuddoha, M. Functional Model of Supply Chain Waste Reduction and Control Strategies for Retailers—The USA Retail Industry. Logistics 2024, 8, 22. [Google Scholar] [CrossRef]
- Sigala, E.G.; Gerwin, P.; Chroni, C.; Abeliotis, K.; Strotmann, C.; Lasaridi, K. Reducing food waste in the HORECA sector using AI-based waste-tracking devices. Waste Manag. 2025, 198, 77–86. [Google Scholar] [CrossRef] [PubMed]
- Llagas, B.R.; Jenkins, E.L.; Brennan, L.; Parker, L.; Schivinski, B.; Lockrey, S. Consumer perceptions of date labelling and storage advice and its relationship with food waste: A systematic scoping review of the academic & grey literature. Future Foods 2025, 11, 100577. [Google Scholar] [CrossRef]
- Figueirinhas, D.; Hellström, D.; Pålsson, H.; Vakulenko, Y. Impact of packaging and recycling systems on material recirculation: a Stage-Decomposition model. Packag. Technol. Sci. 2026. [Google Scholar] [CrossRef]
- Jha, S.; Nanda, S.; Zapata, O.; Acharya, B.; Dalai, A.K. A review of systems thinking perspectives on sustainability in bioresource waste management and circular economy. Sustainability 2024, 16, 10157. [Google Scholar] [CrossRef]
- Utama, I.M.S.; Widia, I.W.; Arthawan, I.G.K.A.; Parker, J.B.; Arya, N.N.; Sayaka, B.; Widyastuti, S.; Dahlanuddin; Djarkasi, G.S.S.; Sumual, M.F.; et al. From farm to HORECA: advancing sustainable value chains for tourism-driven agribusiness in Indonesia. Front. Sustain. Food Syst. 2025, 9. [Google Scholar] [CrossRef]
- Doetsch, S.; Huchzermeier, A. The intersection of supply chain resilience and sustainability from a theoretical and practical perspective: An integrated framework. J. Clean. Prod. 2024, 484, 144306. [Google Scholar] [CrossRef]
- Vidanagamachchi, K.; Ginige, A.; Nakandala, D. Viable Agri-Food Supply Chains: Survival through Systemic adaptations. Systems 2025, 13, 1056. [Google Scholar] [CrossRef]
- Papargyropoulou, E.; Lozano, R.; K. Steinberger, J.; Wright, N.; Ujang, Z. bin. The food waste hierarchy as a framework for the management of food surplus and food waste. J. Clean. Prod. 2014, 76, 106–115. [Google Scholar] [CrossRef]
- Abu-Bakar, H.; Charnley, F.; Hopkinson, P.; Morasae, E.K. Towards a typological framework for circular economy roadmaps: A comprehensive analysis of global adoption strategies. J. Clean. Prod. 2023, 434, 140066. [Google Scholar] [CrossRef]
- Fesenfeld, L.; Rudolph, L.; Bernauer, T. Policy framing, design and feedback can increase public support for costly food waste regulation. Nat. Food 2022, 3, 227–235. [Google Scholar] [CrossRef] [PubMed]
- Versino, F.; Ortega, F.; Monroy, Y.; Rivero, S.; López, O.V.; García, M.A. Sustainable and Bio-Based Food Packaging: A review on past and current design innovations. Foods 2023, 12, 1057. [Google Scholar] [CrossRef] [PubMed]
- Björklund, M.; Gillström, H.; Kovács, G. Balancing costs and benefits in the food redistribution supply chain. Int. J. Logist. Manag. 2025, 36, 178–199. [Google Scholar] [CrossRef]
- Cain, A.; Gupta, A. The role of just transition in advancing circular economy policy: a critical review. Circ. Econ. Sustain. 2025, 5. [Google Scholar] [CrossRef]
- Carnia, E.; Saputra, M.P.A.; Mashadi; Sukono; Hs, A.a.S.; Lestari, M.; Zamri, N.; Azahra, A.S. An Integrated Weighted Fuzzy N-Soft Set–CODAS Framework for Decision-Making in Circular Economy-Based waste Management supporting the Blue Economy: a case study of the Citarum River Basin, Indonesia. Mathematics 2026, 14, 238. [Google Scholar] [CrossRef]
- Messner, R.; Johnson, H.; Richards, C. Towards systemic solutions to food waste: Creative destabilisation and escaping food waste lock-in. J. Rural Stud. 2022, 92, 180–188. [Google Scholar] [CrossRef]
- Amir, S.; Salehi, N.; Roci, M.; Sweet, S.; Rashid, A. Towards circular economy: A guiding framework for circular supply chain implementation. Bus. Strategy Environ. 2022, 32, 2684–2701. [Google Scholar] [CrossRef]
- Widianarko, B.; Hantoro, I.; Putri, N.I.; Nugrahedi, P.Y. Transforming food systems in Semarang City, Indonesia: A short food supply chain model. Open Agric. 2025, 10. [Google Scholar] [CrossRef]
- Dhiman, S.; Thakur, B.; Kaur, S.; Ahuja, M.; Gantayat, S.; Sarkar, S.; Singh, R.; Tripathi, M. Closing the loop: technological innovations in food waste valorisation for global sustainability. Discov. Sustain. 2025, 6. [Google Scholar] [CrossRef]
- Ezeudu, O.B.; Bristow, D. Financing methods for solid waste management: A review of typology, classifications, and circular economy implications. Sustain. Dev. 2024, 33, 3062–3085. [Google Scholar] [CrossRef]
- Aitken, J.A.; Alaybek, B.; Hartman, R.; Mika, G.; Leib, E.M.B.; Plekenpol, R.; Branting, K.; Rao, D.; Leets, L.; Sprenger, A. Initial assessment of the efficacy of food recovery policies in US States for increasing food donations and reducing waste. Waste Manag. 2024, 176, 149–158. [Google Scholar] [CrossRef] [PubMed]
- Garima; Olaru, D.; Smith, B.; Siddique, K.H.M. Decision-Making in grain supply chains for sustainable food system. Sustainability 2024, 16, 10816. [Google Scholar] [CrossRef]
- Albanna, A.; Yaqot, M.; Menezes, B.C. Investment strategies in Industry 4.0 for enhanced supply chain resilience: an empirical analysis. Cogent Bus. Manag. 2024, 11. [Google Scholar] [CrossRef]
- Bentivoglio, D.; Chiaraluce, G.; Finco, A. Economic assessment for vegetable waste valorization through the biogas-biomethane chain in Italy with a circular economy approach. Front. Sustain. Food Syst. 2022, 6. [Google Scholar] [CrossRef]
- Sutar, P.S.; Kolte, G.C.; Yamini, S. Food supply chain disruptions and its resilience: a framework and review for resilience strategies in the digital era. OPSEARCH 2025, 63, 164–198. [Google Scholar] [CrossRef]
- Herman, E.; Zsido, K. The financial sustainability of Retail food SMES based on financial equilibrium and financial performance. Mathematics 2023, 11, 3410. [Google Scholar] [CrossRef]
- Ventour, L. The food we waste. WRAP. 2008. Available online: https://www.lefigaro.fr/assets/pdf/Etude%20gaspillage%20alimentaire%20UK2008.pdf.
- WRAP. The Food Waste Reduction Roadmap: Progress Report 2022. Available online: https://www.wrap.ngo/sites/default/files/2022-12/WRAP_Food_Waste_Reduction_Roadmap_Progress_Report_2022.pdf.
- Padilla-Rivera, A.; Hannouf, M.; Assefa, G.; Gates, I. Enhancing environmental, social, and governance, performance and reporting through integration of life cycle sustainability assessment framework. Sustain. Dev. 2024, 33, 2975–2995. [Google Scholar] [CrossRef]
- Mohammed, A.; Balushi, M.A.; Zubairu, N. Tackling food waste: unveiling causes, implications and solutions in Oman’s fresh and short food supply chain. Br. Food J. 2024, 127, 1595–1619. [Google Scholar] [CrossRef]
- Roy, P.; Mohanty, A.K.; Dick, P.; Misra, M. A review on the Challenges and Choices for Food Waste Valorization: Environmental and Economic Impacts. ACS Environ. Au 2023, 3, 58–75. [Google Scholar] [CrossRef] [PubMed]
- Kaur, A.; Thyberg, K.L.; Tonjes, D.J. Zero-Waste Program success: a systems approach to indicators at the micro, meso, and macro levels. Sustainability 2025, 17, 3644. [Google Scholar] [CrossRef]
- Lee, J.C.; Neonaki, M.; Alexopoulos, A.; Varzakas, T. Case Studies of Small-Medium Food Enterprises around the World: Major Constraints and Benefits from the Implementation of Food Safety Management Systems. Foods 2023, 12, 3218. [Google Scholar] [CrossRef] [PubMed]
- Onyeaka, H.; Akinsemolu, A.; Miri, T.; Nnaji, N.D.; Duan, K.; Pang, G.; Tamasiga, P.; Khalid, S.; Al-Sharify, Z.T.; Ugwa, C. Artificial intelligence in food system: Innovative approach to minimizing food spoilage and food waste. J. Agric. Food Res. 2025, 21, 101895. [Google Scholar] [CrossRef]
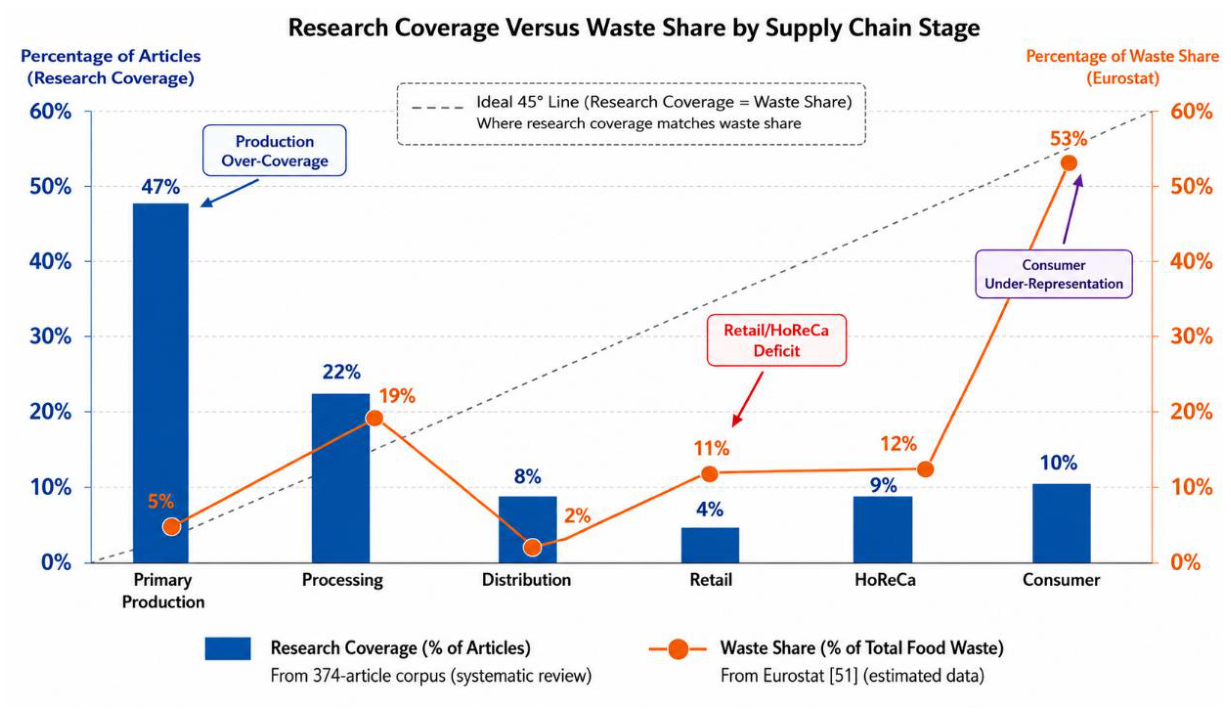
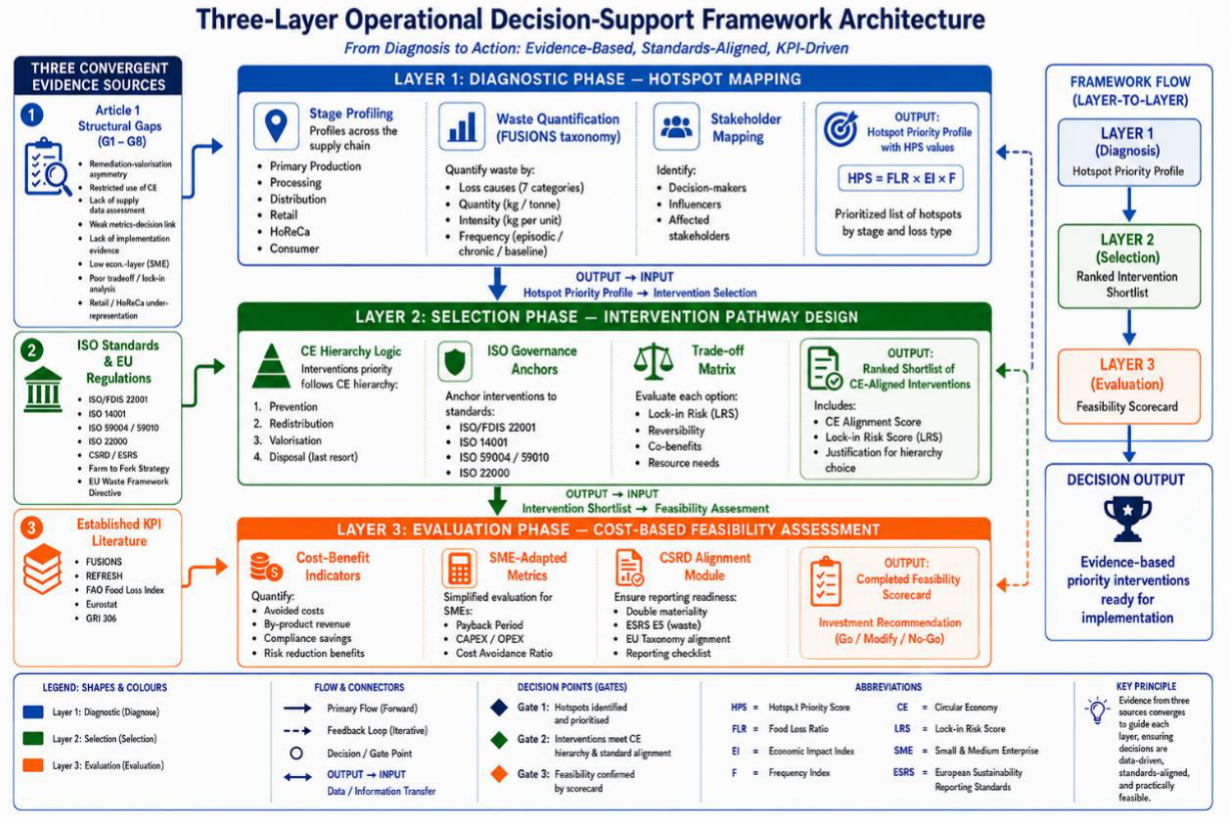
Figure 3.
Hotspot Mapping Visualisation - A heat map showing priority scores across supply chain stages and loss types [5,7,22,64,66].
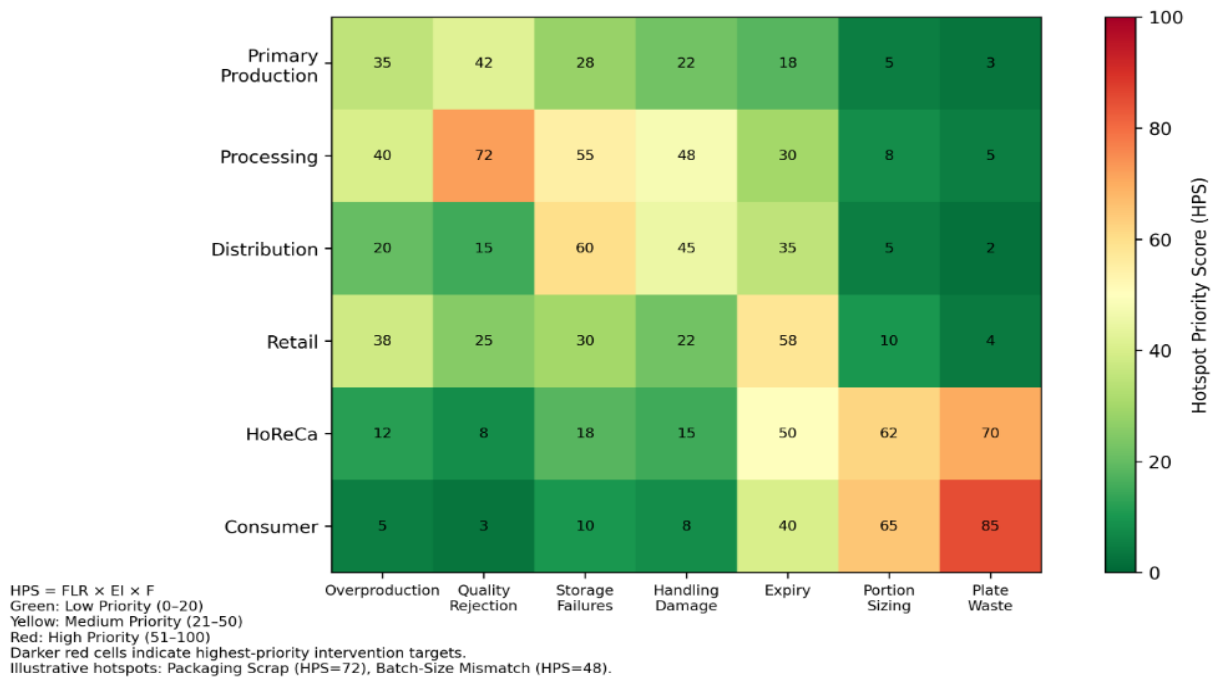
Figure 5.
Decision Flowchart - Visual representation of Layer 1 → Layer 2 transition logic [14,16,48.97,98].
Figure 5.
Decision Flowchart - Visual representation of Layer 1 → Layer 2 transition logic [14,16,48.97,98].
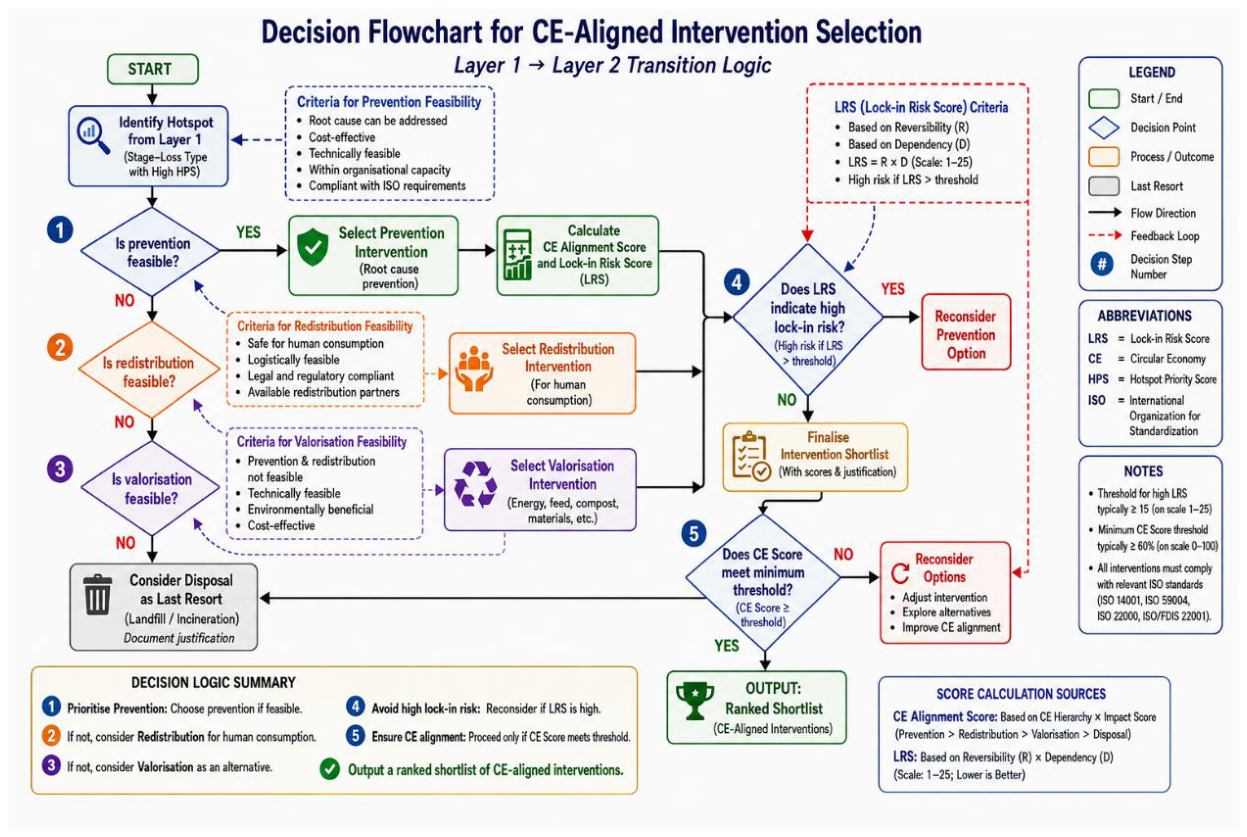
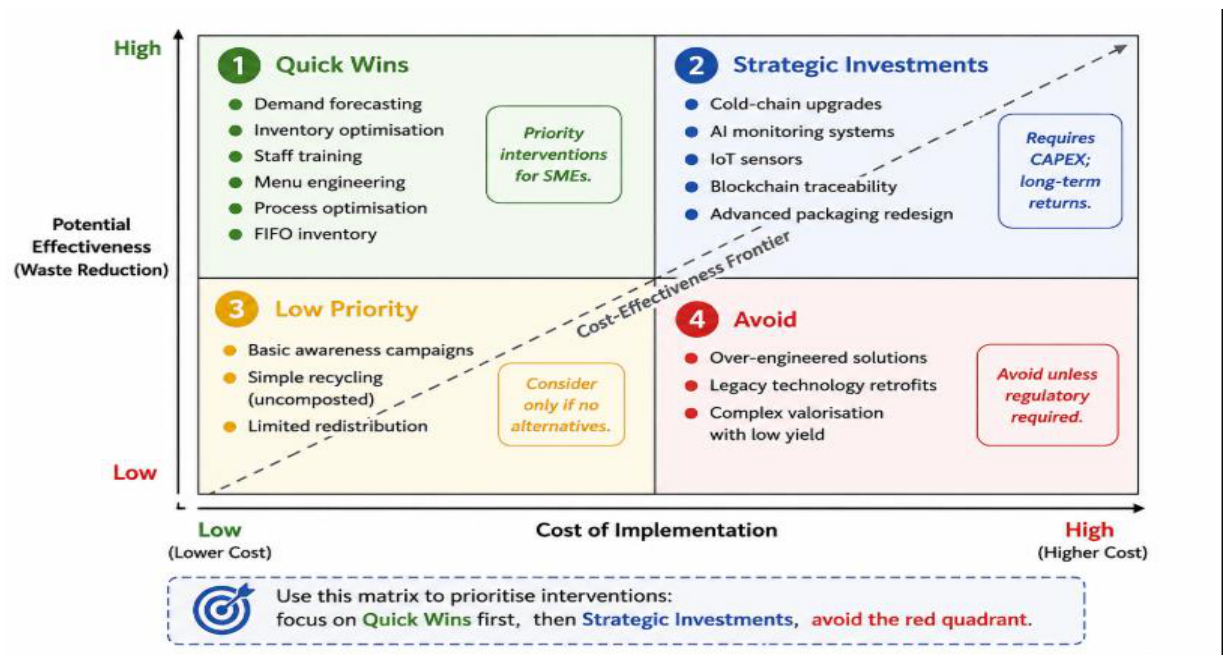
Table 1.
KPI Selection Criteria. These criteria have been used to rate each candidate KPI against 1-5. Only the KPIs that received a weighted score of ≥ 3.5 were retained to be included in the framework. This scoring scheme is summarized in Supplementary Material A.
Table 1.
KPI Selection Criteria. These criteria have been used to rate each candidate KPI against 1-5. Only the KPIs that received a weighted score of ≥ 3.5 were retained to be included in the framework. This scoring scheme is summarized in Supplementary Material A.
| Selection Criterion | Weight | Application Method | Rationale |
|---|---|---|---|
| Decision relevance | 25% | Assessed against layer objectives; KPI must directly inform a decision in its respective layer | Ensures that measurement translates into action, addressing Gap 4 (weak metrics-decision link) [14] |
| Empirical validation | 20% | Literature citation count and evidence of prior use in validated frameworks | Leverages established methodologies (FUSIONS, REFRESH, FAO FLI) rather than creating unvalidated metrics [64,65,66] |
| Data feasibility | 20% | SME accessibility assessment; data requirements must be achievable with standard operational records | Addresses Gap 6 (low economic rigour for SMEs) by ensuring practical data collection [23] |
| Cross-stage comparability | 15% | Applicability across all supply chain stages (production, processing, distribution, retail, HoReCa) | Enables comparative analysis across stages, addressing Gap 3 [14] |
| Regulatory alignment | 10% | ISO/CSRD/ESRS mapping coverage; KPI must support regulatory reporting requirements | Ensures compliance with ISO 14001, ISO 59004, CSRD/ESRS, and ISO/FDIS 20001 [20,42,44,45] |
| SME adaptability | 10% | Simplicity of calculation and minimal data requirements | Ensures accessibility for resource-constrained SMEs, addressing Gap 6 [23] |
Table 3.
ISO Standards and EU Regulatory Mapping to Framework Layers.
| Standard/Regulation | Relevant Provision | Mapped Framework Function |
|---|---|---|
| ISO/FDIS 20001 | Food loss and waste management system requirements | Primary governance anchor; common terminology and measurement logic for FLW |
| ISO 14001:2015 | Environmental management criteria | Indicators and governance anchor for Layer 3 evaluation |
| ISO 59004/59010 | CE definitions and transition criteria | Basis for intervention selection logic in Layer 2 |
| ISO 22000:2018 | Food safety management constraints | Defines feasibility boundaries for hotspots identified in Layer 1 |
| ISO 14067 | Carbon footprint methodology | Source of carbon-related KPI in Layer 3 |
| CSRD/ESRS | Double materiality reporting | Scorecard reporting-alignment module in Layer 3 |
| Farm to Fork Strategy | 50% food waste reduction target (2030) | Calibration benchmark across all layers |
Table 6.
Layer 2 Selection Phase Key Performance Indicators.
| KPI | Formula/Logic | Source | Selection Rationale |
|---|---|---|---|
| CE Alignment Score | hierarchy_level × impact_scope | Ellen MacArthur Foundation [9] ISO 59004 [45] | Selected over generic sustainability scores due to CE specificity. Addresses Gap 2 (rhetorical use of CE) by providing measurable CE criteria. Evidence: ISO 59004 provides formal CE transition criteria [45]. |
| Prevention Priority Index | prevention_options / total_interventions | EU Waste Hierarchy Directive [21] | Selected over valorisation-focused metrics due to prevention-first logic. Addresses Gap 1 (prevention-valorisation asymmetry)—evidence: Derived from EU Waste Hierarchy [21], which prioritises prevention. |
| Lock-in Risk Score (LRS) | reversibility × dependency_score | ORIGINAL COMPOSITE (Gap 7) | Created because no existing metric assesses lock-in risk systematically. Addresses Gap 7 (poor trade-off/lock-in analysis). Evidence: Expert-validated (Section 8.9.4); developed in response to Gap 7 [14,16]. |
| ISO Compliance Level | requirements_met / total_requirements | ISO 14001 [44]; ISO 22000 [46] | Selected over self-assessed compliance ratings due to objective measurement. Addresses regulatory alignment and RQ3. Evidence: ISO 14001 and ISO 22000 provide formal management system requirements [44,46]. |
Table 8.
Layer 3 Evaluation Phase Key Performance Indicators.
| KPI | Formula/Logic | Source | Selection Rationale |
|---|---|---|---|
| Cost Avoidance Ratio (CAR) | avoided_cost / intervention_cost | REFRESH [65]; Ventour [114] | Selected over NPV and ROI calculations due to SME accessibility. Addresses Gap 6 (low economic rigour for SMEs) by providing a simple feasibility filter. Evidence: Used in REFRESH project and validated in cost-of-food-waste research [65,114]. |
| Payback Period (SME) | CAPEX / annual_savings | ORIGINAL ADAPTATION (Gap 6) | Adapted from standard payback period to suit SME data constraints. Addresses Gap 6 by providing accessible economic methodology for resource-constrained SMEs. Evidence: Simplified version of standard payback period; expert-validated (Section 8.9.4) [23]. |
| Carbon Savings (tCO2e) | Σ(waste_kg × emission_factor) | ISO 14067 [62]; WRAP [115] | Selected over generic environmental scores due to quantification rigour. Addresses climate disclosure and CSRD/ESRS requirements. Evidence: ISO 14067 provides carbon footprint quantification methodology [62]. |
| CSRD Materiality Score | impact_materiality × financial_materiality | ESRS E5 [42]; GRI 306 [67] | Selected over single-dimension materiality assessments to align with double materiality requirements. Addresses regulatory alignment and RQ3. Evidence: ESRS E5 and GRI 306 define sustainability reporting standards [42,67]. |
Table 9.
Completed Feasibility Scorecard for Food Processing SME Scenario.
| Evaluation Criterion | Value | Assessment | KPI Source |
|---|---|---|---|
| Cost Avoidance Ratio | 2.0× | HIGH | REFRESH [65] |
| Payback Period (SME) | 5.4 months | STRONG | Gap 6 — original adaptation [14] |
| Carbon Savings | 23.4 tCO2e/yr | MODERATE | ISO 14067 [62] |
| CE Alignment Score | 4.2 / 5.0 | HIGH | ISO 59004 [45] |
| Lock-in Risk Score | 1.0 / 5.0 | LOW (favourable) | Gap 7 — original composite [14] |
| CSRD Materiality Score | 25 / 25 | HIGH | CSRD/ESRS [42], GRI 306 [67] |
Table 10.
Expert Validation Results by Framework Layer Note: Scores are based on a 5-point Likert scale (1 = Strongly Disagree; 5 = Strongly Agree). Expert profiles are described in Section 8.9.1.
Table 10.
Expert Validation Results by Framework Layer Note: Scores are based on a 5-point Likert scale (1 = Strongly Disagree; 5 = Strongly Agree). Expert profiles are described in Section 8.9.1.
| Layer | Clarity (1-5) | Completeness (1-5) | Practical Applicability (1-5) | Qualitative Feedback Summary |
|---|---|---|---|---|
| Layer 1: Diagnostic Phase | 4.4 | 4 | 4.2 | “Clear methodology; step-by-step process is well explained”; “Good coverage of stages; stakeholder mapping could be strengthened”; “Data requirements are reasonable; HPS calculation is intuitive” |
| Layer 2: Selection Phase | 4.6 | 4 | 4.2 | “Decision logic is explicit and defensible”; “Trade-off matrix is valuable; could include more guidance on lock-in risk assessment”; “Prevention-first logic is appropriate but requires cultural change in some organisations” |
| Layer 3: Evaluation Phase | 4.8 | 4.4 | 4.6 | “Very clear; scorecard template is excellent”; “Good coverage of economic and reporting dimensions”; “SME-adapted Payback Period is a valuable contribution” |
| Overall Framework | 4.6 | 4.2 | 4.4 | “Effectively bridges the diagnosis-implementation gap”; “Three-source grounding provides robust evidentiary support”; “SME adaptation is particularly valuable”; “Would benefit from pilot testing”; “Integration of ISO/FDIS 20001 positions framework well for future regulatory alignment” |
Table 11.
Individual Expert Validation Scores by Framework Layer.
| Clarity | Completeness | Practicality | Clarity | Completeness | Practicality | Clarity | Completeness | Practicality | Mean | |
|---|---|---|---|---|---|---|---|---|---|---|
| E1 (Academic Professor) | 4 | 4 | 4 | 5 | 4 | 4 | 5 | 4 | 5 | 4.3 |
| E2 (Academic Associate Professor) | 5 | 4 | 4 | 5 | 4 | 4 | 5 | 5 | 5 | 4.6 |
| E3 (Practitioner Consultant) | 4 | 4 | 4 | 4 | 4 | 4 | 5 | 4 | 4 | 4.1 |
| E4 (Practitioner Operations Manager) | 5 | 4 | 5 | 5 | 4 | 5 | 5 | 5 | 5 | 4.8 |
| E5 (Practitioner Policy Advisor) | 4 | 4 | 4 | 4 | 4 | 4 | 4 | 4 | 4 | 4 |
| Mean Score | 4.4 | 4 | 4.2 | 4.6 | 4 | 4.2 | 4.8 | 4.4 | 4.6 | 4.36 |
Disclaimer/Publisher’s Note: The statements, opinions and data contained in all publications are solely those of the individual author(s) and contributor(s) and not of MDPI and/or the editor(s). MDPI and/or the editor(s) disclaim responsibility for any injury to people or property resulting from any ideas, methods, instructions or products referred to in the content. |
© 2026 by the authors. Licensee MDPI, Basel, Switzerland. This article is an open access article distributed under the terms and conditions of the Creative Commons Attribution (CC BY) license (http://creativecommons.org/licenses/by/4.0/).
Copyright: This open access article is published under a Creative Commons CC BY 4.0 license, which permit the free download, distribution, and reuse, provided that the author and preprint are cited in any reuse.