

Submitted:
09 September 2026
Posted:
10 September 2026
You are already at the latest version
Abstract
Background: Type 2 diabetes mellitus (T2DM) may alter hemoglobin–oxygen affinity through glycation, yet intact erythrocytes retain metabolic, redox, allosteric, and rheological mechanisms capable of modifying the final oxygen-unloading phenotype. We investigated whether discordant P₅₀ and 2,3-bisphosphoglycerate (2,3-BPG) findings represent methodological noise or reproducible physiological heterogeneity. Methods: We performed a systematic review with structured quantitative synthesis and exploratory study-level phenotype mapping of human P₅₀/oxygen-affinity, 2,3-BPG, metabolic, rheological, and tissue-oxygenation evidence, integrated with mechanistic studies of hemoglobin glycation, bisphosphoglycerate mutase (BPGM), Band 3, erythrocyte metabolic partitioning, redox regulation, aging, and deformability. Results: Human studies demonstrated lower, preserved, and higher P₅₀ with reduced, unchanged, or increased 2,3-BPG. One mixed diabetic cohort showed higher native P₅₀ (29.79 ± 1.68 vs 28.26 ± 1.16 mmHg) and 2,3-BPG/Hb (1.04 ± 0.15 vs 0.86 ± 0.10; both P < 0.001), whereas a 90-participant T2DM cohort showed P₅₀ declining from 27.0 ± 0.5 to 26.2 ± 0.7 mmHg and 2,3-BPG from 4.8 ± 0.4 to 4.2 ± 0.5 across increasing HbA1c despite unchanged PaO₂. Metabolomics linked HbA1c to 2,3-BPG (ρ = 0.4919, P = 0.0003), ATP (ρ = 0.4606, P = 0.0008), and inversely to glutathione (ρ = −0.5944, P < 0.0001). BPGM glycation, Band 3-dependent oxygen-sensitive glycolysis/PPP partitioning, ATP–2,3-BPG allocation, NADPH/GSH buffering, S1P–PP2A–GLUT1 regulation, cellular aging, and deformability provide convergent mechanisms for variable erythrocyte compensation. Conclusions: T2DM exhibits directional oxygen-unloading heterogeneity rather than a universal P₅₀ defect. We therefore redefine glycohypoxia as a conditional functional oxygen-unloading state in which glycation-associated hemoglobin affinity pressure exceeds erythrocyte compensatory reserve, leaving a residual impairment in oxygen release whose physiological significance depends on downstream tissue oxygen-delivery reserve. The proposed Glycohypoxia Compensation–Reserve Model (GCRM) positions the diabetic erythrocyte not merely as an HbA1c-bearing recorder of glycemic exposure, but as a dynamic oxygen-delivery effector that may adapt or fail to adapt through coordinated allosteric, glycolytic, 2,3-BPG/ATP, redox, membrane, and rheological remodeling. This testable mechanism provides a foundation for an integrated oxygenomics of diabetes.
Keywords:
type 2 diabetes mellitus
; P50
; 2
; 3‐bisphosphoglycerate
; hemoglobin glycation
; glycohypoxia
; oxygenomics of diabetes
1. Introduction
Glycated hemoglobin (HbA1c) is the principal integrative biomarker of chronic glycemic exposure in type 2 diabetes mellitus (T2DM), but it should not be interpreted as a physiologically uniform exposure–response measure. In the international A1c-Derived Average Glucose study, 507 participants, including 159 with T2DM, underwent intensive glucose monitoring over 3 months, generating approximately 2,700 glucose measurements per participant. Mean glucose explained most, but not all, of the variation in HbA1c [average glucose (mg/dL) = 28.7 × HbA1c − 46.7; R2 = 0.84, P < 0.0001], demonstrating appreciable interindividual discordance between ambient glycemia and hemoglobin glycation [1]. Evidence within T2DM indicates that this discordance is reproducible rather than simply random measurement variation. In 36 patients assessed using continuous glucose monitoring, HbA1c, glycated albumin, and fasting glucose, the hemoglobin glycation index (HGI) correlated strongly with the independently derived glycation gap (r = 0.810, P < 0.001), and both measures were reproducible on repeat assessment without intervening changes in diabetes management (HGI: r = 0.729; glycation gap: r = 0.888; both P < 0.001) [2]. Consistent findings have been reported in larger T2DM cohorts. Among 508 patients evaluated twice 30.6 ± 7.3 weeks apart, HbA1c and fructosamine were only moderately correlated (r = 0.71 and 0.75), whereas the individual glycation gap remained reproducible between visits (r = 0.65) [3]. In an independent analysis of 105 patients with T2DM, fasting-glucose-derived HGI and glycated-albumin-derived glycation gap were strongly correlated (r = 0.722, P < 0.001), with extreme discordant reclassification between high and low glycation categories occurring in only approximately 5% of patients [4]. At least part of this interindividual variation may originate within the erythrocyte itself. In mechanistic human erythrocyte experiments involving 26 subjects, the steady-state intracellular-to-extracellular concentration ratio of the nonmetabolizable glucose analogue 3-O-methylglucose averaged 0.89 ± 0.07 but ranged from 0.72 to 1.04. This ratio was associated with HbA1c and the glycation gap, but not with fructosamine, supporting heterogeneity in erythrocyte glucose handling as a potential contributor to disproportionate hemoglobin glycation [5]. Collectively, these observations establish an important distinction between glycemic exposure and erythrocyte response: comparable extracellular glucose burden does not necessarily produce comparable intracellular glycation biology. This distinction becomes physiologically important because the erythrocyte is not merely a passive recorder of glycemic exposure.
Sustained exposure to high glucose can alter erythrocyte redox balance, membrane properties, and cellular integrity [6], while glycated erythrocytes may themselves exert biologically relevant effects on vascular endothelial cells [7]. The erythrocyte therefore represents both a site of glycation and a functional component of the oxygen-delivery system. Hemoglobin oxygen affinity, conventionally summarized by the oxygen tension at which hemoglobin is 50% saturated (P50), shows substantial physiological interindividual variation and is influenced by multiple allosteric and physicochemical determinants [8]. Recognition of altered-affinity hemoglobin states further illustrates that differences in oxygen affinity can materially influence oxygen loading and unloading even when conventional hemoglobin measurements appear otherwise unremarkable [9]. These observations raise the possibility that the physiological consequences of glycation depend not only on the magnitude of glycemic exposure, but also on how the erythrocyte responds to and accommodates that exposure. This possibility is particularly relevant because oxygen-affinity physiology cannot be inferred from glycation alone. P50 represents the net functional outcome of multiple interacting determinants, and apparently similar hemoglobin states can exhibit different oxygen-dissociation characteristics [10].
In T2DM, this creates an unresolved physiological problem: a glycation-associated perturbation of hemoglobin does not necessarily imply a uniform whole-blood oxygen-unloading response. Differences in erythrocyte metabolism, endogenous allosteric regulation, and other physiological modifiers could theoretically preserve, augment, or fail to maintain oxygen unloading despite comparable chronic glycemic exposure. Accordingly, the relevant question is not simply whether T2DM shifts the oxygen-dissociation curve in one direction, but whether heterogeneous oxygen-affinity states reflect methodological variation, biological adaptation, or differences in erythrocyte compensatory capacity.
This question directly bears on the emerging concept of glycohypoxia. Our previous work proposed glycohypoxia as a potential functional link between chronic hyperglycemia, hemoglobin glycation, impaired oxygen unloading, and diabetic tissue stress [11], and subsequently provided preliminary quantitative and clinical evidence consistent with a glycation-associated reduction in oxygen-unloading capacity in selected T2DM datasets [12]. The broader hypothesis, however, should not be interpreted as requiring a universal reduction in P50 in every individual with T2DM. A more physiologically flexible possibility is that the observed oxygen-unloading state represents the net expression of competing influences: glycation-associated oxygen-affinity pressure and the capacity of the erythrocyte to counterbalance that pressure. Under this interpretation, preserved or increased P50 would not necessarily exclude an underlying glycation-associated perturbation, just as reduced P50 alone would not establish failure of compensation.
Rather, the physiological meaning of P50 depends on its relationship to 2,3-bisphosphoglycerate (2,3-BPG), the broader erythrocyte metabolic state, and the functional capacity available to maintain oxygen unloading [11,12]. The present systematic review with structured quantitative synthesis and exploratory study-level phenotype mapping was therefore designed to determine whether directional heterogeneity in erythrocyte oxygen-unloading physiology is reproducibly present in T2DM and, if so, to distinguish methodological heterogeneity from potentially informative biological variation. Specifically, we aimed to (i) systematically characterize the direction and magnitude of reported P50 alterations in human T2DM; (ii) synthesize corresponding evidence for 2,3-BPG and relevant erythrocyte metabolic adaptations; (iii) quantitatively synthesize sufficiently comparable P50 and 2,3-BPG data where methodological and reporting characteristics permit; (iv) explore joint P50–2,3-BPG patterns as candidate study-level states of erythrocyte compensation, without assuming that they represent validated patient-level phenotypes; (v) identify methodological and biological modifiers capable of explaining between-study discordance; and (vi) examine whether altered erythrocyte oxygen-handling patterns show preliminary relationships with diabetic microvascular complications and tissue-oxygenation abnormalities. By treating heterogeneity as a physiological observation to be explained rather than statistical noise to be averaged away, this review seeks to define the boundary conditions of glycohypoxia, determine where the existing evidence supports or challenges a uniform oxygen-unloading defect, and generate falsifiable predictions for future patient-level investigation.
2. Methods
2.1. Review Design and Conceptual Approach
This study was conducted as a systematic review with structured quantitative synthesis and exploratory study-level phenotype mapping to characterize heterogeneity in erythrocyte oxygen-unloading physiology in type 2 diabetes mellitus (T2DM). The review was designed around the premise that between-study discordance in P50 and 2,3-bisphosphoglycerate (2,3-BPG) may contain physiologically informative variation and should therefore not be collapsed into a single summary estimate when differences in population, measurement conditions, or outcome definition make such pooling difficult to interpret. Human evidence directly measuring P50, hemoglobin oxygen affinity, 2,3-BPG, or closely related erythrocyte oxygen-release variables constituted the primary evidence base. Mechanistic erythrocyte studies and studies of tissue oxygenation or diabetic complications were synthesized separately to evaluate biological plausibility and downstream physiological relevance without treating indirect evidence as equivalent to direct demonstration of an oxygen-unloading phenotype.
The review was structured according to PRISMA principles, with transparent grouping and direction-based synthesis used where statistical pooling was not physiologically or methodologically appropriate.
2.2. Search Strategy and Information Sources
A systematic literature search was developed around four interconnected evidence domains: erythrocyte oxygen affinity and P50 in diabetes; 2,3-BPG and erythrocyte metabolic adaptation; methodological and biological determinants of oxygen-affinity measurements; and erythrocyte dysfunction or tissue oxygenation in diabetic complications. PubMed/MEDLINE, Scopus, Web of Science, and Embase were searched from database inception, supplemented by backward citation searching of eligible primary studies and relevant reviews. Search terminology combined diabetes-related terms, including “type 2 diabetes mellitus,” “T2DM,” “type II diabetes,” “non-insulin-dependent diabetes mellitus,” “NIDDM,” and “diabetes mellitus,” with oxygen-affinity terms including “P50,” “P50,” “oxygen dissociation curve,” “oxygen affinity,” “hemoglobin oxygen affinity,” “haemoglobin oxygen affinity,” “oxygen unloading,” and “oxygen release,” and erythrocyte metabolic terms including “2,3-bisphosphoglycerate,” “2,3-BPG,” “2,3-diphosphoglycerate,” “2,3-DPG,” “bisphosphoglycerate mutase,” “BPGM,” “ATP,” “glycolysis,” “pentose phosphate pathway,” “redox,” “Band 3,” “erythrocyte metabolism,” and “red blood cell metabolism.” Historical terminology, particularly NIDDM and 2,3-DPG, was retained because much of the foundational physiological literature predates contemporary nomenclature. Complementary searches examined potential modifiers of erythrocyte oxygen unloading, including anemia, renal dysfunction, phosphate status, erythrocyte age and lifespan, smoking, carboxyhemoglobin, dyshemoglobins, lipid phenotype, sample temperature, storage, and analytical determination of P50. A separate translational search combined diabetes terms with “erythrocyte deformability,” “retinopathy,” “neuropathy,” “diabetic foot,” “peripheral vascular disease,” “nephropathy,” “diabetic kidney disease,” “tissue oxygenation,” “transcutaneous oxygen pressure,” “TcPO2,” “retinal oxygen saturation,” “retinal ischemia,” “renal oxygenation,” and “BOLD MRI.” Searches were iteratively supplemented by citation tracking when older physiological studies or mechanistic papers were identified through eligible reports.
2.3. Eligibility and Evidence Hierarchy
Original human studies were eligible for the primary synthesis when they included adults with T2DM, or diabetic populations containing information relevant to T2DM, and reported P50, an interpretable measure of hemoglobin oxygen affinity or oxygen-release physiology, erythrocyte 2,3-BPG/2,3-DPG, or paired erythrocyte metabolic measurements directly relevant to oxygen unloading.
Studies using the historical designation NIDDM were considered relevant to T2DM when the clinical description was compatible with non-insulin-dependent or type 2 diabetes. Mixed diabetes cohorts were retained when they contributed physiologically relevant evidence but were explicitly identified as mixed rather than represented as T2DM-specific populations.
A hierarchical approach was used to distinguish evidence according to mechanistic proximity to the review question. Human studies directly measuring P50 or oxygen-dissociation behavior in T2DM were considered the most direct evidence of the functional oxygen-affinity phenotype. Human studies measuring 2,3-BPG together with erythrocyte metabolic variables were used to characterize the metabolic component of compensation, while studies in which P50 and 2,3-BPG were available in the same population were prioritized for paired physiological interpretation. Experimental studies of purified or glycated hemoglobin were used to establish molecular plausibility for glycation-associated changes in allostery and oxygen affinity, and mechanistic studies of BPGM, Band 3, erythrocyte metabolism, and redox regulation were used to interpret potential compensatory mechanisms. These mechanistic studies were not treated as evidence that a corresponding phenotype necessarily occurs in vivo in T2DM.
Studies of diabetic retinopathy, neuropathy, diabetic foot disease, peripheral vascular disease, renal disease, and tissue oxygenation were included as a distinct translational evidence domain when they quantified erythrocyte dysfunction, microvascular physiology, or tissue oxygen availability relevant to downstream oxygen delivery. Because most such studies did not simultaneously measure P50 and 2,3-BPG, they were not interpreted as direct evidence that altered hemoglobin affinity causes diabetic complications.
Animal-only studies, reports without physiologically relevant erythrocyte or oxygen-delivery outcomes, and secondary publications that did not contribute additional mechanistic or methodological information were excluded from the primary human synthesis. Studies from non-diabetic populations were retained only when required to establish measurement limitations or recognized physiological modifiers of P50 or 2,3-BPG and were analyzed separately from the diabetes evidence.
2.4. Data Extraction and Physiological Harmonization
Study characteristics and outcomes were extracted into structured evidence domains. For the primary human studies, extracted variables included diabetes classification, sample size, comparator group, HbA1c or other measures of glycemic exposure, P50 or oxygen-affinity measurement, 2,3-BPG/2,3-DPG, ATP and other reported erythrocyte metabolites, and relevant hematological or clinical characteristics.
When available, diabetes duration, treatment state, renal function, anemia, smoking, erythrocyte deformability, and complication status were also recorded because these factors could modify erythrocyte physiology independently of glycation.
P50 measurements were not assumed to be interchangeable. Studies were characterized according to whether P50 was directly measured or calculated, whether oxygen affinity was derived from a complete oxygen-dissociation curve or a limited- or single-point approach, and whether measurements reflected native whole-blood conditions or values standardized for pH, PCO2, temperature, or other allosteric determinants. Sample handling, storage, measurement temperature, and analytical methodology were recorded where available because these factors can materially alter interpretation of P50 and 2,3-BPG.
For 2,3-BPG, values were retained in the units reported by each study unless conversion could be performed without additional assumptions. Because studies reported 2,3-BPG relative to whole-blood volume, hemoglobin, or erythrocyte mass using historically variable nomenclature, absolute values expressed on non-equivalent scales were not treated as directly interchangeable. Emphasis was therefore placed on within-study comparisons and direction of change when harmonization was not defensible.
2.5. Structured Synthesis of P50 and 2,3-BPG Heterogeneity
The principal synthesis was structured around both magnitude and direction of physiological change. P50 findings were classified as indicating higher P50 and lower oxygen affinity, preserved or minimally altered P50, or lower P50 and higher oxygen affinity relative to the relevant comparator or across increasing glycemic exposure. 2,3-BPG findings were similarly classified as increased, preserved or minimally altered, or decreased. Statistical significance was recorded but was not used as the sole determinant of physiological direction; reported estimates, uncertainty, sample size, measurement methodology, and concordance with related erythrocyte variables were considered together.
This approach was chosen because the human literature spans several decades and includes substantial heterogeneity in diabetes classification, P50 determination, standardization conditions, 2,3-BPG units, treatment state, and participant characteristics. A universal pooled estimate across all studies could therefore obscure rather than explain physiologically meaningful differences. Quantitative results were retained and compared whenever the reported data permitted, but statistical pooling was restricted to measurements considered sufficiently compatible in outcome definition and methodology. Evidence that could not be validly pooled was synthesized using structured tables, direction-of-effect classification, and explicit consideration of methodological context rather than being discarded.
2.6. Exploratory Joint P50–2,3-BPG Mapping
A separate exploratory paired synthesis was performed for studies reporting both a functional measure of hemoglobin oxygen affinity and 2,3-BPG within the same study population. P50 and 2,3-BPG were interpreted jointly because either variable alone is insufficient to determine compensatory adequacy. An increase in 2,3-BPG would ordinarily favor a rightward shift of the oxygen-dissociation curve, but its physiological adequacy depends on whether it offsets competing affinity pressures sufficiently to preserve or increase P50. Conversely, preserved P50 may represent physiological stability or successful counterbalancing of opposing influences rather than absence of an underlying perturbation.
Studies were mapped according to the joint direction of P50 and 2,3-BPG and organized into candidate patterns compatible with preserved compensation, incomplete compensation, low-compensation states, or indeterminate responses. This mapping was explicitly exploratory and study-level. The resulting categories were not considered validated patient phenotypes, diagnostic entities, or evidence of discrete biological subtypes. Their purpose was to determine whether apparently discordant studies could be organized into physiologically coherent patterns and to generate testable hypotheses for future patient-level investigation.
2.7. Analysis of Methodological and Biological Heterogeneity
Potential sources of heterogeneity were examined before residual differences were attributed to variation in erythrocyte compensatory capacity. Methodological factors included direct versus calculated P50, full-curve versus limited-point determination, native versus standardized measurement conditions, temperature, pH and PCO2 handling, sample storage, and analytical methodology. Biological factors included anemia and hemoglobin concentration, renal dysfunction and dialysis-associated physiology, erythrocyte age and lifespan, smoking and dyshemoglobinemia, lipid phenotype, treatment state, and erythrocyte rheological properties.
These factors were treated as competing explanations for between-study discordance rather than as incidental covariates. Particular caution was applied to erythrocyte lifespan because variation in red-cell survival can alter HbA1c independently of contemporaneous glycemic exposure, creating the possibility that an apparent HbA1c–P50 relationship may partly reflect variation in erythrocyte population age. Likewise, renal disease, anemia, acid–base status, phosphate physiology, smoking-related dyshemoglobinemia, and ex-vivo sample handling can modify oxygen affinity independently of hemoglobin glycation. Residual directional heterogeneity was considered potentially informative of biological variation only after these alternative methodological and physiological explanations had been considered.
2.8. Translational Synthesis of Tissue Oxygenation and Diabetic Complications
Evidence relating erythrocyte physiology to diabetic complications was synthesized separately from the primary P50 and 2,3-BPG evidence. Studies were grouped according to retinopathy and retinal oxygenation, peripheral neuropathy and cutaneous oxygenation, diabetic foot and peripheral microvascular physiology, renal oxygenation, and broader erythrocyte deformability or microangiopathy.
Interpretation followed an evidence-proximity principle. Direct associations between erythrocyte dysfunction and quantitative microvascular abnormalities were considered stronger evidence of an erythrocyte–tissue relationship than studies demonstrating tissue oxygen abnormalities alone. Conversely, tissue oxygenation abnormalities measured by TcPO2, retinal oximetry, or renal BOLD-MRI were not interpreted as evidence of impaired hemoglobin unloading unless oxygen-affinity measurements were also available. This separation was particularly important because tissue oxygenation is determined by perfusion, capillary architecture, erythrocyte transit, diffusion, oxygen extraction, metabolic demand, and cellular utilization in addition to hemoglobin affinity.
2.9. Development of the Glycohypoxia Compensation–Reserve Model
The Glycohypoxia Compensation–Reserve Model (GCRM) was developed after synthesis of the human evidence and was not used to determine study eligibility or to classify studies as supportive or unsupportive during evidence identification. The model emerged from three convergent observations: controlled molecular studies demonstrate a plausible glycation-associated pressure on hemoglobin oxygen affinity; human T2DM studies demonstrate substantial directional heterogeneity in P50 and 2,3-BPG rather than a universal affinity phenotype; and diabetic complication studies demonstrate marked variation in erythrocyte function and downstream tissue oxygen reserve.
The model was therefore used as an explanatory framework for observed heterogeneity rather than as an assumption imposed on the evidence. Findings incompatible with a universal glycation-induced left shift, including preserved or increased P50 in several diabetic populations, were retained as central evidence rather than treated as outliers. Within this framework, erythrocyte compensatory reserve was considered multidimensional and was not equated with 2,3-BPG alone, while tissue oxygen-delivery reserve was treated as a separate downstream determinant of the physiological significance of any residual oxygen-unloading abnormality.
The resulting GCRM and candidate P50–2,3-BPG patterns were considered hypothesis-generating and falsifiable.
No causal inference from erythrocyte physiology to diabetic complications was made solely from cross-sectional associations, and the absence of prospective human studies simultaneously measuring glycemic exposure, erythrocyte age, P50, 2,3-BPG, metabolic and redox state, deformability, tissue oxygenation, and subsequent complication development was treated as a central evidentiary limitation.
3. Molecular Basis of Glycation-Associated Oxygen-Affinity Pressure
Hemoglobin A1c (HbA1c) is formed through the nonenzymatic reaction of glucose with the α-amino group of the N-terminal valine of the hemoglobin β chain (β-Val1). The reaction initially produces a reversible aldimine, or Schiff-base, adduct that subsequently undergoes Amadori rearrangement to form the substantially more stable ketoamine characteristic of mature HbA1c. Classic biochemical studies established both the kinetics of this process and the chemical identity of the mature adduct, identifying 1-deoxy-1-(N-valyl)fructose at β-Val1 as the defining modification of HbA1c [13]. The physiological relevance of this modification extends beyond its use as a biomarker. The β-chain N termini occupy a functionally important region of the hemoglobin tetramer involved in heterotropic allosteric regulation, including interactions with 2,3-bisphosphoglycerate (2,3-BPG; historically 2,3-DPG). The presence of a covalent glucose-derived adduct at β-Val1 therefore provides a plausible structural route through which glycation could modify hemoglobin behavior. Molecular plausibility alone, however, does not establish either the direction or the magnitude of oxygen-affinity change in intact diabetic erythrocytes [11,12]. Early experimental evidence demonstrated that glycation can alter the normal response of hemoglobin to organic phosphates. Bunn and Briehl showed that 2,3-DPG substantially reduced oxygen affinity in HbA and several hemoglobin variants, whereas HbA1c exhibited attenuated responsiveness, supporting interference between β-chain N-terminal modification and normal organic-phosphate regulation [14]. Thus, glycation occurs at a site functionally coupled to one of the principal mechanisms through which erythrocytes modulate hemoglobin oxygen affinity. Its consequences may therefore involve not only changes in intrinsic hemoglobin allostery but also altered responsiveness to physiological heterotropic effectors [15]. Subsequent purified-hemoglobin studies demonstrated that the magnitude of this effect depends strongly on experimental conditions. McDonald and colleagues compared naturally occurring glycated hemoglobin fractions with HbA0 and reported, in 0.1 M potassium phosphate at pH 7.0 and 20 °C, a P50 of 7.4 mmHg for HbA1c compared with 7.8 mmHg for HbA0 [16]. The relatively small difference under these conditions is mechanistically important because it argues against interpreting glycation as an invariably large intrinsic affinity shift. Instead, more prominent abnormalities may emerge through altered allosteric responsiveness or conformational transitions [17]. More substantial changes were observed in experiments examining the behavior of the low-affinity T state. Coletta and colleagues reported a markedly asymmetric oxygen-binding curve for naturally glycated HbA1c, with the low-saturation limb extending to approximately 40% oxygen saturation and an apparent T-state oxygen affinity approximately tenfold higher than that of HbA0. Oxygen-pulse experiments further demonstrated ligand-dissociation kinetics of approximately 25 s−1 at low oxygen saturation, where the T state predominates [18]. These findings indicate that glycation can substantially modify the functional properties of the nominally low-affinity conformation. They should not, however, be extrapolated directly to whole blood because purified-hemoglobin systems remove the intracellular concentrations of 2,3-BPG, protons, chloride, carbon dioxide, and other determinants that shape the T–R equilibrium in vivo. Experiments conducted at glycation levels closer to those encountered clinically suggest a more moderate molecular effect. Marschner and colleagues compared hemoglobin containing approximately 8% HbA1c with native hemoglobin containing approximately 4% HbA1c and observed an oxygen-dissociation rate constant of 56.8 ± 5.2 s−1 in the more glycated preparation versus 61.5 ± 3.3 s−1 in native hemoglobin.
Addition of 2,3-DPG up to 20 mmol/L increased the respective rate constants to 59.4 ± 4.1 and 65.3 ± 4.1 s−1 [19]. These findings support a modest but measurable glycation-associated slowing of molecular oxygen release and further show that the effect remains modifiable by the allosteric environment rather than behaving as an irreversible fixed defect [20]. A more detailed structural–functional analysis was subsequently provided by De Rosa and colleagues. Glycation was associated with altered stabilization of hemoglobin conformational states and modified responses to protons, chloride, and 2,3-DPG. The affinity of T-state HbA1c for 2,3-DPG was approximately 2.6-fold lower than that of HbA0, while the corresponding difference in the R state was approximately 1.7-fold. HbA1c also exhibited a reduced Bohr effect. Molecular modeling placed the glucose-derived modification within the 2,3-DPG-binding region and suggested remodeling of its geometry and electrostatic environment rather than simple elimination of the binding site [21]. The distinction is important mechanistically: glycation does not appear merely to block 2,3-BPG binding, but instead alters the energetic context in which hemoglobin responds to multiple heterotropic effectors. Taken together, these molecular studies support a perturbation model rather than an obligatory left-shift model. Glycation at β-Val1 can alter T-state behavior, organic-phosphate responsiveness, proton sensitivity, and oxygen-dissociation kinetics, but the magnitude and observable manifestation of these effects depend on the biochemical environment in which hemoglobin is studied. Because P50 is itself sensitive to pH-dependent changes in hemoglobin oxygen affinity, the Bohr effect provides an additional reason why a molecular glycation effect cannot be translated directly into a fixed whole-blood P50 phenotype [22]. Accordingly, throughout this review we use the term glycation-associated oxygen-affinity pressure to describe the allosterically relevant influence introduced by hemoglobin glycation: a molecular tendency capable of modifying the low-affinity state, altering heterotropic-effector responsiveness, and slowing oxygen release under appropriate conditions. The term deliberately does not imply that increasing HbA1c inevitably produces a lower whole-blood P50. Whole-blood oxygen affinity emerges from the integrated effects of hemoglobin glycation, 2,3-BPG, pH, carbon dioxide, temperature, ionic conditions, and the metabolic state of the erythrocyte. Glycation should therefore be conceptualized as a molecular pressure acting on a physiologically compensable system, rather than as a deterministic surrogate for impaired oxygen unloading. The next mechanistic question is consequently whether erythrocytes possess sufficient metabolic and allosteric capacity to buffer that pressure, and why that capacity might differ across diabetic states.
4. Erythrocyte Metabolic Machinery of Oxygen-Unloading Compensation
The molecular oxygen-affinity pressure introduced by hemoglobin glycation operates within an erythrocyte that possesses multiple mechanisms capable of modifying oxygen unloading. Central among them is 2,3-bisphosphoglycerate (2,3-BPG), an erythrocyte-enriched glycolytic intermediate that preferentially binds deoxygenated hemoglobin and stabilizes its low-affinity T conformation. 2,3-BPG is generated through the Rapoport–Luebering shunt, in which 1,3-bisphosphoglycerate is diverted from the phosphoglycerate kinase step and converted by bisphosphoglycerate mutase (BPGM) to 2,3-BPG, which can subsequently return to glycolysis as 3-phosphoglycerate. Human BPGM possesses 2,3-BPG synthase, 2,3-BPG phosphatase, and phosphoglycerate-mutase activities, making it a major regulatory node linking glycolytic carbon allocation to hemoglobin oxygen affinity [23].
This pathway carries an important energetic trade-off. Under conventional glycolysis, phosphoglycerate kinase converts 1,3-bisphosphoglycerate to 3-phosphoglycerate while generating ATP through substrate-level phosphorylation [24]. Diversion through the Rapoport–Luebering shunt bypasses this ATP-generating reaction. Increased 2,3-BPG synthesis should therefore not be described as directly consuming ATP; rather, it imposes an energetic opportunity cost because ATP that would otherwise have been generated from the same glycolytic intermediate is forgone [25]. This distinction is especially important in mature erythrocytes, which lack mitochondria and depend predominantly on glycolysis for ATP generation and maintenance of membrane, cytoskeletal, and ionic homeostasis [26]. Regulation of oxygen affinity therefore occurs within a broader metabolic allocation problem in which the erythrocyte must balance oxygen-unloading requirements against the energetic demands required for its survival and mechanical function [27]. Glycation may perturb this system at more than one molecular level. Fujita and colleagues demonstrated reduced BPGM-specific activity in erythrocytes obtained from patients with diabetes. BPGM isolated from pooled diabetic erythrocytes separated into a nonglycated fraction retaining enzymatic activity and a glycated fraction that was inactive and reactive with an anti-hexitollysine antibody. Peptide analysis identified Lys158 as the principal in-vivo glycation site, while experimentally glycated recombinant BPGM showed additional modification at several lysine residues. Loss of activity was particularly associated with glycation at Lys158 near the substrate-binding region [23]. Because the clinical population was described broadly as diabetic rather than as a clearly separable T2DM cohort, these findings should be regarded as diabetes-associated mechanistic evidence rather than direct proof that BPGM glycation determines the T2DM P50 phenotype. Nevertheless, they identify a second potential target through which chronic glycation may influence oxygen-affinity regulation: not only hemoglobin itself, but also the enzyme controlling its principal erythrocyte allosteric modulator. Erythrocyte metabolic allocation is additionally coupled to oxygenation state through Band 3 (SLC4A1), the major erythrocyte membrane anion exchanger and an important protein scaffold. Its cytoplasmic N-terminal domain interacts with glycolytic enzymes, including glyceraldehyde-3-phosphate dehydrogenase, aldolase, and phosphofructokinase. Chu and colleagues localized a major deoxyhemoglobin-binding sequence to Band 3 residues 12–23 and showed that this region lies close to or overlaps binding determinants for glycolytic enzymes [28]. Deoxygenated hemoglobin can therefore compete with membrane-associated glycolytic enzymes for Band 3 binding, providing a molecular mechanism through which oxygenation state influences metabolic organization.
During deoxygenation, displacement of glycolytic enzymes from Band 3 favors their cytosolic activity and glycolytic flux, whereas oxygenation-associated membrane binding can relatively suppress glycolysis and favor redistribution of glucose toward the pentose-phosphate pathway (PPP) [28,29,30].
Evidence from intact erythrocytes supports this oxygen-sensitive metabolic switch. Using ^1H–^13C NMR to quantify glucose flux, Lewis and colleagues demonstrated that disruption of glycolytic-enzyme binding to Band 3 altered the normal oxygen-dependent redistribution of glucose between glycolysis and the PPP [31]. Subsequent genetic experiments showed that erythrocytes lacking the relevant deoxyhemoglobin-binding sequence of Band 3 lost normal oxygen-dependent regulation of the membrane glycolytic-enzyme complex and associated oxygen-responsive properties [32]. Together, these observations indicate that erythrocyte metabolism is not a static source of 2,3-BPG; oxygenation state itself participates in regulating how glucose is distributed between ATP-generating glycolysis and the PPP, which provides reducing equivalents required for antioxidant defense [30,31,32,33].
This flexibility is particularly relevant in T2DM, where erythrocytes are chronically exposed to hyperglycemia and oxidative stress. Thomas and colleagues identified an additional regulatory axis involving sphingosine-1-phosphate (S1P), protein phosphatase 2A (PP2A), and glucose transporter 1 (GLUT1). Erythrocytes from patients with T2DM exhibited approximately 34% higher intracellular S1P, approximately twofold higher PP2A abundance, and approximately 26% lower cell-surface GLUT1 [34]. Mechanistic experiments supported an S1P–PP2A pathway capable of altering GLUT1 regulation and restricting erythrocyte glucose uptake during hyperglycemic exposure [34]. The study did not demonstrate corresponding changes in P50 or 2,3-BPG, and its relevance here is therefore mechanistic rather than demonstrative. It nevertheless shows that substrate entry into the erythrocyte is itself adaptable in T2DM and may alter the availability of glucose to interconnected glycolytic, Rapoport–Luebering, and antioxidant pathways.
The compensatory network is further constrained by the competing demands of energy production and redox protection. Mature erythrocytes lack mitochondrial oxidative metabolism, making the PPP a critical source of NADPH required to maintain glutathione in its reduced form and protect hemoglobin, membrane proteins, and lipids from oxidative injury [33,35]. At the same time, preservation of glycolytic flux sustains ATP generation and generates the intermediary substrates from which 2,3-BPG can be produced. Oxygen-affinity adaptation therefore cannot be understood simply by asking whether 2,3-BPG rises or falls. The erythrocyte continuously distributes a finite glucose-derived substrate pool among partially competing requirements for ATP production, redox defense, structural maintenance, and allosteric regulation of hemoglobin.
Taken together, these mechanisms indicate that erythrocyte compensatory capacity is multidimensional. Its functional expression emerges from an interconnected network in which glucose entry influences substrate availability; Band 3 couples oxygenation state to glycolytic organization; glycolytic routing determines access to 1,3-bisphosphoglycerate; BPGM regulates 2,3-BPG production and degradation; the Rapoport–Luebering shunt carries an energetic opportunity cost; and the PPP competes for glucose while preserving antioxidant capacity [23,24,25,26,27,28,30,31,32,33,34,35]. Glycation may perturb more than one level of this network, including hemoglobin and BPGM, while chronic hyperglycemia can remodel erythrocyte glucose handling itself.
We therefore define erythrocyte compensatory capacity not as an automatic increase in 2,3-BPG, but as the integrated ability of a metabolically constrained erythrocyte to preserve oxygen unloading while maintaining ATP availability, redox balance, membrane integrity, and metabolic flexibility. An elevated 2,3-BPG concentration may represent successful compensatory recruitment in one context but increased compensatory demand or metabolic stress in another. Conversely, a low 2,3-BPG concentration may reflect inadequate compensatory capacity, altered substrate allocation, or a physiological state in which additional allosteric recruitment is not required. Its significance therefore depends on the accompanying P50 response and the wider metabolic state of the erythrocyte.
This framework generates a direct empirical prediction: if glycation-associated oxygen-affinity pressure and the capacity to counterbalance it both vary across individuals and clinical states, then comparable glycemic exposure should not necessarily produce a uniform P50 or 2,3-BPG response. The human evidence can therefore be evaluated not only for an average directional effect, but for the presence and structure of physiologically interpretable heterogeneity.
5. Results: Human Heterogeneity in Erythrocyte Oxygen-Unloading Physiology
Human studies demonstrated substantial directional heterogeneity in both functional hemoglobin oxygen affinity and erythrocyte 2,3-bisphosphoglycerate (2,3-BPG) responses in diabetes. Rather than converging on a uniform oxygen-unloading phenotype, the evidence encompassed lower, preserved, and higher P50, together with reduced, minimally altered, and increased 2,3-BPG. This discordance was present across historical and contemporary studies and was observed both between diabetic and control populations and within diabetes according to glycemic exposure, erythrocyte characteristics, or treatment state. The principal human studies contributing to the P50 and 2,3-BPG syntheses are summarized together in Table 1.
T2DM-specific cohorts were distinguished from historical non-insulin-dependent diabetes mellitus (NIDDM) populations and from mixed-diabetes cohorts in which T2DM-specific quantitative estimates could not be isolated.
5.1. Heterogeneity of P50 and Hemoglobin Oxygen Affinity
Evidence for a lower-P50, higher-affinity pattern was present in both historical and contemporary T2DM-relevant studies. Rand and colleagues assessed oxygen-transport and rheological characteristics in 42 patients with juvenile- or adult-onset diabetes and 36 matched controls. Among nonsmokers, P50 standardized to pH 7.4 was approximately 1 mmHg lower than the corresponding control value in both juvenile- and adult-onset diabetes [36].
Although the number of adult-onset participants contributing specifically to this comparison was not separately available, the finding provides early evidence that an affinity-increasing pattern was not confined to juvenile-onset diabetes. Solomon and Cohen subsequently studied 15 men with T2DM and 13 healthy controls using simultaneous measurements of HbA1c, P50, 2,3-BPG, ATP, erythrocyte glycolytic enzymes, and corpuscular indices. Mean P50 remained within the normal range despite increased 2,3-BPG and reduced mean corpuscular hemoglobin concentration. Within the diabetic group, however, standardized P50 was inversely related to HbA1c, while 2,3-BPG and ATP were also inversely associated with HbA1c [37]. The study therefore distinguished a preserved group-level P50 from an internal glycation-associated affinity gradient.
A contemporary exploratory cohort of 90 patients with established T2DM demonstrated a more explicit lower-P50 gradient. Across three equal HbA1c strata, mean HbA1c increased from 6.5 ± 0.3% to 8.0 ± 0.4% and 9.5 ± 0.5%, while P50 declined from 27.0 ± 0.5 to 26.8 ± 0.6 and 26.2 ± 0.7 mmHg, respectively (P < 0.01). HbA1c correlated inversely with P50 (r = −0.31, P < 0.01), and the association remained significant after adjustment for erythrocyte 2,3-BPG (β = −0.28, P < 0.01) [12]. These findings provide contemporary T2DM evidence of an affinity-increasing pattern with greater glycemic burden, although the exploratory nature of the cohort limits causal interpretation.
Importantly, other T2DM studies demonstrated the opposite direction. Castilho and colleagues compared 22 patients with NIDDM, 19 with insulin-dependent diabetes, and 19 nondiabetic controls. Despite substantially higher HbA1c in NIDDM (9.0% vs 4.6%), P50 was numerically higher rather than lower (28.5 vs 26.8 mmHg), and the investigators found no significant displacement of the overall oxygen-dissociation curves [38]. Similarly, Coppola and colleagues reported significantly lower hemoglobin–oxygen affinity at baseline in 20 patients with T2DM and peripheral vascular disease than in 20 matched controls, indicating facilitated rather than impaired oxygen dissociation [39]. Exact baseline P50 values were unavailable from the accessible report and were therefore not reconstructed.
Contemporary donor data independently support a higher-P50 phenotype. Phan and colleagues examined 11 donors with T2DM and 11 age- and sex-matched controls. Despite higher HbA1c in T2DM (6.49 ± 0.81% vs 5.39 ± 0.25%), P50 was significantly higher in fresh T2DM blood (P < 0.01), and the difference persisted after processing into red-cell concentrates (P < 0.05) [40]. Thus, even contemporary measurements do not support a universal relationship between greater glycation and lower whole-blood P50.
Substantial heterogeneity was also evident within diabetes. Ebenuwa and colleagues studied 81 individuals with diabetes and 78 controls; 75% of the diabetic cohort had T2DM, and P50 was measured in 58 diabetic participants. Within diabetes, participants with the greatest impairment in erythrocyte deformability had a mean P50 of 28.3 ± 1.5 mmHg compared with 26.7 ± 1.6 mmHg in the least impaired stratum (P = 0.003), and increasing P50 correlated with impaired deformability (r = 0.35, 95% CI 0.098–0.556; P = 0.008). P50 was not significantly associated with HbA1c or fasting glucose [41]. Because the reported P50 analysis combined diabetes types, these estimates were retained as supportive rather than T2DM-specific evidence.
Mixed-diabetes data provided a further higher-P50 example. Samaja and colleagues reported native whole-blood P50 of 29.79 ± 1.68 mmHg in 26 diabetic participants compared with 28.26 ± 1.16 mmHg in 24 controls (P < 0.001), accompanied by a higher 2,3-DPG/Hb ratio [42]. Because diabetes type could not be separated, this study was not treated as T2DM-specific quantitative evidence. Collectively, however, the P50 literature demonstrated all three directional states lower, preserved, and higher P50 rather than a single diabetes-associated oxygen-affinity phenotype.
5.2. Heterogeneity of 2,3-BPG and the Erythrocyte Metabolic Response
Directional heterogeneity was equally evident for 2,3-BPG. In the T2DM cohort studied by Solomon and Cohen, erythrocyte 2,3-BPG was increased at the group level, together with increased hexokinase activity and reduced mean corpuscular hemoglobin concentration, while mean P50 remained normal [37]. Within diabetes, however, both 2,3-BPG and ATP decreased with increasing HbA1c [37]. Thus, an apparently increased group-level allosteric response coexisted with an inverse metabolic gradient across increasing glycation.
A different metabolic state was reported by Resnick and colleagues. In 10 patients with NIDDM, erythrocyte ATP was 1.57 ± 0.13 mM compared with 2.22 ± 0.10 mM in controls, while 2,3-DPG was also suppressed at 6.84 ± 0.48 mM [43]. The parallel reduction of ATP and 2,3-DPG identifies a low-2,3-BPG/low-energy configuration rather than an isolated alteration in a single allosteric effector.
Castilho and colleagues observed only a modest, nonsignificant increase in 2,3-DPG in NIDDM despite HbA1c of 9.0%, while ATP remained essentially unchanged [38]. In the same participants, P50 was numerically higher than in controls and the overall oxygen-dissociation curves were not significantly displaced [38]. This represents a third configuration in which substantial glycation coexisted with minimal 2,3-BPG alteration and preserved-to-higher P50.
Metabolomic profiling provided evidence for a high-2,3-BPG state embedded within broader metabolic remodeling. Palomino-Schätzlein and colleagues studied erythrocytes from 22 patients with T2DM and 21 controls, with validation in an independent cohort of 12 patients with T2DM and six controls. 2,3-BPG had the largest variable-importance score in the HbA1c-associated model (VIP = 4.12), and its concentration correlated positively with HbA1c (Spearman ρ = 0.4919, P = 0.0003), whereas its relationship with contemporaneous plasma glucose was weaker and nonsignificant (ρ = 0.2135, P = 0.1366) [44]. HbA1c was simultaneously associated positively with ATP (ρ = 0.4606, P = 0.0008) and inversely with reduced glutathione (ρ = −0.5944, P < 0.0001), 6-phosphogluconate (ρ = −0.3383, P = 0.0163), and inosine monophosphate (ρ = −0.5624, P < 0.0001) [44]. Increased 2,3-BPG therefore occurred within a multidimensional metabolic phenotype rather than a uniformly enhanced metabolic state.
The opposite glycemic gradient was observed in the 90-patient T2DM cohort, in which erythrocyte 2,3-BPG declined from 4.8 ± 0.4 to 4.5 ± 0.5 and 4.2 ± 0.5 μmol/g Hb across increasing HbA1c strata, concurrently with decreasing P50 [12]. The direction of the HbA1c–2,3-BPG relationship therefore directly contrasted with that reported in the metabolomic cohort [44].
Contextual mixed-diabetes evidence further broadened the range of responses. Samaja and colleagues observed a significantly higher 2,3-DPG/Hb ratio in diabetes than in controls (1.04 ± 0.15 vs 0.86 ± 0.10; P < 0.001), together with higher P50 [42]. Historical treatment data additionally demonstrated temporal plasticity: during initiation of insulin therapy in newly diagnosed nonketotic diabetes, P50 decreased from 26.2 to 24.5 mmHg shortly after treatment (P < 0.005) and subsequently recovered to 26.9 mmHg as metabolic control was established and erythrocyte 2,3-DPG increased. Across the broader study population, oxygen affinity was associated with 2,3-DPG (r = 0.61, P < 0.001) but not with HbA1c [45]. These within-person changes occurred too rapidly to be plausibly explained by corresponding changes in HbA1c and demonstrate that erythrocyte oxygen-affinity physiology can vary dynamically with metabolic state. Taken together, the 2,3-BPG evidence mirrored the directional heterogeneity observed for P50. Higher, minimally altered, and lower 2,3-BPG states were all represented, and opposite associations with HbA1c were observed across T2DM cohorts. Moreover, variation in 2,3-BPG occurred alongside differences in ATP, glycolytic activity, redox metabolites, and other erythrocyte characteristics, indicating that 2,3-BPG should be interpreted within the broader metabolic state rather than as an isolated marker.
5.3. Paired P50–2,3-BPG Patterns
Because neither P50 nor 2,3-BPG alone identifies the physiological processes producing the observed oxygen-affinity state, studies measuring both variables within the same population were examined separately. Six studies provided paired or closely corresponding measurements of 2,3-BPG and a functional oxygen-affinity or oxygen-release endpoint [12,37,38,42,45,46]. Their joint directional patterns are summarized in Table 2. Because 2,3-BPG was reported using non-equivalent units and functional outcomes included native P50, standardized P50, complete oxygen-dissociation curves, and oxygen-dissociation rate constants, raw values were not pooled across incompatible measurement systems. The synthesis therefore emphasized within-study directionality and functional concordance.
The clearest T2DM-specific example of preserved oxygen unloading despite substantial glycation was observed by Castilho and colleagues. HbA1c was 9.0 ± 0.4% in NIDDM compared with 4.6 ± 0.1% in controls, while P50 was 28.5 versus 26.8 mmHg and 2,3-DPG was 2.21 ± 0.08 versus 2.05 ± 0.08 μmol/mL whole blood, respectively; the 2,3-DPG difference was not statistically significant and the overall oxygen-dissociation curves remained comparable [38]. The paired direction is compatible with preserved functional unloading, but the absence of a significant 2,3-BPG difference prevents attribution of preservation specifically to this metabolite.
A stronger concordant high-2,3-BPG/high-P50 configuration was observed in the mixed-diabetes cohort of Samaja and colleagues, in which both 2,3-DPG/Hb and native P50 were significantly higher than in controls [42]. This provides physiologically coherent contextual evidence that increased allosteric modulation can coexist with enhanced oxygen dissociation, although the mixed population prevents T2DM-specific inference.
Solomon and Cohen demonstrated a different configuration. Mean 2,3-BPG was increased and mean P50 remained normal in T2DM, but increasing HbA1c within the diabetic cohort was associated with declining 2,3-BPG, ATP, and standardized P50 [37]. This pattern is compatible with a compensatory response at the group level whose relative adequacy may diminish with increasing glycemic burden, although individual paired trajectories were unavailable and no patient-level compensatory subgroup can be established. The 90-patient contemporary T2DM cohort exhibited the most clearly concordant low-2,3-BPG/low-P50 trajectory. Across increasing HbA1c strata, 2,3-BPG declined by approximately 12.5% from the lowest to highest stratum, while mean P50 decreased by 0.8 mmHg [12]. The HbA1c–P50 relationship persisted after adjustment for 2,3-BPG, indicating that the lower 2,3-BPG concentration did not fully account for the affinity shift [12].
This configuration is therefore compatible with reduced allosteric opposition occurring alongside an additional glycation-associated or metabolic influence on oxygen affinity. Not all preserved functional states could be assigned to a specific metabolic mediator. Marschner and Rietbrock reported HbA1c of 9.3 ± 0.3% in diabetic participants compared with 5.2 ± 0.3% in controls, while oxygen-dissociation rate constants were essentially identical (64.4 ± 3.1 vs 65.1 ± 2.3 s−1). Although 2,3-DPG was increased, experimental analysis indicated that preserved oxygen-release kinetics could not be explained by 2,3-DPG alone [46]. This study was therefore retained as an indeterminate paired configuration rather than being forced into a specifically 2,3-BPG-mediated category.
Finally, the treatment study by Ditzel and colleagues demonstrated that paired states can change over time rather than represent fixed traits. The early decrease and subsequent recovery of P50 during metabolic treatment occurred in parallel with dynamic changes in 2,3-DPG and without a corresponding relationship between P50 and HbA1c [45]. The paired evidence therefore supports physiological plasticity in addition to between-cohort heterogeneity.
5.4. Integrated Result of the Human Evidence
Across the human literature, three findings were consistent at the level of evidence synthesis. First, T2DM was not associated with a reproducibly uniform direction of P50 change: lower, preserved, and higher P50 were each observed in relevant populations [12,36,37,38,39,40,41,42]. Second, 2,3-BPG showed corresponding directional heterogeneity, including increased, minimally altered, and reduced states, with both positive and inverse relationships to glycemic burden [12,37,38,42,43,44,45]. Third, studies measuring P50 and 2,3-BPG together revealed several recurring paired configurations rather than a single relationship between glycation, allosteric regulation, and functional oxygen affinity [12,37,38,42,45,46].
These paired configurations were provisionally described as preserved compensation, potentially incomplete compensation, low-compensation, indeterminate compensation, and dynamic compensation (Table 2). These terms represent exploratory study-level descriptors rather than validated patient phenotypes. No diagnostic thresholds were derived, and differences in P50 methodology, 2,3-BPG units, population composition, and reporting precluded construction of a common absolute physiological scale.
The principal empirical result is therefore not that one compensatory phenotype predominates in T2DM, but that directional heterogeneity itself is reproducible across the human evidence base. Whether these patterns represent biological differences in erythrocyte compensatory capacity, methodological variation, or a combination of both cannot be determined from directionality alone and requires explicit evaluation of the major sources of between-study heterogeneity.
6. Discussion
6.1. Principal Interpretation: Heterogeneity Is the Central Human Finding
The principal finding of this systematic review is not that type 2 diabetes mellitus (T2DM) produces a uniform increase or decrease in hemoglobin–oxygen affinity, but that the human erythrocyte response to diabetes is directionally heterogeneous. Across the primary human evidence synthesized above, lower, preserved, and higher P50 states coexist with increased, minimally altered, or reduced erythrocyte 2,3-bisphosphoglycerate (2,3-BPG) [12,36,37,38,39,40,41,42,43,44,45,46]. Importantly, this heterogeneity is not restricted to comparisons among historical studies.
Opposing patterns are also evident in contemporary cohorts, and substantial variation can occur within individual studies conducted under common analytical conditions [12,37,40,41,44]. The most defensible interpretation is therefore that T2DM does not possess a single erythrocyte oxygen-unloading phenotype.
This finding refines the molecular evidence rather than contradicting it. Glycation at β-Val1 can modify hemoglobin allostery, heterotropic-effector responsiveness, T-state behavior, the Bohr effect, and oxygen-dissociation kinetics [13,14,15,16,17,18,19,20,21]. However, these molecular effects occur within an intact erythrocyte whose oxygen-affinity phenotype is determined by multiple interacting physicochemical, metabolic, and structural influences. Glycation is therefore better conceptualized as an oxygen-affinity pressure acting on a physiologically adjustable system, rather than as a sufficient determinant of whole-blood P50.
The paired P50–2,3-BPG evidence further supports this interpretation. Substantial glycation can coexist with preserved or increased P50 and a directionally appropriate 2,3-BPG response [38,42], whereas increased mean 2,3-BPG can coexist with declining 2,3-BPG, ATP, and standardized P50 as glycemic burden increases within the same cohort [37]. Conversely, a progressive decline in 2,3-BPG can accompany a parallel decline in P50 [12]. Preserved oxygen-release kinetics despite substantial glycation may also occur without 2,3-BPG fully accounting for the preserved functional state [46], while longitudinal treatment data demonstrate that P50 and 2,3-BPG can change rapidly within the same individuals [45]. Collectively, these observations argue that neither P50 nor 2,3-BPG alone is sufficient to define erythrocyte compensatory adequacy.
6.2. Methodological Heterogeneity Must Precede Biological Interpretation
A biological explanation for these opposing patterns is plausible only after the substantial methodological sensitivity of P50 and 2,3-BPG has been considered. P50 depends on pH, PCO2, temperature, organic-phosphate concentrations, and the analytical conditions under which the oxygen-dissociation relationship is constructed [47]. Even among healthy participants, different measurement approaches and experimental conditions produce modest differences in reference P50 values [48,49], while calculated and directly measured P50 values cannot necessarily be treated as interchangeable for detecting small physiological differences [50,51]. This is particularly important because many diabetes-associated differences identified in the present review are only approximately 0.5–2 mmHg.
Pre-analytical handling creates an analogous problem for 2,3-BPG. Delayed analysis, particularly under warmer storage conditions, can cause substantial depletion within hours [52], while sample processing and storage can alter erythrocyte oxygen-affinity characteristics through deterioration of organic-phosphate and metabolic integrity [53].
Consequently, differences in venipuncture-to-analysis time, storage temperature, anticoagulant conditions, sample oxygenation, and the use of fresh whole blood versus processed erythrocytes cannot be regarded as minor laboratory details.
Native and standardized P50 additionally represent related but distinct physiological constructs. Native measurements retain contemporaneous acid–base and circulating influences, whereas standardization attempts to reduce these influences and facilitate comparison of intrinsic erythrocyte oxygen-affinity properties [54]. Standardization may nevertheless remove part of a genuine systemic physiological response when that response is mediated through acid–base changes [55]. Renal disease and dialysis illustrate this distinction: acute alterations in plasma and erythrocyte pH can change in-vivo oxygen affinity without equivalent changes in standardized P50, 2,3-BPG, or ATP [56], while renal dysfunction introduces additional variation through anemia, phosphate balance, acid–base physiology, and erythrocyte turnover [57]. Thus, a small P50 difference observed within a common protocol may be physiologically meaningful, whereas an equally sized difference between studies using different temperatures, pH normalization, instruments, or sample histories is substantially less interpretable. Cross-study heterogeneity should therefore not itself be equated with biological heterogeneity.
6.3. Hematological, Renal, and Erythrocyte-Age Effects Can Exceed the Diabetes Signal
Several biological determinants unrelated to glycation can produce oxygen-affinity changes as large as, or larger than, those reported in T2DM. Anemia provides a well-established example. Human studies demonstrate coordinated increases in erythrocyte 2,3-BPG and P50 as hemoglobin concentration falls, representing an adaptive reduction in oxygen affinity that partially offsets reduced oxygen-carrying capacity [58]. Markedly elevated P50 and 2,3-BPG have likewise been documented across different anemic states [59,60].
Renal disease adds another layer of complexity because it can simultaneously alter hemoglobin concentration, erythropoietic activity, systemic acid–base balance, inorganic phosphate, ATP metabolism, erythrocyte turnover, and 2,3-BPG. Dialysis studies have demonstrated corresponding variation in erythrocyte ATP, 2,3-BPG, and oxygen affinity [61,62], while erythropoietic treatment can alter these relationships dynamically rather than producing a uniform P50 response [63]. These effects are particularly relevant in longstanding T2DM, in which diabetic kidney disease, anemia, iron abnormalities, and erythropoietic interventions may coexist [64]. Erythrocyte age represents an especially important source of biological heterogeneity. Within erythrocytes obtained from the same healthy individuals, the oldest cell fraction exhibited a 2,3-DPG/Hb ratio of 0.57 ± 0.13 compared with 0.96 ± 0.13 in the youngest fraction, while P50 declined from 27.47 ± 1.05 to 23.02 ± 0.85 Torr (P < 0.0005 for both) [65].
The difference was not fully eliminated after accounting for 2,3-BPG, implying additional age-dependent determinants of affinity. This observation acquires particular importance in diabetes because erythrocyte survival itself is heterogeneous. Shortened mean erythrocyte lifespan has been reported in poorly controlled T2DM [66], and larger cohorts demonstrate substantial interindividual variation in lifespan together with relationships to glycemic exposure [67]. Erythrocyte age can therefore influence P50 and 2,3-BPG while simultaneously altering the duration of hemoglobin exposure to glucose and hence the interpretation of HbA1c. Two individuals with similar HbA1c may consequently differ in both effective glycemic exposure and the age distribution of the erythrocytes in which oxygen affinity is measured.
6.4. Additional Affinity Modifiers Further Separate HbA1c From P50
Smoking and dyshemoglobinemia illustrate how independent affinity modifiers can alter P50 without corresponding changes in 2,3-BPG. Carbon monoxide increases the affinity of the remaining available hemoglobin-binding sites [68], and human smoking studies demonstrate changes in carboxyhemoglobin and oxygen affinity that cannot be attributed simply to erythrocyte 2,3-BPG [69,70]. Smoking exposure and, where possible, carboxyhemoglobin should therefore be considered when P50–2,3-BPG relationships are interpreted mechanistically.
Extracellular metabolic composition may exert additional effects. Historical diabetic cohorts demonstrated lower P50 despite increased 2,3-BPG, with particularly pronounced affinity abnormalities in severe hyperlipoproteinemia; incubation experiments further suggested that lipemic plasma itself could modify erythrocyte oxygen affinity [71]. Although these historical classifications cannot be mapped directly onto contemporary T2DM phenotypes, they provide an important proof of principle: the final P50 phenotype can be modified by metabolic factors outside the glycation–2,3-BPG axis.
Erythrocyte oxygen transport should therefore be considered within a broader physiological network rather than as an isolated property of hemoglobin [72]. Treatment adds further temporal complexity. Rapid P50 and 2,3-BPG changes following insulin administration can occur too quickly to be explained by corresponding changes in HbA1c [45,73], while intensive glycemic treatment can alter erythrocyte lifespan over time [74]. Temperature-related effects [75] and storage-associated changes in oxygen affinity [76] reinforce the need for rigorous methodological harmonization. Taken together, these observations support a dual-source model of heterogeneity. A substantial component of between-study discordance is methodological or attributable to recognized physiological modifiers and should not be overinterpreted.
Yet these factors cannot readily explain all internally ordered variation observed under common protocols, including HbA1c-associated changes in P50, 2,3-BPG, and ATP [12,37] or the relationship between P50 and erythrocyte deformability within a single diabetes cohort [41]. Residual heterogeneity after appropriate methodological and physiological adjustment is therefore a plausible candidate marker of differences in erythrocyte compensatory capacity.
6.5. From Oxygen-Affinity Heterogeneity to Erythrocyte Compensatory Reserve
The metabolic evidence provides a biological basis for such residual variation. 2,3-BPG regulation is embedded within glycolytic carbon allocation through the Rapoport–Luebering shunt [23,24,25,26,27], while oxygen-sensitive Band 3 interactions couple hemoglobin oxygenation to redistribution of erythrocyte glucose metabolism [28,30,31,32]. Glycolysis supplies ATP and precursors for 2,3-BPG metabolism, whereas pentose-phosphate pathway activity contributes reducing capacity required for antioxidant defense [33]. T2DM erythrocytes additionally demonstrate adaptive regulation of glucose entry through the S1P–PP2A–GLUT1 pathway [34].
Human metabolomic data show why this network cannot be summarized by a single metabolite. Increased HbA1c can coexist with higher 2,3-BPG and ATP while reduced glutathione, 6-phosphogluconate, IMP, and other metabolites move in different directions [44]. Conversely, simultaneous suppression of ATP and 2,3-BPG identifies a qualitatively different low-energy state [43]. Glycation of BPGM provides an additional potential level of disruption [23].
We therefore define erythrocyte compensatory reserve as the integrated capacity of the erythrocyte population to preserve effective oxygen transport and unloading under glycation-associated and metabolic stress while maintaining the energetic, redox, membrane, and rheological functions required for microvascular oxygen delivery. This reserve is multidimensional. It includes, but is not synonymous with, 2,3-BPG. ATP availability, glycolytic routing, redox capacity, BPGM activity, Band 3-dependent metabolic organization, intracellular acid–base conditions, phosphate availability, membrane properties, deformability, and erythrocyte age may all contribute. Accordingly, increased 2,3-BPG may represent successful recruitment in one context but increased compensatory demand in another; reduced 2,3-BPG may reflect inadequate capacity, altered substrate allocation, cellular aging, or simply absence of a requirement for upregulation. Its meaning depends on the accompanying functional oxygen-affinity phenotype.
6.6. Erythrocyte Dysfunction and Diabetic Complications: Convergent but Non-Causal Evidence
The downstream clinical evidence is less direct than the P50 and 2,3-BPG literature, but it demonstrates substantial convergence between erythrocyte dysfunction, abnormal tissue oxygen physiology, and diabetic complications. Table 3 summarizes this translational evidence separately because these studies should not be interpreted as direct demonstrations of glycohypoxia.
Retinopathy provides the strongest evidence of erythrocyte–microvascular convergence. Reduced deformability is associated not merely with the presence of retinopathy [77], but with increasing severity [78] and objectively measured retinal capillary and ischemic abnormalities [79]. These associations do not establish that erythrocyte dysfunction causes retinal disease, but they demonstrate that systemic erythrocyte impairment and loss of local microvascular reserve coexist within the same clinical phenotype.
The tissue-oxygen evidence simultaneously cautions against simplistic interpretation. Retinal venous oxygen saturation may be increased despite ischemic microvascular pathology [81,82], and TcPO2 can be reduced across several diabetic complication states [85,86,87,89,90] yet paradoxically increased in neuropathy when arteriovenous shunting predominates [88]. Tissue PO2 therefore reflects perfusion, distribution, shunting, diffusion, extraction, and consumption not erythrocyte unloading alone.
Renal evidence provides an even stronger demonstration of this principle. Human BOLD-MRI studies report apparently greater, lower, or unchanged renal oxygenation according to disease phenotype and experimental context [94,95,96,97,98]. Thus, neither diabetes nor diabetic kidney disease can presently be equated with a universal tissue-hypoxia phenotype.
6.7. From Compensatory Mismatch to the Glycohypoxia Compensation–Reserve Model
The combined evidence permits a more constrained reformulation of glycohypoxia. Our previous work proposed glycohypoxia as a glycation-associated impairment of oxygen unloading and provided preliminary quantitative evidence linking higher HbA1c with lower P50 [11,12]. The present systematic synthesis identifies an essential boundary condition that was not adequately resolved by that initial formulation: glycation-associated affinity pressure does not produce a uniform whole-blood phenotype because erythrocyte compensation itself is heterogeneous.
Glycation-associated pressure represents the molecular influence of glycated hemoglobin on allostery and oxygen release. Erythrocyte compensatory reserve determines the extent to which the intact cell counterbalances that influence. Tissue oxygen-delivery reserve determines whether any residual erythrocyte abnormality becomes physiologically consequential.
Within this framework, compensatory mismatch occurs when the integrated erythrocyte response is quantitatively insufficient relative to the affinity pressure it must oppose. The low-P50/low-2,3-BPG trajectory observed across increasing HbA1c strata provides one candidate configuration [12], whereas preserved or increased P50 despite substantial glycation provides evidence that compensation may remain effective in other physiological contexts [38,40,42] Figure 1. These configurations remain study-level patterns and should not yet be interpreted as validated patient phenotypes.
6.8. Operational Definition of Glycohypoxia
On the basis of the present synthesis, we refine glycohypoxia as: Glycohypoxia is a conditional functional oxygen-unloading state in which glycation-associated hemoglobin oxygen-affinity pressure is insufficiently counterbalanced by erythrocyte compensatory mechanisms, producing a residual tendency toward reduced oxygen release whose physiological significance depends on the available tissue oxygen-delivery reserve. This definition establishes several important boundaries. First, glycohypoxia cannot be inferred from HbA1c alone. Substantial glycation may coexist with preserved or increased P50 [38,40]. Second, glycohypoxia concerns hemoglobin oxygen unloading rather than pulmonary oxygen uptake and therefore does not require arterial hypoxemia. The previously reported T2DM cohort, for example, exhibited declining P50 and 2,3-BPG across increasing HbA1c despite no significant difference in PaO2 [12]. Third, glycohypoxia is mechanistically distinct from diabetic pseudohypoxia. The latter describes hyperglycemia-associated disturbances in cellular NADH/NAD+ balance and related reductive/redox pathways [100,101,102]. Glycohypoxia instead concerns oxygen transfer from hemoglobin before cellular utilization. Both processes could theoretically coexist, but they occupy different levels of oxygen transport and metabolism. Finally, glycohypoxia is not synonymous with tissue hypoxia. An erythrocyte unloading abnormality may be completely tolerated when perfusion and tissue reserve are substantial, whereas the same abnormality may acquire greater significance when vascular or metabolic reserve has already narrowed.
6.9. From Erythrocyte Reserve to Tissue Reserve
The second reserve in the GCRM is therefore tissue oxygen-delivery reserve: the capacity of a vascular–tissue unit to preserve effective oxygen availability through regional blood flow, capillary density and recruitment, erythrocyte transit, diffusion, extraction, cellular utilization, and metabolic adaptation.
This distinction resolves several apparent contradictions in the complication literature. Advanced peripheral vascular disease can coexist with directionally enhanced hemoglobin unloading [39]. A right-shifted oxygen-dissociation curve cannot compensate indefinitely for critically impaired macrovascular inflow or microvascular transit. Conversely, a modest affinity increase may have limited physiological significance in a well-perfused tissue but become more important once capillary rarefaction or diffusion abnormalities reduce the margin for further compensation.
At the erythrocyte level, oxidative stress may additionally reorganize membrane-associated physiology. Band 3 can function as a redox-sensitive membrane signaling platform whose phosphorylation state changes under oxidative conditions [103]. This provides a mechanistic connection between redox injury, membrane organization, and erythrocyte functional state, although direct demonstration that this pathway determines P50 heterogeneity in T2DM is still lacking.
At the tissue level, diabetes may modify adaptation to oxygen stress itself. Hyperglycemia can impair HIF-1α stabilization or transcriptional function under some experimental and translational conditions [104,105], and diabetic wounds have demonstrated abnormal HIF-1 responses in hypoxic tissue [106]. The response is not uniformly suppressed: proliferative diabetic retinopathy can exhibit increased HIF-1α and VEGF, with HIF signaling varying according to disease activity [107]. The consequences of an equivalent disturbance in oxygen delivery may therefore differ substantially among tissues and disease stages. Renal physiology provides a final example. Kidney oxygenation reflects not only oxygen supply but the high metabolic requirement of tubular sodium transport; diabetes can modify this balance through changes in filtration and sodium–glucose handling [108]. This provides a physiological explanation for why human renal oxygenation studies [94,95,96,97,98] need not converge on a single direction.
6.10. The Diabetic Erythrocyte as an Underexplored Physiological Integrator
A broader implication emerges from these findings. In diabetes research, the erythrocyte has traditionally been exploited primarily as a historical recorder of glycemic exposure through HbA1c. The present evidence suggests that the same cell may provide a second, comparatively underexplored layer of physiological information: how the organism adapts oxygen transport to chronic metabolic stress.
The mature erythrocyte is metabolically constrained but not physiologically inert. It regulates 2,3-BPG, ATP generation, glycolytic and pentose-phosphate allocation, redox defense, membrane organization, glucose transport, deformability, and hemoglobin allostery [23,24,25,26,27,28,29,30,31,32,33,34,35]. These processes are modified by cellular age [65], chronic hyperglycemia [34,44], renal and hematological physiology [58,59,60,61,62,63,64,65,66,67], oxidative stress [103], and treatment state [45,73,74].
Consequently, two patients with similar HbA1c may possess erythrocyte populations that differ substantially in their capacity to preserve oxygen unloading. This possibility provides a new interpretation of HbA1c discordance itself. HbA1c quantifies accumulated glycation but does not reveal the functional response of the erythrocyte carrying that glycated hemoglobin. Characterizing the diabetic erythrocyte simultaneously as a glycemic recorder and an oxygen-delivery effector may therefore reveal physiological heterogeneity that conventional glycemic classification does not capture.
6.11. Toward an Oxygenomics of Diabetes
The convergence of glycation biology, erythrocyte metabolism, oxygen affinity, rheology, microvascular transit, and tissue oxygen physiology suggests a broader systems-level research field. We propose the term oxygenomics of diabetes as a hypothesis-generating framework for the integrated study of oxygen transport, unloading, distribution, and utilization across molecular, erythrocyte, vascular, and tissue scales in diabetes.
“Oxygenomics” is used here as a conceptual systems framework rather than as a claim for a newly established omics technology. Its purpose is to integrate measurements that have historically been investigated separately: continuous or cumulative glycemic exposure; hemoglobin glycation; native and standardized P50; complete oxygen-dissociation behavior; 2,3-BPG; ATP and glycolytic intermediates; redox state; BPGM and Band 3 biology; erythrocyte age and lifespan; deformability and capillary transit; tissue perfusion; oxygen extraction; and organ-specific oxygen physiology.
The central question consequently changes from whether diabetes shifts the oxygen-dissociation curve to why erythrocytes exposed to apparently comparable glycemic burden differ in their capacity to preserve effective oxygen delivery, and under what tissue conditions those differences become clinically relevant.
This distinction is important because it prevents the GCRM from becoming another single-pathway explanation for diabetic complications. Instead, it positions erythrocyte physiology as one component of a multilevel oxygen-delivery system whose failure may arise at different locations in different patients.
6.12. Translational Predictions and Falsifiability
The immediate value of the GCRM is therefore experimental rather than diagnostic. A decisive prospective study should recruit an adequately powered T2DM population and characterize chronic glycemic exposure together with native and standardized P50, complete oxygen-dissociation behavior where feasible, 2,3-BPG, ATP and selected glycolytic/redox metabolites, erythrocyte deformability, erythrocyte age or lifespan, hematological indices, renal function, phosphate status, smoking or carboxyhemoglobin, and organ-specific microvascular or tissue oxygenation.
The model generates several falsifiable predictions. Individuals with comparable glycemic exposure should exhibit reproducible differences in oxygen-affinity phenotype according to erythrocyte compensatory reserve. These differences should persist after major methodological, hematological, renal, smoking, and erythrocyte-age determinants are controlled. Residual impairment in oxygen unloading should relate more strongly to tissue oxygen physiology when independently measured tissue reserve is reduced. Longitudinal within-person changes should additionally demonstrate coherent remodeling of P50, 2,3-BPG, metabolic state, and tissue physiology as glycemic or clinical conditions change.
Conversely, the GCRM would be substantially weakened if rigorous prospective studies demonstrate that apparent P50–2,3-BPG heterogeneity disappears after methodological and physiological standardization; that paired oxygen-affinity and metabolic measurements fail to identify reproducible physiological states; or that residual erythrocyte phenotypes provide no information about tissue oxygen physiology or clinical outcomes beyond established vascular, renal, hematological, and metabolic determinants.
Unsupervised patient-level clustering may ultimately determine whether the candidate configurations observed at study level represent continuous variation or reproducible biological phenotypes. Until such evidence exists, terms such as preserved compensation, incomplete compensation, and low-compensation pattern should remain exploratory physiological descriptors rather than diagnostic categories.
6.13. Translational Limits and Therapeutic Implications
The framework does not presently justify erythrocyte-directed treatment for glycohypoxia. Manipulation of a single pathway may generate countervailing physiological effects. Increasing glycolytic ATP may alter carbon availability for 2,3-BPG production; increasing 2,3-BPG may facilitate unloading without correcting oxidative injury or impaired deformability; and shifting P50 in a favorable direction cannot restore oxygen delivery when perfusion or capillary transit is severely compromised.
If the model is validated, the relevant therapeutic target would therefore not be normalization of a single metabolite or movement of P50 in a predetermined direction. It would be preservation of compensatory adequacy across hemoglobin affinity, erythrocyte metabolism, redox state, rheology, and downstream tissue oxygen delivery.
This also argues against a universal P50 threshold for glycohypoxia. The same P50 may represent adequate compensation in one patient and inadequate compensation in another depending on the glycation pressure being opposed, the accompanying erythrocyte metabolic state, and the reserve of the target tissue. Longitudinal deviation from an individual’s own physiological state may ultimately prove more informative than a single population reference interval.
6.14. Evidentiary Limits
Several limitations constrain the present interpretation. The primary P50 and 2,3-BPG literature includes small cohorts, historical diabetes classifications, mixed T1DM/T2DM populations, incompatible units, variable analytical methods, and incomplete characterization of renal function, anemia, smoking, treatment state, and erythrocyte age. The strongest complication evidence concerns erythrocyte deformability rather than P50 itself [77,78,79,80,91,99], while tissue oxygenation measurements cannot isolate hemoglobin unloading from perfusion, diffusion, shunting, extraction, and oxygen consumption.
The candidate low-2,3-BPG/low-P50 configuration also derives partly from exploratory data previously reported by our group [12] and therefore requires independent replication. Similarly, study-level paired patterns cannot establish that corresponding phenotypes exist within individual patients.
Most importantly, no adequately powered prospective T2DM study has yet demonstrated the complete proposed sequence from chronic glycemic exposure to glycation-associated affinity pressure, inadequate erythrocyte compensation, impaired in-vivo oxygen unloading, persistent tissue oxygen limitation, and subsequent complication progression. The GCRM must therefore remain a testable integrative physiological model rather than an established causal mechanism of diabetic complications.
6.15. Overall Interpretation
The present synthesis challenges two opposing simplifications. The first is that increasing HbA1c inevitably produces a clinically meaningful leftward shift of the oxygen-dissociation curve. The second is that the absence of a universal P50 shift makes erythrocyte oxygen physiology irrelevant to diabetes. Neither interpretation adequately accommodates the human evidence.
A more coherent model is that chronic glycation acts within a metabolically, structurally, and allosterically adaptive erythrocyte whose compensatory capacity varies among physiological states. The resulting P50 represents the net functional phenotype after these opposing influences have interacted. Whether a residual unloading abnormality subsequently matters depends on a second level of compensation the vascular and metabolic reserve of the target tissue.
The present findings therefore refine rather than simply extend the original glycohypoxia hypothesis [11,12]. Glycohypoxia should not be conceived as an inevitable consequence of elevated HbA1c, but as a conditional state emerging when glycation-associated oxygen-affinity pressure exceeds erythrocyte compensatory reserve and the resulting disturbance becomes relevant within a tissue whose own oxygen-delivery reserve is insufficient.
The GCRM consequently shifts the central question from “Does T2DM increase hemoglobin oxygen affinity?” to a more physiologically informative question: How effectively does the diabetic erythrocyte preserve oxygen unloading under chronic glycemic stress, why does that capacity differ among individuals, and when does loss of that capacity become consequential for a tissue with limited oxygen-delivery reserve?
Answering that question may establish erythrocyte oxygen physiology as an underexplored dimension of T2DM and provide the experimental foundation for an oxygenomics of diabetes in which glycation, erythrocyte metabolism, oxygen unloading, microvascular transport, and tissue oxygen physiology are investigated as interacting components of the same biological system.
7. Conclusion
The available human evidence indicates that T2DM does not produce a universal erythrocyte oxygen-unloading phenotype. Instead, lower, preserved, and higher P50 states coexist with reduced, unchanged, or increased 2,3-BPG, revealing directional physiological heterogeneity. Methodological factors and established modifiers including anemia, renal physiology, erythrocyte age, smoking, treatment state, metabolic-redox status, and membrane mechanics explain part, but not necessarily all, of this variability. We therefore propose the Glycohypoxia Compensation–Reserve Model, which reframes glycohypoxia as a conditional failure of compensation: glycation-associated hemoglobin affinity pressure becomes functionally important when multidimensional erythrocyte compensatory reserve is insufficient and downstream tissue oxygen-delivery reserve is limited. This framework recasts the diabetic erythrocyte from a passive HbA1c-bearing recorder into a potentially dynamic oxygen-delivery effector whose allosteric, metabolic, redox, and rheological adaptations may determine compensatory adequacy. Prospective multimodal studies are now required to validate or falsify this model and establish whether an integrated oxygenomics of diabetes has prognostic or therapeutic relevance.
Author Contributions
Maher Monir Akl: Conception and design, data collection, analysis, and interpretation; writing and critical revision. Amr Ahmed: Supervision. No statistical expertise, funding, administrative, technical, or material support was received.
Funding
The authors received no financial support for the research and publication of this article.
Data Availability Statement
The datasets analyzed for this study are available from the corresponding author upon reasonable request.
Acknowledgments
The authors declare that no generative artificial intelligence (AI) or AI-assisted technologies were used in the preparation of this manuscript.
Conflicts of Interest
The authors declare that there are no conflicts of interest.
References
- Nathan, D. M., Kuenen, J., Borg, R., Zheng, H., Schoenfeld, D., Heine, R. J., & A1c-Derived Average Glucose Study Group (2008). Translating the A1C assay into estimated average glucose values. Diabetes care, 31(8), 1473–1478. [CrossRef]
- Joung, H. N., Kwon, H. S., Baek, K. H., Song, K. H., & Kim, M. K. (2020). Consistency of the Glycation Gap with the Hemoglobin Glycation Index Derived from a Continuous Glucose Monitoring System. Endocrinology and metabolism (Seoul, Korea), 35(2), 377–383. [CrossRef]
- Zafon, C., Ciudin, A., Valladares, S., Mesa, J., & Simó, R. (2013). Variables involved in the discordance between HbA1c and fructosamine: the glycation gap revisited. PloS one, 8(6), e66696. [CrossRef]
- Kim, M. K., Jeong, J. S., Kwon, H. S., Baek, K. H., & Song, K. H. (2017). Concordance the hemoglobin glycation index with glycation gap using glycated albumin in patients with type 2 diabetes. Journal of diabetes and its complications, 31(7), 1127–1131. [CrossRef]
- Khera, P. K., Joiner, C. H., Carruthers, A., Lindsell, C. J., Smith, E. P., Franco, R. S., Holmes, Y. R., & Cohen, R. M. (2008). Evidence for interindividual heterogeneity in the glucose gradient across the human red blood cell membrane and its relationship to hemoglobin glycation. Diabetes, 57(9), 2445–2452. [CrossRef]
- Viskupicova, J., Blaskovic, D., Galiniak, S., Soszyński, M., Bartosz, G., Horakova, L., & Sadowska-Bartosz, I. (2015). Effect of high glucose concentrations on human erythrocytes in vitro. Redox biology, 5, 381–387. [CrossRef]
- Turpin, C., Apalama, M. L., Carnero, B., Otero-Cacho, A., Munuzuri, A. P., Flores-Arias, M. T., Vélia, E., Meilhac, O., Bourdon, E., Álvarez, E., & Rondeau, P. (2022). Impact of Enhanced Phagocytosis of Glycated Erythrocytes on Human Endothelial Cell Functions. Cells, 11(14), 2200. [CrossRef]
- Balcerek, B., Steinach, M., Lichti, J., Maggioni, M. A., Becker, P. N., Labes, R., Gunga, H. C., Persson, P. B., & Fähling, M. (2020). A broad diversity in oxygen affinity to haemoglobin. Scientific reports, 10(1), 16920. [CrossRef]
- Yudin, J., & Verhovsek, M. (2019). How we diagnose and manage altered oxygen affinity hemoglobin variants. American journal of hematology, 94(5), 597–603. [CrossRef]
- Kuppusamy D, Nanda N, Delhi Kumar CG, Vinod KV, Mandal AK, Kar R. Oxygen dissociation curve characteristics of common hemoglobin variants and its potential implications: A brief report. J Hematol Allied Sci. 2025;5:61-5. [CrossRef]
- Akl, M. M., & Ahmed, A. (2026). Glycohypoxia: a hypothesis linking chronic hyperglycemia to functional hypoxia and diabetic complications in type 2 diabetes. Medical gas research, 16(4), 454–461. [CrossRef]
- Akl, M., & Ahmed, A. (2026). Quantitative and preliminary clinical assessment of glycohypoxia as an oxygen-unloading defect linking chronic hyperglycemia to low-grade tissue hypoxia in type 2 diabetes: a targeted translational meta-regression with exploratory blood-sample validation. Frontiers in clinical diabetes and healthcare, 7, 1897413. [CrossRef]
- Koenig, R. J., Blobstein, S. H., & Cerami, A. (1977). Structure of carbohydrate of hemoglobin AIc. The Journal of biological chemistry, 252(9), 2992–2997.
- Bunn, H. F., & Briehl, R. W. (1970). The interaction of 2,3-diphosphoglycerate with various human hemoglobins. The Journal of clinical investigation, 49(6), 1088–1095. [CrossRef]
- Nascimento, A. L. A., Guimarães, A. S., Rocha, T. D. S., Goulart, M. O. F., Xavier, J. A., & Santos, J. C. C. (2024). Structural changes in hemoglobin and glycation. Vitamins and hormones, 125, 183–229. [CrossRef]
- McDonald, M. J., Bleichman, M., Bunn, H. F., & Noble, R. W. (1979). Functional properties of the glycosylated minor components of human adult hemoglobin. The Journal of biological chemistry, 254(3), 702–707.
- Elmer, J., Harris, D., & Palmer, A. F. (2011). Purification of hemoglobin from red blood cells using tangential flow filtration and immobilized metal ion affinity chromatography. Journal of chromatography. B, Analytical technologies in the biomedical and life sciences, 879(2), 131–138. [CrossRef]
- Coletta, M., Amiconi, G., Bellelli, A., Bertollini, A., Carsky, J., Castagnola, M., Condò, S., & Brunori, M. (1988). Alteration of T-state binding properties of naturally glycated hemoglobin, HbA1c. Journal of molecular biology, 203(1), 233–239. [CrossRef]
- Marschner, J. P., Seidlitz, T., & Rietbrock, N. (1994). Effect of 2,3-diphosphoglycerate on O2-dissociation kinetics of hemoglobin and glycosylated hemoglobin using the stopped flow technique and an improved in vitro method for hemoglobin glycosylation. International journal of clinical pharmacology and therapeutics, 32(3), 116–121.
- Krishnamoorthi, S., Saravanakumar, R., & Kumar, V. (2026). Glycation at the Crossroads of Disease Pathogenesis: Mechanistic Insights and Therapeutic Frontiers. Diseases, 14(4), 137. [CrossRef]
- De Rosa, M. C., Sanna, M. T., Messana, I., Castagnola, M., Galtieri, A., Tellone, E., Scatena, R., Botta, B., Botta, M., & Giardina, B. (1998). Glycated human hemoglobin (HbA1c): functional characteristics and molecular modeling studies. Biophysical chemistry, 72(3), 323–335. https://doi.org/10.1016/s0301-4622(98)00117-3.
- Benner A, Patel AK, Singh K, et al. Physiology, Bohr Effect. [Updated 2023 Aug 8]. In: StatPearls [Internet]. Treasure Island (FL): StatPearls Publishing; 2026 Jan-. Available from: https://www.ncbi.nlm.nih.gov/books/NBK526028/.
- Fujita, T., Suzuki, K., Tada, T., Yoshihara, Y., Hamaoka, R., Uchida, K., Matuo, Y., Sasaki, T., Hanafusa, T., & Taniguchi, N. (1998). Human erythrocyte bisphosphoglycerate mutase: inactivation by glycation in vivo and in vitro. Journal of biochemistry, 124(6), 1237–1244. https://doi.org/10.1093/oxfordjournals.jbchem.a022243.
- Rojas-Pirela, M., Andrade-Alviárez, D., Rojas, V., Kemmerling, U., Cáceres, A. J., Michels, P. A., Concepción, J. L., & Quiñones, W. (2020). Phosphoglycerate kinase: structural aspects and functions, with special emphasis on the enzyme from Kinetoplastea. Open biology, 10(11), 200302. [CrossRef]
- Spinelli, S., Marino, A., Morabito, R., & Remigante, A. (2024). Interplay Between Metabolic Pathways and Increased Oxidative Stress in Human Red Blood Cells. Cells, 13(23), 2026. https://doi.org/10.3390/cells13232026.
- Chatzinikolaou PN, Margaritelis NV, Paschalis V, et al. Erythrocyte metabolism. Acta Physiol. 2024; 240:e14081. [CrossRef]
- Xu, Y., Yu, Z., Liu, H., Bian, X., & Tang, W. (2025). Erythrocytes enhance oxygen-carrying capacity through self-regulation. Frontiers in physiology, 16, 1592176. https://doi.org/10.3389/fphys.2025.1592176.
- Chu, H., Breite, A., Ciraolo, P., Franco, R. S., & Low, P. S. (2008). Characterization of the deoxyhemoglobin binding site on human erythrocyte band 3: implications for O2 regulation of erythrocyte properties. Blood, 111(2), 932–938. [CrossRef]
- Kathagen, A., Schulte, A., Balcke, G., Phillips, H. S., Martens, T., Matschke, J., Günther, H. S., Soriano, R., Modrusan, Z., Sandmann, T., Kuhl, C., Tissier, A., Holz, M., Krawinkel, L. A., Glatzel, M., Westphal, M., & Lamszus, K. (2013). Hypoxia and oxygenation induce a metabolic switch between pentose phosphate pathway and glycolysis in glioma stem-like cells. Acta neuropathologica, 126(5), 763–780. [CrossRef]
- Castagnola, M., Messana, I., Sanna, M. T., & Giardina, B. (2010). Oxygen-linked modulation of erythrocyte metabolism: state of the art. Blood transfusion = Trasfusione del sangue, 8 Suppl 3(Suppl 3), s53–s58. https://doi.org/10.2450/2010.009S.
- Lewis, I. A., Campanella, M. E., Markley, J. L., & Low, P. S. (2009). Role of band 3 in regulating metabolic flux of red blood cells. Proceedings of the National Academy of Sciences of the United States of America, 106(44), 18515–18520. https://doi.org/10.1073/pnas.0905999106.
- Chu, H., McKenna, M. M., Krump, N. A., Zheng, S., Mendelsohn, L., Thein, S. L., Garrett, L. J., Bodine, D. M., & Low, P. S. (2016). Reversible binding of hemoglobin to band 3 constitutes the molecular switch that mediates O2 regulation of erythrocyte properties. Blood, 128(23), 2708–2716. https://doi.org/10.1182/blood-2016-01-692079.
- D’Alessandro, A., & Xia, Y. (2020). Erythrocyte adaptive metabolic reprogramming under physiological and pathological hypoxia. Current opinion in hematology, 27(3), 155–162. https://doi.org/10.1097/MOH.0000000000000574.
- Thomas, N., Schröder, N.H., Nowak, M.K. et al. Sphingosine-1-phosphate suppresses GLUT activity through PP2A and counteracts hyperglycemia in diabetic red blood cells. Nat Commun 14, 8329 (2023). [CrossRef]
- Sun, K., Liu, H., Song, A., Manalo, J. M., D’Alessandro, A., Hansen, K. C., Kellems, R. E., Eltzschig, H. K., Blackburn, M. R., Roach, R. C., & Xia, Y. (2017). Erythrocyte purinergic signaling components underlie hypoxia adaptation. Journal of applied physiology (Bethesda, Md. : 1985), 123(4), 951–956. https://doi.org/10.1152/japplphysiol.00155.2017.
- Rand PW, Norton JM, Barker ND, Richards AL, Lacombe EH, Pirone LA. Effects of diabetes mellitus on red cell properties. Clinical Hemorheology and Microcirculation. 1981;1(4):373-384. [CrossRef]
- Solomon, L. R., & Cohen, K. (1989). Erythrocyte O2 transport and metabolism and effects of vitamin B6 therapy in type II diabetes mellitus. Diabetes, 38(7), 881–886. https://doi.org/10.2337/diab.38.7.881.
- Castilho, E. M., Glass, M. L., & Manço, J. C. (2003). The effects of 2,3-diphosphoglycerate, adenosine triphosphate, and glycosylated hemoglobin on the hemoglobin-oxygen affinity of diabetic patients. Brazilian journal of medical and biological research = Revista brasileira de pesquisas medicas e biologicas, 36(6), 731–737. https://doi.org/10.1590/s0100-879x2003000600008.
- Coppola, L., Giunta, R., Verrazzo, G., Luongo, C., Sammartino, A., Vicario, C., & Giugliano, D. (1995). Influence of ozone on haemoglobin oxygen affinity in type-2 diabetic patients with peripheral vascular disease: in vitro studies. Diabete & metabolisme, 21(4), 252–255.
- Phan, C., Rowe, E. M., Yazdanbakhsh, M., Kurach, J., Brandon-Coatham, M., Devine, D. V., Johnson, J. D., & Acker, J. P. (2025). Manufacturing stresses do not differentially impact red blood cells from donors with diabetes. Vox sanguinis, 120(11), 1093–1102. https://doi.org/10.1111/vox.70084.
- Ebenuwa, I., Violet, P. C., Tu, H., Lee, C., Munyan, N., Wang, Y., Niyyati, M., Patra, K., Wilkins, K. J., Parrow, N., & Levine, M. (2024). Altered RBC deformability in diabetes: clinical characteristics and RBC pathophysiology. Cardiovascular diabetology, 23(1), 370. [CrossRef]
- Samaja, M., Melotti, D., Carenini, A., & Pozza, G. (1982). Glycosylated haemoglobins and the oxygen affinity of whole blood. Diabetologia, 23(5), 399–402. https://doi.org/10.1007/BF00260950.
- Resnick, L. M., Gupta, R. K., Barbagallo, M., & Laragh, J. H. (1994). Is the higher incidence of ischemic disease in patients with hypertension and diabetes related to intracellular depletion of high energy metabolites?. The American journal of the medical sciences, 307 Suppl 1, S66–S69.
- Palomino-Schätzlein, M., Lamas-Domingo, R., Ciudin, A., Gutiérrez-Carcedo, P., Marés, R., Aparicio-Gómez, C., Hernández, C., Simó, R., & Herance, J. R. (2020). A Translational In Vivo and In Vitro Metabolomic Study Reveals Altered Metabolic Pathways in Red Blood Cells of Type 2 Diabetes. Journal of clinical medicine, 9(6), 1619. [CrossRef]
- Ditzel, J., Jaeger, P., & Standl, E. (1978). An adverse effect of insulin on the oxygen-release capacity of red blood cells in nonacidotic diabetics. Metabolism: clinical and experimental, 27(8), 927–934. https://doi.org/10.1016/0026-0495(78)90136-1.
- Marschner, J. P., & Rietbrock, N. (1994). Oxygen release kinetics in healthy subjects and diabetic patients. I: The role of 2,3-diphosphoglycerate. International journal of clinical pharmacology and therapeutics, 32(10), 533–535.
- Zijlstra, W. G., Oeseburg, B., Kwant, G., & Zwart, A. (1982). Determination of interdependent ligand effects on human red cell oxygen affinity. Scandinavian journal of clinical and laboratory investigation, 42(4), 339–345.
- Kohzuki, H., Enoki, Y., Sakata, S., & Tomita, S. (1983). A simple microtonometric method for whole blood oxygen dissociation curve and a critical evaluation of the “single point” procedure for blood P50. The Japanese journal of physiology, 33(6), 987–994. https://doi.org/10.2170/jjphysiol.33.987.
- Roberts, M. J., & Cole, P. V. (1982). Simple and rapid method for the assessment of the oxygen affinity of haemoglobin. Annals of clinical biochemistry, 19(Pt 5), 354–357. https://doi.org/10.1177/000456328201900506.
- Chu, Z., Wang, Y., You, G., Wang, Q., Ma, N., Li, B., Zhao, L., & Zhou, H. (2020). The P50 value detected by the oxygenation-dissociation analyser and blood gas analyser. Artificial cells, nanomedicine, and biotechnology, 48(1), 867–874. [CrossRef]
- Kwant, G., Oeseburg, B., & Zijistra, W. G. (1989). Reliability of the determination of whole-blood oxygen affinity by means of blood-gas analyzers and multi-wavelength oximeters. Clinical chemistry, 35(5), 773–777.
- Högman, C. F., Knutson, F., & Lööf, H. (1999). Storage of whole blood before separation: the effect of temperature on red cell 2,3 DPG and the accumulation of lactate. Transfusion, 39(5), 492–497. [CrossRef]
- Donovan, K., Meli, A., Cendali, F., Park, K. C., Cardigan, R., Stanworth, S., McKechnie, S., D’Alessandro, A., Smethurst, P. A., & Swietach, P. (2022). Stored blood has compromised oxygen unloading kinetics that can be normalized with rejuvenation and predicted from corpuscular side-scatter. Haematologica, 107(1), 298–302. [CrossRef]
- Myburgh, J. A., Webb, R. K., & Worthley, L. I. (1991). The P50 is reduced in critically ill patients. Intensive care medicine, 17(6), 355–358. https://doi.org/10.1007/BF01716196.
- Rumi, E., Passamonti, F., Pagano, L., Ammirabile, M., Arcaini, L., Elena, C., Flagiello, A., Tedesco, R., Vercellati, C., Marcello, A. P., Pietra, D., Moratti, R., Cazzola, M., & Lazzarino, M. (2009). Blood p50 evaluation enhances diagnostic definition of isolated erythrocytosis. Journal of internal medicine, 265(2), 266–274. https://doi.org/10.1111/j.1365-2796.2008.02014.x.
- Korus, J., Wydro, M., Gołębiowski, M., Krakowska, K., Poznański, P., Musiał, K., Konieczny, A., Augustyniak-Bartosik, H., Stojanowski, J., Kusztal, M. A., & Gołębiowski, T. (2024). Changes of Dissociative Properties of Hemoglobin in Patients with Chronic Kidney Disease. Diagnostics (Basel, Switzerland), 14(12), 1219. https://doi.org/10.3390/diagnostics14121219.
- Qureshi, R., Nasir, K., Dhrolia, M., & Ahmad, A. (2022). A Comparative Study of Acidosis in Diabetic Advanced Chronic Kidney Disease Patients on and off Metformin. Cureus, 14(1), e21291. [CrossRef]
- Torrance, J., Jacobs, P., Restrepo, A., Eschbach, J., Lenfant, C., & Finch, C. A. (1970). Intraerythrocytic adaptation to anemia. The New England journal of medicine, 283(4), 165–169. https://doi.org/10.1056/NEJM197007232830402.
- Böning, D., & Enciso, G. (1987). Hemoglobin-oxygen affinity in anemia. Blut, 54(6), 361–368. https://doi.org/10.1007/BF00626019.
- Subramaniam, S. K., R, U., M C, V., Raj, A., I, K., & Rao, V. R. (2024). Prevalence of Nutritional Anaemia in Type 2 Diabetes Mellitus in the Absence of Renal Impairment. Cureus, 16(11), e72946. https://doi.org/10.7759/cureus.72946.
- Bursaux, E., Broyer, M., Poyart, C., Bohn, B., & Jean, G. (1978). Oxygen transport in children on maintenance haemodialysis. Clinical science and molecular medicine, 54(1), 85–91. https://doi.org/10.1042/cs0540085.
- Ando, R., Saito, H., & Takeuchi, J. (1987). Factors that affect oxygen affinity of hemoglobin in chronic hemodialysis patients. Nephron, 46(3), 268–272. https://doi.org/10.1159/000184367.
- Brunet, P., Berland, Y., Merzouk, T., Vanuxem, D., Badier, M., Klinkmann, H., & Crevat, A. (1994). Effect of recombinant human erythropoietin treatment in uremic patients on oxygen affinity of hemoglobin. Nephron, 66(2), 147–152. https://doi.org/10.1159/000187792.
- Gembillo, G., Ingrasciotta, Y., Crisafulli, S., Luxi, N., Siligato, R., Santoro, D., & Trifirò, G. (2021). Kidney Disease in Diabetic Patients: From Pathophysiology to Pharmacological Aspects with a Focus on Therapeutic Inertia. International journal of molecular sciences, 22(9), 4824. https://doi.org/10.3390/ijms22094824.
- Samaja, M., Rovida, E., Motterlini, R., Tarantola, M., Rubinacci, A., & diPrampero, P. E. (1990). Human red cell age, oxygen affinity and oxygen transport. Respiration physiology, 79(1), 69–79. https://doi.org/10.1016/0034-5687(90)90061-3.
- Huang, Z., Liu, Y., Mao, Y., Chen, W., Xiao, Z., & Yu, Y. (2018). Relationship between glycated haemoglobin concentration and erythrocyte survival in type 2 diabetes mellitus determined by a modified carbon monoxide breath test. Journal of breath research, 12(2), 026004. https://doi.org/10.1088/1752-7163/aa9081.
- Zhou, S., Dong, R., Wang, J., Zhang, L., Yu, B., Shao, X., Bai, P., Zhang, R., Ma, Y., & Yu, P. (2022). Red Blood Cell Lifespan <74 Days Can Clinically Reduce Hb1Ac Levels in Type 2 Diabetes. Journal of personalized medicine, 12(10), 1738. https://doi.org/10.3390/jpm12101738.
- Gavrilovska-Brzanov, A., Shosholcheva, M., Kuzmanovska, B., Kartalov, A., Mojsova-Mijovska, M., Jovanovski-Srceva, M., Taleska, G., Brzanov, N., Simeonov, R., & Miceska, M. S. (2017). The Influence of Smoking on the Variations in Carboxyhemoglobin and Methemoglobin During Urologic Surgery. Medical archives (Sarajevo, Bosnia and Herzegovina), 71(3), 178–182. https://doi.org/10.5455/medarh.2017.71.178-182.
- Vanuxem, D., Guillot, C., Fornaris, E., Weiller, P. J., & Grimaud, C. (1977). Secondary polycythaemia in chronic respiratory insufficiency. Thorax, 32(3), 317–321. https://doi.org/10.1136/thx.32.3.317.
- Ledwith J. W. (1978). Determining P50 in the presence of carboxyhemoglobin. Journal of applied physiology: respiratory, environmental and exercise physiology, 44(2), 317–321. https://doi.org/10.1152/jappl.1978.44.2.317.
- Ditzel, J., & Dyerberg, J. (1977). Hyperlipoproteinemia, diabetes, and oxygen affinity of hemoglobin. Metabolism: clinical and experimental, 26(2), 141–150. https://doi.org/10.1016/0026-0495(77)90049-x.
- Wise TJ, Ott ME, Joseph MS, Welsby IJ, Darrow CC and McMahon TJ (2024) Modulation of the allosteric and vasoregulatory arms of erythrocytic oxygen transport. Front. Physiol. 15:1394650. [CrossRef]
- Mizutani, K., Uenishi, E., Onoue, T., Maeda, R., Suzuki, K., Handa, T., Kobayashi, T., Iwama, S., Miyata, T., Sugiyama, M., Hagiwara, D., Suga, H., Okazaki, M., Hashizume, A., & Arima, H. (2026). Increased HbA1c relative to actual glycemic control in patients treated with sodium-glucose cotransporter 2 inhibitors. Journal of diabetes investigation, 17(1), 34–41. [CrossRef]
- Song, C. F., Ma, Y. J., Ji, Y. Q., Cai, L. L., Zhao, F., Feng, Y. Y., Lin, J. T., & Huang, Z. H. (2025). Application of the CO breath test to explore the reversibility of hyperglycemia’s impact on erythrocyte lifespan. Journal of breath research, 19(4), 10.1088/1752-7163/adfe0d. https://doi.org/10.1088/1752-7163/adfe0d.
- Samaja, M., Melotti, D., Rovida, E., & Rossi-Bernardi, L. (1983). Effect of temperature on the p50 value for human blood. Clinical chemistry, 29(1), 110–114.
- Lagerberg, J. W., Korsten, H., Van Der Meer, P. F., & De Korte, D. (2017). Prevention of red cell storage lesion: a comparison of five different additive solutions. Blood transfusion = Trasfusione del sangue, 15(5), 456–462. [CrossRef]
- Moon, J. S., Kim, J. H., Kim, J. H., Park, I. R., Lee, J. H., Kim, H. J., Lee, J., Kim, Y. K., Yoon, J. S., Won, K. C., & Lee, H. W. (2016). Impaired RBC deformability is associated with diabetic retinopathy in patients with type 2 diabetes. Diabetes & metabolism, 42(6), 448–452. https://doi.org/10.1016/j.diabet.2016.04.008.
- Tan, J. K. S., Wei, X., Wong, P. A., Fang, J., Kim, S., & Agrawal, R. (2020). Altered red blood cell deformability-A novel hypothesis for retinal microangiopathy in diabetic retinopathy. Microcirculation (New York, N.Y. : 1994), 27(7), e12649. https://doi.org/10.1111/micc.12649.
- Han, Y. E., Lim, J. S., Kim, Y., Kim, I., Moon, J. S., & Lee, J. (2026). Erythrocyte deformability correlates with microvascular ischemia and disease severity in diabetic retinopathy. Journal of diabetes investigation, 17(3), 483–491. https://doi.org/10.1111/jdi.70247.
- Martins-Silva, J., Levy-Cruz, F., Freitas, J. P., & Sousa-Ramalho, P. (1984). Blood filterability and hemoglobin-oxygen affinity in diabetic patients with and without retinopathy. Acta diabetologica latina, 21(2), 133–139. https://doi.org/10.1007/BF02591102.
- Hammer, M., Vilser, W., Riemer, T., Mandecka, A., Schweitzer, D., Kühn, U., Dawczynski, J., Liemt, F., & Strobel, J. (2009). Diabetic patients with retinopathy show increased retinal venous oxygen saturation. Graefe’s archive for clinical and experimental ophthalmology = Albrecht von Graefes Archiv fur klinische und experimentelle Ophthalmologie, 247(8), 1025–1030. https://doi.org/10.1007/s00417-009-1078-6.
- Jørgensen, C. M., Hardarson, S. H., & Bek, T. (2014). The oxygen saturation in retinal vessels from diabetic patients depends on the severity and type of vision-threatening retinopathy. Acta ophthalmologica, 92(1), 34–39. https://doi.org/10.1111/aos.12283.
- Ditzel, J., Nielsen, N. V., & Kjaergaard, J. J. (1979). Hemoglobin AIc and red cell oxygen release capacity in relation to early retinal changes in newly discovered overt and chemical diabetics. Metabolism: clinical and experimental, 28(4 Suppl 1), 440–447. https://doi.org/10.1016/0026-0495(79)90053-2.
- Nielsen, N. V., Ditzel, J., Jensen, S., & Kjaergaard, J. J. (1982). The effect of etidronate disodium (EHDP) on retinopathy in insulin-dependent diabetic patients. Graefe’s archive for clinical and experimental ophthalmology = Albrecht von Graefes Archiv fur klinische und experimentelle Ophthalmologie, 219(2), 60–63. https://doi.org/10.1007/BF02173441.
- Deng, W., Dong, X., Zhang, Y., Jiang, Y., Lu, D., Wu, Q., Liang, Z., Yang, G., & Chen, B. (2014). Transcutaneous oxygen pressure (TcPO2): a novel diagnostic tool for peripheral neuropathy in type 2 diabetes patients. Diabetes research and clinical practice, 105(3), 336–343. https://doi.org/10.1016/j.diabres.2014.05.012.
- Zimny, S., Dessel, F., Ehren, M., Pfohl, M., & Schatz, H. (2001). Early detection of microcirculatory impairment in diabetic patients with foot at risk. Diabetes care, 24(10), 1810–1814. https://doi.org/10.2337/diacare.24.10.1810.
- Eleftheriadou, I., Tentolouris, A., Grigoropoulou, P., Tsilingiris, D., Anastasiou, I., Kokkinos, A., Perrea, D., Katsilambros, N., & Tentolouris, N. (2019). The association of diabetic microvascular and macrovascular disease with cutaneous circulation in patients with type 2 diabetes mellitus. Journal of diabetes and its complications, 33(2), 165–170. https://doi.org/10.1016/j.jdiacomp.2018.10.008.
- Gaylarde, P. M., Fonseca, V. A., Llewellyn, G., Sarkany, I., Thomas, P. K., & Dandona, P. (1988). Transcutaneous oxygen tension in legs and feet of diabetic patients. Diabetes, 37(6), 714–716. https://doi.org/10.2337/diab.37.6.714.
- Huang, K., Ma, Y., Wang, J., Shi, S., Fu, L., Liu, J., Li, L., Lu, H., Liang, X., Liu, Y., & Jiang, H. (2017). The correlation between transcutaneous oxygen tension and microvascular complications in type 2 diabetic patients. Journal of diabetes and its complications, 31(5), 886–890. https://doi.org/10.1016/j.jdiacomp.2017.02.006.
- de Meijer, V. E., Van’t Sant, H. P., Spronk, S., Kusters, F. J., & den Hoed, P. T. (2008). Reference value of transcutaneous oxygen measurement in diabetic patients compared with nondiabetic patients. Journal of vascular surgery, 48(2), 382–388. https://doi.org/10.1016/j.jvs.2008.03.010.
- Cahn, A., Livshits, L., Srulevich, A., Raz, I., Yedgar, S., & Barshtein, G. (2016). Diabetic foot disease is associated with reduced erythrocyte deformability. International wound journal, 13(4), 500–504. https://doi.org/10.1111/iwj.12466.
- Williams, D. T., Price, P., & Harding, K. G. (2006). The influence of diabetes and lower limb arterial disease on cutaneous foot perfusion. Journal of vascular surgery, 44(4), 770–775. https://doi.org/10.1016/j.jvs.2005.06.040.
- Ansarihadipour, H., & Dorostkar, H. (2014). Comparison of plasma oxidative biomarkers and conformational modifications of hemoglobin in patients with diabetes on hemodialysis. Iranian Red Crescent medical journal, 16(11), e22045. [CrossRef]
- Wang, Z. J., Kumar, R., Banerjee, S., & Hsu, C. Y. (2011). Blood oxygen level-dependent (BOLD) MRI of diabetic nephropathy: preliminary experience. Journal of magnetic resonance imaging : JMRI, 33(3), 655–660. https://doi.org/10.1002/jmri.22501.
- Yin, W. J., Liu, F., Li, X. M., Yang, L., Zhao, S., Huang, Z. X., Huang, Y. Q., & Liu, R. B. (2012). Noninvasive evaluation of renal oxygenation in diabetic nephropathy by BOLD-MRI. European journal of radiology, 81(7), 1426–1431. https://doi.org/10.1016/j.ejrad.2011.03.045.
- Sørensen, S. S., Gullaksen, S., Vernstrøm, L., Ringgaard, S., Laustsen, C., Funck, K. L., Laugesen, E., & Poulsen, P. L. (2023). Evaluation of renal oxygenation by BOLD-MRI in high-risk patients with type 2 diabetes and matched controls. Nephrology, dialysis, transplantation : official publication of the European Dialysis and Transplant Association - European Renal Association, 38(3), 691–699. https://doi.org/10.1093/ndt/gfac186.
- Wei, X., Hu, R., Zhou, X., Ni, L., Zha, D., Feng, H., Xu, H., & Wu, X. (2022). Alterations of Renal Function in Patients with Diabetic Kidney Disease: A BOLD and DTI Study. Computational intelligence and neuroscience, 2022, 6844102. https://doi.org/10.1155/2022/6844102.
- Pruijm, M., Hofmann, L., Zanchi, A., Maillard, M., Forni, V., Muller, M. E., Wuerzner, G., Vogt, B., Stuber, M., & Burnier, M. (2013). Blockade of the renin-angiotensin system and renal tissue oxygenation as measured with BOLD-MRI in patients with type 2 diabetes. Diabetes research and clinical practice, 99(2), 136–144. https://doi.org/10.1016/j.diabres.2012.11.004.
- Shin, S., Ku, Y. H., Ho, J. X., Kim, Y. K., Suh, J. S., & Singh, M. (2007). Progressive impairment of erythrocyte deformability as indicator of microangiopathy in type 2 diabetes mellitus. Clinical hemorheology and microcirculation, 36(3), 253–261.
- Williamson, J. R., Chang, K., Frangos, M., Hasan, K. S., Ido, Y., Kawamura, T., Nyengaard, J. R., van den Enden, M., Kilo, C., & Tilton, R. G. (1993). Hyperglycemic pseudohypoxia and diabetic complications. Diabetes, 42(6), 801–813. https://doi.org/10.2337/diab.42.6.801.
- Song, J., Yang, X., & Yan, L. J. (2019). Role of pseudohypoxia in the pathogenesis of type 2 diabetes. Hypoxia (Auckland, N.Z.), 7, 33–40. https://doi.org/10.2147/HP.S202775.
- Wu, J., Jin, Z., Zheng, H., & Yan, L. J. (2016). Sources and implications of NADH/NAD(+) redox imbalance in diabetes and its complications. Diabetes, metabolic syndrome and obesity : targets and therapy, 9, 145–153. https://doi.org/10.2147/DMSO.S106087.
- Pantaleo, A., Ferru, E., Pau, M. C., Khadjavi, A., Mandili, G., Mattè, A., Spano, A., De Franceschi, L., Pippia, P., & Turrini, F. (2016). Band 3 Erythrocyte Membrane Protein Acts as Redox Stress Sensor Leading to Its Phosphorylation by p (72) Syk. Oxidative medicine and cellular longevity, 2016, 6051093. [CrossRef]
- Catrina, S. B., Okamoto, K., Pereira, T., Brismar, K., & Poellinger, L. (2004). Hyperglycemia regulates hypoxia-inducible factor-1alpha protein stability and function. Diabetes, 53(12), 3226–3232. https://doi.org/10.2337/diabetes.53.12.3226.
- Bento, C. F., & Pereira, P. (2011). Regulation of hypoxia-inducible factor 1 and the loss of the cellular response to hypoxia in diabetes. Diabetologia, 54(8), 1946–1956. https://doi.org/10.1007/s00125-011-2191-8.
- Catrina, S. B., & Zheng, X. (2021). Hypoxia and hypoxia-inducible factors in diabetes and its complications. Diabetologia, 64(4), 709–716. https://doi.org/10.1007/s00125-021-05380-z.
- Wang, X., Wang, G., & Wang, Y. (2009). Intravitreous vascular endothelial growth factor and hypoxia-inducible factor 1a in patients with proliferative diabetic retinopathy. American journal of ophthalmology, 148(6), 883–889. https://doi.org/10.1016/j.ajo.2009.07.007.
- Hesp, A. C., Schaub, J. A., Prasad, P. V., Vallon, V., Laverman, G. D., Bjornstad, P., & van Raalte, D. H. (2020). The role of renal hypoxia in the pathogenesis of diabetic kidney disease: a promising target for newer renoprotective agents including SGLT2 inhibitors?. Kidney international, 98(3), 579–589. https://doi.org/10.1016/j.kint.2020.02.041.
Figure 1.
Data-anchored Glycohypoxia Compensation–Reserve Model integrating erythrocyte oxygen-unloading plasticity with tissue oxygen-delivery reserve in type 2 diabetes. The figure integrates molecular, erythrocyte, human physiological, and translational evidence underlying the proposed Glycohypoxia Compensation–Reserve Model (GCRM). Chronic glycemic exposure produces glycation-associated hemoglobin oxygen-affinity pressure, while the resulting whole-blood phenotype is modified by multidimensional erythrocyte compensatory reserve, including 2,3-bisphosphoglycerate (2,3-BPG) metabolism, ATP availability, glycolytic and pentose-phosphate pathway partitioning, NADPH/glutathione-dependent redox buffering, bisphosphoglycerate mutase (BPGM), Band 3-dependent metabolic organization, erythrocyte age/lifespan, and membrane–rheological properties. Illustrative oxygen-dissociation curves depict lower, preserved, and higher P50 states and are anchored to representative P50 values reported in human studies; they are not reconstructed from individual-level oxygen-saturation data. Selected paired human observations demonstrate directional heterogeneity in P50 and 2,3-BPG rather than a universal diabetic oxygen-unloading phenotype. The integrated model proposes a continuum from sufficient through incomplete to insufficient erythrocyte compensation. Glycohypoxia is defined as a conditional functional oxygen-unloading state in which glycation-associated hemoglobin oxygen-affinity pressure is insufficiently counterbalanced by erythrocyte compensatory mechanisms, producing a residual tendency toward reduced oxygen release whose physiological significance depends on the available tissue oxygen-delivery reserve. Tissue reserve encompasses microvascular perfusion and transit, oxygen diffusion and extraction, and cellular utilization; therefore, erythrocyte unloading abnormalities are not equivalent to tissue hypoxia, and the illustrated associations with diabetic retinopathy, neuropathy, peripheral disease, and renal oxygen physiology do not establish causality. The framework ultimately motivates an integrated “oxygenomics of diabetes” approach combining glycemic exposure, P50, 2,3-BPG, erythrocyte energetics/redox state, lifespan, deformability, microvascular physiology, and tissue oxygenation. GCRM is an evidence-derived, hypothesis-generating model and not a validated diagnostic classification or quantitative equation.
Figure 1.
Data-anchored Glycohypoxia Compensation–Reserve Model integrating erythrocyte oxygen-unloading plasticity with tissue oxygen-delivery reserve in type 2 diabetes. The figure integrates molecular, erythrocyte, human physiological, and translational evidence underlying the proposed Glycohypoxia Compensation–Reserve Model (GCRM). Chronic glycemic exposure produces glycation-associated hemoglobin oxygen-affinity pressure, while the resulting whole-blood phenotype is modified by multidimensional erythrocyte compensatory reserve, including 2,3-bisphosphoglycerate (2,3-BPG) metabolism, ATP availability, glycolytic and pentose-phosphate pathway partitioning, NADPH/glutathione-dependent redox buffering, bisphosphoglycerate mutase (BPGM), Band 3-dependent metabolic organization, erythrocyte age/lifespan, and membrane–rheological properties. Illustrative oxygen-dissociation curves depict lower, preserved, and higher P50 states and are anchored to representative P50 values reported in human studies; they are not reconstructed from individual-level oxygen-saturation data. Selected paired human observations demonstrate directional heterogeneity in P50 and 2,3-BPG rather than a universal diabetic oxygen-unloading phenotype. The integrated model proposes a continuum from sufficient through incomplete to insufficient erythrocyte compensation. Glycohypoxia is defined as a conditional functional oxygen-unloading state in which glycation-associated hemoglobin oxygen-affinity pressure is insufficiently counterbalanced by erythrocyte compensatory mechanisms, producing a residual tendency toward reduced oxygen release whose physiological significance depends on the available tissue oxygen-delivery reserve. Tissue reserve encompasses microvascular perfusion and transit, oxygen diffusion and extraction, and cellular utilization; therefore, erythrocyte unloading abnormalities are not equivalent to tissue hypoxia, and the illustrated associations with diabetic retinopathy, neuropathy, peripheral disease, and renal oxygen physiology do not establish causality. The framework ultimately motivates an integrated “oxygenomics of diabetes” approach combining glycemic exposure, P50, 2,3-BPG, erythrocyte energetics/redox state, lifespan, deformability, microvascular physiology, and tissue oxygenation. GCRM is an evidence-derived, hypothesis-generating model and not a validated diagnostic classification or quantitative equation.
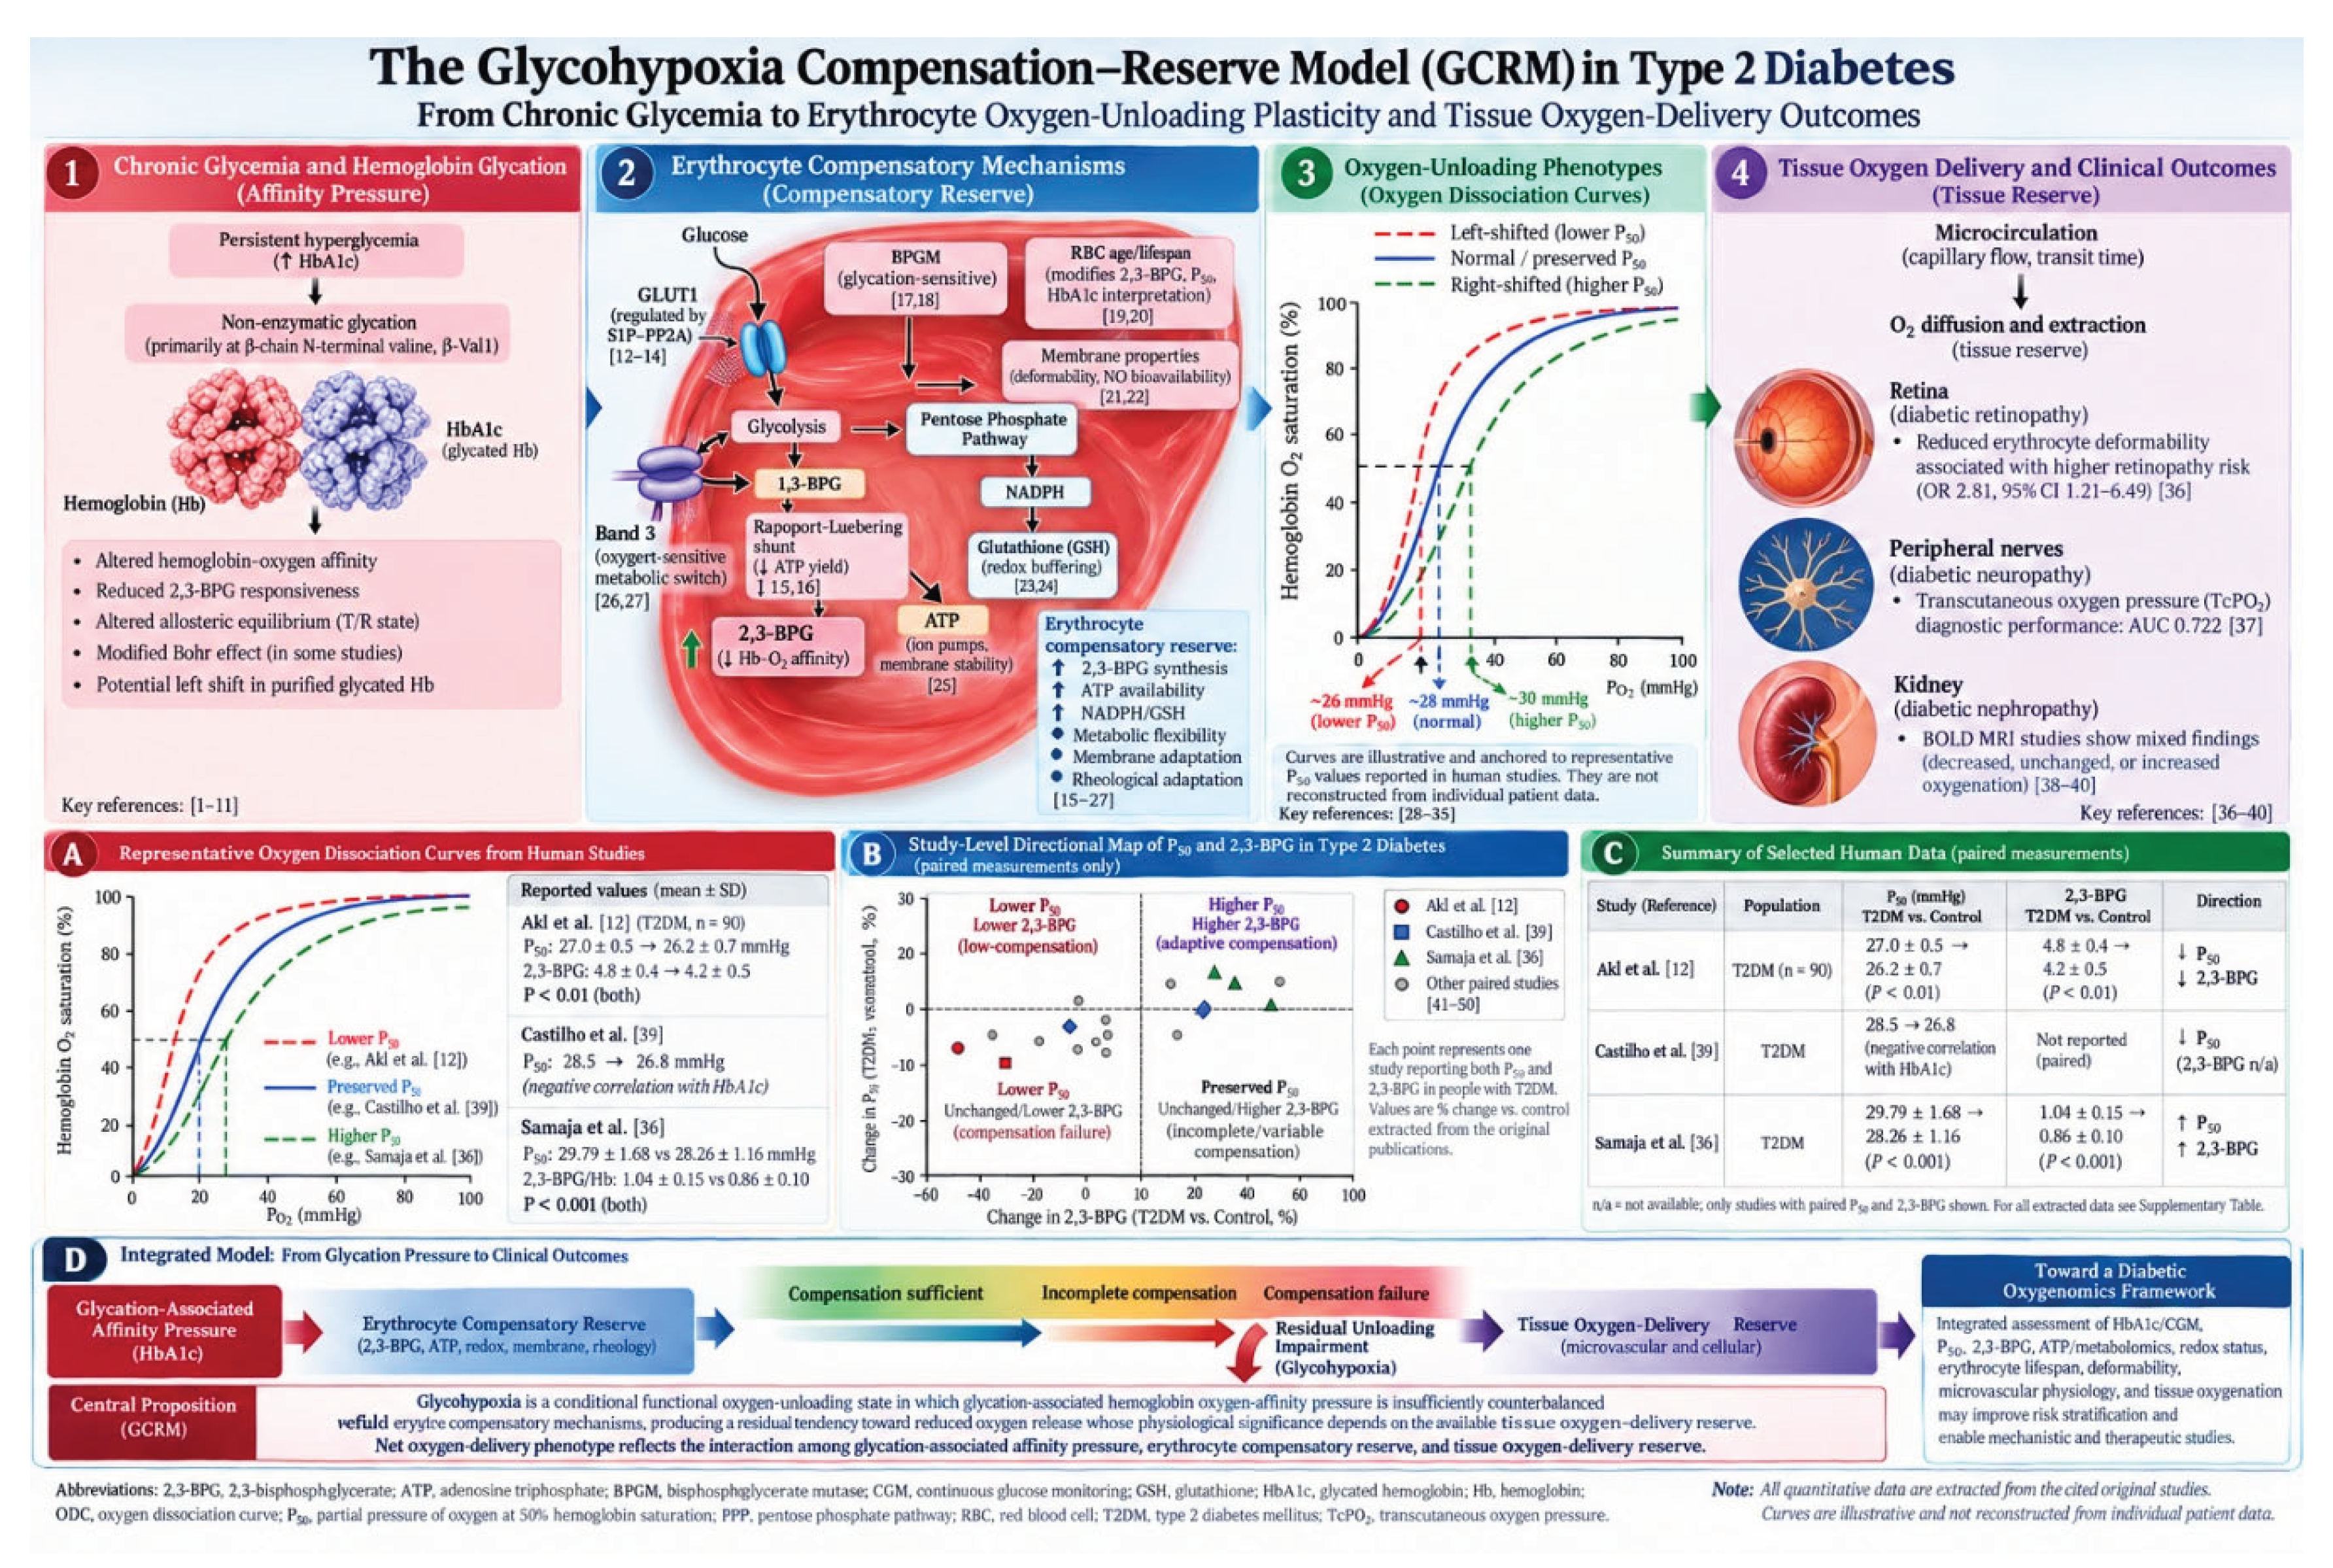

Table 1.
Integrated human evidence for P50, 2,3-BPG, and erythrocyte metabolic heterogeneity relevant to T2DM.
Table 1.
Integrated human evidence for P50, 2,3-BPG, and erythrocyte metabolic heterogeneity relevant to T2DM.
| Study | Population | Glycemic exposure | P50 / functional oxygen-affinity finding | 2,3-BPG / metabolic finding | Evidence role |
| Rand et al., 1981 [36] | 42 juvenile-/adult-onset diabetes; 36 controls | Glycated Hb measured | Standardized P50 ~1 mmHg lower in nonsmoking adult-onset diabetes | 2,3-DPG and rheology assessed | Adult-onset supportive evidence |
| Solomon & Cohen, 1989 [37] | 15 T2DM; 13 controls | HbA1c measured | Mean P50 normal; standardized P50 inversely related to HbA1c | 2,3-BPG increased overall; 2,3-BPG and ATP inversely related to HbA1c | Core T2DM, paired |
| Castilho et al., 2003 [38] | 22 NIDDM; 19 IDDM; 19 controls | HbA1c 9.0% in NIDDM vs 4.6% controls | P50 28.5 vs 26.8 mmHg; overall ODC not significantly displaced | 2,3-DPG modestly, nonsignificantly increased; ATP unchanged | Core T2DM, paired |
| Coppola et al., 1995 [39] | 20 T2DM + peripheral vascular disease; 20 controls | T2DM with vascular disease | Lower Hb–O2 affinity / facilitated dissociation | Oxidative and hemolytic variables assessed | Core T2DM |
| Phan et al., 2025 [40] | 11 T2DM; 11 matched controls | HbA1c 6.49 ± 0.81% vs 5.39 ± 0.25% | Higher P50 in fresh blood (P < 0.01), persisting after processing (P < 0.05) | MCH and MCHC reduced | Contemporary core T2DM |
| Ebenuwa et al., 2024 [41] | 81 diabetes, 75% T2DM; 78 controls | HbA1c 7.9 ± 1.5% | P50 26.7 ± 1.6 vs 28.3 ± 1.5 mmHg across deformability strata; P = 0.003 | P50 associated with deformability impairment | Mixed supportive evidence |
| Samaja et al., 1982 [42] | 26 mixed diabetes; 24 controls | Glycosylated Hb measured | P50 29.79 ± 1.68 vs 28.26 ± 1.16 mmHg; P < 0.001 | 2,3-DPG/Hb 1.04 ± 0.15 vs 0.86 ± 0.10; P < 0.001 | Contextual paired evidence |
| Resnick et al., 1994 [43] | 10 NIDDM; 21 controls; 22 hypertensive | Not sufficiently characterized for gradient | — | 2,3-DPG 6.84 ± 0.48 mM; ATP 1.57 ± 0.13 vs 2.22 ± 0.10 mM controls | Core metabolic T2DM evidence |
| Palomino-Schätzlein et al., 2020 [44] | 22 T2DM/21 controls + validation 12/6 | HbA1c-associated metabolomics | — | 2,3-BPG positively associated with HbA1c; extensive ATP/redox/PPP remodeling | Contemporary metabolic evidence |
| Ditzel et al., 1978 [45] | 10 newly diagnosed nonketotic diabetes + historical cohort | Treatment-dependent | P50 26.2 → 24.5 → 26.9 mmHg | Dynamic 2,3-DPG response; associated with oxygen affinity | Contextual dynamic paired evidence |
| Marschner & Rietbrock, 1994 [46] | Mixed diabetes; controls | HbA1c 9.3 ± 0.3% vs 5.2 ± 0.3% | O2-dissociation rate 64.4 ± 3.1 vs 65.1 ± 2.3 s−1 | Increased 2,3-DPG insufficient to explain preservation alone | Contextual paired evidence |
| Akl & Ahmed, 2026 [12] | 90 T2DM; three HbA1c strata | 6.5 ± 0.3 → 8.0 ± 0.4 → 9.5 ± 0.5% | P50 27.0 ± 0.5 → 26.8 ± 0.6 → 26.2 ± 0.7 mmHg | 2,3-BPG 4.8 ± 0.4 → 4.5 ± 0.5 → 4.2 ± 0.5 μmol/g Hb | Contemporary core paired T2DM |
Table note: ODC, oxygen-dissociation curve; P50, oxygen tension at 50% hemoglobin saturation; 2,3-BPG/2,3-DPG, 2,3-bisphosphoglycerate/2,3-diphosphoglycerate. Mixed-diabetes studies were retained for contextual physiological interpretation but were not treated as T2DM-specific quantitative evidence. Reported values were retained in their original measurement scales where conversion was not methodologically justified.
Table 2.
Exploratory paired mapping of P50–2,3-BPG patterns in human diabetes.
| Study | Glycation context | 2,3-BPG direction | P50 / oxygen-release direction | Joint study-level interpretation |
| Solomon & Cohen [37] | Increased HbA1c | ↑ overall, but ↓ with increasing HbA1c | Mean preserved; ↓ with increasing HbA1c | Potentially incomplete compensation |
| Castilho et al. [38] | HbA1c 9.0% vs 4.6% | Slight ↑, NS | Preserved-to-↑ P50 | Preserved compensation |
| Samaja et al. [42] | Glycosylated Hb elevated | ↑ | ↑ P50 | Preserved/high compensation — contextual |
| Akl & Ahmed [12] | Increasing HbA1c strata | ↓ | ↓ P50 | Low-compensation pattern |
| Marschner & Rietbrock [46] | HbA1c 9.3% vs 5.2% | ↑ | Oxygen-release kinetics preserved | Indeterminate compensatory mediator |
| Ditzel et al. [45] | Rapid treatment transition | Dynamic | Dynamic ↓ then recovery | Dynamic compensation — contextual |
Table note: Classifications are exploratory study-level descriptors and should not be interpreted as validated patient phenotypes or diagnostic categories. Arrows indicate within-study direction rather than quantitatively harmonized effect sizes. NS, not statistically significant. P50 and oxygen-dissociation rate constants were not treated as interchangeable quantitative outcomes.
Table 3.
Human evidence linking erythrocyte dysfunction, tissue oxygen physiology, and diabetic complications.
Table 3.
Human evidence linking erythrocyte dysfunction, tissue oxygen physiology, and diabetic complications.
| Domain | Evidence | Principal finding | Interpretation |
| Diabetic retinopathy | Moon et al. [77] | In 373 T2DM participants, erythrocyte elongation index was lower with retinopathy (30.53 ± 1.95 vs 31.20 ± 1.53; P = 0.001); lowest vs highest deformability quartile: adjusted OR 2.81 (95% CI 1.21–6.49) | Independent association between impaired RBC mechanics and retinopathy |
| Retinopathy severity | Tan et al. [78] | Deformability differed across retinopathy severity in 86 T2DM participants (P = 0.018) | RBC dysfunction tracks disease severity |
| Retinal ischemia | Han et al. [79] | Deformability varied with stage (P = 0.010) and was associated with deep-capillary vessel density, FAZ, and peripheral ischemic index | Strong erythrocyte–microvascular convergence |
| Retinal hemorheology | Martins-Silva et al. [80] | Filterability 12.09 ± 1.37 vs 15.80 ± 0.83 μL/s in diabetes vs controls (P < 0.001) | Contextual evidence of impaired microvascular transit |
| Retinal oxygenation | Hammer et al. [81] | Increased retinal venous O2 saturation in diabetic retinopathy | Vascular O2 retention ≠ adequate tissue extraction |
| Retinal oxygenation | Jørgensen et al. [82] | Arterial and venous oxygen saturation varied with retinopathy phenotype/severity | Oxygen handling is stage-dependent |
| Early retinal abnormalities | Ditzel et al. [83] | Altered erythrocyte oxygen-release physiology accompanied early retinal abnormalities | Hypothesis-generating historical evidence |
| Retinopathy intervention | Nielsen et al. [84] | 2,3-DPG 15.1→16.9 μmol/g Hb and P50 26.3→27.5 mmHg; both P < 0.01 | Oxygen-unloading physiology can change without corresponding HbA1c change |
| Peripheral neuropathy | Deng et al. [85] | Lower TcPO2 with neuropathy; postural TcPO2 difference OR 4.971; AUC 0.722 | Neuropathy associates with abnormal peripheral oxygen physiology |
| Neuropathic foot | Zimny et al. [86] | Abnormal skin oxygen supply despite exclusion of overt PVD | Supports impaired microvascular reserve |
| Neuropathy/PAD | Eleftheriadou et al. [87] | TcPO2 lower in T2DM and related to neurological disability and ABI | Tissue oxygenation integrates neural and vascular disease |
| Neuropathy/shunting | Gaylarde et al. [88] | Paradoxically higher TcPO2 in neuropathy | Demonstrates the importance of AV shunting |
| Aggregate microvascular disease | Huang et al. [89] | Low TcPO2 associated with complications: OR 10.157 (95% CI 4.602–22.418) | Strong tissue-reserve association, not RBC-specific causality |
| Peripheral oxygenation | de Meijer et al. [90] | Foot TcPO2 50.02 ± 8.92 vs 56.04 ± 8.80 mmHg; P < 0.001 | Reduced peripheral oxygen availability |
| Diabetic foot | Cahn et al. [91] | Reduced deformability in T2DM with ulceration | Links RBC mechanics with complication-bearing phenotype |
| Lower-limb disease | Williams et al. [92] | Greatest oxygen abnormality when diabetes, neuropathy, and arterial disease coexisted | Multiple reserve deficits interact |
| Peripheral vascular disease | Coppola et al. [39] | Advanced T2DM vascular disease coexisted with reduced Hb–O2 affinity | Critical counterexample to universal low-P50 complication phenotype |
| Hemodialysis/oxidative RBC injury | Ansarihadipour & Dorostkar [93] | Oxidative/conformational hemoglobin abnormalities in dialysis | Contextual evidence that renal oxidative state can modify erythrocyte physiology |
| Renal oxygenation | Wang et al. [94] | Medullary R2* 13.8 ± 2.4 vs 19.3 ± 1.2 s−1; P = 0.0002; cortical R2* unchanged | Does not support universal renal hypoxia |
| Renal oxygenation | Yin et al. [95] | Opposite BOLD pattern with increased cortical/medullary R2* | Demonstrates directional renal heterogeneity |
| Early diabetic CKD | Sørensen et al. [96] | No significant renal oxygenation difference: 0.71 s−1 (95% CI −0.28 to 1.70); P = 0.16 | Strong counterevidence to a universal deficit |
| DKD phenotype | Wei et al. [97] | BOLD/DTI indices varied with albuminuria and disease phenotype | Renal reserve is phenotype-dependent |
| Renal intervention | Pruijm et al. [98] | Renal oxygenation varied with hemodynamic/drug manipulation | Tissue oxygen balance is dynamic |
| Multiple microangiopathies | Shin et al. [99] | Greater RBC rheological impairment in complication-bearing diabetes | Broad association between RBC dysfunction and microvascular disease |
Disclaimer/Publisher’s Note: The statements, opinions and data contained in all publications are solely those of the individual author(s) and contributor(s) and not of MDPI and/or the editor(s). MDPI and/or the editor(s) disclaim responsibility for any injury to people or property resulting from any ideas, methods, instructions or products referred to in the content. |
© 2026 by the authors. Licensee MDPI, Basel, Switzerland. This article is an open access article distributed under the terms and conditions of the Creative Commons Attribution (CC BY) license (http://creativecommons.org/licenses/by/4.0/).
Copyright: This open access article is published under a Creative Commons CC BY 4.0 license, which permit the free download, distribution, and reuse, provided that the author and preprint are cited in any reuse.