

Submitted:
09 September 2026
Posted:
10 September 2026
You are already at the latest version
Abstract
Fish farming can significantly impact benthic ecosystems, particularly through alterations in water and sediment quality, potentially disrupting ecosystem functioning and biodiversity. This study investigates the effects of fish farming on crustacean and molluscan assemblages in Güllük and Bozburun Gulfs along Turkey's Aegean coast. Macrozoobenthic samples were collected from fish farm sites and corresponding control sites, representing a baseline prior to the relocation of many farms to offshore areas in the 2010s. A total of 114 crustacean and 54 molluscan species were identified at farm sites, compared to 88 crustaceans and 52 molluscs at control sites. Crustaceans, particularly amphipods, were the most diverse group, while bivalves dominated the molluscan assemblages. Species such as Moerella donacina and Varicorbula gibba (Bivalvia) were most abundant at farm sites, whereas Chondrochelia savignyi (Tanaidacea) and Apseudopsis latreillii (Tanaidacea) were dominant at control sites. Ecological differences between Güllük and Bozburun Gulfs, as well as between farm and control sites, were evident, with faunal abundance at farm sites showing stronger correlations with environmental variables, including orthophosphate, silicate, and temperature. Biomass emerged as a key indicator for assessing ecological status, alongside abundance and species composition. Fish farm capacity, as determined by the number of fish cages, played a significant role in shaping faunal patterns, with higher capacity farms exhibiting greater ecological disturbance. This study provides a crucial baseline for future research on the long-term ecological impacts of fish farming, including ecosystem recovery and the role of environmental variables. The findings suggest the importance of incorporating biomass-based indicators and considering farm capacity and site-specific conditions in fish farming management strategies to mitigate environmental degradation.
Keywords:
fish farms
; background data
; molluscans
; crustaceans
; impact
; Turkish coast
1. Introduction
Marine fish and invertebrate aquaculture plays a dual role in coastal ecosystems by contributing to food security while simultaneously exerting pressure on pelagic and benthic environments [1,2,3,4,5,6,7]. This duality necessitates continuous environmental monitoring to ensure that mariculture development proceeds in balance with ecosystem sustainability and societal welfare [8,9]. Fish farming can enhance local productivity and fisheries yields, yet excessive or poorly managed activities may compromise environmental quality [10].
A key concept underpinning sustainable aquaculture management is the carrying capacity of the receiving environment, which represents the threshold beyond which ecological degradation becomes unacceptable [11,12,13,14,15,16,17,18]. Biogeochemical processes, including nutrient cycling, organic matter deposition, and oxygen dynamics, are fundamental determinants of both environmental health and farm performance [19,20]. Effluents derived from aquaculture operations affect abiotic conditions and biological communities across trophic levels, from planktonic to benthic compartments [21,22]. When the assimilative capacity of the environment is exceeded, aquaculture activities may lead to long-term ecosystem degradation, raising concerns regarding the sustainable transfer of marine resources to future generations [16,23,24,25].
The ecological effects of marine aquaculture are highly context dependent, varying among Mediterranean eco-regions, habitat types, and environmental settings. Stronger impacts have generally been reported in the Eastern Mediterranean, whereas Central and Western basins often exhibit lower sensitivity. Soft-bottom habitats are particularly vulnerable to organic enrichment, and recent modeling approaches have emphasized the importance of water temperature and trophic level of farmed species, indicating that low-chlorophyll environments combined with elevated temperatures may experience intensified impacts. Biological responses to aquaculture pressures occur over multiple temporal and spatial scales. Short- to medium-term responses often involve plankton blooms and altered water-column properties, while longer-term effects are manifested in benthic communities [26,27,28,29,30,31,32]. Prolonged phytoplankton blooms may induce hypoxia, increased sedimentation, toxicity, and mass mortality of benthic and nektonic organisms [33,34,35,36]. Zooplankton responses often persist longer than phytoplankton blooms but remain transient compared with benthic organisms, which integrate environmental conditions over extended periods. Ultimately, most particulate material generated within aquaculture systems is deposited on the seabed, where it triggers structural and functional changes in benthic assemblages [37,38,39,40].
Benthic macrofauna are widely recognized as effective indicators of environmental status due to their limited mobility and close association with sediments. Shifts from equilibrium (K-selected) species toward opportunistic (r-selected) taxa reflect increasing organic enrichment and disturbance. Equilibrium assemblages are typically dominated by large-bodied crustaceans and molluscs, whereas opportunistic assemblages are characterized by small annelids, particularly polychaetes and oligochaetes. The relative proportions of these groups provide a robust framework for assessing ecological condition [41,42,43].
Crustaceans and molluscs are among the most sensitive benthic taxa to environmental change and pollution gradients, often exhibiting reduced diversity and biomass with increasing organic loading. Crustaceans, especially amphipods and other peracarids, are frequently used in bioassay studies due to their sensitivity to contamination and habitat alteration [44,45]. Molluscs, one of the most diverse marine phyla, are widely used as indicators across gradients from unpolluted to heavily impacted environments and play key roles in ecosystem functioning and biodiversity maintenance. Nevertheless, some studies have demonstrated that polychaetes and amphipods may outperform molluscs and decapods as indicators in specific aquaculture contexts, such as tuna farming [46,47].
In Turkey, marine aquaculture expanded rapidly along the Aegean coast from the 1980s onward, with intensive clustering of fish farms in sheltered gulfs, particularly Güllük Gulf and, to a lesser extent, Bozburun (Söğüt coast) [1]. Production capacity increased steadily until the late 2000s, after which regulatory measures prompted the relocation of many farms to offshore areas [48,49]. Earlier farming systems relied on small wooden cages, which were later replaced by large-diameter plastic cages, alongside diversification of cultured species, including tuna, meagre, mussels, and oysters. While Güllük Gulf still hosts limited aquaculture activity, Bozburun has been largely cleared of farms.
Previous studies from Muğla and adjacent Aegean bays have documented diverse macrobenthic assemblages, particularly among molluscan and crustacean taxa, although research has predominantly focused on polychaetes. Aquaculture impacts in the Aegean Sea have been shown to be more pronounced in sediments than in the water column and are strongly influenced by local hydrodynamics, grain size, and organic enrichment (e.g. 37, 38, 46]. Seasonal stagnation during summer may further exacerbate these effects, yet baseline data from early periods of intensive farming remain limited.
Against this background, the present study examines environmental parameters and benthic crustacean and molluscan assemblages sampled during the summer of 2003–2004, prior to the large-scale relocation of fish farms from Güllük and Bozburun gulfs. By analyzing species abundance and biomass in relation to farming intensity and environmental gradients, this study aims to establish a robust pre-relocation reference framework for future assessments of ecosystem recovery and for evaluating the balance between ecological costs and socioeconomic benefits of marine aquaculture.
2. Material and Methods
2.1. Study Design
The present benthic study was conducted as part of a larger externally funded project [1] along the Muğla coast (Aegean Sea) during the summers of 2003 and 2004. Field surveys were carried out aboard the R/V Lamas, with each survey lasting approximately 30 days. Two main study areas containing fish farms were investigated: Bozburun, characterized by relatively low farming intensity, and Güllük Gulf, which hosted the majority of fish farms in Turkey (Figure 1).
Two sampling schemes were implemented during the study period. The first survey, conducted in June 2003, focused on sampling control stations to establish baseline benthic biodiversity for comparison with fish farm sites. The second survey, carried out in August 2004, employed an in situ/ex situ design to compare benthic assemblages directly beneath fish farms and at sub-farm stations with those at control sites. Sub-farm stations were located at increasing distances from fish cages while maintaining comparable bottom depths to the corresponding fish farm stations (Table 1, Figure 1). Although the two surveys were separated by one year, they were conducted in the same season, and no significant temporal bias was expected, as benthic communities typically do not undergo abrupt changes unless extreme conditions such as hypoxia or anoxia develop in bottom waters or sediments.
Sampling stations were distributed across two gulfs: Güllük Gulf and Hisarönü Gulf (Bozburun area). At the time of sampling, Güllük Gulf contained the majority of marine fish farms in Turkey, whereas Hisarönü Gulf (Yeşilova Cove) hosted three fish cages in 2003 and eleven cages in 2004. Güllük Gulf includes several coves and two islands of different sizes (Figure 1). Station selection was designed to ensure homogeneous spatial coverage of coves and island surroundings, while also considering prevailing hydrodynamic conditions, including areas of weak and strong water movement. Around selected fish farms, additional stations were established along transects extending away from the cages while maintaining similar bottom depths. These included the Ax series (A0 at the fish farm, with A1 and A2 located progressively farther away), as well as corresponding Sx stations in Güllük Gulf and Bx stations in Bozburun (Table 1; Figure 1). During the surveys, the number of cages at each fish farm was recorded, and cages were classified according to construction material (wood or plastic) and size (typically 5 × 5 m), which served as a proxy for farm capacity.
2.2. Sampling
In parallel with benthic sampling, environmental parameters were measured, including physical, chemical, optical, and hydrodynamic characteristics of the water column. Geographic coordinates of all sampling stations and survey tracklines were recorded using a GPS antenna and display unit (Garmin, USA).
2.1.1. Benthic Sampling
Soft-bottom benthic samples were collected using a van Veen grab with a sampling area of approximately 0.1 m² (Table 1, Figure 1). At each station, one and three replicate grab samples were obtained from fish farm and control sites, respectively since the control sites may be highly variable for the species composition rather than fish farm sites which are under environmental degradation. Only benthic sampling replication was considered, rather than other taxa, there are many methods to rest significance of number of the replicates to represent the sampling stations (e.g. replications continue till no variance present during successive replicates or till reaching 80% of total species). Therefore, [53] discussed the replication as follows: At least 3 replications are highly recommended [50] for the statistical analyses of macrozoobenthic studies, and the statistically sufficient number of replications differs with different methods [51,52]. The replicated sampling that is considered necessary for a better study of many of the other taxa such as plankton, nekton, etc. was not applied, however. Indeed, onboard and laboratory work for macrobenthic studies is complicated and highly time-consuming, and significance of the sufficient number of replications can only be tested after all measurements (mainly species, abundance, or biomass) are obtained even to test the 3 replications that are highly recommended during sampling [50,51,52]. Therefore, all measurements necessary for making the statistical decision of the number of replications to perform are impossible to complete onboard during sampling. Immediately after collection, sediment type was classified visually. Samples were then washed through a nested sieve series with mesh sizes of 2.0, 1.0, and 0.5 mm. The material retained on each sieve was pooled and transferred to appropriately sized plastic containers. Containers were filled to approximately half their volume with the retained material and subsequently preserved in a 5% borax-buffered formaldehyde solution. Samples were stored under these conditions until further laboratory processing, which was conducted in 2020.
2.1.2. Environmental Sampling
During both surveys conducted within the framework of the project covering the entire Muğla coast [1], the number and spatial distribution of sampling stations differed among physical, chemical, and hydrodynamic measurements (Figure S1). Physical parameters were measured at 263 stations in 2003 and 265 stations in 2004 (Figure S1a). Chemical parameters were collected at 64 stations in 2003 and 75 stations in 2004 (Figure S1b, c). In addition, water current measurements were obtained using an Acoustic Doppler Current Profiler (ADCP) along predefined tracklines covering the Muğla coastline (Figure S1d, e). These measurements were intended to support interpretation of large-scale hydrodynamic conditions potentially influencing the study area, particularly in relation to the rim current system connecting the Levantine and Aegean seas (Figure S5-S6).
Physical Parameters: Physical variables were measured using a SeaBird CTD system equipped with probes for depth, temperature, salinity, dissolved oxygen, fluorescence, turbidity, and photosynthetically active radiation (PAR; Li-Cor, USA). At each station, the CTD was deployed from the surface to approximately 2 m above the seabed. Bottom depth was determined using ADCP measurements. For statistical analyses, sea-surface and near-bottom values of physical parameters corresponding to benthic sampling stations were selected (Table 1).
Chemical Parameters: Chemical parameters were measured from surface and near-bottom water samples collected using a 5 L Niskin bottle. Analyses included dissolved inorganic nutrients (orthophosphate, nitrite+nitrate, and reactive silicate), dissolved oxygen (measured onboard using the Winkler titration method), and pH (measured using an onboard pH probe). Water samples for nutrient analyses were transferred into appropriate containers and stored frozen at −20 °C until laboratory analysis at the conclusion of each survey.
Optical Parameters: Optical properties were assessed using a Secchi disk and PAR sensors integrated with the CTD system aboard R/V Lamas. For statistical analyses, Secchi disk depth and PAR values from surface and near-bottom waters were incorporated into the environmental parameter matrix.
Water Current Measurements: Water current profiles were obtained using an ADCP (WorkHorse Sentinel, 300 kHz; RD Instruments, USA) mounted on the bow of the research vessel using a steel support. Current velocity data were recorded from the depth of instrument deployment to the maximum penetration depth achievable by acoustic signals. Acoustic and navigational data were collected using VmDas software (version 1.3; RD Instruments, USA) in conjunction with a GPS antenna (Garmin, USA).
2.3. Laboratory Work
2.3.1. Benthic Analyses
Following sieving, benthic organisms were sorted under a stereomicroscope (SOIF SZM45-B2). Crustacean and molluscan specimens were preserved separately in 70% ethanol in glass vials, while other taxa were stored in separate containers. Species identification was conducted under stereomicroscopy using standard taxonomic literature [54,55,56,57,58,59], supplemented by verified online taxonomic resources. Species nomenclature was updated according to the World Register of Marine Species (WoRMS). For each station, the number of individuals per species was recorded, and total wet biomass was measured using a precision balance (Radwag AS 220/C/2; accuracy 0.0001 g).
2.3.2. Environmental Data Processing
CTD profile data were bin-averaged using SeaSoft software (General Oceanographic) and exported in ASCII format. Spatial distributions of physical parameters at the sea surface and near-bottom layers were mapped using linear interpolation in MATLAB (version 2021a; MathWorks Inc.). Nutrient concentrations were determined from thawed samples using a multi-channel auto-analyzer (Technicon AutoAnalyzer II). Spatial nutrient distributions were visualized using Surfer 12 software (Golden Software) with Kriging interpolation. ADCP data were processed using WinADCP (version 1.11; RD Instruments, USA) and converted to MATLAB format. Current velocity fields were referenced to bottom tracking and a 15 m reference layer in areas where bottom penetration was not achieved.
2.4. Statistical Analyses
Abundance and biomass data for crustacean and molluscan species were standardized to individuals per square meter (ind m⁻²) and grams per square meter (g m⁻²), respectively, based on the area sampled by the grab (0.1 m²). The environmental parameter matrix included both sea-surface and near-bottom values for physical, chemical, and optical variables, along with bottom depth and Secchi disk depth. Each station was assigned categorical factors based on bottom depth (rounded to the nearest depth class) and fish farm capacity, which were clustered using silhouette and k-means analyses to estimate the optimal number of clusters. Two distinct data matrices were used for analysis: one based on species composition found only at fish farm stations with fish cages, and the other on all stations located within fish farm sites, both with and without cages. Silhouette and k-means analyses were applied to each data matrix, which was converted to city-block distance, iterating from 1 to 6 clusters. The criterion value and the best total sum of distances were used to determine the optimal number of clusters. All analyses were performed using MATLAB (version 2021a). Additionally, two control sites were included as reference sites.
Species dominance and occurrence were assessed using percent dominance (DO%; qualitative occurrence across all stations), frequency of occurrence (FO%; presence relative to total species occurrences), and numerical occurrence (NO%; contribution to total abundance), following [60]. Species were classified as constant (DO% > 50), common (25 ≤ DO% ≤ 50), or rare (DO% < 25) based on the Soyer index [51].
Principal Component Analysis (PCA) was subjected to the normalized environmental parameters to explained variance and results were tested among the clusters, sampling year and bottom depth using Euclidean distance estimated for the variables by Permutational multivariate analysis of variance (PERMANOVA). Faunistic structure was characterized using diversity indices, including species richness, abundance, biomass, Margalef’s richness, Pielou’s evenness, and the Shannon–Weaver index [51]. Spearman rank correlation was applied to assess relationships between diversity indices and environmental variables. Non-metric multidimensional scaling (nMDS) based on Bray–Curtis similarity matrices of log₁₀-transformed abundance data was used to visualize differences in faunal assemblages among fish farm capacities and between farm and control sites. PERMANOVA was applied to test for significant differences in species composition among capacity classes, between farm and control sites, and within farm sites (p < 0.05). Similarity percentage (SIMPER) analysis was subsequently used to identify species contributing most to within-group similarity and between-group dissimilarity. These analyses followed [51] guidelines and were performed using PRIMER 6 with PERMANOVA+.
Canonical correspondence analysis (CCA) was applied to explore relationships between species abundance and environmental variables using CANOCO software (version 4.3.1). Ecological status was further assessed using abundance/biomass comparison (ABC) curves, rarefaction curve an alternative method to ABC [51], the AMBI and M-AMBI indices [61], which are designed to detect disturbance gradients and emerging impact sources [62]. It should be noted that the exclusion of polychaetes—one of the most informative benthic indicator groups—represents a limitation of the present study and may result in a partial assessment of ecological status.
3. Results
The results first summarize the environmental conditions measured during the 2003–2004 surveys (Figure S5–S6), providing contextual background for evaluating potential anthropogenic influences on crustacean and molluscan benthic assemblages in relation to fish farm presence, farm clusters, and control sites (see section 1 and 2 in Supplement for the details of the environment of study area).
3.1. Cluster Estimation
To determine the optimal number of clusters based on species composition and cage numbers, two datasets were analyzed: fish farm stations and all stations within fish farm sites. This approach assessed the influence of fish farms or sites on species composition, considering hydrodynamic conditions (Güllük and Bozburun) (Figure 1).
The fish farm dataset identified four optimal clusters, with criterion values of NaN, 0.8080, 0.8976, 0.9527, 0.5904, and 0.6339 (n = 13 stations). The highest criterion value occurred at cluster 4, with a total sum of distances of 18,103.8 after six iterations, and a mean silhouette value of 0.8134 (Figure S2a).
For stations within fish farm sites, four clusters were also optimal after iteration, with criterion values of NaN, 0.8524, 0.8074, 0.8923, 0.8374, and 0.6850 (n = 21 stations). The maximum criterion value occurred at cluster 4, with a total sum of distances of 74,279.1 and a mean silhouette value of 0.8923 (Figure S2d). These results were used to assess species composition and species-environment relationships.
In the first dataset (fish farm stations), the number of cages was inversely related to the number of clusters, but Asin Cove was a distinct location (Figure S2b, g). In the second dataset, no clear trend was observed between cages and cluster number (Figure S2e). Most stations were assigned to cluster 1, while cluster 2 was associated with Asin Cove’s semi-enclosed dip and highest cage numbers. Cluster 3, with no cages, was outside Asin Cove, and cluster 4, found in Çam Cove and Salih Island, had the lowest water current speeds (Figure S6). Both analyses linked clusters to distance from the coastline (Figure S2c, f).
Control sites were grouped separately, revealing Hisarönü in cluster 5 and Güllük in cluster 6, based on their distinct locations. These clusters help explain species composition in relation to environmental factors (Table 1).
3.2. Environmental Setting of the Study Area
The study was conducted in two major fish-farming regions along the Aegean coast of Turkey, Güllük Gulf and Bozburun (Hisarönü Gulf), each with a control site (Figure 1). At the time, no fish farms were present along other Turkish coasts. Güllük Gulf was the most intensively farmed area, whereas Bozburun had fewer farms in the early 2000s.
Güllük Gulf is a semi-enclosed system with four inner coves, while Bozburun is more exposed to open waters (Figure 1). Fish cages were mainly wooden (5 × 5 m, ~5 tons capacity), with some plastic circular cages (10 m diameter, 5 m depth). All farms cultured sea bass (Dicentrarchus labrax) and sea bream (Sparus aurata) using artificial feeding (Figure S3a–d).
Aquaculture production increased substantially before the surveys. Sea bass production rose from 1,900 tons in 1991 to over 10,000 tons by 2000–2001, while sea bream showed similar growth [63,64]. By 2024, production reached 165,055 tons (sea bass) and 155,279 tons (sea bream), largely along the Aegean coast [65].
During the study, regulations were introduced to estimate carrying capacity. After initial limitations, many farms were relocated to deeper waters (>40 m), though some later returned closer to shore.
The Bodrum Peninsula, especially southern Güllük Gulf, has undergone intensive tourism development since the 1980s, with seasonal population increases. Some coves include small settlements and agriculture. In contrast, Bozburun has low tourism pressure, and its fish farm site is relatively isolated. Recreational boating occurred at both sites during summer. Control stations were located at similar depths but away from aquaculture activity (Table 1, Figure 1).
3.1.1. Fish Farm Distribution and Characteristics
The number of fish farms increased from 72 in 2003 to 94 in 2004. In 2003, 59 farms used wooden cages and 23 used plastic cages; by 2004, these numbers rose to 71 and 37, respectively. Wooden cages ranged from 2 to 75 per farm (mean ± SD: 14 ± 11) in 2003 and 1 to 55 (22 ± 9) in 2004. Plastic cages ranged from 5 to 25 (13 ± 6) in 2003 and 1 to 52 (16 ± 12) in 2004 (Figure S3a–d).
In Güllük Gulf, fish farms were mainly located along northern cove margins and around islands (Figure S3a,c). In Bozburun, farms increased from 8 in 2003 to 13 in 2004, with an increase in cage numbers (Figure S3b,d). Each cage produced ~5 tons of fish. Farms were temporarily empty for repairs and maintenance.
By 2019, fish farms were absent from Bozburun, and the number of cages in Güllük Gulf had decreased significantly, with many inner coves no longer used for aquaculture [48,49,66]. Remaining farms operated at higher capacities with modern cages (Figure S3g,h).
Recent observations reported severe degradation of seagrass meadows, particularly Posidonia oceanica, in Güllük Gulf and former Bozburun sites, compared to the seagrass presence in 2003–2004 [1,48,49,66]. SCUBA surveys described the seabed as muddy in these areas [48,49,66]. No active farms along the Aegean coast were found to support seagrass meadows in recent assessments (Figure S3h).
3.3. Species Distribution
This study prioritized clusters presented in Figure S2c over those in Figure S2a to assess species composition, fish farm impacts, and species–environment relationships.
A total of 237 species were recorded, with 159 belonging to Crustacea and Mollusca representing ~33% of the total (Table S1). Fish farm sites hosted 168 species (114 crustaceans, 54 molluscs), while control sites had 140 species (88 crustaceans, 52 molluscs).
Crustaceans dominated both site types. At fish farms, amphipods were most diverse (44 species), followed by decapods (33), cumaceans (13), and isopods (7). At control sites, amphipods also dominated (37 species), followed by decapods (22), cumaceans (12), and tanaidaceans (4). Molluscs were mainly bivalves and gastropods, with 38 and 14 species at fish farms, and 34 and 11 at control sites, respectively.
Based on dominance (DO%), Moerella donacina was the only constant species at fish farm sites, accompanied by eight common species. At control sites, Apseudopsis latreillii, Chondrochelia savignyi, and Nucula nitidosa were constant, with six additional common species (Table S1). Most constant and common species also showed high occurrence frequencies (FO%).
Numerical dominance (NO%) at fish farms was highest for Moerella donacina and Varicorbula gibba, followed by Apseudopsis latreillii, Chondrochelia savignyi, Nucula nitidosa, and Loripinus fragilis. At control sites, dominance was highest for Chondrochelia savignyi and Apseudopsis latreillii, followed by Callianassa subterranea, Haplostylus normanii, Loripinus fragilis, Nucula nitidosa, and Abra nitida (Table S1).
3.4. Faunistic Characters
Faunistic characteristics, including abundance (N), biomass (B), N/B ratio, and N/S ratio [67,68], as well as classical diversity indices, were used to compare qualitative and quantitative patterns among stations at fish farm and control sites (Table 2; Figure S2 and Figure S7). At fish farm sites, faunistic characteristics were examined in relation to the number of fish cages, followed by the clusters (Figure 2).
3.4.1. Fish Farm Site
Species richness (S) at fish farm sites generally decreased with the number of cages, though 25 stations with cages in Clc 4 exhibited higher species counts. Species richness at no-cage sites ranged from 5 to 45 species, with most stations having 15–30 species. Abundance (N) usually decreased with cage number, except in Clc 2 and 4. The Shannon-Weiner diversity index (H’) mirrored species richness (S) and was more pronounced in revealing trends. The evenness index (J’) was inversely related to H’, except for Clc 4. The B/N ratio was higher at Bozburun than Güllük, regardless of cage presence, and N/B and N/S ratios showed little variation, except in Clc 2 and 4.
Among clusters (Clc) at fish farms, Clc 1 (average 24.7 cages) had the highest values for species richness, abundance, biomass, and diversity indices, followed by Clc 4 (14.5 cages). Clc 2, with the highest cage number, exhibited the lowest faunistic diversity. Crustaceans and molluscs were more abundant in Clc 1, with crustaceans dominating at 1,520 ind/m². Clc 4 had higher crustacean species richness, while Clc 3 (no cages) showed contrasting patterns in species richness and abundance between crustaceans and molluscs. A reverse pattern was observed for evenness and H’ (Table 1).
Tanaidacea and Isopoda had the lowest species counts, while Amphipoda, Decapoda, and Bivalvia exhibited the highest species richness, particularly in Clc 1 and 4. Abundance (N) was highest for Bivalvia in Clc 4 and for Amphipoda and Decapoda in Clc 1. Isopoda, Gastropoda, and Scaphopoda had minimal abundance across all clusters, while Cumacea and Tanaidacea showed moderate abundance (Figure 3). Biomass (B) peaked for Bivalvia in Clc 1, followed by Clc 2, with crustaceans showing a clear B/N trend (Figure 3). Gastropods had the highest biomass in Clc 4, and Decapoda peaked in Clc 1, 2, and 3, with the lowest B/N ratio in Clc 4.
Species richness (S) was positively correlated with surface turbidity, near-bottom silicate, and temperature, and negatively with near-bottom density and sub-surface oxygen (p < 0.05) (Table S2). Abundance (N) increased with higher surface silicate and phosphate levels and near-bottom temperature, but decreased with bottom depth and near-bottom density. Evenness (J’) showed the most correlations, with positive correlations to bottom depth and near-bottom density, and negative correlations to sub-surface turbidity, phosphate, nitrite+nitrate, fluorescence, temperature, and surface silicate (p < 0.05). The Shannon-Weiner diversity index (H’) was only correlated with sea-surface turbidity. Biomass increased with surface turbidity and near-bottom temperature, but decreased with near-bottom density and surface oxygen. The number of fish cages was correlated only with sub-surface oxygen levels (Table S2).
For fish farms specifically, correlation patterns were similar but the number of cages was only correlated with sub-surface fluorescence, not near-bottom fluorescence (Table S2).
3.4.2. Control Site
At control sites, Güllük (Clc 6) exhibited higher faunistic values compared to Bozburun (Clc 5, Hisarönü Gulf), which had about half the species richness (S) and species diversity (d) of Güllük. Other faunistic characteristics in Bozburun ranged from 65% to 85% of those in Güllük. Except for Clc 1, control sites generally had higher faunistic values than fish farm sites (Figure 4).
Bozburun hosted 50 species (37 crustaceans, 13 molluscs), while Güllük had 96 species (51 crustaceans, 45 molluscs). Species richness (S) in Bozburun was highest at 60 m depth (H60), increasing with bottom depth, while Güllük showed similar species richness at both shallow and deep stations. The highest abundance (N) occurred at H10 in Bozburun and at GÜ30 in Güllük, with similar distribution patterns for species richness and abundance. Species distribution was uneven at GÜ60 and H10. The Shannon-Weiner diversity index (H’) ranged from low 1.0s at H10 to low 2.0s at H60 in Bozburun and from low 2.0s at GÜ60 to high 3.0s at GÜ30 in Güllük.
Biomass distribution was similar between the control sites, peaking at 30 m depth, with higher B/N ratios indicating larger specimens. The N/S ratio was inversely correlated with the evenness index (J’). At the control sites, Bivalvia had the highest species richness (S), followed by Amphipoda and Decapoda, which contrasted with fish farm sites where Amphipoda dominated. In Hisarönü Gulf, species richness was shared equally between Amphipoda and Bivalvia. Tanaidacea had the highest abundance (N) at control sites, while Bivalvia dominated at fish farm sites. Biomass (B) was highest for Bivalvia and Gastropoda (Figures, 4, S11).
Species richness (S) was positively correlated with near-bottom turbidity, salinity, and phosphate (PO₄), and negatively correlated with sea surface temperature, SiO₂, oxygen, and near-bottom oxygen (p < 0.05) (Table S2). Abundance (N) was correlated with near-bottom turbidity. Species richness (S) and diversity (d) had similar correlations, with diversity also linked to surface water density and salinity. Evenness (J’) decreased with higher sea surface SiO₂ and pH but increased with higher salinity and surface density. Biodiversity (H’) was negatively correlated with lower oxygen and higher SiO₂ and temperature, and positively with higher surface salinity and near-bottom density. Biomass (B) had no significant correlations with environmental variables. The N/B and B/N ratios were negatively and positively correlated with near-bottom NO₂ + NO₃, respectively, at p < 0.05 (Table S2).
3.5. Faunal Assemblages
Principal component analysis (PCA) was used to assess co-linearity among environmental parameters, while canonical correspondence analysis (CCA) examined co-linear relationships between species and environmental variables. Cluster analysis and non-metric multidimensional scaling (nMDS) were applied to identify faunal assemblages independently of environmental variables.
Faunal assemblages differed significantly between fish farm clusters and control sites (p < 0.005). Pairwise comparisons revealed that the faunal composition significantly differed between control sites and Clc 1 and Clc 4 (moderate cage density). The two control sites were also differentiated from each other. However, no significant differences were found between clusters within fish farms or between years and bottom depth classes. Fish farm sites, especially in summer, might stabilize faunal characteristics. Cluster and nMDS analyses separated control sites from fish farm sites, though some stations (A30, K50, and B09) were outliers (Figure 5). Faunal composition was distinct at Hisarönü and the deepest Güllük station (both control sites). Yeşilova Cove in Hisarönü Gulf, despite fish farms, was similar to fish farm locations in Güllük Gulf (Figure 5). Stations GÜ1 and GÜ2 in Güllük, at the Gulf entrance with higher Secchi disk depth and oxygen levels, were distinct from other fish farm stations (Figure S8f).

Table 3.
One-way PerMANOVA results with p values among a variety of the groups and clusters estimated in Figure S2d and pair-wise PerMANOVA results based on faunal abundance. The p (permutated p) and p(MC) (p value of Monte Carlo test) bold values are significantly different at p < 0.05. * denotes a significant difference in faunal composition based on biomass data also.
Table 3.
One-way PerMANOVA results with p values among a variety of the groups and clusters estimated in Figure S2d and pair-wise PerMANOVA results based on faunal abundance. The p (permutated p) and p(MC) (p value of Monte Carlo test) bold values are significantly different at p < 0.05. * denotes a significant difference in faunal composition based on biomass data also.
| Fish farm clusters and control | Fish farm vs control | Fish farm clusters | |||||||||
| Source | df | p | p(MC) | df | p | p(MC) | df | P | P(MC) | ||
| Clusters | 5 | 0.001* | 0.014* | 1 | 0.001* | 0.003 | 3 | 0.705 | 0.621 | ||
| Residual | 32 | 36 | 17 | ||||||||
| Total | 37 | 37 | 20 | ||||||||
| Pair groups | Pair groups | ||||||||||
| 1, 4 | 0.642 | 0.564 | Between control sites | 1, 4 | 0.596 | 0.559 | |||||
| 1, 3 | 0.812 | 0.642 | 1 | 0.001 | 0.001 | 1, 3 | 0.827 | 0.655 | |||
| 1, 2 | 0.437 | 0.41 | 15 | 1, 2 | 0.439 | 0.419 | |||||
| 1, 5 | 0.001 | 0.015 | 16 | 4, 3 | 0.345 | 0.401 | |||||
| 1, 6 | 0.001* | 0.006 | 4, 2 | 0.338 | 0.351 | ||||||
| 4, 3 | 0.323 | 0.4 | 3, 2 | Clusters estimated in Figure S2a | |||||||
| 4, 2 | 0.322 | 0.347 | 3 | 0.89 | 0.794 | ||||||
| 4, 5 | 0.042 | 0.16 | 9 | ||||||||
| 4, 6 | 0.039 | 0.088 | 12 | ||||||||
| 3, 2 | |||||||||||
| 3, 5 | 0.355 | 0.392 | |||||||||
| 3, 6 | 0.202 | 0.347 | |||||||||
| 2, 5 | 0.116 | 0.173 | |||||||||
| 2, 6 | 0.11 | 0.156 | |||||||||
| 5, 6 | 0.001* | 0.003* | |||||||||
The faunal assemblages at fish farms were dominated by Moerella donacina (Bivalvia), Leucothoe oboa (Amphipoda), and Loripinus fragilis (Bivalvia). Control sites were characterized by Apseudopsis latreillii (Tanaidacea), Nucula nitidosa, and Abra nitida (Bivalvia), and Haplostylus normanii (Decapoda). Chondrochelia savignyi was common at both sites (Table 4a). SIMPER analysis indicated that Moerella donacina was a key species at fish farms, while Chondrochelia savignyi, Apseudopsis latreillii, and Haplostylus normanii were contributors at control sites (Table 4b). No contributor species were identified for Clc 2 and Clc 3 due to limited sampling (Table 4c).
At Bozburun, no faunal similarities were observed between fish farm stations, which were dominated by a single species, Urothoe intermedia, while stations without fish farms (NB) were characterized by this same amphipod species. Güllük’s fish farm stations were dominated by Moerella donacina, while non-fish farm stations (NG) had more species (Nucula, Loripinus, Apseudopsis, Leucothoe, and Moerella) (Table S3). Fish farm sites had low average similarity within groups (Table S3).
Ten discriminator species were identified between fish farm and control sites, with a dissimilarity of 89.27%. At fish farms, Moerella donacina, Ampelisca sp., and Loripinus fragilis dominated, while control sites featured Apseudopsis latreillii, Chondrochelia savignyi, Nucula nitidosa, and Abra nitida (Table S4). Varicorbula gibba, an indicator of organic enrichment, was abundant at both sites (Table 4).
SIMPER analysis of clusters showed >82% dissimilarity in faunal composition, except for Clc 3 and Clc 4, which had 72% dissimilarity (Table S5). The number of discriminator species varied significantly, with more species identified in two-way SIMPER (Table 4 and Table S5). No discriminator species were found between Clc 5 (Bozburun control) and other clusters, and the minimum dissimilarity was 72%, indicating significant faunal differences between clusters (Table S5).
One-way SIMPER analysis confirmed that fish farm sites with cages had higher dissimilarity (>93%) compared to sites without cages (Table S6), emphasizing the influence of fish cages on faunal composition, although fewer discriminator species were observed.
Canonical Correspondence Analysis (CCA) revealed a clear separation between control and fish farm sites, with distinct species–environment relationships (Figure 6). Within the fish farm sites, clusters were primarily centered around Clc 1, with a co-linear gradient along CCA1, progressing from the Bozburun (Hisarönü) control site to the Güllük control site. On CCA2, Clc 4 was discriminated from Clc 2 and Clc 3, and the Hisarönü control site was more closely clustered with Güllük, despite Güllük being influenced by intensive aquaculture (Figure 6). Hisarönü, lacking fish farms, was downstream of Bozburun farms and influenced by northward surface currents (Figure 1 and Figure S2, S10).
CCA1 explained 8.4% of the variance but was not statistically significant (F = 0.659, p = 0.330). Species–environment relationships along this axis were weakly correlated with water density but negatively correlated with sea-surface dissolved oxygen, reactive silicate, and temperature (Table S7). CCA2, which explained 7.5% of the variance, was associated with Secchi disk depth, surface fluorescence, and temperature, contrasting with subsurface water density and bottom depth (Table S7; Figure 6). Together, CCA1 and CCA2 explained 15.9% of the variance, but this relationship was not statistically significant (F = 1.022, p = 0.366).
PerMANOVA showed a significant difference in faunal composition between the Güllük and Hisarönü control sites (F = 3.12, p = 0.001), with slightly higher within-site similarity at Hisarönü. At Hisarönü, Apseudopsis latreillii (Tanaidacea) and an amphipod species dominated, while Chondrochelia savignyi (Tanaidacea), Haplostylus normanii (Decapoda), and Abra nitida (Bivalvia) were dominant at Güllük. Nucula nitidosa (Bivalvia) was abundant at both sites and acted as a discriminator species between them (Table S4).
Cumulative dominance curves for both abundance and biomass displayed K-shaped patterns in undisturbed environments and r-shaped patterns in disturbed environments. As organic enrichment increased, the W-statistic (a measure of ecological condition) shifted from positive values (+1, pristine conditions) to negative values (−1, heavily polluted). The W-statistic decreased as disturbance increased, reflecting the intersection or reversal of the biomass and abundance curves [51].
Regarding clusters in Figure S2a, the lowest W-statistic values were observed in Clc 1 (grossly polluted, with the highest number of cages) and Clc 4 (moderately disturbed, with the lowest number of cages). Clc 1 had negative W-statistics, indicating a highly disturbed state, while Clc 3 (with no cages and deeper waters) exhibited the highest W-statistic, indicating a less disturbed environment. Clc 2, located in shallow, sheltered Asin Cove with 25 cages, showed intermediate disturbance levels (Figure S12).
ABC plots at the station level revealed that high-capacity farms in Bozburun supported fewer species compared to Güllük farms. However, both had relatively high W-statistic values compared to stations with moderate cage numbers. Low W-statistic values at high-capacity farms in semi-enclosed coves indicated that water exchange and hydrodynamic conditions play a key role in moderating ecological status (Figure S12 and Figure S10).
For fish farm clusters (Figure S2d), Clc 2 (49 cages, shallow waters) had the lowest W-statistic, classified as grossly polluted. Clc 4 (25 cages) was moderately polluted, and Clc 3 (31 m depth, no cages) had the highest W-statistic, indicating a better ecological state. Fish farms were generally located at greater depths (>25 m), except for station K10 (Figure 7). Additionally, coastal distance influenced the W-statistic, underlining the importance of factors like water depth, site location (enclosed vs. open), and fish farm capacity in determining ecological status (Table S2 and Table S7).
Rarefaction is a straightforward yet effective method for assessing species richness and biodiversity, as it is sample-size and density independent [51]. This method provides an indication of biodiversity in terms of species richness when comparing stations. A more perpendicular and elevated curve indicates higher species richness and biodiversity (Figure 8).
Among the clusters estimated in Figure S2a, Clc 3 exhibited the highest faunal richness. Biodiversity decreased from Clc 2 through Clc 4 to Clc 1 (Figure 8a), with the last three clusters showing progressively poorer ecological conditions in that order.
For the clusters estimated in Figure S2d, the Güllük control site was the richest in biodiversity, followed by Hisarönü and Clc 1, which overlapped in their biodiversity levels (Figure 8b). In Clc 3, biodiversity richness declined, and this trend continued in the other clusters. This pattern was associated with higher abundance (N or n) but a lower number of species per unit of abundance, as indicated by the ES(n) (Figure 8b). Clc 2 was the poorest in terms of biodiversity, followed by Clc 4. These findings corroborated the results of previous analyses conducted in the present study.
Percentage dominance of each ecological group across fish farm and control sites, as well as M-AMBI factorial analysis (Figure 9). Group I species dominated most stations, exceeding 50% of total abundance, with exceptions at stations AC and B1 (49 and 30 cages), A30 and K50 (absence), and GÜ60, H10, and H30 at control sites (Figure 9a). Group II species showed highest dominance at stations B1 and SC (30 and 33 cages), whereas minimum contributions occurred at A20 and A30 (absent) and at AC and IB2 (49 and 23 cages). Group III species were most pronounced at A30 and H10, followed by K50 (absent), BO3 (30 cages, at the deepest depth), and GÜ60 and H30–60 (control).
Species indicative of disturbed or polluted conditions (Group IV) exhibited maximum dominance at AC and A10, followed by A20, IB2, and H30–60 (Figure 9a). No Group V species were recorded at any station.
The M-AMBI score and diversity were negatively and significantly correlated with the number of fish cages (Figure 9b). The 95% confidence limits tended to increase with the number of cages. However, there was no significant correlation between the number of clusters estimated in Figure S2d and either the M-AMBI score or diversity. The highest M-AMBI score and diversity were observed at the Güllük control site (Clc 6) on average (Figure 9c). This is because the cluster numbers are estimated independently based on faunal composition, and the k-means algorithm identifies distinct clusters after determining the optimal number. The clusters themselves are not ordered by number, which accounts for the observed differences in M-AMBI scores and diversity.
4. Discussion
4.1. Limitations
Several limitations should be considered when interpreting the results. First, the dataset represents conditions in 2003–2004, before the subsequent relocation of a substantial proportion of fish farms. Although its historical nature does not diminish its empirical value, major changes have occurred in farm location, cage technology, production capacity, farming intensity, tourism, coastal development, and climate conditions. Therefore, the results should primarily be regarded as a historical pre-relocation reference rather than a direct representation of present-day aquaculture impacts. Direct comparison with contemporary conditions requires repeated sampling using comparable methods and environmental measurements.
A second limitation concerns the temporal structure of sampling. Control stations were sampled during a different period from farm and sub-farm stations. Although both surveys were conducted in summer, differences in month and year may affect benthic communities through seasonal recruitment, interannual environmental variability, and changes in farming intensity. The increase in farm numbers between sampling years further strengthens this possibility. Consequently, differences between control and farm-associated stations cannot be unequivocally attributed to fish-farm activity.
Sampling effort was also asymmetric, with three grabs at control stations but only one at farm stations. This limits estimation of within-station variability at farm sites and creates unequal sampling effort. Treating individual control grabs as independent observations may cause pseudoreplication, whereas pooling them results in a larger sampled area at control sites. This limitation is relevant to comparisons of richness, abundance, biomass, and community structure.
The two principal study areas also differ in geomorphology, hydrodynamics, and farming intensity, all of which may independently influence benthic communities and organic-matter transport. Thus, spatial differences cannot be attributed solely to farming intensity. Moreover, cage number is only a coarse proxy of farming pressure because it does not necessarily reflect cage size, fish biomass, stocking density, feed input, or production intensity.
The absence of quantitative sediment characteristics is another important limitation. Sediment classification was primarily visual, and granulometry was not measured. Because benthic communities are strongly influenced by sediment characteristics, distinguishing farm effects from natural spatial variation is therefore difficult. Similarly, TOC, TN, and TP were not measured during the historical sampling period. Consequently, aquaculture-related organic enrichment cannot be directly quantified or confidently separated from other environmental gradients, including depth, sediment type, and hydrodynamics.
The environmental dataset also differed substantially in spatial coverage from the benthic dataset. Physical and chemical measurements were collected at more stations and over a broader area, while environmental values for some benthic stations were obtained through spatial interpolation. This introduces uncertainty where environmental gradients are strong or measurement stations are distant. ADCP-derived hydrodynamic conditions are likewise subject to temporal and spatial variability associated with tidal phase, wind, and sampling time.
Another limitation is the long interval between collection and laboratory processing. Samples collected in 2003–2004 were processed approximately 16–17 years later after prolonged formaldehyde storage. Although many preserved organisms remain identifiable, extended storage may affect specimen condition and biomass estimates through tissue degradation. Because biomass is used as an ecological indicator, these results should therefore be interpreted cautiously.
The taxonomic scope was restricted to Crustacea and Mollusca rather than the complete macrozoobenthic community. Although these groups provide valuable information, this restriction limits assessment of overall benthic ecological condition. This is particularly relevant to AMBI and M-AMBI, which were applied without Polychaeta. Because polychaetes are important benthic indicators and include both tolerant and sensitive taxa, ecological-status estimates based only on Crustacea and Mollusca should be considered indicative rather than definitive. Capitellidae and Dorvilleidae are tolerant of organic enrichment, whereas Magelonidae and Sabellidae are sensitive to pollution [69].
The statistical analyses also have limitations concerning clustering, replication, and variable independence. If clusters were partly defined using faunal composition and subsequently used to test faunal differences, the analyses may be partly circular. Arbitrary cluster numbers should also not be treated as ordered numerical predictors. Environmental analyses may be affected by correlations among temperature, salinity, density, and surface versus near-bottom measurements. Because the CCA species–environment relationship was not statistically significant, individual species–environment associations should not be interpreted as strong evidence of environmental control.
Finally, the study does not directly assess benthic recovery following cage removal because repeated post-removal observations are unavailable within the same sampling framework. It therefore provides a historical reference rather than a measured trajectory of ecological recovery, and contemporary management recommendations cannot be directly validated from these data. Future assessments should employ standardized contemporary surveys, preferably incorporating BACI designs, complete macrofaunal assemblages, quantitative sediment granulometry, TOC, TN, TP, and appropriately matched environmental measurements.
Overall, these limitations do not negate the dataset’s value as a historical empirical record of selected macrozoobenthic groups and environmental conditions during an important period of Turkish marine aquaculture development. Its principal value is as a baseline for future standardized assessments of long-term environmental change. Conclusions regarding direct farm effects, ecological status, causal environmental drivers, and contemporary management should therefore remain appropriately cautious.
4.2. Overall Insight
Previous studies indicate that intensive bivalve culture can negatively affect macrofaunal assemblages [5]. In contrast, polyculture and spatially integrated approaches have been proposed as mitigation strategies. [70] highlighted that spatial integration of mussels should optimize production while minimizing environmental effects. Integrated multitrophic aquaculture (IMTA), incorporating sponges, polychaetes, mussels, and sea cucumbers, can utilize fish-farm-derived nutrients and potentially reduce environmental impacts. However, their success depends on carrying capacity and ecological balance, which are often insufficiently considered given diverse pollution sources and site-specific conditions.
Climate warming further complicates aquaculture management by altering pelagic–benthic energy fluxes and potentially promoting hypoxia through enhanced stratification and organic inputs. Sensitive species such as the sea urchin Paracentrotus lividus are vulnerable, as larval toxicity correlates with sulfide and ammonia nitrogen concentrations from fish farms [71]. Fish cages also disturb the seabed, while uneaten feed and fish waste increase organic enrichment. Phytoplankton blooms may account for 60–70% of organic inputs around fish farms, even at small spatial scales [72]. Conversely, deposit-feeding organisms such as sea cucumbers can reduce fish-farm organic loads [73,74].
From a policy perspective, aquaculture impacts remain debated in terms of economic benefits versus ecological costs [17,75]. Poorly managed aquaculture may cause irreversible ecological degradation and exceed ecosystem carrying capacity [18]. Effective policy must balance short-term economic priorities with long-term environmental sustainability. Although regulations for fish-farm siting exist, enforcement is inconsistent. Farms may be relocated after mass mortality events, leaving degraded sites without remediation (E. Mutlu, 2024; Y. Özvarol, pers. comm.).
Polyculture involving filter-feeding bivalves may improve sustainability, although bivalve integration alone may not substantially reduce fish-farm waste or environmental impacts [76]. Multi-use offshore concepts combining aquaculture with renewable energy provide alternative spatial solutions [77,78]. Nevertheless, continued global aquaculture expansion raises concerns about biodiversity loss, wild fish stocks, genetic interactions involving escapees, and habitat degradation [79].
4.3. Environment
Fish-farm areas are characterized by elevated fluorescence, reduced photosynthetically active radiation (PAR), shallow Secchi depth, and increased turbidity. These changes, together with nitrogen and phosphorus dynamics, are strongly influenced by aquaculture. Inputs from fish excretion, uneaten feed, and mortalities intensify biogeochemical cycling, potentially causing oxygen depletion, trophic shifts, and, in severe cases, fish mortality within and around farm sites [80,81].
Temporal variability complicates environmental assessment. Nutrient and chlorophyll-a concentrations around fish farms can fluctuate diurnally, with midday peaks, emphasizing careful sampling to minimize bias. In the Mediterranean, inorganic nutrients such as nitrate, nitrite, ammonium, orthophosphate, and reactive silicate are mainly supplied by surface waters, particularly during rainy periods.Particulate phosphorus sedimentation around fish cages decreases with distance despite variation in depth, production intensity, and hydrodynamics [82]. Bio-irrigation by benthic fauna enhances ammonium and phosphate release from sediments, although this effect is stronger in eutrophic than ultra-oligotrophic environments. Organic carbon accumulation beneath cages increases benthic oxygen demand. During 2003–2004, near-bottom nitrogen concentrations were higher at fish-farm sites, while oxygen was low, particularly in deeper waters because of limited mixing and enhanced bacterial mineralization.
Recovery after farm removal can be slow and incomplete. Even after 23 months, macrofaunal communities had not fully recovered, partly because of secondary disturbances such as benthic algal blooms [83]. Phosphorus concentrations decreased with distance from farms, whereas macrofaunal biomass peaked at intermediate distances, reflecting subsidy–stress dynamics [84]. Strong currents can mitigate impacts through enhanced water exchange and support diverse benthic assemblages [84].
Fish-farm effluent concentrations are highest near cages and decline with distance [4]. In Mediterranean systems, aquaculture-derived carbon and nitrogen can be isotopically traced across wide areas, including moderate depths and current speeds [85,86]. Impacts are particularly pronounced in vegetated systems, where organic and inorganic carbon, nitrogen, and phosphorus releases are higher in Posidonia oceanica meadows than in unvegetated areas, contributing to meadow degradation [87,88].
Fish-farming effects on P. oceanica are detectable through structural and physiological indicators. A minimum buffer distance of 400 m has been recommended to protect meadows from aquaculture pressures [82]. Meadows near cages show reduced shoot size, biomass, and photosynthetic performance, together with elevated phosphorus and epiphyte loads [89]. Recent assessments indicate that newly established fish-farm locations in the Turkish Aegean lack pristine P. oceanica meadows, with meadow occurrence depending on current direction and velocity [48,49].
Given the importance of P. oceanica for long-term carbon storage, its protection is essential. Silty sediments near fish farms exhibit greater organic carbon accumulation, oxygen consumption, and phosphate release, together with lower benthic diversity than coarser sediments, making them more vulnerable to degradation [90]. Overall, aquaculture–environment interactions are strongly site-specific and depend on production scale and local characteristics [91].
4.4. Species Composition
Environmental gradients influence benthic biodiversity through direct and indirect mechanisms. Direct gradients include sediment grain size and temperature, whereas resource-related gradients involve chemical availability, nutrients, and energy fluxes [92]. Indirect gradients can result from depth–latitude interactions that shape species distributions and community structure [93]. Major coastal biodiversity drivers include eutrophication and nutrient enrichment, which generally reduce species richness while increasing evenness in nearshore benthic assemblages, contrasting with oligotrophic systems where higher diversity is maintained [94,95,96].
Particulate organic carbon fluxes, particularly TOC, are important in explaining benthic community structure and distributions of tolerant, intolerant, and opportunistic species [97]. However, TOC alone may not correlate consistently with faunal attributes because of bacterial degradation in enriched sediments [98,99]. Changes under organic pollution are better represented by combined metrics, including abundance, biomass, diversity indices, abundance-to-biomass ratios, and taxon-specific indicators such as polychaete dominance [51,68]. Recolonization may be rapid: within a month of farm removal, molluscs accounted for nearly half of species richness, while polychaetes dominated abundance, followed by community changes along decreasing pollution gradients [100].
This study focused on crustacean and molluscan assemblages to compare species composition among fish-farm sites, controls, and different farm-capacity categories. Large-bodied species were replaced by smaller taxa in impacted areas, likely reflecting the competitive advantage of smaller organisms and their higher surface-to-volume ratios under stressful conditions, resulting in reduced evenness and diversity. Crustaceans are important trophic links for demersal fish and humans and serve as indicators of environmental quality, habitat conditions, and eutrophication. [53] identified three assemblage types: (i) eutrophic sites dominated by decapods with high biomass and low taxonomic diversity; (ii) vegetated meadows with amphipod-dominated, low-biomass assemblages and high oxygen availability; and (iii) non-vegetated soft bottoms influenced by sediment and depth.
In oligotrophic regions such as the Cilician Basin, high temperatures and limited food availability constrain community structure and contribute to seasonal dormancy, particularly during summer [101,102]. Consistent with previous studies, benthic assemblages were strongly disturbed beneath fish cages, with effects becoming negligible beyond 25 m. Sediment alterations were associated with increased farm biomass, organic waste accumulation, and reduced current velocities, promoting organic deposition. Similar patterns were reported in the Tyrrhenian Sea, where crustacean and molluscan richness and abundance differed near fish farms [103,104]. Some studies documented recovery with increasing distance from cages [82], whereas others found limited spatial differentiation [84], demonstrating context-dependent impacts. Semi-enclosed systems such as Bozburun are particularly vulnerable because of restricted water exchange [105,106].
Among crustaceans, Apseudopsis latreillii, a Mediterranean tanaid, occurs in both polluted and unpolluted environments, with regionally variable ecological roles [104,107]. Amphipod assemblages differed significantly between control and farm sites, while recolonization was influenced by resident sediment fauna and amphipod input from fouling communities on aquaculture structures [108]. Organic enrichment favors small molluscs and crustaceans, including gammarid amphipods and some cumaceans, in farm-impacted sediments [109]. Multi-habitat sampling is important for understanding amphipod distributions around aquaculture infrastructure [44,110]. Fossorial amphipods such as Bathyporeia guilliamsoniana and Perioculodes longimanus generally decline at polluted sites, whereas other species show tolerance or ambiguous responses (Çınar et al., 2015). Filter feeders such as Cheiriphotis mediterranea and Photis longicaudata, in contrast, can dominate areas affected by industrial and urban effluents [111].
Although polychaetes and nematodes are frequently proposed as indicators of aquaculture-related organic enrichment [112,113], fewer studies have examined macrocrustacean responses. Both epifaunal and infaunal crustaceans respond sensitively to fish farming, including substantial abundance reductions beneath cages [114]. In this study, peracarid assemblages effectively indicated sea bass and sea bream farming, with significantly lower species richness and abundance beneath cages. Similar reductions of 50–70% have been reported in several Mediterranean fish-farm areas [115,116,117,118,119].
At finer taxonomic resolution, Ampelisca spp. declined in organically enriched sediments, consistent with their sensitivity to elevated organic matter and sediment-associated contaminants [120,121]. Cumaceans such as Iphinoe tenella and Bodotria scorpioides were also reduced beneath cages, reflecting limited adaptability to eutrophic conditions [122]. Similarly, A. latreillii declined under farm influence, probably because of hypoxia [123,124].
Conversely, Jassa marmorata, Caprella dilatata, and Medicorophium runcicorne increased beneath cages. Corophiid amphipods are often associated with disturbed sediments and chronic contamination [125,126]. The presence of M. runcicorne and other tube-building deposit feeders may reflect their trophic strategies and transfer of fouling fauna from aquaculture structures to sediments [126,127,128,129].
Benthic molluscs are important indicators of sublittoral soft-bottom communities across pollution gradients, particularly those associated with hypoxia and sedimentation. They also play fundamental ecological roles and are widely used in contaminant monitoring [130,131]. Molluscan abundance and species richness generally decline with depth but increase with sediment TOC [132]. In this study, molluscan assemblages dominated, consistent with observations from shellfish farms and moderately enriched systems [133].
Food availability, particularly chlorophyll-a, regulates benthic community structure near fish farms [90,134]. Nucula nitidosa occurs at lower densities in muddy sediments but can form populations in substrates with moderate TOC. Similarly, Corbula gibba exhibits wide density ranges across Mediterranean systems. Fish-farm sites are generally dominated by a few tolerant molluscan species [103,104], while diversity indices increase as organic load decreases and distance from cages increases [135].
Comparisons between farm locations and more distant sites identified discriminator species including Loripes lacteus, Acanthochitona fascicularis, Alvania cimex, and Hippolyte inermis, consistent with evidence of aquaculture-driven community differentiation [136].
4.5. Faunistic Characters
Eutrophic areas were characterized by reduced species richness, numerical abundance, and diversity, but relatively high evenness and macrobenthic crustacean biomass. According to the Pearson–Rosenberg model, these characteristics correspond to a normal ecological status under moderate sediment disturbance, involving slight biomass enhancement and dominance by limited species [137]. As sedimentary organic matter increases, biomass initially rises and assemblages shift toward r-selected taxa, reflecting enhanced bottom-up energy transfer from increased primary production to higher trophic levels [138,139,140,141,142].
The Shannon–Wiener index showed lower values beneath and near fish cages and higher values at distant stations, consistent with Mediterranean studies [103,104]. However, diversity indices alone could not reliably distinguish impacted from non-impacted stations, emphasizing their limited diagnostic power in isolation [143,144]. Dissolved oxygen did not reach critical thresholds associated with benthic mortality or habitat collapse [145,146,147]. Experimental evidence indicates a nonlinear relationship between benthic biomass and oxygen, with biomass up to four times higher above the hypoxia threshold (DO > 4.5 mg L⁻¹) than at lower oxygen levels [148]. Amphipods are particularly sensitive, with many species disappearing at the onset of hypoxia [149].
Despite localized enrichment, diversity remained relatively high at most stations, suggesting no severe or persistent aquaculture-related stress. Station clustering by cage distance was generally weak and driven mainly by abundance rather than species turnover, indicating quantitative rather than qualitative community shifts [84]. Diversity along organic enrichment gradients followed a nonlinear trajectory, with initial declines followed by recovery toward reference-site values, as reported in Mediterranean fish-farm systems [150].
Sampling gear (van Veen grab versus corer) and sieve mesh size also affected observed abundance. Combined analyses showed increasing abundance from cage sites to 5 m distance, followed by declines at 10–50 m and stabilization at controls, whereas coarse-mesh sieving suggested a monotonic decline from farm to control locations [42,43]. Generally, species richness, diversity, and evenness were higher at control sites, whereas abundance peaked at farm sites, consistent with enrichment-driven proliferation of a few taxa [151]. Molluscan and decapod responses differed spatially, with molluscan abundance declining to 90 m from cages, followed by a localized increase and subsequent decline, accompanied by similar changes in species richness [152,153].
Previous studies along the Aegean coast documented elevated Polychaeta abundance at fish-cage sites, including Güllük Bay, where sampling overlapped with the present study area [154,155,156]. More recently, [157] assessed eutrophication in Güllük Bay and classified 5% of stations as poor and 67.5% as weakly clean according to the Eutrophication Index, while chlorophyll-a indicated 27.5% poor and 47.5% weak status. Although these findings are insufficient for definitive ecological assessment, they emphasize the need to reassess post-removal conditions using comprehensive, multi-metric monitoring.
The present study was restricted to macrobenthic crustaceans and molluscs; therefore, the derived ecological status should be considered partial rather than integrative. Within this framework, fish-farm capacity emerged as an important driver of community structure. The least fish cage-farms exerted the strongest effects on macrofauna, likely reflecting the loss of pollution-sensitive equilibrium species and reduced faunistic complexity. At intermediate pollution levels, associated with moderate and some high-capacity farms under favorable hydrodynamic conditions, assemblages showed increased abundance of opportunistic r-selected taxa together with a few large-bodied species at low densities, producing elevated biomass relative to abundance as reflected by ABC curves and W-statistics.
Some high-capacity sites, however, showed simultaneous reductions in abundance, biomass, and diversity, indicating severe disturbance where even opportunistic species were negatively affected. Several control stations also exhibited moderate disturbance, likely due to restricted circulation and terrestrial discharges. K-dominance curves based solely on abundance suggested minor impacts at farm sites and reflected temporal variability rather than persistent degradation [115,151].
Aquaculture-related organic enrichment provides an additional food source rapidly exploited by opportunistic species, whose life-history traits allow them to capitalize on environmental changes and unoccupied niches [137]. Their success is partly related to small body size and high surface-to-volume ratios, which enhance metabolic efficiency under enriched conditions. The ABC approach did not consistently identify clear disturbance, with only limited stations showing moderate impact, consistent with previous assessments of its sensitivity and limitations [158,159].
Ecological responses should therefore be interpreted as a dynamic balance among K-selected species (few, large-bodied, biomass-dominant), intermediate or resistant taxa, and r-selected species (numerous, small-bodied, abundance-dominant), responding to TOC gradients, seasonal variability, and site-specific conditions [160]. Dominance of a single indicator species does not alone define pollution severity; ecological status instead emerges from the integrated response of the assemblage, as reflected in biotic indices such as BENTIX and AMBI [61,161]. Across the applied ecological metrics, a consistent gradient from low to moderate to high farm capacity was observed, indicating increasing organic enrichment.
Hydrodynamics further modulated ecological status. Semi-enclosed systems such as Bozburun Cove were moderately impacted because of restricted water exchange, whereas more current-exposed sites showed weaker effects irrespective of farm capacity. Station AÇ, classified as high capacity but located in a poorly flushed cove within Asin Bay, showed stronger impacts than other high-capacity sites. Thus, classification based solely on cage numbers is debatable and should incorporate hydrodynamic exposure, active cage density, and operational intensity. Cage counts were conducted during surveys, but the number of actively stocked cages was unknown, introducing uncertainty.
The absence of sediment measurements, particularly TOC, remains a significant limitation. In small embayments of Güllük Bay, fish farms were often positioned along prevailing current pathways, potentially influencing ecological status independently of farm capacity. Consistent with these observations, AMBI values in other Mediterranean systems decrease with increasing distance from cages to approximately 250 m and stabilize farther downstream (700–1200 m) along current trajectories [162,163].
5. Conclusion
5.1. Present Study
The present study provides valuable baseline information on the benthic molluscan and crustacean assemblages associated with fish farming activities along the Turkish Aegean coast prior to the large-scale relocation of mariculture facilities in the 2010s. Differences in faunal composition, abundance patterns, and species–environment relationships between fish farm and control sites, as well as between Güllük and Bozburun gulfs, indicate that fish farming intensity and site characteristics exert discernible influences on benthic community structure. The stronger correlations between species abundance and multiple environmental variables at farm sites, together with shifts in biomass and dominance patterns, suggest alterations in ecosystem equilibrium and a tendency toward opportunistic assemblages under increased farming capacity. The gradient observed from inactive to low, moderate, and high-capacity farms further supports a capacity-dependent ecological response. Although the present analysis focused on molluscs and crustaceans, the inclusion of polychaetes is essential to achieve a more comprehensive and robust assessment of benthic ecological status. Overall, this study establishes a critical reference point for evaluating long-term ecosystem recovery following fish farm removal and contributes to the broader understanding of balancing aquaculture production with ecosystem sustainability under increasing environmental pressures, including global warming.
5.2. Policy Recommendations for Sustainable Fish Farm Management (Compiled from Literature)
This section advocates for the incorporation of biomass-based indicators, site-specific assessments, long-term monitoring, and integrated mitigation measures in fish farm management. It also stresses the importance of protecting seagrass meadows, incorporating predictive modeling, and considering the functional roles of biofouling communities. Finally, it encourages sustainable practices, such as organic fish farming, to ensure long-term ecosystem health.
Biomass is a critical metric for assessing ecological status around fish farms. It should be integrated into regulatory monitoring frameworks, alongside species abundance and composition, to provide a more comprehensive understanding of the environmental impact. Early studies [164] and later research [83] show that biomass patterns help differentiate between equilibrium communities and those impacted by disturbance. Taxonomic-based metrics like Benthic Health Index (BHI) are recommended to supplement traditional abundance measures, helping identify long-term benthic degradation or delayed recovery.
While high-current environments are assumed to reduce benthic impacts, evidence shows that fish farming can still alter benthic communities even in these areas [165]. Policy should discourage the assumption that offshore or high-energy sites inherently ensure environmental protection. Instead, it should mandate site-specific carrying capacity assessments that include sediment biogeochemistry and benthic functioning before licensing.
Benthic recovery can take longer than expected, even after two years post-farming cessation, due to ongoing disturbances like nutrient-driven algal blooms [83]. Policy frameworks should require long-term post-operation monitoring that extends beyond standard fallowing periods. Additionally, they should recognize that recovery trajectories are non-linear and influenced by factors such as sediment nutrient release and seasonal dynamics.
Integrated Multi-Trophic Aquaculture (IMTA) and nature-based solutions have shown promise in mitigating organic enrichment beneath fish farms. Examples of these approaches include oysters, sea cucumbers, sponges, artificial reefs, and polyculture systems. Policy recommendations should promote IMTA systems as the preferred operational model for fish farming and provide incentives for extractive or bioremediating species that help reduce sediment organic accumulation.
Posidonia oceanica and Cymodocea nodosa meadows are highly vulnerable to the impacts of fish farming [166,167]. These meadows also serve as critical carbon sinks, making their protection essential. Policy recommendations include banning fish farms directly above seagrass meadows and maintaining a minimum buffer distance of 200 m, with an optimum range of 700–1200 m, depending on factors like currents, depth, and farm size. Fish farms should preferably be located at depths greater than 45–50 m, and authorizations should be re-evaluated every four years based on ongoing seagrass monitoring.
Numerical models (e.g., MERAMOD) can predict waste deposition and benthic impacts under various farm configurations, species compositions, and hydrodynamic conditions. Policy frameworks should incorporate model-based impact predictions into environmental impact assessments, especially for multi-cohort and co-culture systems.
Biofouling communities around aquaculture structures can sometimes help process organic matter and mitigate impacts. These communities may offer opportunities for biomass reuse [168]. Management strategies should consider the functional roles of fouling communities and avoid purely negative perceptions when evaluating farm impacts.
Studies have shown that organic fish farming has a lower benthic environmental footprint than conventional practices, particularly in the Eastern Mediterranean [169]. Policy recommendations should encourage transitions to low-input, organic, or certified sustainable practices to enhance long-term ecosystem sustainability.
Supplementary Materials
The following supporting information can be downloaded at the website of this paper posted on Preprints.org. Figure S1. Sampling stations for the environmental parameters: CTD measurements in 2003 and 2004 (a), and the chemical parameters in 2003 (b) and 2004 (c) and tracklines of Acoustic Doppler Current Profiler (ADCP) to measure the water current along Muğla’s coast in 2003 (d) and 2004 (e). Figure S2. Silhouette analyses for only fish farms (a-c) and all stations in fish farm sites (d-f), number of cages (b, e, respectively) and distance from coast at the clusters (c, f respectively) and distribution of the clusters (Cls 1: blue, Cls 2: green, Cls 3: yellow and Cls 4: red dots) estimated with proportional number of cages in Figure 2a (g) and without number of cages in Figure 2d (h). Figure S3. In each fish farm, number of fish cages made in wood (orange circle) and plastic (blue circle) in 2003 (a, b), 2004 (c, d) and in total (e, f) with stations in Güllük Gulf (a, c, e) and Bozburun (b, d, f). Maximum circle is linearly proportional to a number of 75 cages. In 2024, recent locations (small arrows) of fish cages (circles) and Posidonia oceanica beds in green patch along the Turkish Aegean Sea (g) including Güllük Gulf and Bozburun marked by arrow (h) (from Mutlu [48]). Figure S4. Sampling stations colored by geographical longitude coordinates (a) to compare the locations on sea surface water T-S diagram with water density (σθ) contours in black-gray lines in 2003 (b) and 2004 (c), and near-bottom water T-S diagram with colored contours of the bottom depth with colorbar as well (d, e, respectively). Figure S5. Density, σθ in kg/m3 (a), temperature in oC (b), PAR/Irradiance (µmol photon/m2/s (c), oxygen in mg/l (d), salinity in PSU (e), fluorescence in mg/m3 (f) and turbidity in FTU (g) of sea surface waters in June 2003 (left panel) and August 2004 (right panel). Figure S6. Bottom depths in m (a), density, σθ in kg/m3 (b), temperature in oC (c), PAR/Irradiance (µmol photon/m2/s (d), oxygen in mg/l (e), salinity in PSU (f), fluorescence in mg/m3 (g) and turbidity in FTU (h) of near bottom waters in June 2003 (left panel) and August 2004 (right panel). Figure S7. PO4 (µM), NO2+NO3 (µM), r-Si (µM), dissolved oxygen (µM), and pH of sea surface (a, b, c, d and e) and near-bottom (g, h, i, j and k) waters, respectively and Secchi disk depth (f) and bottom depth (l) in June 2003. Figure S8. PO4 (µM), NO2+NO3 (µM), r-Si (µM), dissolved oxygen (µM), and pH of sea surface (a, b, c, d and e) and near-bottom (g, h, i, j and k) waters, respectively and Secchi disk depth (f) and bottom depth (l) in August 2004. Figure S9. Sea surface current in area limited by the sampling border and measured by ADCP and sea surface current extrapolated for outside the study sampling. Figure S10. PCA plots for the environmental parameters at stations classified by clusters (see Table 1 for cluster no) estimated in Figure 2c, sampling year and bottom depth classification (see Table S2 and Table S7 for the abbreviations of the environmental parameters) in the study (a) and in the fish farm sites only (b, c). Table S1. Species composition at fish farm and control sites. DO%: percent dominance, FO%: frequency of occurrence, and NO%: numerical occurrence. Abundance range (min-max ind/m2)/bottom depth range (min-max m), depth (m) where the maximum abundance of each species was recorded. Species in black is common species among the sites, green is species occurred at fish farm, and red is at control site. Bold number across taxa is number of species for each site. Bold number in DO% is constant, italic number is common species, and the rest is rare species according to Soyer index. Table S2. Spearman correlation between faunistic characteristics + number of cages (#Cg) and the environmental variables. Bold Spearman values are significantly correlated at p < 0.05. Figure S11. Number of taxon speciesand logarithmic-scaled average abundance (N), biomass (B) and B/N ratio at the control sites across crustacean and molluscan taxa. Table S3. One-way SIMPER analysis to determine contributor species between stations with/without fish farms at Bozburun (FB and NB, respectively) and Güllük (FG and NG, respectively) sites (Avg.Sim: average similarity within the sites, Av. Abn: log10-transfomed abundance, Av. Sim: average dissimilarity of the species, Sim: similarity)/SD (standard deviation of similarity): correction term, and Cum.%: percent cumulative discrimination of species). *. is contributor species between fish farm and control sites. Table S4. One-way SIMPER analysis to determine discriminator species between fish farm and control sites (Avg.Dis: average dissimilarity between the sites, Av. Abn: log10-transfomed abundance, Av. Dis: average dissimilarity of the species, Dis: dissimilarity)/SD (standard deviation of dissimilarity): correction term, and Cum.%: percent cumulative discrimination of species). *. is discriminator species between fish farm and control sites. Species with bold abundance is contributor species for groups in the order of F and C. Table S5. Two-way (a) and one -way (b) SIMPER analysis to determine discriminator species between clusters estimated in Figure 2d (Avg.Dis: average dissimilarity between the sites, Av. Abn: log10-transfomed abundance, Av. Dis: average dissimilarity of the species, Dis: dissimilarity)/SD (standard deviation of dissimilarity): correction term, and Cum.%: percent cumulative discrimination of species). *. is discriminator species between the clusters. # denotes out of digits with large number for the output format of PRIMER. Table S6. One -way SIMPER analysis to determine discriminator species between fish farm stations with (FG andFB: fish cages present in Güllük and Bozburun, respectively) /without (NG and NB: fish cages present in Güllük and Bozburun) fish cages and control sites, C (Avg.Dis: average dissimilarity between the sites, Av. Abn: log10-transfomed abundance, Av. Dis: average dissimilarity of the species, Dis: dissimilarity)/SD (standard deviation of dissimilarity): correction term, and Cum.%: percent cumulative discrimination of species). *. is discriminator species between the clusters. # denotes out of digits with large number for the output format of PRIMER. Table S7. Eigen values for CCA plot (Figure 12b) of species log10-transformed abundance-environment relation. Abrev. Abbreviations of the environmental variables. Bold Eigen values denote efficient variable across CCA axes. Figure S12. ABC curves across fish farm clusters estimated in Figure 2a. Cluster no, number of cages and W-statistics.
Author Contributions
B.E.A.: Writing – review & editing, Investigation, Formal analysis. E.M.: Writing – original draft, Validation, Supervision, Methodology, Investigation.
Funding
This study funded by The Scientific and Technical Council of Turkey, TUBITAK, with grant no: 102Y058.
Data availability
Data will be made available on request.
Acknowledgments
This study funded by The Scientific and Technical Council of Turkey, TUBITAK, with grant no: 102Y058, principally coordinated by Ferit Bingel, and finally reported by [1]. This study is dedicated to the memory of Prof. Dr. Ferit Bingel, who passed away in May 2021, and foreseen matters to select suitable location for the fish farms along the Muğla’s coast projecting the proposal very early in Turkey in 2003. This study is a part of Berivan Elif Aslan’s MaSc thesis completed in 2021 and supervised by Erhan Mutlu. We thank researchers (Ali Cemal Gücü, Süleyman Tuğrul and Şükrü Turan Beşiktepe) of the projects and crew of R/V Lamas belonging to Institute of Marine Sciences - Middle East Technical University for their helps on sampling and measurements. The chemical measurements of the present study’s transects were performed by the Chemical Oceanography Branch of IMS-METU.
Conflicts of Interest
The authors declare the following financial interests/personal relationships which may be considered as potential competing interests: Ali Cemal Gücü, Süleyman Tuğrul and Şükrü Turan Beşiktepe being used to be working in Institute of Marine Sciences - Middle East Technical University and as researchers of the project (102Y058) which does not scope to macrobenthic study and was finally reported by [1].
References
- Mutlu, E.; Bingel, F.; Gücü, A.C.; Tuğrul, S.; Beşiktepe, Ş.T. Muğla kıyılarında koyları etkilemeyecek deniz balığı yetiştirme alanların tespiti [Selection of fish culture sites that will not influence the environmental quality of the bays along the coast of Muğla; The Scientific and Technical Council of Turkey, TUBITAK, 102Y058: Ankara, Turkey, 2005; p. 210 pp. [Google Scholar]
- D’Amours, O.; Archambault, P.; McKindsey, C.W.; Johnson, L.E. Local enhancement of epibenthic macrofauna by aquaculture activities. Mar. Ecol. Prog. Ser. 2008, 371, 73–84. [Google Scholar] [CrossRef]
- Hickling, C.F. Estuarine fish farming. Adv. Mar. Biol. 1970, 8, 119–213. [Google Scholar] [CrossRef]
- Mantzavrakos, E.; Kornaros, M.; Lyberatos, G.; Kaspiris, P. Impacts of a marine fish farm in Argolikos Gulf (Greece) on the water column and the sediment. Desalination 2007, 210, 110–124. [Google Scholar] [CrossRef]
- Sun, X.; Dong, J.; Hu, C.; Zhang, Y.; Chen, Y.; Zhang, X. Use of macrofaunal assemblage indices and biological trait analysis to assess the ecological impacts of coastal bivalve aquaculture. Ecol. Indic. 2001, 127, 107713. [Google Scholar]
- Watts, J.; Conklin, D.E. A review of the literature on the environmental impacts of marine fish cage culture. UNICIENCIA 1988–1989, 15–16, 143–155. [Google Scholar]
- Webber, H.H.; Riordan, P.F. Criteria for candidate species for aquaculture. Aquaculture 1976, 7, 107–123. [Google Scholar] [CrossRef]
- Grigorakis, K.; Rigos, G. Aquaculture effects on environmental and public welfare—The case of Mediterranean mariculture. Chemosphere 2011, 85, 899–919. [Google Scholar] [CrossRef] [PubMed]
- Rabasso, M.; Hernandez, J.M. Bioeconomic analysis of the environmental impact of a marine fish farm. J. Environ. Manag. 2015, 158, 24–35. [Google Scholar] [CrossRef] [PubMed]
- Machias, A.; Giannoulaki, M.; Somarakis, S.; Maravelias, C.D.; Neofitou, C.; Koutsoubas, D.; Papadopoulou, K.N.; Karakassis, I. Fish farming effects on local fisheries landings in oligotrophic seas. Aquaculture 2006, 261, 809–816. [Google Scholar] [CrossRef]
- Belton, B.; Little, D.C.; Zhang, W.; Edwards, P.; Skladany, M.; Thilsted, S.H. Farming fish in the sea will not nourish the world. Nat. Commun. 2020, 11, 5804. [Google Scholar] [CrossRef] [PubMed]
- Bondad-Reantaso, M.G.; Arthur, J.R.; Subasinghe, R.P. (Eds.) Understanding and Applying Risk Analysis in Aquaculture; FAO Fisheries and Aquaculture Technical Paper No. 519; FAO: Rome, Italy, 2008; p. 304 pp. [Google Scholar]
- Campuzano, F.J.; Gutiérrez, J.M.; Senabre, T.; Mateus, M.D.; Perán, A.; et al. A modelling approach to estimate the environmental and productive carrying capacity for a Mediterranean coastal marine culture park. J. Aquac. Res. Dev. 2015, 6, 373. [Google Scholar] [CrossRef]
- Carbonell-Garzón, E.; Fernández-González, V.; Romero, F.; Sánchez-Jerez, P.; Belda, L.; Agraso, M.M.; Toledo-Guedes, K. Validating a proxy to carrying capacity for finfish offshore aquaculture in the western Mediterranean. Aquaculture 2025, 608, 742756. [Google Scholar] [CrossRef]
- Costa-Pierce, B.A.; Bockus, A.B.; Buck, B.H.; van den Burg, S.W.K.; Chopin, T.; Ferreira, J.G.; Goseberg, N.; Heasman, K.G.; Johansen, J.; Shumway, S.E.; Sims, N.A.; Tacon, A.G.J. Fishy story promoting a false dichotomy to policy-makers: It is not freshwater vs. marine aquaculture. Rev. Fish. Sci. Aquac. 2022, 30, 429–446. [Google Scholar] [CrossRef]
- Dapueto, G.; Massa, F.; Costa, S.; Cimoli, L.; Olivari, E.; Chiantore, M.; Federici, B.; Povero, P. A spatial multi-criteria evaluation for site selection of offshore marine fish farms in the Ligurian Sea (Italy). Ocean Coast. Manag. 2015, 116, 64–77. [Google Scholar] [CrossRef]
- Fernandes, T.F.; Miller, K.L.; Read, P.A. Monitoring and regulation of marine aquaculture in Europe. J. Appl. Ichthyol. 2000, 16, 138–143. [Google Scholar] [CrossRef]
- Karakassis, I. Environmental interactions and initiatives on site selection and carrying capacity estimation for fish farming in the Mediterranean. In Site Selection and Carrying Capacities for Inland and Coastal Aquaculture;FAO Fisheries and Aquaculture Proceedings No. 21; Ross, L.G., Telfer, T.C., Falconer, L., Soto, D., Aguilar-Manjarrez, J., Eds.; FAO: Rome, Italy, 2013; pp. 161–170. [Google Scholar]
- Ervik, A.; Hansen, P.K.; Aure, J.; Stigebrandt, A.; Johannessen, P.; Jahnsen, T. Regulating the local environmental impact of intensive marine fish farming I. The concept of the MOM system (Modelling–Ongrowing fish farms–Monitoring). Aquaculture 1997, 158, 85–94. [Google Scholar] [CrossRef]
- Ervik, A.; Agnalt, A.Ş.; Asplin, L.; Aure, J.; Bekkvik, T.C.; Døskeland, I.; Hageberg, A.A.; Hansen, T.; Karlsen, Ø.; Oppedal, F.; Strand, Ø. AkvaVis – dynamisk GIS-verktøy for lokalisering av oppdrettsanlegg for nye oppdrettsarter. Miljøkrav for nye oppdrettsarter og laks. “AkvaVis – dynamic GIS-tool for siting of fish farms for new aquaculture species. Environmental quality requirements for new aquaculture species and Atlantic salmon”. In Fisken og Havet, Norge; Havforskningsinstituttet: Bergen, Norway, 2008; Volume 10-2008, p. 90. [Google Scholar]
- Ervik, A.; Hansen, P.K.; Aure, J.; Stigebrandt, A.; Johannessen, P.; Jahnsen, T. Regulating local environmental impact of intensive marine fish farming: The MOM system. Aquaculture 1997, 158, 85–94. [Google Scholar] [CrossRef]
- Aguado-Giménez, F.; Ruiz-Fernández, J.M. Influence of an experimental fish farm on the spatio-temporal dynamics of a Mediterranean maërl algae community. Mar. Environ. Res. 2012, 74, 47–55. [Google Scholar] [CrossRef] [PubMed]
- Stirling, H.P.; Okumuş, I. Growth and production of mussels (Mytilus edulis L.) suspended at salmon cages and shellfish farms in two Scottish sea lochs. Aquaculture 1995, 34, 193–210. [Google Scholar] [CrossRef]
- Giangrande, A.; Gravina, M.F.; Rossi, S.; Longo, C.; Pierri, C. Aquaculture and restoration: Perspectives from Mediterranean Sea experiences. Water 2021, 13, 991. [Google Scholar] [CrossRef]
- Relini, G. Fishery and aquaculture relationship in the Mediterranean: Present and future. Mediterr. Mar. Sci. 2003, 4, 125–154. [Google Scholar] [CrossRef]
- Uriarte, V.A. Environmental considerations for site selection of marine fish farms. In Environmental Impact Assessment of Mediterranean Aquaculture Farms; Uriarte, A., Basurco, B., Eds.; CIHEAM, Cahiers Options Méditerranéennes: Zaragoza, Spain, 2001; Volume 55, pp. 67–74. [Google Scholar]
- Fernández-González, V.; Aguado-Giménez, F.; Gairín, J.I.; Sánchez-Jerez, P. Exploring patterns of variation in amphipod assemblages at multiple spatial scales: Natural variability versus coastal aquaculture effect. Aquac. Environ. Interact. 2013, 3, 93–105. [Google Scholar] [CrossRef]
- Henderson, A.R.; Ross, D.J. Use of macrobenthic infaunal communities in the monitoring and control of the impact of marine cage fish farming. Aquac. Res. 1995, 26, 659–678. [Google Scholar] [CrossRef]
- Keeley, N.; Valdemarsen, T.; Woodcock, S.; Holmer, M.; Husa, V.; Bannister, R. Resilience of dynamic coastal benthic ecosystems in response to large-scale finfish farming. Aquac. Environ. Interact. 2019, 11, 161–179. [Google Scholar] [CrossRef]
- Mizan, V.L.; Kalantzi, I.; Tsapakis, M.; Pergantis, S.A.; Karakassis, I.; Apostolaki, E.T. Trajectories of trace element accumulation in seagrass (Posidonia oceanica) over a decade reveal the footprint of fish farming. Environ. Sci. Pollut. Res. 2024, 31, 28139–28152. [Google Scholar] [CrossRef] [PubMed]
- Rubio-Portillo, E.; Villamor, A.; Fernandez-Gonzalez, V.; Antón, J.; Sanchez-Jerez, P. Exploring changes in bacterial communities to assess the influence of fish farming on marine sediments. Aquaculture 2019, 506, 459–464. [Google Scholar] [CrossRef]
- Tomassetti, P.; Gennaro, P.; Lattanzi, L.; Mercatali, I.; Persia, E.; Vani, D. Benthic community response to sediment organic enrichment by Mediterranean fish farms: Case studies. Aquaculture 2016, 40, 262–272. [Google Scholar] [CrossRef]
- Tsikopoulou, I.; Moraitis, M.L.; Tsapakis, M.; Karakassis, I. Can intensive fish farming for 20 years induce changes in benthic ecosystems on a scale of waterbody? An assessment from Cephalonia Bay (Ionian Sea). Environ. Monit. Assess. 2018, 190, 469. [Google Scholar] [CrossRef] [PubMed]
- Belias, C.V.; Bikas, V.G.; Dassenakis, M.J.; Scoullos, M.J. Environmental impacts of coastal aquaculture in eastern Mediterranean bays: Astakos Gulf, Greece. Environ. Sci. Pollut. Res. 2003, 10, 287–295. [Google Scholar] [CrossRef] [PubMed]
- Black, K.D.; Cromey, C.J. The scientific basis of marine fish farm regulation. Sci. Diliman 2008, 20, 11–22. [Google Scholar]
- Bosch-Belmar, M.; Milisenda, G.; Girons, A.; Taurisano, V.; Accoroni, S.; Totti, C.; Piraino, S.; Fuentes, V. Consequences of stinging plankton blooms on finfish mariculture in the Mediterranean Sea. Front. Mar. Sci. 2017, 4, 240. [Google Scholar] [CrossRef]
- Shumway, S.E. A review of the effects of algal blooms on shellfish and aquaculture. J. World Aquac. Soc. 1990, 21, 65–104. [Google Scholar] [CrossRef]
- Çulha, S.T.; Karaduman, F.R. The influence of marine fish farming on water and sediment quality: Ildır Bay (Aegean Sea). Environ. Monit. Assess. 2020, 192, 528. [Google Scholar] [CrossRef] [PubMed]
- Çulha, S.T.; Karaduman, F.R.; Gündoğdu, A.; Barış, K.E. Effects of anthropogenic activities on nutrient parameters in the northeastern Mediterranean Sea (Bay of Sığacık, Aegean Sea). Oceanol. Hydrobiol. Stud. 2022, 51, 189–202. [Google Scholar] [CrossRef]
- Heilskov, A.C.; Alperin, M.; Holmer, M. Benthic fauna bio-irrigation effects on nutrient regeneration in fish farm sediments. J. Exp. Mar. Biol. Ecol. 2006, 339, 204–225. [Google Scholar] [CrossRef]
- Mazzola, A.; Sara, G. The effect of fish farming organic waste on food availability for bivalve molluscs in Gaeta Gulf, Central Tyrrhenian: Stable carbon isotopic analysis. Aquaculture 2001, 192, 361–379. [Google Scholar] [CrossRef]
- Grego, M.; De Troch, M.; Forte, J.; Malej, A. Main meiofauna taxa as an indicator for assessing the spatial and seasonal impact of fish farming. Mar. Pollut. Bull. 2009, 58, 1178–1186. [Google Scholar] [CrossRef] [PubMed]
- Lampadariou, N.; Akoumianaki, I.; Karakassis, I. Effects of sampling methodology on benthic community assessment in fish farming areas. Mar. Ecol. Prog. Ser. 2005, 296, 59–70. [Google Scholar]
- Lampadariou, N.; Karakassis, I.; Pearson, T.H. Cost/benefit analysis of a benthic monitoring programme of organic benthic enrichment using different sampling and analysis methods. Mar. Pollut. Bull. 2005, 50, 1606–1618. [Google Scholar] [CrossRef] [PubMed]
- Conlan, K.E. Amphipod crustaceans and environmental disturbance: A review. J. Nat. Hist. 1994, 28, 519–554. [Google Scholar] [CrossRef]
- Fernandez-Gonzalez, V.; Sanchez-Jerez, P. Effects of sea bass and sea bream farming on peracarid crustaceans. Anim. Biodivers. Conserv. 2011, 34, 179–190. [Google Scholar] [CrossRef]
- Doğan, A.; Onen, M.; Ozturk, B. Impacts of cage farming on the distribution of the molluscan fauna in the Aegean Sea. Rapp. Comm. Int. Mer. Médit. 2007, 38, 464. [Google Scholar]
- Mangion, M.; Borg, J.A.; Schembri, P.J.; Sanchez-Jerez, P. Assessment of benthic biological indicators for evaluating the environmental impact of tuna farming. Aquac. Res. 2017, 48, 5797–5811. [Google Scholar] [CrossRef]
- Mutlu, E. A broad-scale summer spatial structure of pelagic fish schools as acoustically assessed along the Turkish Aegean coast. J. Mar. Sci. Eng. 2025, 13, 1807. [Google Scholar] [CrossRef]
- Mutlu, E.; Özvarol, Y.; Akçalı, B.; Aslan, B.E.; Seçkiner, S. Posidonia oceanica çayırının akustik yöntem ile Türkiye Ege kıyılarındaki maksimum (yaz mevsimi) dağılımsal biyokütlesinin ve Side (Antalya, Akdeniz) yatağındaki mevsimsel dinamiğinin belirlenmesi. TÜBİTAK Proj. Grant No. 124Y031 (in progress). 2025. [Google Scholar]
- Stirn, J. Manual of Methods in Aquatic Environment Research. Part 8: Ecological Assessment of Pollution Effects: Guidelines for the FAO (GFCM)/UNEP Joint Coordinated Project on Pollution in the Mediterranean; FAO Fisheries Technical Paper No. 209; FAO: Rome, Italy, 1981. [Google Scholar]
- FAO. Lecture Notes Prepared for the Training Workshop on the Statistical Treatment and Interpretation of Marine Community Data; FAO/IOC/UNEP Training Workshop: Alexandria, Egypt; FAO: Rome, Italy, 1991; p. 212 pp. [Google Scholar]
- Gotelli, N.J.; Ellison, A.M. A Primer of Ecological Statistics; Sinauer Associates: Sunderland, MA, USA, 2004. [Google Scholar]
- Mutlu, E. Broad-scale ecological distribution of dominant macrozoobenthic taxa of the northern Cilician shelf, eastern Mediterranean Sea: Crustaceans. Turk. J. Zool. 2015, 39, 888–905. [Google Scholar] [CrossRef]
- Bacescu, M. Cumacea Fauna R.P.R. IV; Bucureşti, Romania, 1951; p. 94 pp. [Google Scholar]
- Bellan-Santini, D.; Diviacco, G.; Krapp-Schickel, G.; Myers, A.A.; Ruffo, S. Gammaridea (Haustoriidae to Lysianassidae). In The Amphipoda of the Mediterranean, Part 2; Ruffo, S., Ed.; Mémoires de l’Institut Océanographique: Monaco, 1989. [Google Scholar]
- Bellan-Santini, D.; Karaman, G.; Krapp-Schickel, G.; Ledoyer, M.; Ruffo, S. Gammaridea (Melphidippidae to Talitridae), Ingolfiellidea, Caprellidea. In The Amphipoda of the Mediterranean, Part 3; Ruffo, S., Ed.; Mémoires de l’Institut Océanographique: Monaco, 1993. [Google Scholar]
- Bellan-Santini, D.; Karaman, G.; Krapp-Schickel, G.; Ledoyer, M.; Myers, A.A.; Ruffo, S.; Schiecke, U. Gammaridea (Acanthonotozomatidae to Gammaridae). In The Amphipoda of the Mediterranean, Part 1; Ruffo, S., Ed.; Mémoires de l’Institut Océanographique: Monaco, 1982. [Google Scholar]
- Ziegelmeier, E. Die Muscheln (Bivalvia) der deutschen Meeresgebiete. Helgol. Wiss. Meeresunters. 1957, 6, 1–51. [Google Scholar] [CrossRef]
- Ziegelmeier, E. Die Schnecken (Gastropoda prosobranchia) der deutschen Meeresgebiete und brackigen Küstengewässer. Helgol. Wiss. Meeresunters. 1966, 13, 1–61. [Google Scholar] [CrossRef]
- Holden, M.J.; Raitt, D.F.S. (Eds.) Manual of Fisheries Science, Part 2: Methods of Resource Investigation and Their Application; FAO Fisheries Technical Paper No. 115; FAO: Rome, Italy, 1974; p. 214 pp. [Google Scholar]
- Borja, A.; Franco, J.; Pérez, V. A marine biotic index to establish the ecological quality of soft-bottom benthos within European estuarine and coastal environments. Mar. Pollut. Bull. 2000, 40, 1100–1114. [Google Scholar] [CrossRef]
- Muxika, I.; Borja, Á.; Bonnea, W. The suitability of the marine biotic index (AMBI) to new impact sources along European coasts. Ecol. Indic. 2005, 5, 19–31. [Google Scholar] [CrossRef]
- DİE. Su Ürünleri İstatistikleri 1998; No. 1221; DİE: Ankara, Turkey, 2001; p. 35 pp. [Google Scholar]
- DİE. Su Ürünleri İstatistikleri 1999; No. 2429; DİE: Ankara, Turkey, 2001; p. 45 pp. [Google Scholar]
- TÜİK. Su Ürünleri 2024. Turkish Statistical Institute. 2024. Available online: https://data.tuik.gov.tr/Bulten/Index?p=Su-Urunleri-2024-54193&dil=1 (accessed on 4 June 2025).
- Mutlu, E.; Duman, G.S.; Karaca, D.; Özvarol, Y.; Şahin, A. Biometrical variation of Posidonia oceanica with different bottom types along the entire Turkish Mediterranean coast. Ocean Sci. J. 2023, 58, 9. [Google Scholar] [CrossRef]
- Magni, P. Biological benthic monitoring. In Proceedings of the 4th MAMA Meeting, Rome, Italy, 3–6 June 2003. [Google Scholar]
- UNESCO. Ad Hoc Benthic Indicator Group—Results of Initial Planning Meeting; IOC Technical Series No. 57; UNESCO: Paris, France, 2000. [Google Scholar]
- Martinez-Garcia, E.; Sanchez-Jerez, P.; Aguado-Giménez, F.; Ávila, P.; Guerrero, A.; Sánchez-Lizaso, J.L.; Fernandez-Gonzalez, V.; González, N.; Gairin, J.I.; Carballeira, C.; et al. A meta-analysis approach to the effects of fish farming on soft bottom polychaeta assemblages in temperate regions. Mar. Pollut. Bull. 2013, 69, 165–171. [Google Scholar] [CrossRef] [PubMed]
- Batır, E.; Aydın, I.; Theodorou, J.A.; Rakaj, A. Mytilus galloprovincialis’s role in integrated multi-trophic aquaculture (IMTA): A comprehensive review. J. World Aquac. Soc. 2025, 56, e70013. [Google Scholar] [CrossRef]
- Marin, A.; Montoya, S.; Vita, R.; Marín-Guirao, L.; Lloret, J.; Aguado, F. Utility of sea urchin embryo–larval bioassays for assessing the environmental impact of marine fishcage farming. Aquaculture 2007, 271, 286–297. [Google Scholar] [CrossRef]
- Alongi, D.M.; McKinnon, A.D.; Brinkman, R.; Trott, L.A.; Undu, M.C.; Muawanah; Rachmansyah. Fate of organic matter derived from small-scale fish cage aquaculture in coastal waters of Indonesia. Aquaculture 2009, 295, 60–75. [Google Scholar] [CrossRef]
- Neofitou, N.; Lolas, A.; Ballios, I.; Skordas, K.; Tziantziou, L.; Vafidis, D. Contribution of sea cucumber Holothuria tubulosa on organic load reduction from fish farming operation. Aquaculture 2019, 501, 97–103. [Google Scholar] [CrossRef]
- Sadoul, B.; Caprioli, J.-P.; Barrier-Loiseau, C.; Cimiterra, N.; Laugier, T.; Lagarde, F.; Chary, K.; Callier, M.D.; Guillermard, M.-O.; Roque d’Orbcastel, E. Is Holothuria tubulosa the golden goose of ecological aquaculture in the Mediterranean Sea? Aquaculture 2022, 554, 738149. [Google Scholar] [CrossRef]
- Read, P.; Fernandes, T. Management of environmental impacts of marine aquaculture in Europe. Aquaculture 2003, 226, 139–163. [Google Scholar] [CrossRef]
- Navarrete-Mier, F.; Sanz-Lázaro, C.; Marín, A. Does bivalve mollusc polyculture reduce marine finfish farming environmental impact? Aquaculture 2010, 306, 101–107. [Google Scholar] [CrossRef]
- Turner, R. Offshore mariculture: Site evaluation. In Mediterranean Offshore Mariculture; Muir, J., Basurco, B., Eds.; CIHEAM, Options Méditerranéennes: Série B. Études et Recherches 30: Zaragoza, Spain, 2000; pp. 141–157. [Google Scholar]
- Zanuttigh, B.; Palma, G.; Brizzi, G.; Bellotti, G.; Romano, A.; Suffredini, R. Design of a multi-use marine area offshore the Mediterranean Sea. Ocean Eng. 2021, 221, 108515. [Google Scholar] [CrossRef]
- Ticina, V.; Katavić, I.; Grubišić, L. Marine aquaculture impacts on marine biota in oligotrophic environments of the Mediterranean Sea—A review. Front. Mar. Sci. 2020, 7, 217. [Google Scholar] [CrossRef]
- Fernández-Jover, D.; Sánchez-Jerez, P.; Bayle-Sempere, J.; Carratalá, A.; León, V.M. Addition of dissolved nitrogen and dissolved organic carbon from wild fish faeces and food around Mediterranean fish farms: Implications for waste-dispersal models. J. Exp. Mar. Biol. Ecol. 2007, 340, 160–168. [Google Scholar] [CrossRef]
- Kalantzi, I.; Karakassis, I. Benthic impacts of fish farming: Meta-analysis. Mar. Pollut. Bull. 2006, 52, 484–493. [Google Scholar] [CrossRef] [PubMed]
- Holmer, M.; Duarte, C.M.; Karakassis, I.; Marbà, N.; Tsapakis, M.; Danovaro, R.; et al. Effects of fish farm waste on Posidonia oceanica meadows. Mar. Pollut. Bull. 2008, 56, 1618–1629. [Google Scholar] [CrossRef] [PubMed]
- Karakassis, I.; Hatziyanni, E.; Tsapakis, M.; Plaiti, W. Benthic recovery following cessation of fish farming: A series of successes and catastrophes. Mar. Ecol. Prog. Ser. 1999, 184, 205–218. [Google Scholar] [CrossRef]
- Apostolaki, E.T.; Tsagaraki, T.; Tsapakis, M.; Karakassis, I. Fish farming impact on sediments and macrofauna associated with seagrass meadows. Estuar. Coast. Shelf Sci. 2007, 75, 408–416. [Google Scholar] [CrossRef]
- Holmer, M.; Marbà, N.; Díaz-Almela, E.; Duarte, C.M.; Tsapakis, M.; Danovaro, R. Sedimentation of organic matter from fish farms in oligotrophic Mediterranean assessed through bulk and stable isotope (δ¹³C and δ¹⁵N) analyses. Aquaculture 2007, 262, 268–280. [Google Scholar] [CrossRef]
- Sara, G.; Scilipoti, D.; Mazzola, A.; Modica, A. Effects of fish farming waste to sedimentary and particulate organic matter in a southern Mediterranean area (Gulf of Castellammare, Sicily): A multiple stable isotope study (δ¹³C and δ¹⁵N). Aquaculture 2004, 234, 199–213. [Google Scholar] [CrossRef]
- Apostolaki, E.T.; Holmer, M.; Marbà, N.; Karakassis, I. Metabolic imbalance in coastal vegetated and unvegetated benthic ecosystems. Ecosystems 2010, 13, 459–471. [Google Scholar] [CrossRef]
- Apostolaki, E.T.; Holmer, M.; Marbà, N.; Karakassis, I. Degrading Posidonia oceanica ecosystems: A source of dissolved matter in the Mediterranean. Hydrobiologia 2010, 649, 13–23. [Google Scholar] [CrossRef]
- Delgado, O.; Ruiz, J.; Pérez, M.; Romero, J.; Ballesteros, E. Effects of fish farming on seagrass (Posidonia oceanica) in a Mediterranean bay: Seagrass decline after organic loading cessation. Oceanol. Acta 1999, 22, 109–117. [Google Scholar] [CrossRef]
- Papageorgiou, N.; Kalantzi, I.; Karakassis, I. Effects of fish farming on the biological and geochemical properties of muddy and sandy sediments in the Mediterranean Sea. Mar. Environ. Res. 2010, 69, 326–336. [Google Scholar] [CrossRef] [PubMed]
- Iwama, G.K. Interactions between aquaculture and the environment. Crit. Rev. Environ. Control 1991, 21, 177–216. [Google Scholar] [CrossRef]
- Papageorgiou, N.; Sigala, K.; Karakassis, I. Changes of macrofaunal functional composition at sedimentary habitats in the vicinity of fish farms. Estuar. Coast. Shelf Sci. 2009, 83, 561–568. [Google Scholar] [CrossRef]
- Meynard, C.N.; Quinn, J.F. Predicting species distributions: A critical comparison of the most common statistical models using artificial species. J. Biogeogr. 2007, 34, 1455–1469. [Google Scholar] [CrossRef]
- Hillebrand, H.; Gruner, D.S.; Borer, E.T.; Bracken, M.E.S.; Cleland, E.E.; Elser, J.J.; Harpole, W.S.; Ngai, J.T.; Seabloom, E.W.; Shurin, J.B.; et al. Consumer versus resource control of producer diversity depends on ecosystem type and producer community structure. Proc. Natl. Acad. Sci. USA 2007, 104, 10904–10909. [Google Scholar] [CrossRef] [PubMed]
- Poore, G.C.B.; McCallum, A.W.; Taylor, J. Decapod Crustacea of the Continental Margin of Southwestern Australia and Central Western Australia: Preliminary Identifications of 524 Species from FRV Southern Surveyor Voyage SS10-2005; Museum Victoria Science Reports: Melbourne, Australia, 2008. [Google Scholar]
- Snelgrove, P.V.R. Diversity of marine species. In Encyclopedia of Ocean Sciences; Academic Press: Oxford, UK, 2001. [Google Scholar]
- Gogina, M.; Glockzin, M.; Zettler, M.L. Distribution of benthic macrofaunal communities in the western Baltic Sea with regard to near-bottom environmental parameters. I. Causal analysis. J. Mar. Syst. 2010, 79, 112–123. [Google Scholar] [CrossRef]
- Cartes, J.E.; Grémare, A.; Maynou, F.; Villora-Moreno, S.; Dinet, A. Bathymetric changes in the distributions of particulate organic matter and associated fauna along a deep-sea transect down the Catalan Sea slope (northwestern Mediterranean). Prog. Oceanogr. 2002, 53, 29–56. [Google Scholar] [CrossRef]
- Danovaro, R.; Della Croce, N.; Eleftheriou, A.; Fabiano, M.; Papadopoulou, N.; Smith, C.; Tselepides, A. Meiofauna of the deep eastern Mediterranean Sea: Distribution and abundance in relation to bacterial biomass, organic matter composition and other environmental factors. Prog. Oceanogr. 1995, 36, 329–341. [Google Scholar] [CrossRef]
- Lu, L.; Wu, R.S.S. Recolonization and succession of marine macrobenthos in organic-enriched sediment deposited from fish farms. Environ. Pollut. 1998, 101, 241–251. [Google Scholar] [CrossRef] [PubMed]
- Coma, R.; Ribes, M.; Gili, J.M.; Zabala, M. Seasonality in coastal benthic ecosystems. Trends Ecol. Evol. 2000, 15, 448–453. [Google Scholar] [CrossRef] [PubMed]
- Labropoulou, M.; Kostikas, I. Patterns of resource use in deep-water decapods. Mar. Ecol. Prog. Ser. 1999, 184, 171–182. [Google Scholar] [CrossRef]
- Tomassetti, P.; Persia, E.; Mercatali, I.; Vani, D.; Porrello, S. Effects of mariculture on macrobenthic assemblages in a western Mediterranean site. Mar. Pollut. Bull. 2009, 58, 533–541. [Google Scholar] [CrossRef] [PubMed]
- Tomassetti, P.; Porrello, S.; Persia, E.; Mercatali, I.; Stipa, P.; Vani, D.; Marussich, L. Environmental quality assessment of marine coastal ecosystems: A case study of aquaculture effects in the Adriatic Sea. Mar. Pollut. Bull. 2009, 58, 163–171. [Google Scholar]
- Maldonado, M.; Carmen, M.; Carmona, Y.E.; Riesgo, A. The environmental impact of Mediterranean cage fish farms at semi-exposed locations: Does it need a re-assessment? Helgol. Mar. Res. 2005, 59, 121–135. [Google Scholar] [CrossRef]
- Mannino, A.M.; Sara, G. Effects of fish-farm biodeposition on periphyton assemblages on artificial substrates in the southern Tyrrhenian Sea (Gulf of Castellammare, Sicily). Aquat. Ecol. 2008, 42, 575–581. [Google Scholar] [CrossRef]
- Ateş, A.S.; Katağan, T.; Sezgin, M.; Acar, S. The response of Apseudopsis latreillii (Milne-Edwards, 1828) (Crustacea, Tanaidacea) to environmental variables in the Dardanelles. Turk. J. Fish. Aquat. Sci. page range not provided. 2014, 14, 1. [Google Scholar]
- Fernández-González, V.; Martínez-García, E.; Sánchez-Jerez, P. Role of fish farm fouling in recolonisation of nearby soft-bottom habitats affected by coastal aquaculture. J. Exp. Mar. Biol. Ecol. 2016, 474, 210–215. [Google Scholar] [CrossRef]
- Carvalho, S.; Barata, M.; Gaspar, M.B.; Pousão-Ferreira, P.; Cancela da Fonseca, L. Enrichment of aquaculture earthen ponds with Hediste diversicolor: Consequences for benthic dynamics and natural productivity. Aquaculture 2007, 262, 227–236. [Google Scholar] [CrossRef]
- Çoban, Ö.Ö. Amphipod diversity in mussel-associated fouling communities of aquaculture nets in Ildır Bay (Aegean Sea, Türkiye). MEMBA J. Water Sci. 2025, 11, 448–462. [Google Scholar] [CrossRef]
- Iaciofano, D.; Mancini, E.; Lubinevsky, H.; Lo Brutto, S. The amphipod fauna assemblage along the Mediterranean Israeli coast: A spatiotemporal overview. Ecol. Monten. 2024, 80, 244–272. [Google Scholar] [CrossRef]
- Mirto, S.; La Rosa, T.; Gambi, C.; Danovaro, R.; Mazzola, A. Nematode community response to fish-farm impact in the western Mediterranean. Environ. Pollut. 2002, 116, 203–214. [Google Scholar] [CrossRef] [PubMed]
- Tomassetti, P.; Porrello, S. Polychaetes as indicators of marine fish farm organic enrichment. Aquac. Int. 2005, 13, 109–128. [Google Scholar] [CrossRef]
- Hall-Spencer, J.; Bamber, R. Efectos del cultivo de salmón sobre crustáceos bénticos. Cienc. Mar. 2007, 33, 353–366. [Google Scholar]
- Klaoudatos, D.S.; Klaoudatos, S.D.; Smith, J.; Bogdanos, K.; Papageorgiou, E. Assessment of site-specific benthic impact of fish farming in the eastern Mediterranean. Mar. Pollut. Bull. 2006, 52, 194–203. [Google Scholar]
- La Rosa, T.; Mirto, S.; Mazzola, A.; Danovaro, R. Differential responses of benthic microbes and meiofauna to fish-farm disturbance in coastal sediments. Environ. Pollut. 2001, 112, 427–434. [Google Scholar] [CrossRef] [PubMed]
- Mazzola, A.; Mirto, S.; Danovaro, R. Initial fish-farm impact on meiofaunal assemblages in coastal sediments of the western Mediterranean. Mar. Pollut. Bull. 1999, 38, 1126–1133. [Google Scholar] [CrossRef]
- Mazzola, A.; Mirto, S.; La Rosa, T.; Fabiano, M.; Danovaro, R. Fish-farming effects on benthic community structure in coastal sediments: Analysis of meiofaunal recovery. J. Mar. Sci. 2000, 57, 1454–1461. [Google Scholar] [CrossRef]
- Mirto, S.; La Rosa, T.; Danovaro, R.; Mazzola, A. Microbial and meiofaunal response to intensive mussel-farm biodeposition in coastal sediments of the western Mediterranean. Mar. Pollut. Bull. 2000, 40, 244–252. [Google Scholar] [CrossRef]
- Gómez-Gesteira, J.L.; Dauvin, J.C. Amphipods are good bioindicators of the impact of oil spills on soft-bottom macrobenthic communities. Mar. Pollut. Bull. 2000, 40, 1017–1027. [Google Scholar] [CrossRef]
- Tsapakis, M.; Dakanali, E.; Stephanou, E.G.; Karakassis, I. PAHs and n-alkanes in Mediterranean coastal marine sediments: Aquaculture as a significant point source. J. Environ. Monit. 2010, 1, 958–963. [Google Scholar] [CrossRef] [PubMed]
- Corberá, J.; Cardell, M.J. Cumaceans as indicators of eutrophication on soft bottoms. Sci. Mar. 1995, 59 (Suppl. 1), 63–69. [Google Scholar]
- Gray, J.S.; Wu, R.S.S.; Or, Y.Y. Effects of hypoxia and organic enrichment on the coastal marine environment. Mar. Ecol. Prog. Ser. 2002, 238, 249–279. [Google Scholar] [CrossRef]
- Sánchez-Moyano, J.E.; García-Gómez, J.C. The arthropod community, especially Crustacea, as a bioindicator in Algeciras Bay (Southern Spain) based on spatial distribution. J. Coast. Res. 1998, 14, 1119–1133. [Google Scholar]
- Diviacco, G.; Bianchi, C.N. Faunal interrelationship between lagoonal and marine amphipod crustacean communities of the Po River delta (northern Adriatic). An. Biol. 1987, 12, 67–77. [Google Scholar]
- Guerra-García, J.M.; Corzo, J.R.; García-Gómez, J.C. Distribución vertical de la macrofauna en sedimentos contaminados del interior del puerto de Ceuta. Bol. Inst. Esp. Oceanogr. 2003, 19, 105–121. [Google Scholar]
- Conradi, M.; López-González, P.J.; García-Gómez, C. The amphipod community as a bioindicator in Algeciras Bay (southern Iberian Peninsula) based on spatio-temporal distribution. P.S.Z.N. Mar. Ecol. 1997, 18, 97–111. [Google Scholar] [CrossRef]
- Guerra-García, J.M.; García-Gómez, J.C. Recolonisation of defaunated sediments: Fine versus gross sand and dredging versus experimental trays. Estuar. Coast. Shelf Sci. 2006, 68, 328–342. [Google Scholar] [CrossRef]
- Guerra-García, J.M.; Redondo-Gómez, S.; Espina, A.C.; Castillo, J.M.; Luque, T.; García-Gómez, J.C.; Figueroa, E. Caprella penantis Leach, 1814 and Caprella dilatata Krøyer, 1843 (Crustacea: Amphipoda) from the Strait of Gibraltar: A molecular approach to explore intra- and interspecific variation. Mar. Biol. Res. 2006, 2, 100–108. [Google Scholar] [CrossRef]
- Mutlu, E.; Ergev, M.B. Distribution of soft-bottom mollusks (Mollusca) in Mersin Bay (eastern Mediterranean Sea). Turk. J. Zool. 2012, 36, 430–446. [Google Scholar] [CrossRef]
- Zenetos, A. Classification and interpretation of the established Mediterranean biocoenoses based solely on bivalve molluscs. J. Mar. Biol. Assoc. UK 1996, 76, 403–416. [Google Scholar] [CrossRef]
- Kroncke, I.; Turkay, M.; Fiege, D. Macrofauna communities in the Eastern Mediterranean deep sea. Mar. Ecol. 2003, 24, 193–216. [Google Scholar] [CrossRef]
- Dilmi, S.; Bachetarzi, R.; Rebzani-Zahaf, C. Macrobenthic fauna and the ecological status of a shellfish farm in the Mediterranean Sea (Algeria). Mediterr. Mar. Sci. 2024, 25, 116–135. [Google Scholar] [CrossRef]
- Tselepides, A.; Eleftheriou, A. South Aegean (eastern Mediterranean) continental slope benthos: Macroinfaunal–environmental relationships. In Deep-Sea Food Chains and the Global Carbon Cycle; Rowe, G.T., Pariente, V., Eds.; Kluwer Academic Publishers: Dordrecht, The Netherlands, 1992; pp. 139–156. [Google Scholar]
- Dimitriadis, C.; Koutsoubas, D. Community properties of benthic molluscs as indicators of environmental stress induced by organic enrichment. J. Nat. Hist. 2008, 42, 559–574. [Google Scholar] [CrossRef]
- Dimech, M.; Borg, J.A.; Schembri, P.J. Changes in the structure of a Posidonia oceanica meadow and in the diversity of associated decapod, mollusc and echinoderm assemblages resulting from inputs of waste from a marine fish farm (Malta, central Mediterranean). Bull. Mar. Sci. 2002, 71, 1309–1321. [Google Scholar]
- Pearson, T.H.; Rosenberg, R. Macrobenthic succession in relation to organic enrichment and pollution of the marine environment. Oceanogr. Mar. Biol. Annu. Rev. 1978, 16, 229–311. [Google Scholar]
- Bayle-Sempere, J.T.; Arreguín-Sánchez, F.; Sánchez-Jerez, P.; Salcido-Guevara, L.A.; Fernández-Jover, D.; Zetina-Rejón, M.J. Trophic structure and energy fluxes around a Mediterranean fish farm. Ecol. Model. 2013, 248, 135–147. [Google Scholar] [CrossRef]
- Elmgren, R. Man’s impact on the ecosystem of the Baltic Sea: Energy flows today and at the turn of the century. Ambio 1989, 18, 326–332. [Google Scholar]
- Grall, J.; Chauvaud, L. Marine eutrophication and benthos: The need for new approaches and concepts. Glob. Change Biol. 2002, 8, 813–830. [Google Scholar] [CrossRef]
- Herman, P.M.J.; Middelburg, J.J.; Van de Koppel, J.; Heip, C.H.R. Ecology of estuarine macrobenthos. Adv. Ecol. Res. 1999, 29, 195–240. [Google Scholar] [CrossRef]
- Paerl, H.W.; Pinckney, J.L.; Fear, J.M.; Peierls, B.L. Ecosystem responses to internal and watershed organic matter loading: Consequences for hypoxia in coastal waters. Mar. Ecol. Prog. Ser. 1998, 166, 17–25. [Google Scholar] [CrossRef]
- Aguado-Giménez, F.; Marín, A.; Montoya, S.; Marín-Guirao, L.; Piedecausa, A.; García-García, B. Comparison between procedures for monitoring offshore cage culture in the western Mediterranean Sea: Sampling methods and impact indicators in soft substrata. Aquaculture 2007, 271, 357–370. [Google Scholar] [CrossRef]
- Aguado-Giménez, F.; Piedecausa, M.A.; Gutiérrez, J.M.; García-Charton, J.A.; Belmonte, A. Responses of benthic assemblages to fish-farm activities in the western Mediterranean. Mar. Pollut. Bull. 2007, 54, 1548–1561. [Google Scholar]
- Hagy, J.D.; Boynton, W.R.; Wood, C.W.; Wood, K.V. Hypoxia in Chesapeake Bay, 1950–2001: Long-term changes in relation to nutrient loading and river flow. Estuaries 2004, 27, 634–658. [Google Scholar] [CrossRef]
- Vaquer-Sunyer, R.; Duarte, C.M. Thresholds of hypoxia for marine biodiversity. Proc. Natl. Acad. Sci. USA 2008, 105, 15452–15457. [Google Scholar] [CrossRef] [PubMed]
- Zimmerman, A.R.; Canuel, E.A. A geochemical record of eutrophication and anoxia in Chesapeake Bay sediments: Anthropogenic influence on organic matter composition. Mar. Chem. 2000, 69, 117–137. [Google Scholar] [CrossRef]
- Seitz, R.D.; Dauer, D.M.; Llansó, R.J.; Long, W.C. Broad-scale effects of hypoxia on benthic community structure in Chesapeake Bay, USA. J. Exp. Mar. Biol. Ecol. 2009, 381, S4–S12. [Google Scholar] [CrossRef]
- Bishop, M.J.; Kelaher, B.P.; York, P.H.; Booth, D.J. Benthic assemblages associated with the onset of hypoxia in a temperate estuary. Mar. Ecol. Prog. Ser. 2006, 328, 15–28. [Google Scholar]
- Sanz-Lazaro, C.; Marin, A. Benthic recovery during open-sea fish farming abatement in the western Mediterranean. Mar. Environ. Res. 2006, 62, 374–387. [Google Scholar] [CrossRef] [PubMed]
- Klaoudatos, S.D.; Klaoudatos, D.S.; Smith, J.; Bogdanos, K.; Papageorgiou, E. Assessment of site-specific benthic impact of floating cage farming in the eastern Hios Island, Eastern Aegean Sea, Greece. J. Exp. Mar. Biol. Ecol. 2006, 338, 96–111. [Google Scholar] [CrossRef]
- Dimech, M.; Borg, J.A.; Schembri, P.J. The effects of a marine fish farm on the species richness and abundance of molluscs, decapods and echinoderms associated with a Posidonia oceanica meadow in Malta (central Mediterranean). Biol. Mar. Mediterr. 2000, 7, 357–360. [Google Scholar]
- Dimech, M.; Borg, J.A.; Schembri, P.J. Effects of fish farming on the benthic macrofauna of soft sediments in Malta. Mar. Pollut. Bull. 2000, 40, 634–646. [Google Scholar]
- Ergen, Z.; Çınar, M.E.; Dağlı, E. Effects of fish farming on benthic polychaete assemblages along the Aegean Sea coast (Turkey). Cah. Biol. Mar. 2004, 45, 1–11. [Google Scholar]
- Pocklington, P.; Scott, D.B.; Schafer, C.T. Polychaete response to different aquaculture activities. In Actes de la 4ème Conférence Internationale des Polychètes; Dauvin, J.C., Laubier, L., Reish, D., Eds.; Muséum National d’Histoire Naturelle: Paris, France, 1994; Volume 162, pp. 511–520. [Google Scholar]
- Pocklington, P.; Wells, P.G.; Fournier, J. Polychaetes as indicators of environmental stress: A review. Mar. Pollut. Bull. 1994, 28, 593–598. [Google Scholar]
- Küçüksezgin, F.; Pazi, İ.; Kayıkçı, E.; Gönül, L.T. Eutrophication assessment of Güllük Bay (Aegean Sea) using trophic indices. Mar. Pollut. Bull. 2021, 164, 112020. [Google Scholar]
- Karakassis, I.; Dimitriou, P.D.; Papageorgiou, N.; Apostolaki, E.T.; Lampadariou, N.; Black, K.D. Methodological considerations on the use of benthic indicators in aquaculture impact assessment. Mar. Pollut. Bull. 2020, 156, 111266. [Google Scholar]
- Weston, D.P. Quantitative examination of macrobenthic community changes along an organic enrichment gradient. Mar. Ecol. Prog. Ser. 1990, 61, 233–244. [Google Scholar] [CrossRef]
- Kalkan, E.; Karhan, S.; Mutlu, E.; Simboura, N.; Bekolet, M. Application of the BENTIX index in assessing ecological quality of hard substrata: A case study from the Bosphorus Strait, Turkey. Mediterr. Mar. Sci. 2007, 8, 15–30. [Google Scholar] [CrossRef]
- Simboura, N.; Zenetos, A. Benthic indicators to use in ecological quality classification of Mediterranean soft-bottom marine ecosystems, including a new Biotic Index. Mediterr. Mar. Sci. 2002, 3, 77–111. [Google Scholar] [CrossRef]
- Forchino, A.; Borja, Á.; Brambilla, F.; Rodríguez, J.G. Evaluating the influence of fish farming on benthic communities using biotic indices. Ecol. Indic. 2011, 11, 871–880. [Google Scholar]
- Forchino, A.; Borja, Á.; Brambilla, F.; Rodríguez, J.G.; Muxika, I.; Terova, G.; Saroglia, M. Evaluating offshore cage aquaculture impacts using AMBI and M-AMBI. Ecol. Indic. 2011, 11, 1112–1122. [Google Scholar] [CrossRef]
- Hall, P.O.J.; Anderson, L.G.; Holby, O.; Kollberg, S.; Samuelsson, M.O. Chemical fluxes and mass balances in a marine fish cage farm. I. Carbon. Mar. Ecol. Prog. Ser. 1990, 61, 61–73. [Google Scholar] [CrossRef]
- Sweetman, A.K.; Norling, K.; Gunderstad, C.; Haugland, B.T.; Dale, T. Benthic ecosystem functioning beneath fish farms in different hydrodynamic environments. Limnol. Oceanogr. 2014, 59, 1139–1151. [Google Scholar] [CrossRef]
- Pergent-Martini, C.; Boudouresque, C.-F.; Pasqualini, V.; Pergent, G. Impact of fish farming facilities on Posidonia oceanica meadows: A review. Mar. Ecol. 2006, 27, 310–319. [Google Scholar] [CrossRef]
- Rountos, K.J.; Peterson, B.J.; Karakassis, I. Indirect effects of fish cage aquaculture on shallow Posidonia oceanica seagrass patches in coastal Greek waters. Aquac. Environ. Interact. 2012, 2, 105–115. [Google Scholar] [CrossRef]
- Montalto, V.; Rinaldi, A.; Ape, F.; Mangano, M.C.; Gristina, M.; Sarà, G.; Mirto, S. Functional role of biofouling linked to aquaculture facilities in Mediterranean enclosed locations. Aquac. Environ. Interact. 2020, 12, 11–22. [Google Scholar] [CrossRef]
- Neofitou, N.; Syvri, R.; Tziantziou, L.; Mente, E.; Vafidis, D. The benthic environmental footprint of aquaculture in the Eastern Mediterranean: Organic vs conventional fish farming. Aquac. Res. 2020, 51, 2698–2710. [Google Scholar] [CrossRef]
Figure 1.
Study area (red rectangular) and sampling stations for fish farms in the study area (a), Güllük Gulf (b) with the main control stations (d) and Bozburun bay (c) with those (Hisarönü Gulf) (e) in 2003 and 2004. Dotted line denotes locations deployed for in/ex situ study to determine biodiversity changes at sub-control stations (X1, X2 ..) distanced keeping the bottom depth same from a fish farm (X0) on comparison (b, c) (see Table 1 for the details).
Figure 1.
Study area (red rectangular) and sampling stations for fish farms in the study area (a), Güllük Gulf (b) with the main control stations (d) and Bozburun bay (c) with those (Hisarönü Gulf) (e) in 2003 and 2004. Dotted line denotes locations deployed for in/ex situ study to determine biodiversity changes at sub-control stations (X1, X2 ..) distanced keeping the bottom depth same from a fish farm (X0) on comparison (b, c) (see Table 1 for the details).
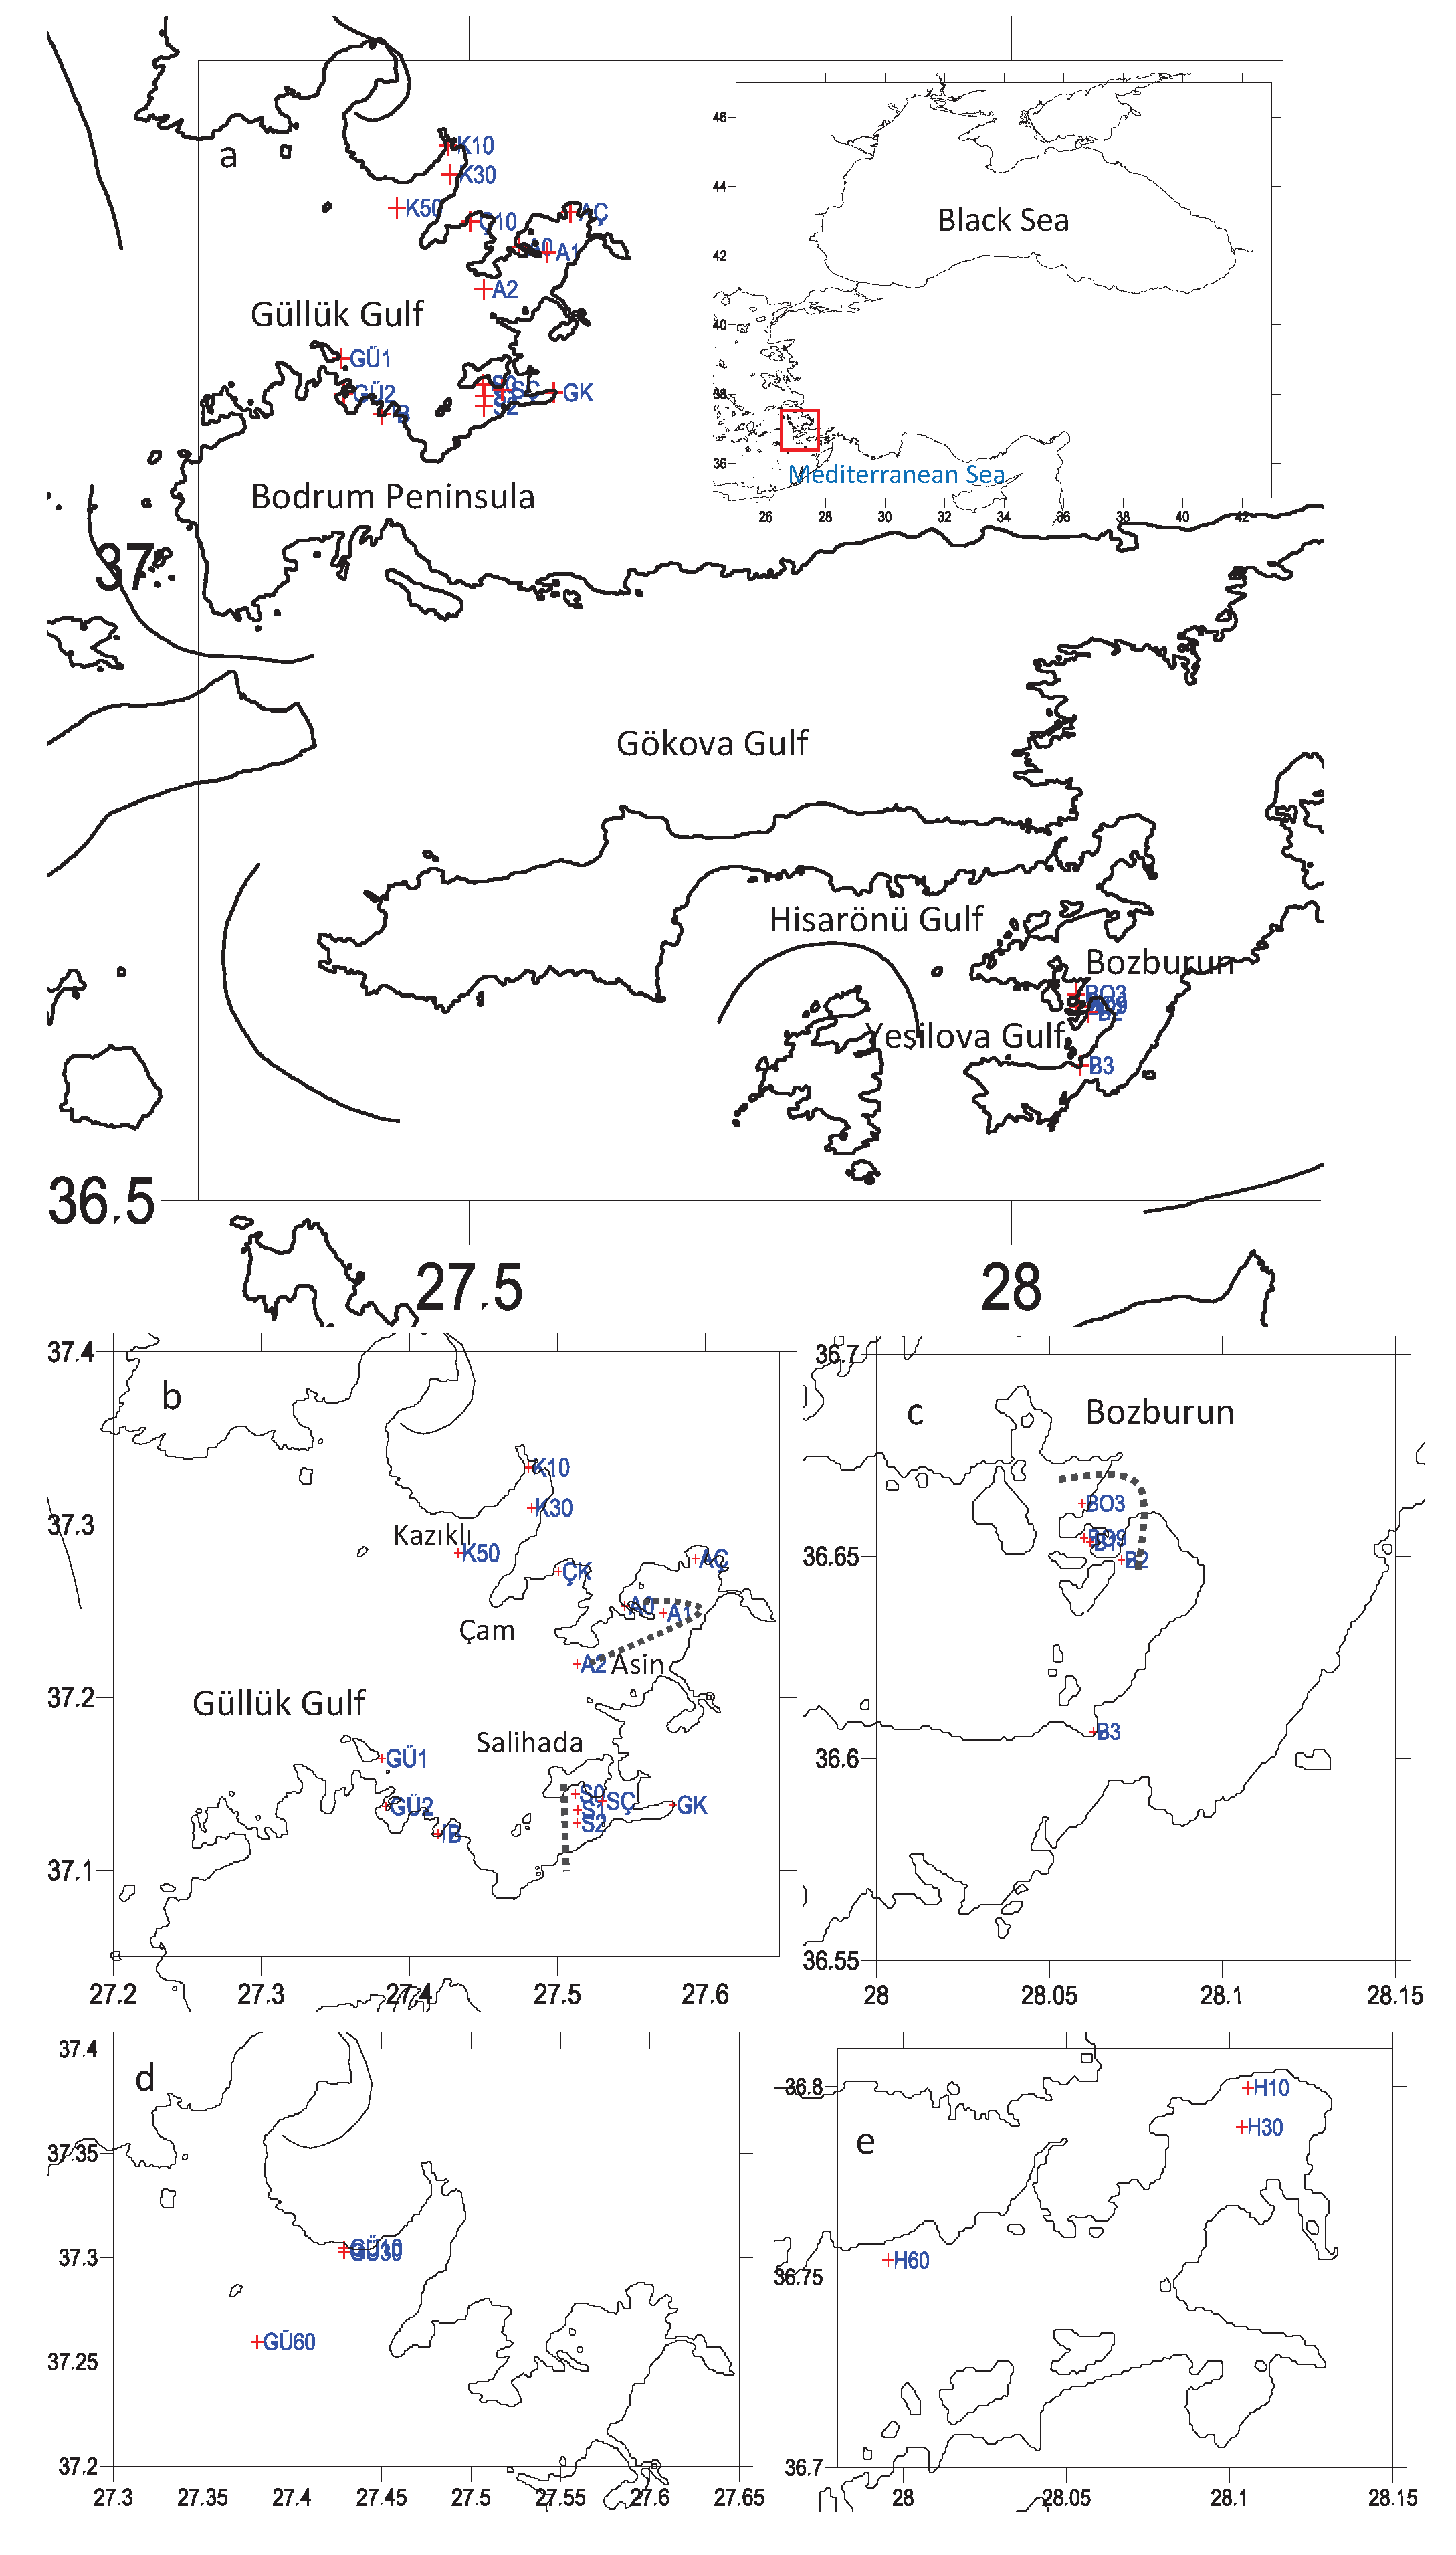
Figure 2.
Faunistic characteristics (S: number of species, N.: abundance in ind/m2, d: Margalef’s richness, J’: Pielou’s evenness, H’: Shannon-Weiner index, B: biomass in g/m2) across number of cages at the fish farm site.
Figure 2.
Faunistic characteristics (S: number of species, N.: abundance in ind/m2, d: Margalef’s richness, J’: Pielou’s evenness, H’: Shannon-Weiner index, B: biomass in g/m2) across number of cages at the fish farm site.
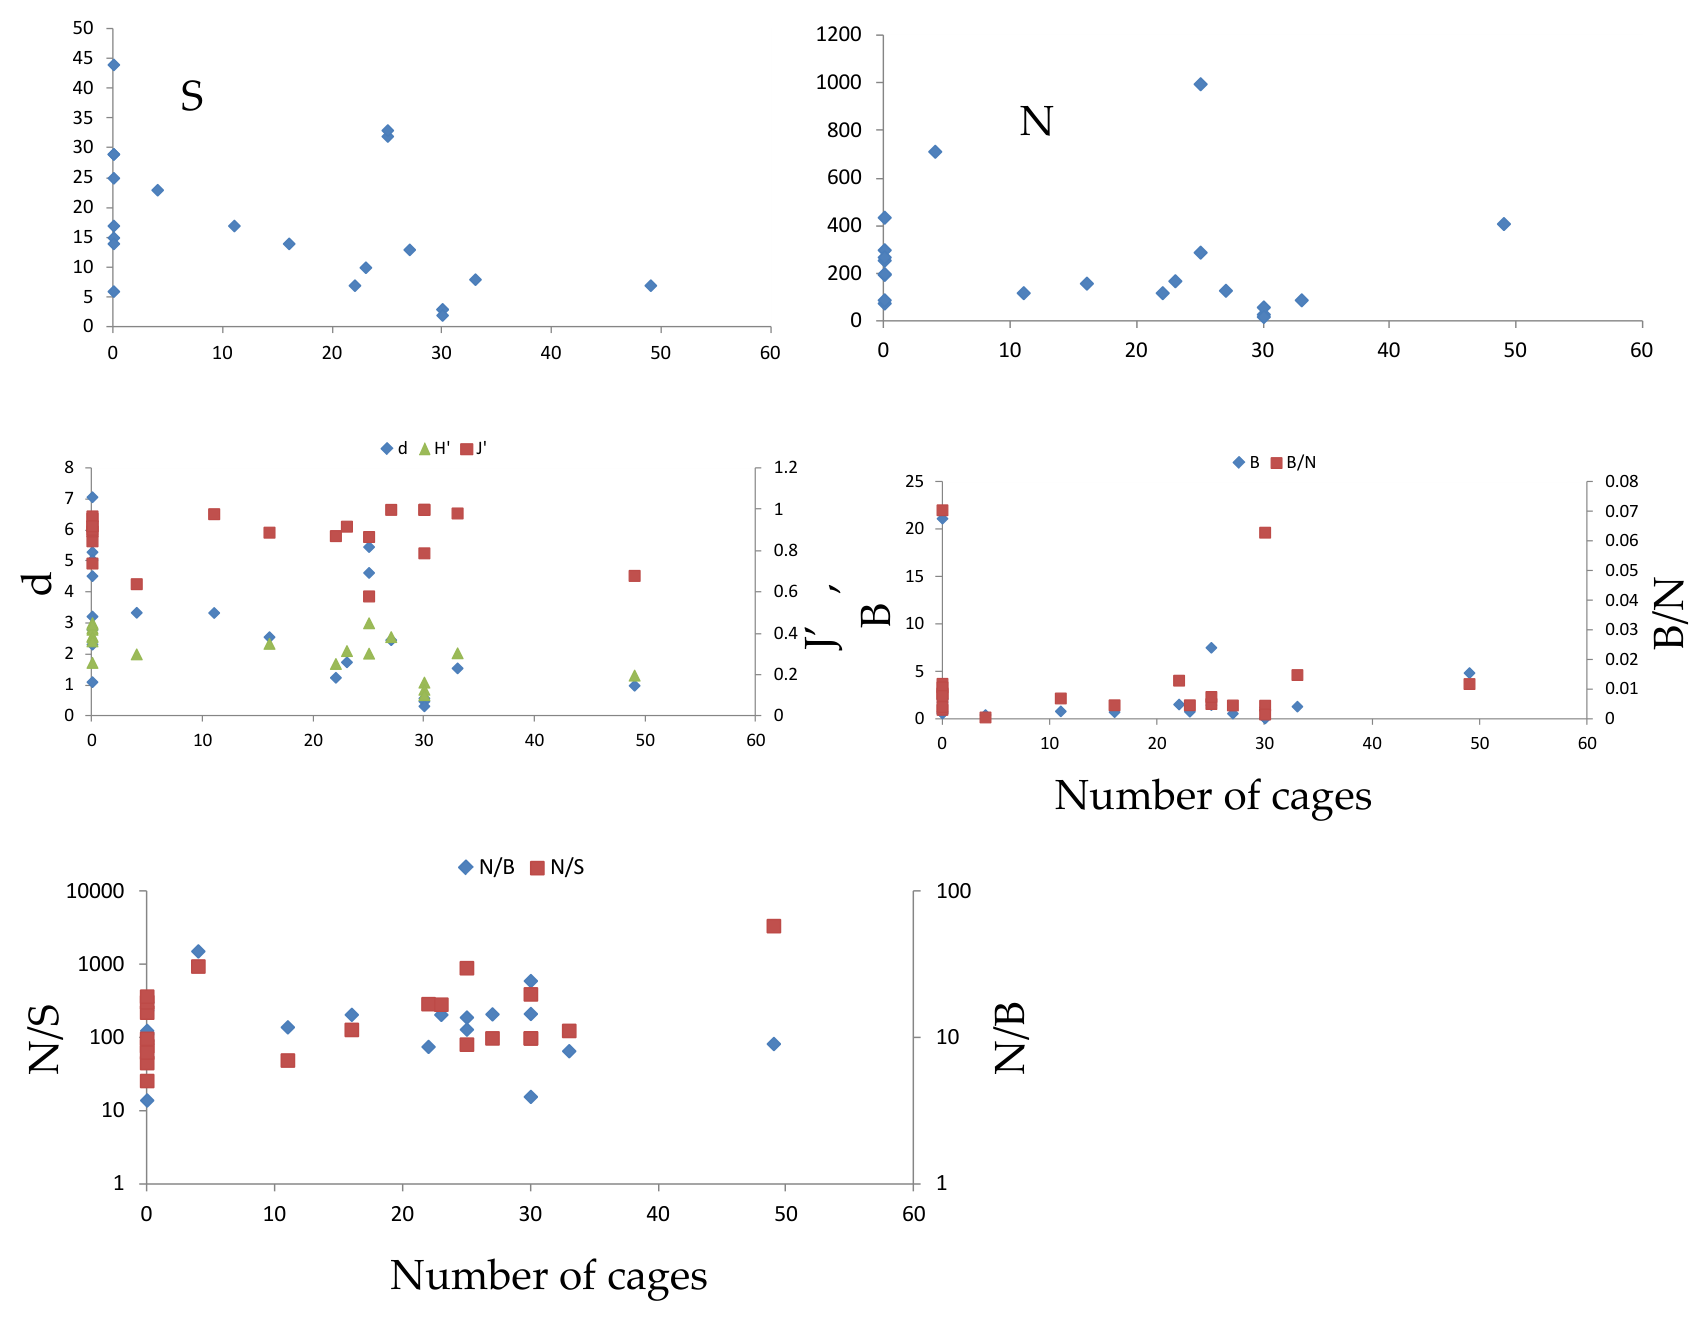
Figure 3.
Number of taxon species (S), and linear (left) and logarithmic (right panel)-scaled average abundance (N), biomass (B) and B/N ratio at the fish farm sites (Clc 1-4) and control site (Clc 5-6) across crustacean and molluscan taxa.
Figure 3.
Number of taxon species (S), and linear (left) and logarithmic (right panel)-scaled average abundance (N), biomass (B) and B/N ratio at the fish farm sites (Clc 1-4) and control site (Clc 5-6) across crustacean and molluscan taxa.
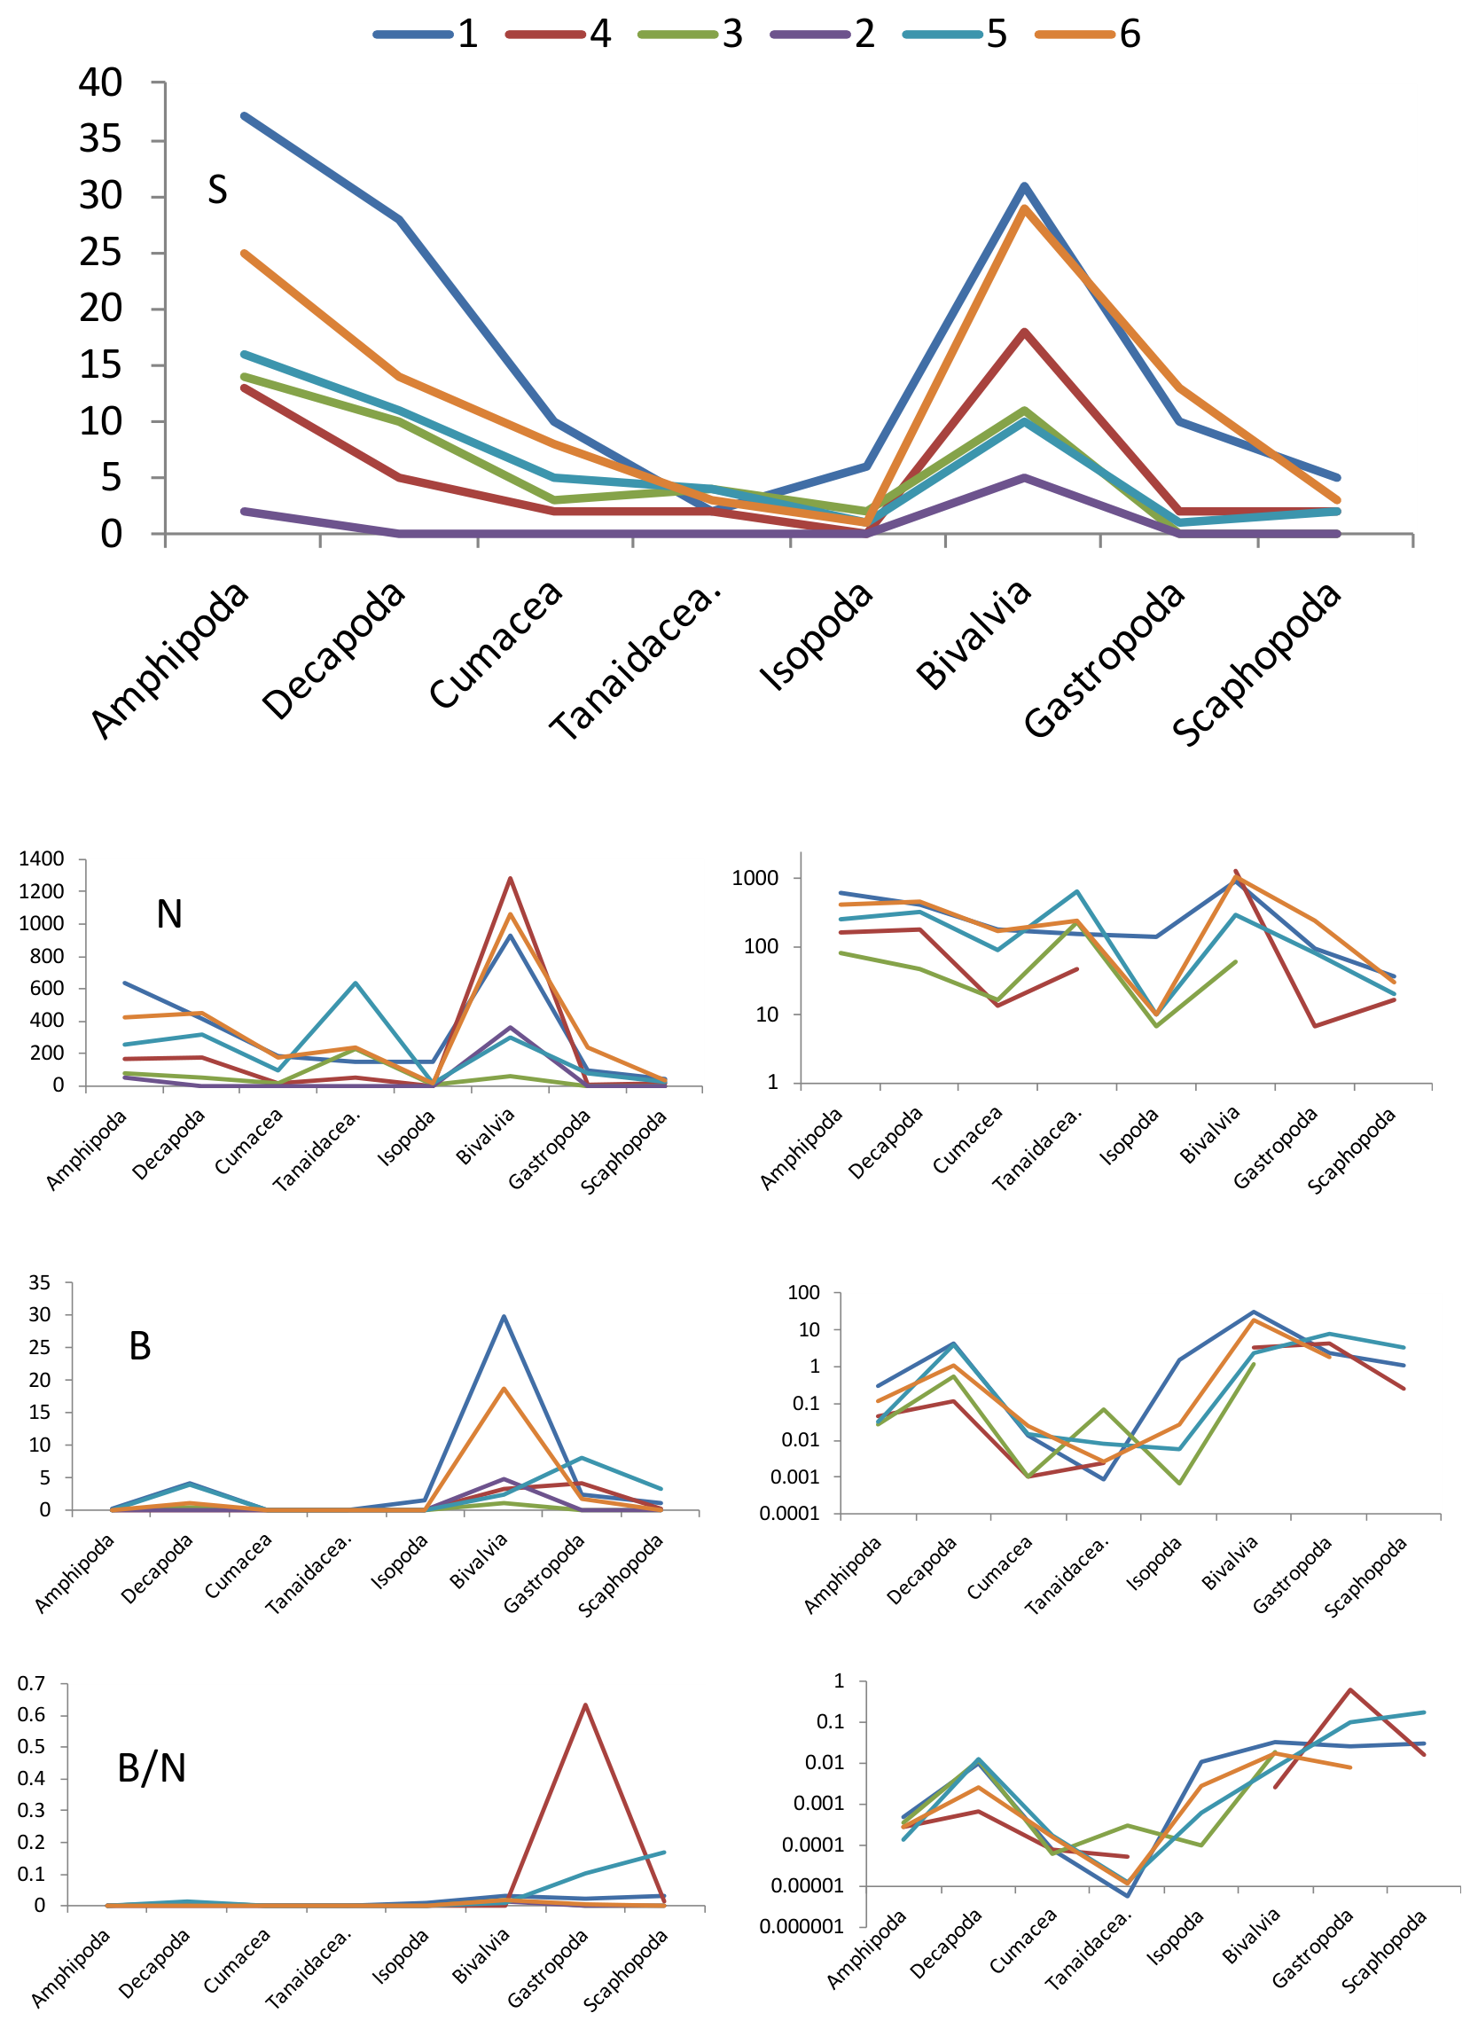
Figure 4.
Faunistic characteristics (S: number of species, N.: abundance in ind/m2, d: Margalef’s richness, J’: Pielou’s evenness, H’: Shannon-Weiner index, B: biomass in g/m2) at control site stations.
Figure 4.
Faunistic characteristics (S: number of species, N.: abundance in ind/m2, d: Margalef’s richness, J’: Pielou’s evenness, H’: Shannon-Weiner index, B: biomass in g/m2) at control site stations.
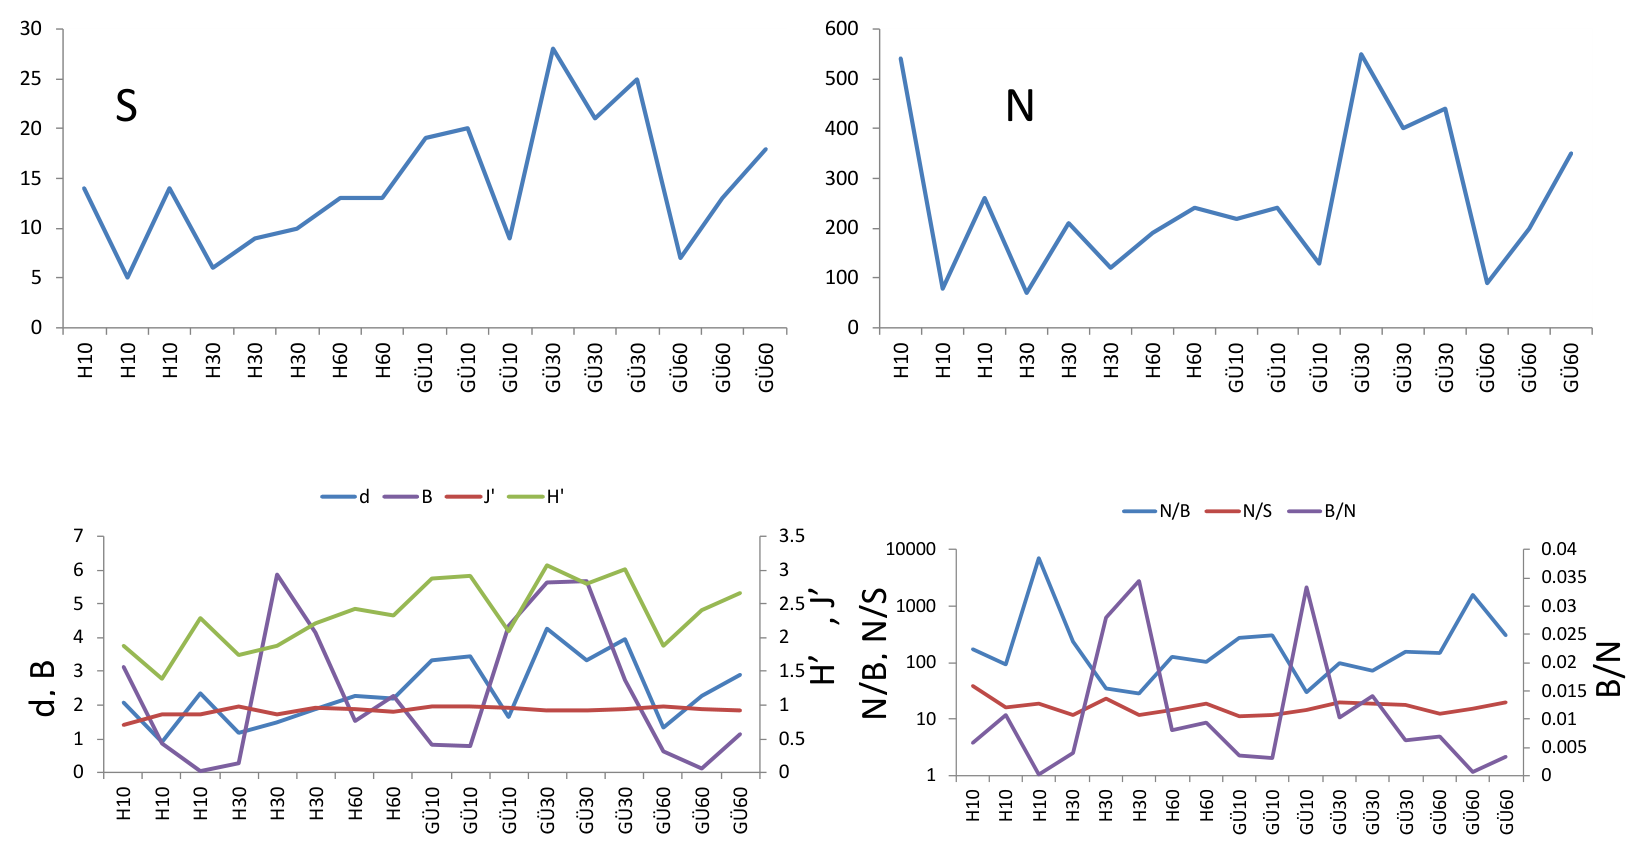
Figure 5.
nMDS plot of species abundance log10-transformed for the Bray-Curtis similarity index across the sampling stations classified by clusters classes (Clst), and sub-plots classified by sampling years, bottom depth code, sites, bottom depth in m (De) and number of cages (Cage). Station indicated with arrow was excluded in nMDS sub-plots framed in blue (see Table 1 for the locations of the clusters).
Figure 5.
nMDS plot of species abundance log10-transformed for the Bray-Curtis similarity index across the sampling stations classified by clusters classes (Clst), and sub-plots classified by sampling years, bottom depth code, sites, bottom depth in m (De) and number of cages (Cage). Station indicated with arrow was excluded in nMDS sub-plots framed in blue (see Table 1 for the locations of the clusters).
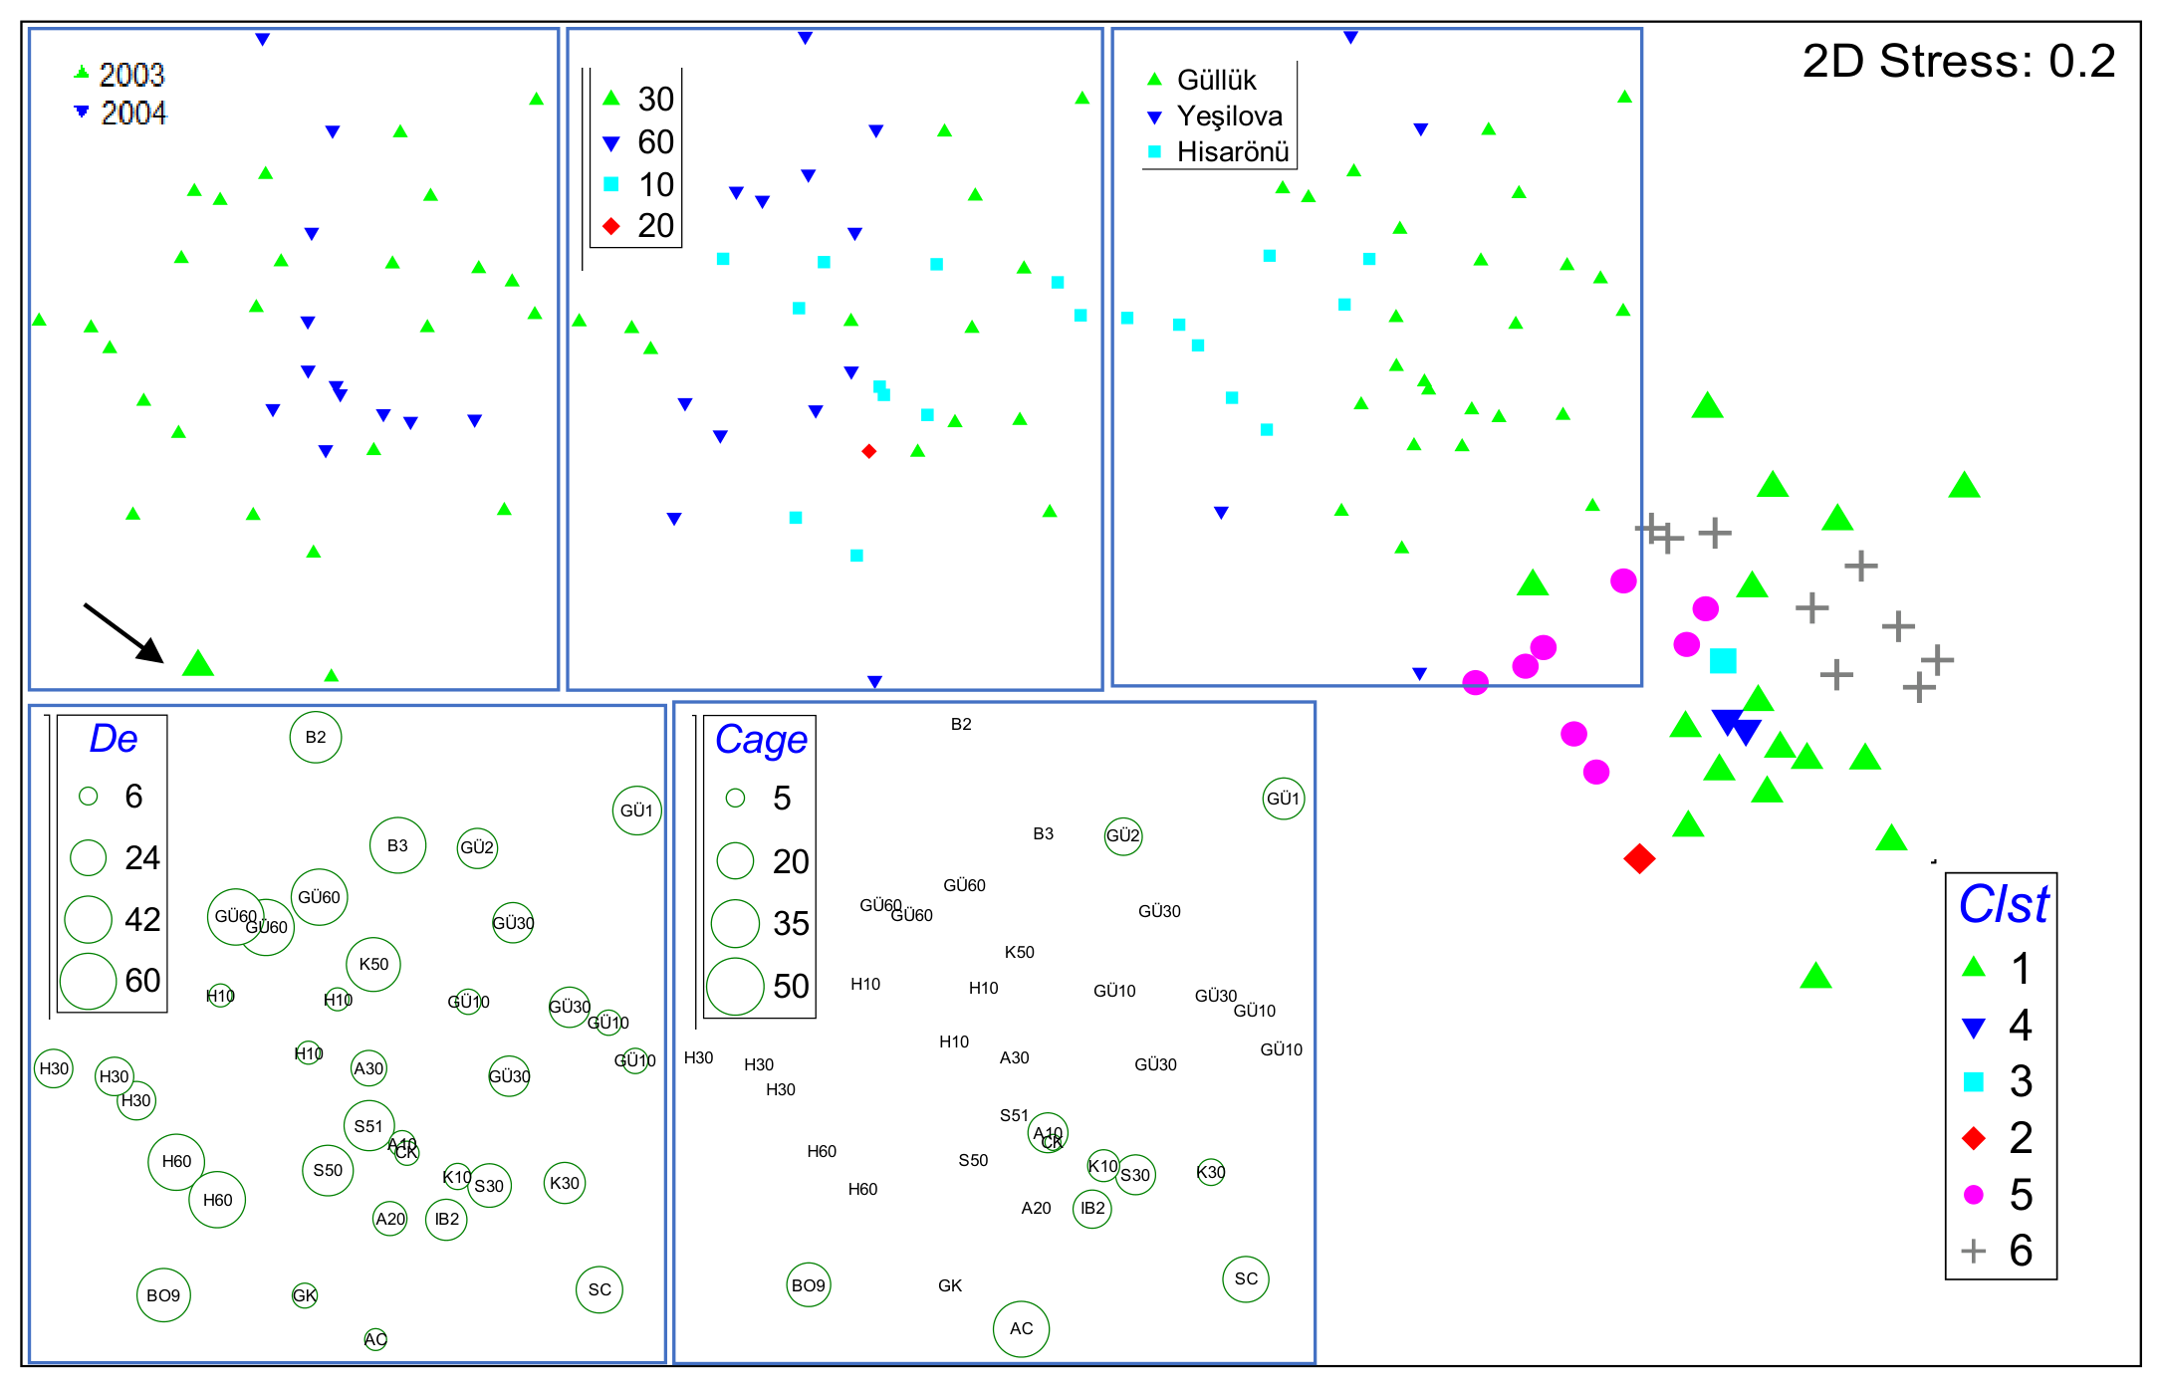
Figure 6.
Biplot of CCA plot of species log10-transformed abundance with the sampling stations classified by fish farm capacity and control sites (a, b and c). Stations indicated with arrow were excluded in nMDS plots (b, c) (see Table S2 and Table S7 for the abbreviations of the environmental parameters).
Figure 6.
Biplot of CCA plot of species log10-transformed abundance with the sampling stations classified by fish farm capacity and control sites (a, b and c). Stations indicated with arrow were excluded in nMDS plots (b, c) (see Table S2 and Table S7 for the abbreviations of the environmental parameters).
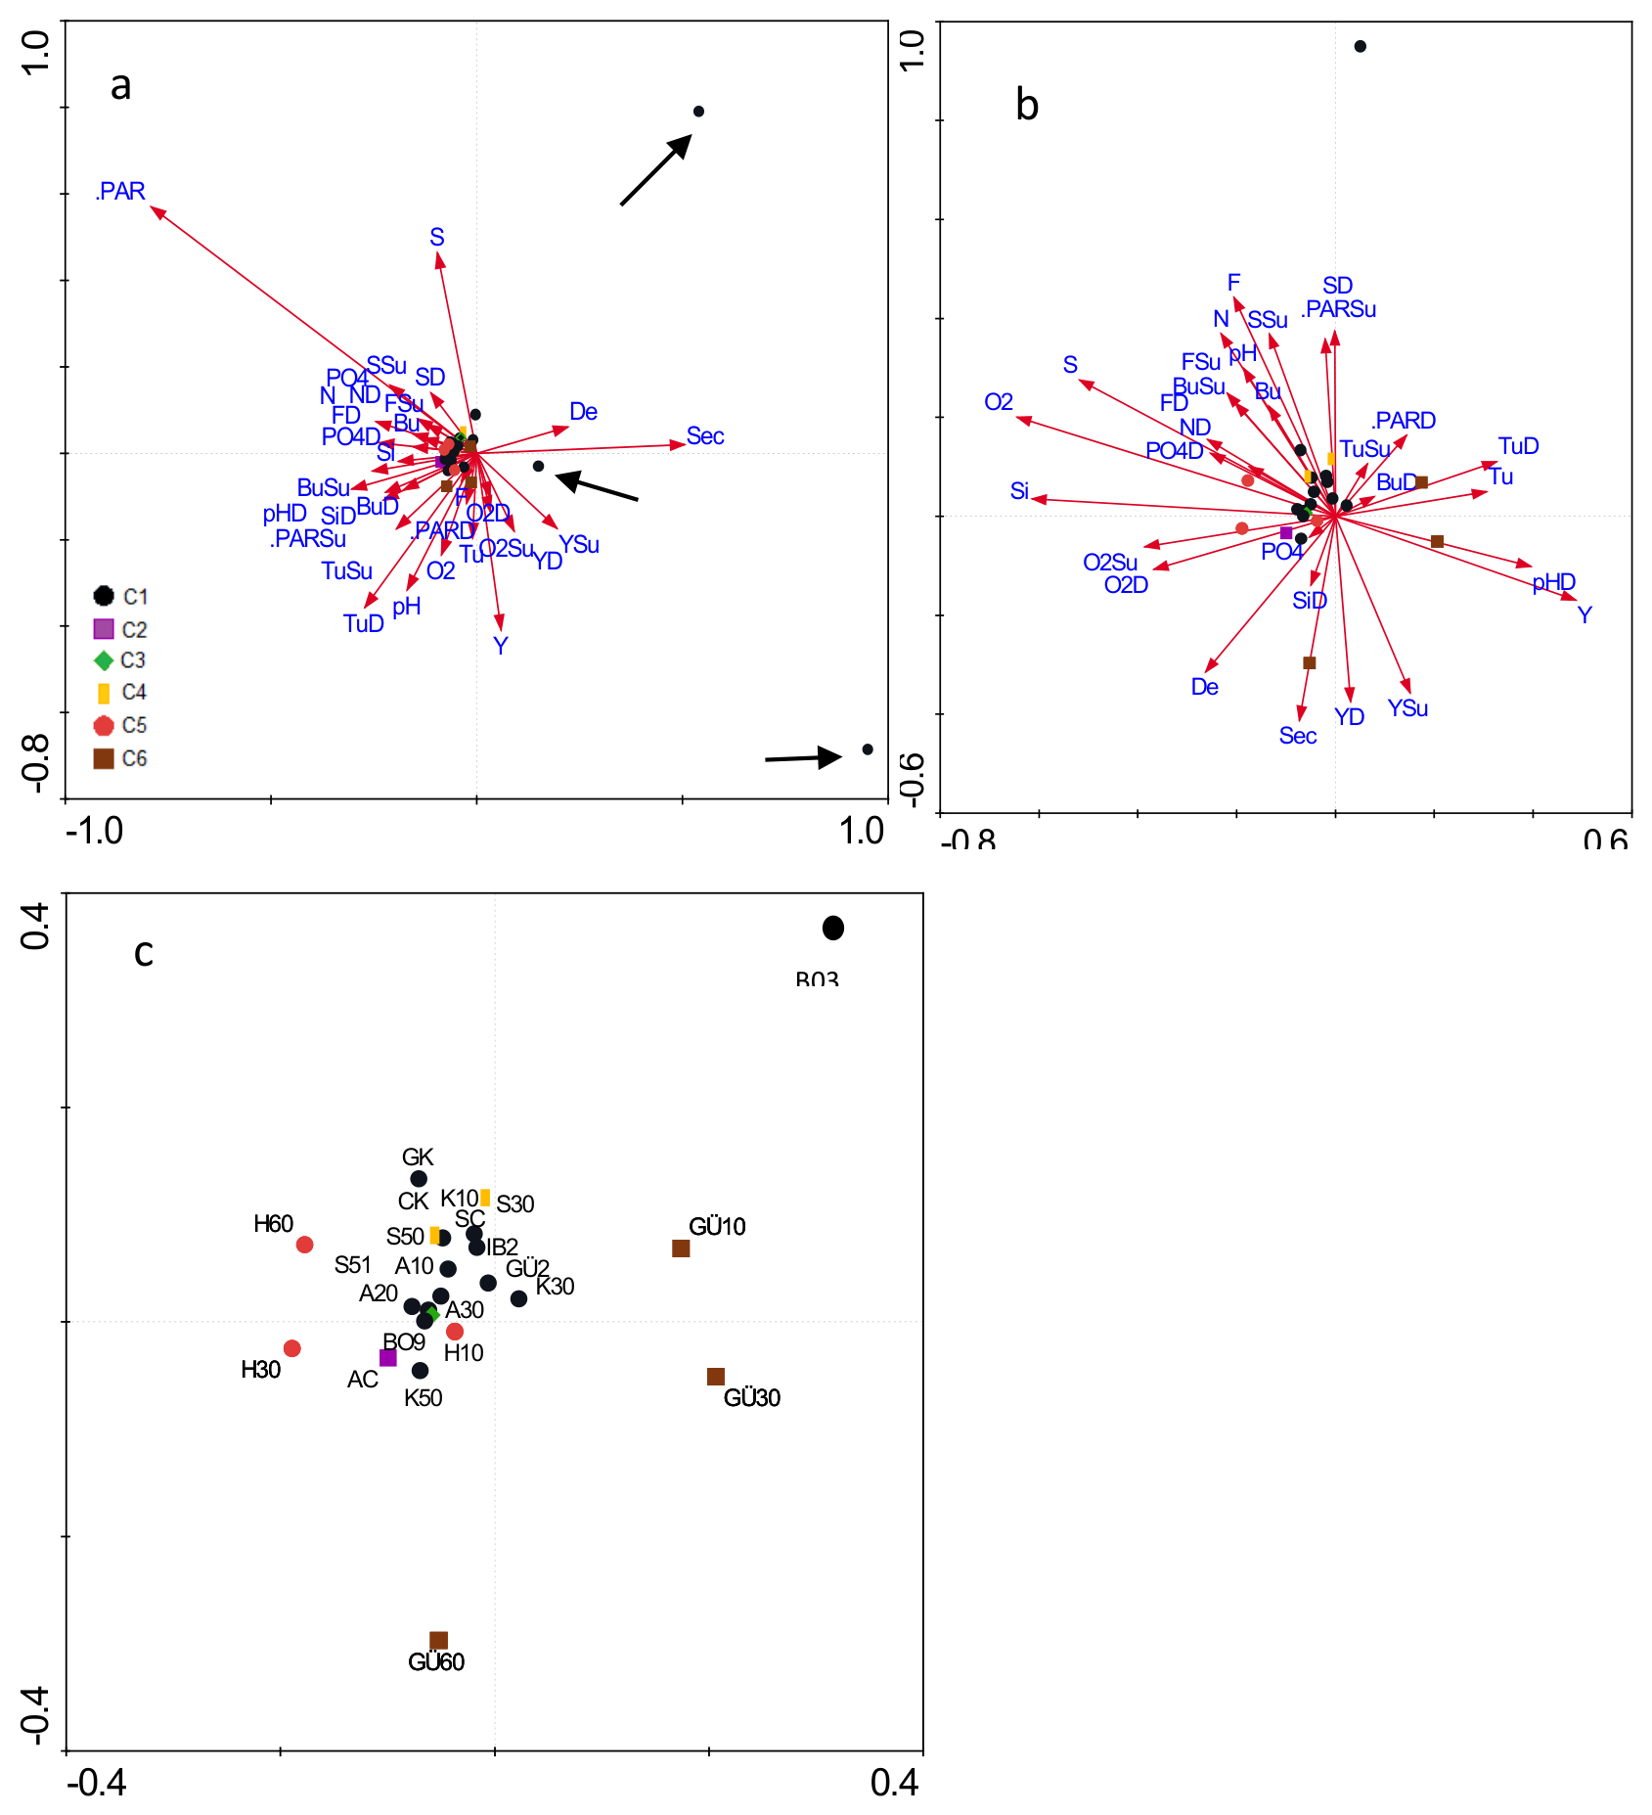
Figure 7.
ABC curves across fish farm clusters estimated in Figure S2d and control sites (Table 1). Cluster no, and W-statistics.
Figure 7.
ABC curves across fish farm clusters estimated in Figure S2d and control sites (Table 1). Cluster no, and W-statistics.
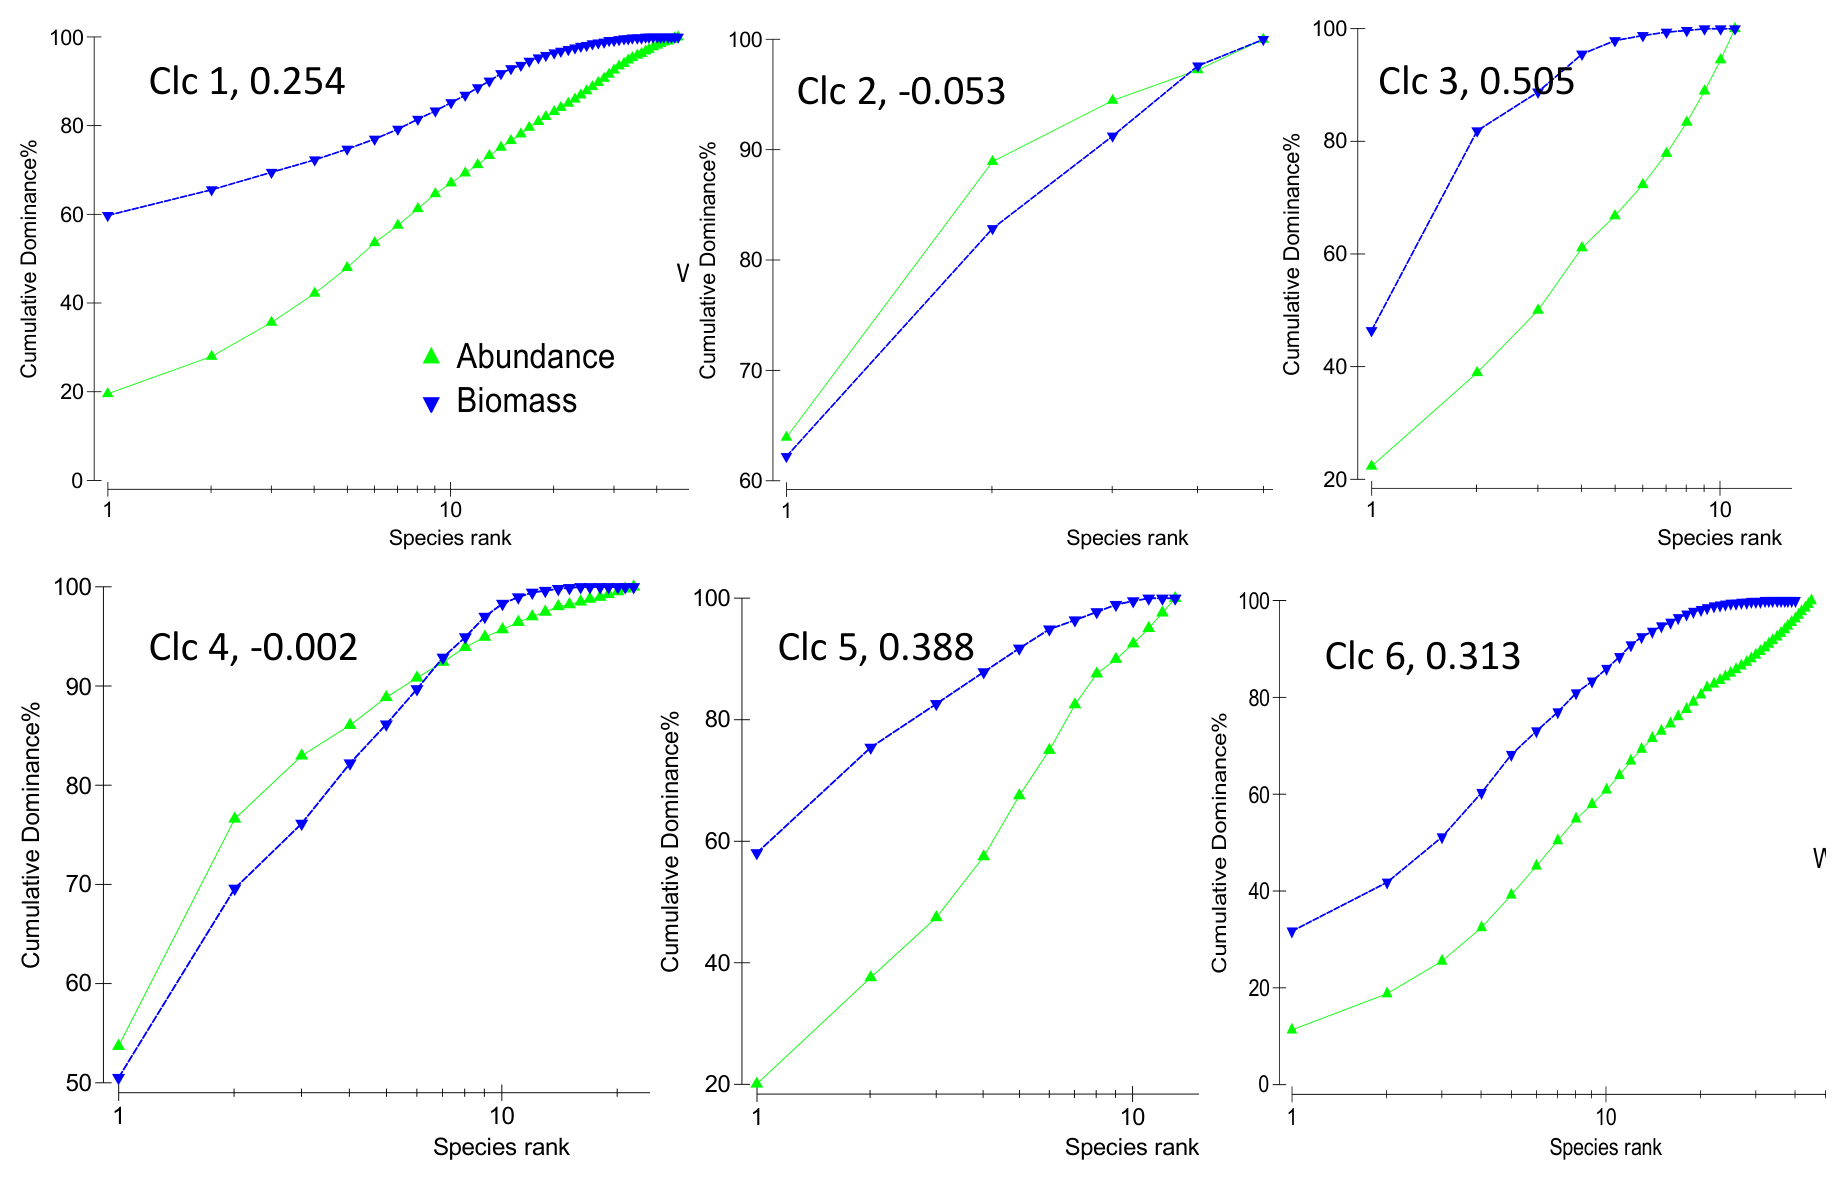
Figure 8.
Rarefaction curves for the clusters estimated in Figure S2a (a), and Figure S2d and control sites (b).
Figure 8.
Rarefaction curves for the clusters estimated in Figure S2a (a), and Figure S2d and control sites (b).
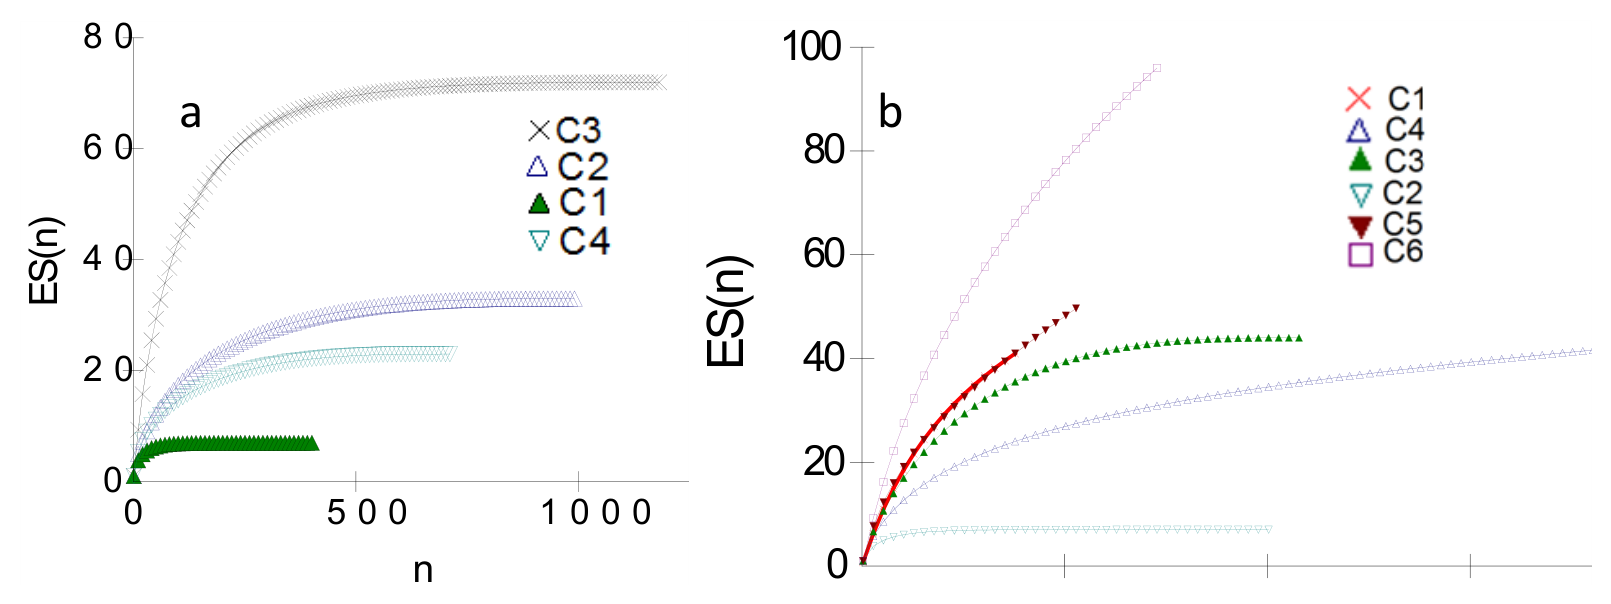
Figure 9.
Designated group distribution by AMBI (a), and M-AMBI and diversity vs number of fish cages (b) and clusters (c) plots (see Table 1 for the corresponding cluster no): Percent dominance of species within each ecological group at stations (a). Fit is solid line, confidence limit is discrete line.
Figure 9.
Designated group distribution by AMBI (a), and M-AMBI and diversity vs number of fish cages (b) and clusters (c) plots (see Table 1 for the corresponding cluster no): Percent dominance of species within each ecological group at stations (a). Fit is solid line, confidence limit is discrete line.
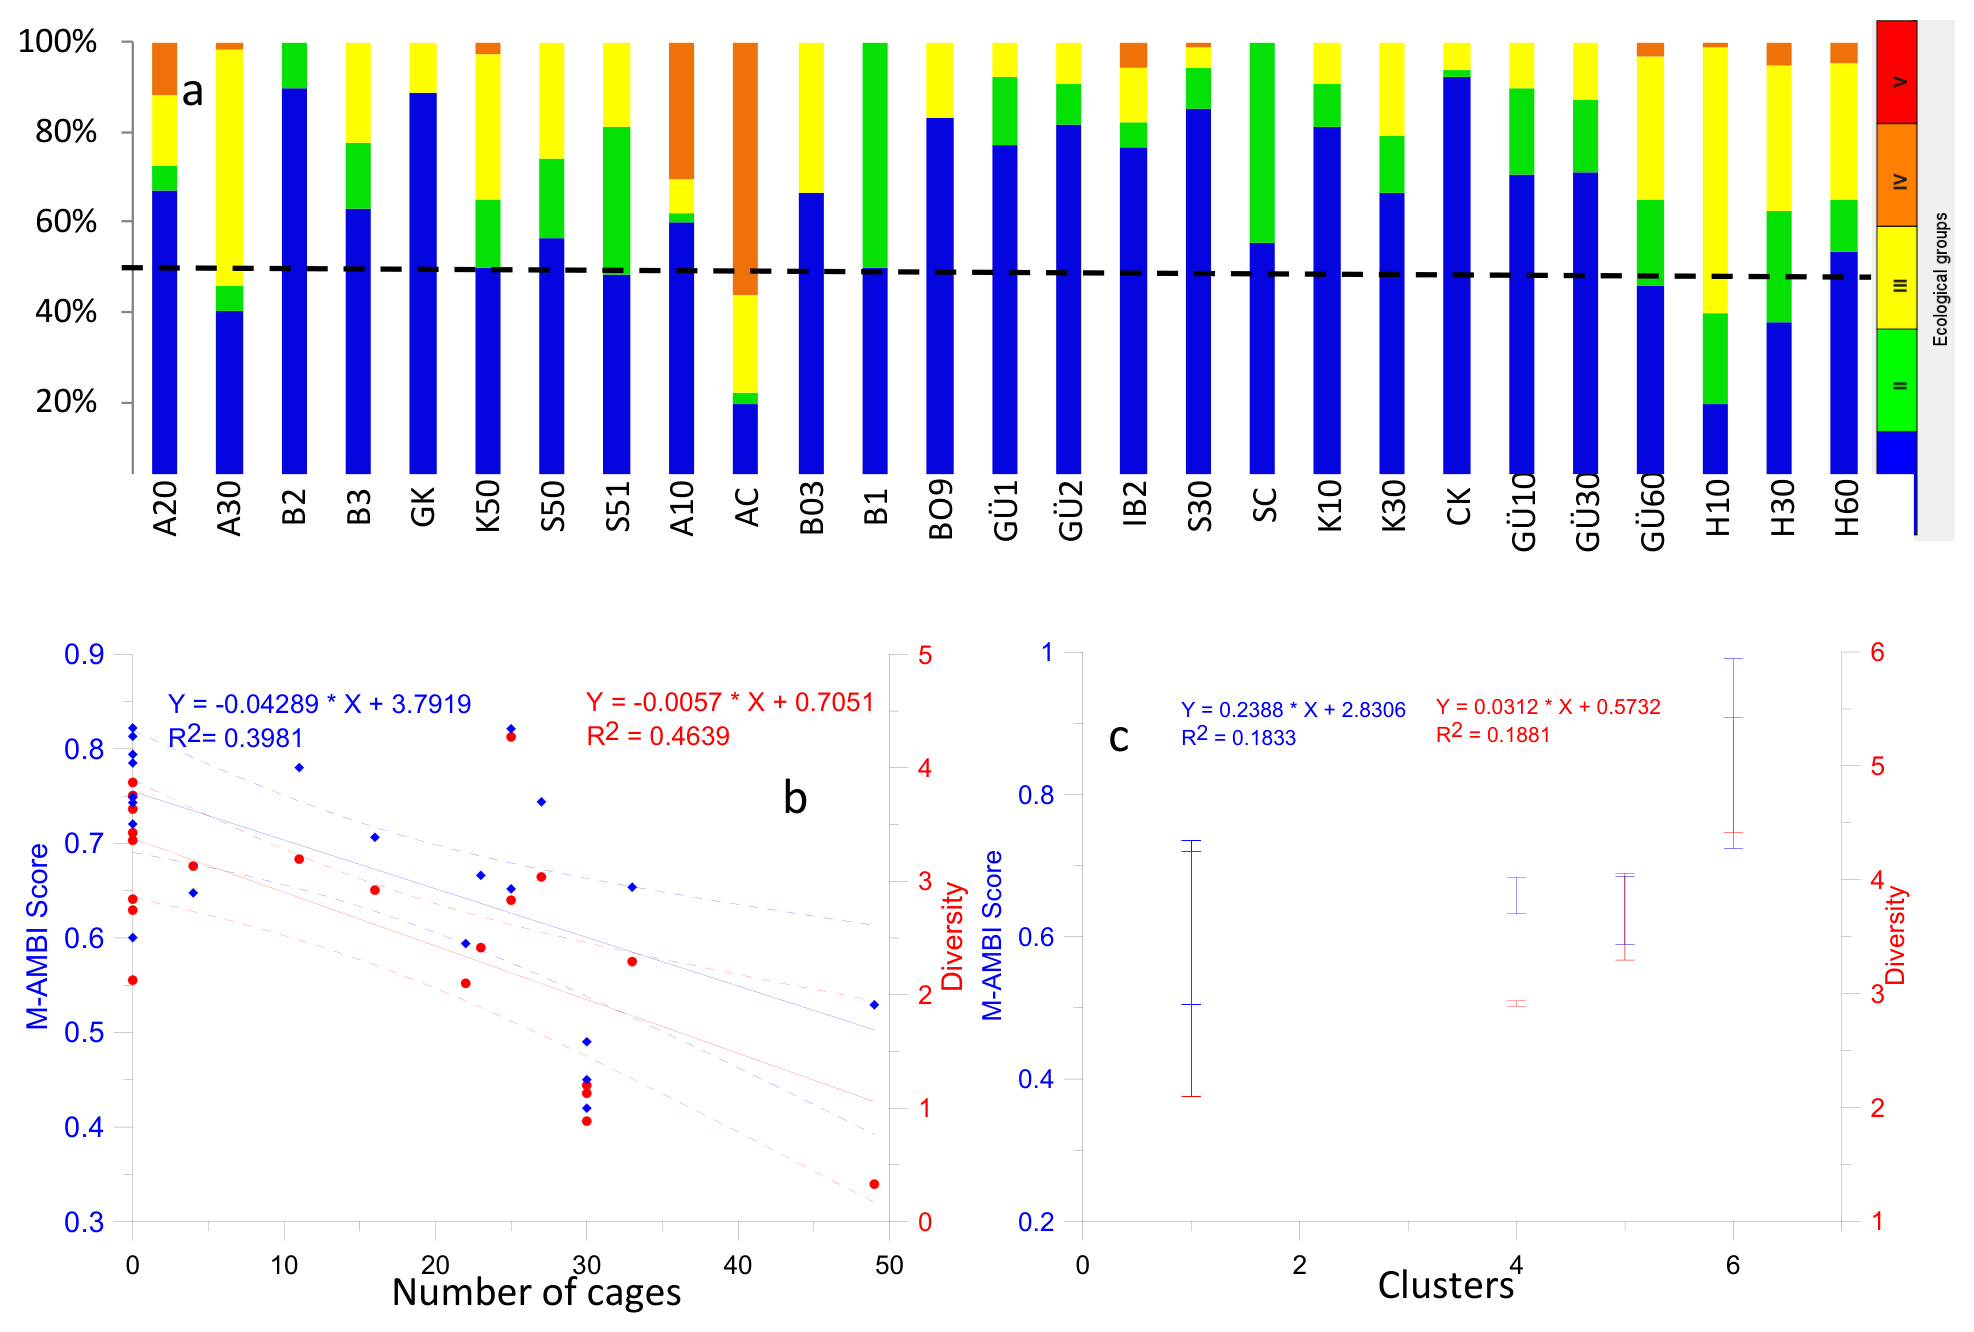
Table 1.
Descriptive information of sampling station (StCd: Station code placed in Figure 1). Cluster: estimated cluster no * in Figure S2a and in Figure S2d, respectively in fish farm site and both control for the statistical analyses, #Cage: Number of fish cages, Depth: bottom depth, DC: Depth code for statistics, Bottom type: Bottom structure and Dist: distance from the nearest coast.
Table 1.
Descriptive information of sampling station (StCd: Station code placed in Figure 1). Cluster: estimated cluster no * in Figure S2a and in Figure S2d, respectively in fish farm site and both control for the statistical analyses, #Cage: Number of fish cages, Depth: bottom depth, DC: Depth code for statistics, Bottom type: Bottom structure and Dist: distance from the nearest coast.
| StCd | Cluster* | Cluster | #Cage | Depth (m) | DC | Bottom Type | Dist (m) |
| Güllük Gulf | |||||||
| GÜ1 | 3 | 1 | 27 | 42 | 60 | Mud | 1536.2 |
| GÜ2 | 3 | 1 | 22 | 26 | 30 | Muddy sand | 85.5 |
| IB | 3 | 1 | 23 | 31 | 30 | Muddy sand | 321.7 |
| SÇ | 3 | 1 | 33 | 37 | 30 | Muddy sand | 1428.3 |
| GK | 1 | 0 | 11 | 10 | Sand | 143.8 | |
| AÇ | 1 | 2 | 49 | 8 | 10 | Sand | 737.8 |
| A0 | 2 | 4 | 25 | 11 | 10 | Sand | 461.6 |
| A1 | 1 | 0 | 16 | 20 | Sand | 2813.9 | |
| A2 | 3 | 0 | 31 | 30 | Mud | 948.7 | |
| SO | 3 | 1 | 25 | 28 | 30 | Mud | 421.4 |
| S1 | 1 | 0 | 40 | 60 | Mud | 1422.8 | |
| S2 | 1 | 0 | 42 | 60 | Mud | 2294 | |
| ÇK | 4 | 4 | 4 | 16 | 10 | Sand | 438.9 |
| K10 | 3 | 1 | 16 | 9 | 10 | Sand | 198.7 |
| K30 | 3 | 1 | 11 | 25 | 30 | Sand | 692.7 |
| K50 | 1 | 0 | 46 | 60 | Mud | 2117.2 | |
| Control | |||||||
| GÜ10 | 6 | 0 | 10 | 10 | Sand | 132.4 | |
| GU30 | 6 | 0 | 30 | 30 | Muddy sand | 365.7 | |
| GÜ60 | 6 | 0 | 54 | 60 | Mud | 5787.9 | |
| Bozburun | |||||||
| BO3 | 3 | 1 | 30 | 56 | 60 | Mud | 202.9 |
| BO9 | 3 | 1 | 30 | 51 | 60 | Muddy sand | 166.9 |
| B1 | 3 | 1 | 30 | 49 | 60 | Mud | 215.4 |
| B2 | 1 | 0 | 45 | 60 | Mud | 151.2 | |
| B3 | 1 | 0 | 51 | 60 | Mud | 141.1 | |
| Control | |||||||
| H10 | 5 | 0 | 11 | 10 | Sand | 437.5 | |
| H30 | 5 | 0 | 24 | 30 | Sand | 1583 | |
| H60 | 5 | 0 | 62 | 60 | Mud | 560.2 |
Table 2.
Faunistic characteristics of crustacean (c) and molluscan species (m) across estimated clusters with the fish farm cage intensity (#Cage±SD; C1: including only fish cages, and C2: all stations sampled in fish farm site) and control sites. Except S, the other variables were given on average only for the entire study area.
Table 2.
Faunistic characteristics of crustacean (c) and molluscan species (m) across estimated clusters with the fish farm cage intensity (#Cage±SD; C1: including only fish cages, and C2: all stations sampled in fish farm site) and control sites. Except S, the other variables were given on average only for the entire study area.
| Entire study area on average | Crustacea | Mollusca | #Cage | |||||||||||||||
| Cluster | S | N | B | d | J’ | H’ | S | N | d | J’ | H’ | S | N | d | J’ | H’ | C1 | C2 |
| 1 | 129 | 2580 | 39.58 | 16.29 | 0.89 | 4.34 | 83 | 1520 | 11.19 | 0.91 | 4.00 | 46 | 1060 | 6.46 | 0.83 | 3.18 | 24.7±6.9 | 14.5±13.5 |
| 2 | 7 | 410 | 4.89 | 1.00 | 0.68 | 1.32 | 2 | 50 | 0.26 | 0.97 | 0.67 | 5 | 360 | 0.68 | 0.62 | 0.99 | 49±0 | 49±0 |
| 3 | 44 | 437 | 1.82 | 7.07 | 0.74 | 2.80 | 33 | 377 | 5.40 | 0.69 | 2.43 | 11 | 60 | 2.44 | 0.94 | 2.25 | 0±0 | 0±0 |
| 4 | 44 | 1710 | 8.02 | 5.78 | 0.62 | 2.34 | 22 | 400 | 3.50 | 0.80 | 2.48 | 22 | 1310 | 2.93 | 0.51 | 1.58 | 14.5±14.9 | 14.5±14.9 |
| 5 | 50 | 1710 | 18.18 | 6.58 | 0.82 | 3.21 | 37 | 1310 | 5.02 | 0.77 | 2.78 | 13 | 400 | 2.00 | 0.90 | 2.32 | ||
| 6 | 96 | 2620 | 21.90 | 12.07 | 0.90 | 4.11 | 51 | 1290 | 6.98 | 0.88 | 3.47 | 45 | 1330 | 6.12 | 0.88 | 3.37 | ||
Table 4.
One- (a, c) and two-way (b) SIMPER analysis to determine contributor within fish farm (F) and control sites (C) (AS: average similarity within the sites, Av. A: log10-transfomed abundance, Av.S: average similarity of the species, S: similarity)/SD (standard deviation of similarity): correction term, and C%: percent cumulative contribution of species) and within the clusters (c). *. is contributor species within fish farm and control sites. # denotes out of digits with large number for the output format of PRIMER.
Table 4.
One- (a, c) and two-way (b) SIMPER analysis to determine contributor within fish farm (F) and control sites (C) (AS: average similarity within the sites, Av. A: log10-transfomed abundance, Av.S: average similarity of the species, S: similarity)/SD (standard deviation of similarity): correction term, and C%: percent cumulative contribution of species) and within the clusters (c). *. is contributor species within fish farm and control sites. # denotes out of digits with large number for the output format of PRIMER.
| A | Av.A | Av.S | S/SD | C% | C | Av.A | Av.S | S/SD | C% |
| F, AS: 12.34 | Clc 1, AS: 10.22 | ||||||||
| *Moerella donacina | 2.01 | 2.36 | 0.65 | 19.09 | *Moerella donacina | 1.53 | 1.88 | 0.54 | 18.42 |
| *Leucothoe oboa | 1.17 | 1.02 | 0.45 | 27.33 | Ampelisca sp | 1.00 | 0.87 | 0.40 | 26.98 |
| *Chondrochelia savignyi | 1.22 | 0.99 | 0.49 | 35.33 | Chondrochelia savignyi | 0.98 | 0.84 | 0.40 | 35.17 |
| Ampelisca sp. | 1.08 | 0.85 | 0.42 | 42.18 | Abra alba | 0.74 | 0.79 | 0.26 | 42.93 |
| Abra alba | 0.88 | 0.80 | 0.30 | 48.63 | Nucula nitidosa | 0.78 | 0.62 | 0.25 | 49.00 |
| Nucula nitidosa | 0.96 | 0.74 | 0.32 | 54.59 | Leucothoe oboa | 0.77 | 0.54 | 0.31 | 54.32 |
| *Loripinus fragilis | 1.06 | 0.64 | 0.41 | 59.76 | Papillicardium papillosum | 0.78 | 0.53 | 0.30 | 59.54 |
| *Liocarcinus maculatus | 0.76 | 0.56 | 0.40 | 64.27 | Liocarcinus maculatus | 0.68 | 0.47 | 0.31 | 64.10 |
| Papillicardium papillosum | 0.70 | 0.42 | 0.28 | 67.66 | Loripinus fragilis | 0.81 | 0.46 | 0.33 | 68.56 |
| Apseudopsis latreillii | 0.89 | 0.35 | 0.27 | 70.53 | Natatolana neglecta | 0.69 | 0.36 | 0.27 | 72.06 |
| C, AS: 15.15 | Clc 4, AS: 38.23 | ||||||||
| *Nucula nitidosa | 1.61 | 2.66 | 0.63 | 17.53 | *Moerella donacina | 5.86 | 8.69 | # | 22.74 |
| *Chondrochelia savignyi | 1.90 | 2.48 | 0.64 | 33.92 | *Loripinus fragilis | 3.54 | 4.33 | # | 34.06 |
| *Apseudopsis latreillii | 1.82 | 2.23 | 0.65 | 48.64 | Abra alba | 2.92 | 3.61 | # | 43.50 |
| *Abra nitida | 1.32 | 1.23 | 0.49 | 56.78 | Leucothoe oboa | 2.45 | 3.07 | # | 51.53 |
| *Haplostylus normanii | 1.25 | 0.86 | 0.41 | 62.44 | Chondrochelia savignyi | 2.35 | 3.07 | # | 59.56 |
| Ampelisca sp. | 0.74 | 0.65 | 0.28 | 66.72 | Liocarcinus maculatus | 1.47 | 2.21 | # | 65.33 |
| Callianassa subterranea | 0.89 | 0.55 | 0.28 | 70.35 | Clc 5, AS: 21.03 | ||||
| B | *Apseudopsis latreillii | 2.59 | 4.89 | 1.02 | 23.23 | ||||
| F, AS: 10.43 | Nucula nitidosa | 1.66 | 3.71 | 0.69 | 40.86 | ||||
| *Moerella donacina | 2.01 | 1.93 | 0.55 | 18.54 | *Ampelisca sp | 1.58 | 3.16 | 0.71 | 55.86 |
| Ampelisca sp. | 1.08 | 0.87 | 0.40 | 26.86 | Harpinia crenulata | 1.20 | 2.09 | 0.50 | 65.81 |
| Chondrochelia savignyi | 1.22 | 0.85 | 0.41 | 35.05 | Callianassa subterranea | 1.43 | 1.70 | 0.51 | 73.91 |
| Abra alba | 0.88 | 0.81 | 0.27 | 42.86 | Chondrochelia savignyi | 1.31 | 0.97 | 0.34 | 78.53 |
| Nucula nitidosa | 0.96 | 0.63 | 0.25 | 48.92 | Clc 6, AS: 19.84 | ||||
| Leucothoe oboa | 1.17 | 0.56 | 0.32 | 54.31 | *Chondrochelia savignyi | 2.42 | 3.88 | 0.98 | 19.55 |
| C, AS: 20.36 | *Haplostylus normanii | 2.36 | 3.24 | 1.08 | 35.88 | ||||
| *Chondrochelia savignyi | 1.90 | 2.61 | 0.69 | 12.80 | Nucula nitidosa | 1.57 | 1.63 | 0.56 | 44.12 |
| Nucula nitidosa | 1.61 | 2.54 | 0.59 | 25.29 | Abra nitida | 1.62 | 1.45 | 0.60 | 51.41 |
| *Apseudopsis latreillii | 1.82 | 2.53 | 0.64 | 37.74 | Loripinus fragilis | 1.68 | 1.30 | 0.59 | 57.94 |
| *Haplostylus normanii | 1.25 | 1.82 | 0.66 | 46.68 | Musculus discors | 1.59 | 1.20 | 0.60 | 63.99 |
| Ampelisca sp. | 0.74 | 1.38 | 0.42 | 53.47 | Papillicardium papillosum | 1.37 | 0.97 | 0.43 | 68.87 |
| Abra nitida | 1.32 | 1.18 | 0.48 | 59.26 | Apseudopsis latreillii | 1.14 | 0.71 | 0.43 | 72.43 |
Disclaimer/Publisher’s Note: The statements, opinions and data contained in all publications are solely those of the individual author(s) and contributor(s) and not of MDPI and/or the editor(s). MDPI and/or the editor(s) disclaim responsibility for any injury to people or property resulting from any ideas, methods, instructions or products referred to in the content. |
© 2026 by the authors. Licensee MDPI, Basel, Switzerland. This article is an open access article distributed under the terms and conditions of the Creative Commons Attribution (CC BY) license (http://creativecommons.org/licenses/by/4.0/).
Copyright: This open access article is published under a Creative Commons CC BY 4.0 license, which permit the free download, distribution, and reuse, provided that the author and preprint are cited in any reuse.