

Submitted:
09 September 2026
Posted:
10 September 2026
You are already at the latest version
Abstract
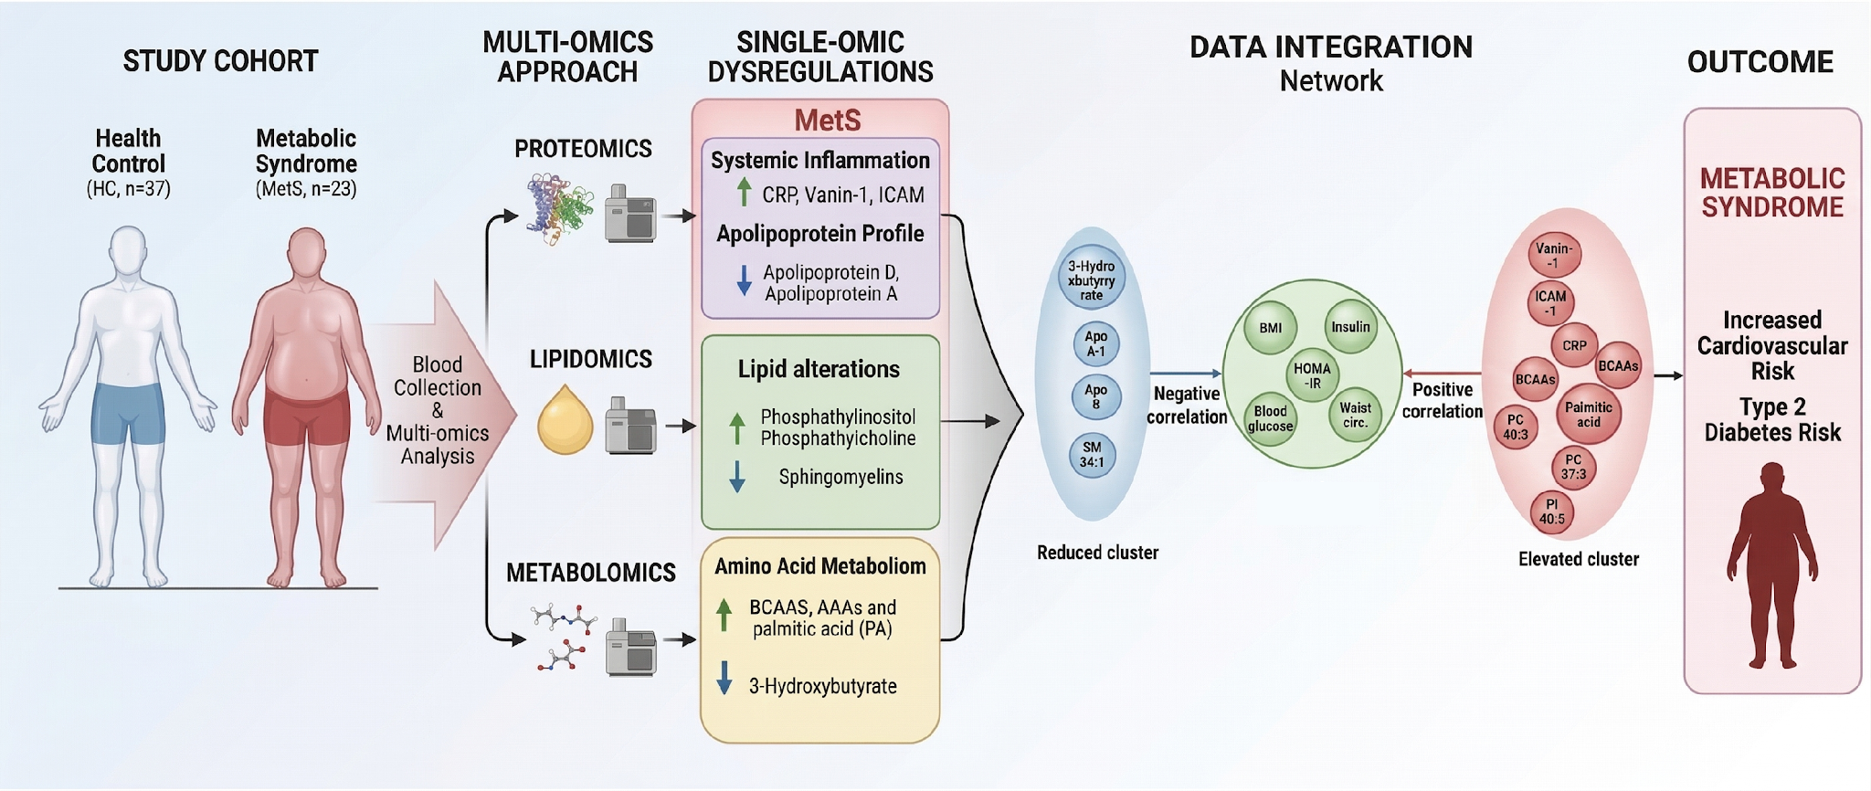
Metabolic Syndrome (MetS) is a complex cluster of metabolic disorders that significantly increases the risk for cardiovascular disease and Type 2 Diabetes Mellitus. This study aimed to elucidate the molecular architecture and systemic burden of MetS by integrating high-resolution plasma proteomics, metabolomics, and lipidomics. A cohort of 60 adult volunteers (n=37 controls; n=23 MetS) from Brazil underwent comprehensive clinical evaluation and multi-omics profiling. Clinical analysis identified HOMA-IR and triglycerides as primary predictors of MetS. Untargeted proteomics identified 589 proteins, with 26 showing significant dysregulation, including the upregulation of Intercellular Adhesion Molecule-1 (ICAM-1) and Vanin-1 and the depletion of protective Apolipoprotein D (ApoD). Metabolomic analysis identified 410 metabolites, with 27 distinct features, revealing an accumulation of branched-chain and aromatic amino acids, alongside a significant reduction in the signaling molecule 3-hydroxybutyrate. Lipidomic profiling identified 1,241 lipids, with 41 abundantly different, highlighting a profound remodeling characterized by the increase of Phosphatidylinositol (PI 40:5) and Phosphatidylcholine (PC) classes and the depletion of Sphingomyelins (SM). Integrative analysis demonstrated that MetS comprises a synchronized and multisystemic molecular disruption rather than a collection of independent risk factors. The homeostatic breakdown is characterized by the depletion of the body's antioxidant and anti-inflammatory defense, and the elevation of pro-inflammatory mediators like ICAM-1 and Vanin-1, the accumulation of lipotoxic drivers and a significant disruption in amino acid catabolism (BCAA) that overactivates the mTORC1 pathway. These findings provide a multifactorial map of metabolic dysregulation, offering a robust molecular signature for early diagnosis and the development of personalized therapeutic strategies to mitigate the systemic burden of metabolic disease.
Keywords:
metabolic disease
; obesity
; multi-omics
; metabolism
; proteomics
; metabolomics
; lipidomics
1. Introduction
The rise of chronic metabolic diseases represents one of the greatest public health challenges of the 21st century, with MetS at the epicenter of this scenario. Defined as a cluster of disorders including visceral obesity, arterial hypertension, hyperglycemia, and dyslipidemia, MetS acts as a robust predisposer for the development of cardiovascular diseases and Type 2 Diabetes Mellitus (T2DM)[1,2]. While MetS is characterized by a state of insulin resistance and low-grade systemic inflammation, T2DM manifests when functional failure of pancreatic β-cells prevents compensation for this resistance, resulting in chronic hyperglycemia and multi-organ damage[3].
Epidemiologically, the global prevalence of MetS has doubled over the last two decades, affecting approximately 1.54 billion adults in 2023[4]. On the American continent, and particularly in developing countries such as Brazil, the prevalence of metabolic syndrome is substantial, reaching 33% of the adult population according to a recent meta-analysis[5].
The economic burden imposed by these conditions is severe and threatens the sustainability of healthcare systems. Globally, diabetes-related expenditures alone exceeded US$1 trillion in 2024, representing approximately 12% of total global health spending[6]. Brazil ranks third worldwide in absolute costs of Diabetes treatment, with an investment of US$45.1 billion in metabolic care in the past year [6]. Within the Brazilian Unified Health System (SUS), the presence of MetS increases treatment costs exponentially; individuals presenting all five components of the syndrome generate healthcare expenses approximately 700% higher than metabolically healthy individuals, largely driven by polypharmacy and specialized medical consultations [7]. Given this impact, a deep understanding of the molecular transition between the healthy state and metabolic dysregulation becomes imperative to enable early diagnosis.
Current methodologies, as high-resolution and multi-omics technologies, enable unprecedented investigation of the pathophysiology of MetS. Proteomics recent meta-analyses have identified a panel of 85 proteins consistently dysregulated in the plasma of patients with T2DM, involved in inflammatory pathways, lipoprotein organization, and immune response. Proteins such as LMAN2, APOA2, PSPA, and DLD, are associated with lipid and glucose metabolism [3]. Ferreira da Silva et al., 2024 and Da silva et al [8,9], 2025 observed a marked reduction in the protein ABCD4 (a lysosomal cobalamin transporter) and DMBT1 relative abundance, in individuals with MetS. Studies using high-sensitivity platforms have demonstrated that integrating 33 proteins into conventional risk models can increase predictive accuracy from 0.77 to 0.88 for T2DM development [10].
Metabolomics and lipidomics complement this molecular landscape by revealing the flux of small molecules and dysregulated lipid species. Elevated levels of branched-chain amino acids (BCAAs: leucine, isoleucine, and valine) are classical markers of insulin resistance, acting through excessive activation of the mTORC1 pathway [11]. Decreased levels of 3-hydroxybutyrate and 5-oxoproline were observed in individuals with MetS [12]. In the lipidomic context, MetS is characterized by a pro-inflammatory state, with the accumulation of phosphatidylinositol being associated with insulin resistance and obesity [13].
The transition toward precision medicine requires multi-omics integration to stratify patients into specific biological subgroups, enabling personalized interventions [14]. The early detection of molecular signatures provides a window of opportunity to mitigate vascular complications and reduce the human and financial burden imposed by MetS and T2DM [14,15].
In previous studies, we evaluated proteo-metabolomic profiles of individuals stratified by body mass index and metabolic health status (normal weight, overweight, obesity, and metabolic syndrome - MetS), in a Brazilian population [12]. In the present work, we expanded this investigation by adding lipidomics evaluation of plasma samples, by improving the MetS case group composition and focusing on a direct comparison against healthy controls.. Originally, the case group included only volunteers with MetS according to clinical criteria. However, patients with Type 2 Diabetes Mellitus (T2DM) were also analyzed and presented molecular signatures similar to the Metabolic Syndrome cohort, and then they were integrated into the MetS group, expanding the pathophysiological scope of the study.
2. Materials and Methods
2.1. Experimental Design
This study recruited 60 adult volunteers (≥ 18 years old) residing in Rio de Janeiro State, Brazil. This research was approved by the Ethics Committee in Human Research at Unigranrio, RJ, Brazil (approval number: 3,402,791) and was conducted following the ethical principles outlined in the Declaration of Helsinki (1964) and its subsequent amendments. All participants provided written informed consent prior to enrollment. Following a 12-h overnight fast, morning blood collection was performed in a clinical laboratory at the Afya-Unigranrio University, Duque de Caxias, RJ [12]. Participants were categorized into: control group, without MetS (n=37); and case group with MetS (n=23). MetS was determined according to the NCEP/ATPIII protocol [15]. Volunteers must have at least 3 criteria established by the protocol to be characterized as with MetS [12]. Homoeostasis model assessment of insulin resistance (HOMA-IR) and β-cell function (HOMA-β) were conducted to supplement the clinical data associated with MetS [17,18]. Of the 23 volunteers with MetS, 11 have a diagnosis of T2DM.
2.2. Clinical Evaluation
Clinical examinations were performed following established protocols[9,18]. The survey included BMI, height, weight, waist circumference, hip circumference, and waist-hip ratio, blood pressure evaluation using the oscillometric method (OMRON 7320) and biochemical blood analysis. Measurements with discrepancies exceeding 10 mmHg for systolic pressure or 5 mmHg for diastolic pressure were discarded to minimize errors [19]. Additionally, HOMA-IR and HOMA-β were calculated using previously described formulae [17,16].
2.3. Sample Processing
Plasma samples were obtained following established protocolsBriefly, 5 mL of whole blood was collected intravenously after a 12-h fast in EDTA-containing tubes (Vacuplast EDTA K3) to prevent coagulation and stored at −80°C. For protein purification, 50 μL aliquots of plasma were depleted of albumin and immunoglobulins using ProteoPrep Blue Albumin & IgG Depletion columns (Sigma-Aldrich) and eluted proteins were concentrated with Amicon Ultra-0.5 mL 3KD filter devices (Millipore Corporation). Total protein concentration was determined using the Bradford method.
2.4. Protein Processing for Mass Spectrometry
For mass spectrometry, 10 μg of proteins was subjected to an in-solution digestion protocol [20]. Protein complexes were denatured with 0.2% RapiGest Waters, USA) at 80°C for 15 min, followed by reduction with 100 mM DTT at 60°C for 30 min and alkylation with 300 mM iodoacetamide at room temperature for 30 min. Trypsin digestion was then performed overnight at 37°C with a 1:100 (w/w) enzyme-to-protein ratio using sequencing grade modified trypsin (Promega). The reaction was quenched with 5% (v/v) trifluoroacetic acid (TFA) at 37°C for 90 min to hydrolyse RapiGest. Finally, the peptides were desalted using ZipTip C18 columns (Millipore Corporation) and resuspended in 0.1% TFA solution in (50%) acetonitrile (ACN) 70 μL, that was lyophilizated.
2.5. Peptidomes Analysis by MS and Protein Identification
Spectrometry Mass spectrometry (MS) analysis was performed using a nanoElute nanoflow chromatography system from Bruker Daltonics (Bremen, Germany) coupled online to a hybrid trapped ion mobility spectrometry-quadrupole time-of-flight mass spectrometer (timsTOF Pro) from Bruker Daltonics. Mass spectrometry analysis of the samples and protein identification were performed according to previously described protocols [10].
MS raw data were processed using MaxQuant software version 2.4.0.0, specifically designed for mass spectrometry-based protein analysis [21]. The Andromeda search engine integrated into MaxQuant was employed [22]. The default configuration for data acquired on the TimsTof Pro mass spectrometers was utilized. The fragment ion mass tolerance was set to 0.5 Da. Enzyme specificity was trypsin with a tolerance for peptides with up to two undigested cleavage sites. Methionine oxidation (15.994,915 Da) and N-terminal protein acetylation (42.010565 Da) were defined as variable modifications, while cysteine carbamidomethylation (57.021464 Da) was defined as a fixed modification. The minimum peptide length was 7 amino acids. The peptide and protein false discovery rates (FDRs) were set to 1%. Additionally, at least one unique peptide was required for protein identification. Following this data processing step, relative abundance values for all identified proteins were obtained. The database used was the UniProt reviewed Homo sapiens database, downloaded in 09/11/2023 with a total of 20,436 proteins available (https://www.uniprot.org/uniprotkb?query=humanþANDþ%28taxonomy_id%3A9606%29&facets=reviewed%3Atrue).
Perseus software version 2.0.9.0 [23] was employed for filtering the proteomics results. Proteins identified by only a modification site, as well as those identified by the reverse database and potential contaminants, were excluded from further analyses. Subsequently, an R programming language script (https://www.R-project.org/) was used to refine the filter based on the percentage of protein presence in the groups and normalize the data by the total ion count (TIC).
2.6. Extraction of Plasma Metabolites
Metabolites were extracted using a 1:2 sample:extract solution ratio: 400 μL of ice-cold extraction mixture (acetonitrile:methanol, 1:1, v:v) in 200 μL sample. After agitation for 5 min, the samples were centrifuged (Eppendorf, Germany) at 15,000 x g for 10 min at 4°C for deproteinization. The supernatant fractions were then collected and evaporated to dryness using a vacum concentrator (Concentrator plus, Eppendorf). The resulting dried residues were resuspended in 200 μL of methanol:water (4:1), vortexed, and centrifuged again at 15,000 x g for 10 min at 4°C, and again the supernatant fractions were collected and evaporated to dryness.
2.7. Mass Spectrometry Analysis of Plasma Metabolites
For GC-MS analysis, a 100 μL aliquot of the metabolite sample was transferred to glass vials (1.5 mL) and lyophilized. Metabolite derivatization was performed according to previously described protocols [12]. In the following step, the sample was derivatized. For derivatization, 30 μL of methoxyamine (15 mg mL-1) in pyridine was added, agitated for 1 min, and then incubated for 16 h at room temperature in the dark. Silylation was performed by adding 30 μL of MSTFA (N-methyl-trimethylsilyl-trifluoroacetamide) with 1% TMCS (trimethylchlorosilane). Samples were left to stand for 1 h in the dark. Subsequently, 30 μL of Heptane was added. At this stage, a series of alkanes (C12–C40) was used, which allowed the calculation of retention time.
The derivatized samples were automatically injected (1 μL) in splitless mode into a gas chromatograph (8890 GC Agilent Technologie), equipped with a DB-5 20 m long x 0.18 mm internal diameter x 0.18 μm film fused silica column (Agilent J&W Scientific). The injection temperature was 280°C, with a flow rate of 20 mL min-1, initiated after 300 s of data acquisition, with the initial temperature of the first column being 80°C, held for 2 min and increased 15°C/minutes until reaching 305°C, then this temperature was held for 2 min. The column efluente was introduced into the ion source of the GC-TOFMS equipment (Pegasus BT, Leco, St. Joseph). The ion source temperature was 250°C, electron beam 70-eV, ionization current of 2.0 mA and 20 spectra s-1 were recorded in the range of 45– 800 m/z, and the detector voltage was 1500 V.
The GC-MS data were processed using the ChromaTOF for BT software, version 1.2.0.6, in which baseline correction, deconvolution, retention index (RI) acquisition, retention time (RT) correction, peak identification and alignment were performed, and metabolite identification was performed by using the NIST library, version 2.4 (year 2020). Only metabolites with three or more characteristic masses and a score equal to or greater than 800 were considered valid.
2.8. Plasma Lipid Extraction
Plasma lipid extraction was performed using the Bligh and Dyer methodBriefly, 50 µL of plasma was used as the starting material. Subsequently, 250 µL of methanol pre-cooled to −40 °C, 150 µL of water, and 250 µL of chloroform were added. The mixture was then centrifuged for 5 min at 16,000 × g at 4 °C to promote phase separation. Following centrifugation, the lower organic phase containing the lipid fraction was carefully collected and dried under a gentle stream of nitrogen gas.
2.9. Plasma Lipidome Analysis
Dried lipid extracts were resuspended in 100 µL of chloroform:isopropanol (1:4, v/v). For positive ionization mode analysis, samples were further diluted 100-fold in the same solvent, whereas for negative mode analysis, samples were injected without dilution. Liquid chromatography–mass spectrometry (LC–MS) analysis was performed using a Nexera X2 UHPLC system (Shimadzu) equipped with a Zorbax Eclipse XDB-C18 column (50 × 4.6 mm, 1.8 µm particle size; Agilent) and coupled to a Maxis Impact ESI-QTOF mass spectrometer (Bruker Daltonics).
Chromatographic separation was performed using a binary gradient system consisting of mobile phase A (5 mM ammonium acetate, pH 5, in water for negative mode or 0.1% formic acid in water for positive mode) and mobile phase B (isopropanol). The gradient program was as follows: 0–1 min, 10% B; 1–10 min, linear increase to 80% B; 10–25 min, held at 80% B; 25–27 min, returned to 10% B; and 27–35 min, maintained at 10% B for column re-equilibration. The column temperature was maintained at 50 °C, with a constant flow rate of 0.3 mL/min.
Mass spectrometric detection was performed using the Maxis Impact ESI-QTOF instrument equipped with an electrospray ionization source under the following conditions: nebulizer gas pressure of 5 bar, drying gas flow of 8 L/min, drying temperature of 220 °C, capillary voltage of 4500 V, and end plate offset of 800 V. Mass spectra were acquired in both positive and negative ion modes over an m/z range of 100–2000 at an acquisition rate of 1.33 Hz using a data-dependent acquisition (DDA) strategy. For each acquisition cycle, the five most intense precursor ions were selected for MS/MS fragmentation using stepped collision energies of 30 and 60 eV. Pooled quality control (QC) samples from each experimental group were also analyzed to support lipid identification based on MS/MS fragmentation patterns.
Data processing was performed using MZmine version 4.9 [25]. The workflow included noise detection, Chromatogram building, Chromatograms smoothing, Feature resolving, 13C isotope filter, Feature alignment and Lipid.
2.10. Statistical Analysis
The Kolmogorov-Smirnov normality test assessed data distribution, with significant differences investigated using t-tests or chi-squared tests. The statistical analyses of the proteomic and metabolomics data were performed with the online MetaboAnalyst 6.0 program (http://www.metaboanalyst.ca/MetaboAnalyst/). For clinical data, statistical analyses were conducted within the R environment. Proteins and metabolites were filtered to remain in the abundance matrix only if they had values greater than zero in at least 50% of the samples in at least one of the groups. Quantitative analysis was performed one-way T test with MetaboAnalyst 6.0 to identify statistically significant diferences (p < 0.05) in normalized abundance between groups. MetaboAnalyst 6.0 was also utilized for Partial Least Squares-Discriminant Analysis (PLS-DA) and Pattern Hunter (PH) analyses to identify group differences. Pearson's correlation analysis performed through PH categorized associations as moderately correlated (0.5–0.7), highly correlated (0.7–0.9), or very highly correlated (0.9–1.0) [26]. The corrplot package (version 0.92) facilitates correlation analysis between proteins and clinical data [27].
Enrichment analyses of the proteomics, metabolomics, and lipidomics datasets were conducted using bioinformatics platforms [28,29,30]. Functional enrichment of differentially expressed proteins was performed using the Enrichr platform (https://maayanlab.cloud/Enrichr/). Metabolomic pathway enrichment and topology analyses were carried out using MetaboAnalyst 6.Lipidomic enrichment and lipid class analysis were performed using LipidSig 2.0 (https://lipidsig.bioinfomics.org).
To identify key features differentiating groups, two multivariate classification algorithms were employed: PLS-DA with VIP (variable importance in the projection) score and Random Forest [31]. Random Forest predicts disease risk based on patient characteristics and identifies the most relevant features (proteins and metabolites in this case) for sample classification [32,33,34]. In PLS-DA, VIP scores ≥ 1 indicate important variables [35]. To run the performance model, the mixOmics package version 6.26 were used, resulting in Receiver Operating Characteristic curves (ROC), confusion matrices, and error rates for plasma protein and metabolite analyses to confirm Random Forest results [36]. We evaluated the model's performance via 10-fold cross-validation, repeated 10 times. In each iteration, we fit a block.splsda model using the pre-specified from our final object on cross-validated samples and then measure the prediction accuracy on the held-out samples. Significance Analysis of Microarrays (SAM) was used to assess the robustness of the proteomics and metabolomics data. Cross-validation was used to assess the generalizability of a predictive model.
3. Results
3.1. Demographic and Clinical Evaluation
The demographic and clinical characteristics of the participants are summarized in Supplementary Table The Kolmogorov–Smirnov normality test confirmed that the variables followed a normal distribution. Overall, statistically significant differences were observed between the control group and the MetS group, such as age, blood pressure values, triglycerides, HDL and VLDL-cholesterol, and LDL-cholesterol, besides parameters directly associated with the MetS diagnosis and pathology (BMI, waist and hip measurement, glycemia and HOMA-IR). Individuals in the MetS group exhibited reduction in HDL-cholesterol levels along with a characteristic increase in the other parameters cited before.
Correlation analysis (Supplementary Table S2 and Supplementary Figure S1A) further supported the association between these variables and the clinical phenotype. HOMA-IR showed the strongest positive correlation, followed by triglyceride levels and waist circumference. In contrast, HDL-cholesterol demonstrated a significant negative correlation, reinforcing its reduction as an important marker of the altered metabolic profile. To identify the clinical parameters that best discriminate between groups, a machine learning analysis using a Random Forest algorithm was performed (Supplementary Table S3 and Figure 1A). The Mean Decrease Accuracy results indicated that HOMA-IR was the most important predictive variable for group classification, followed by triglycerides, VLDL, and age.
3.2. Plasma Proteomic Profiles
An untargeted, gel-free quantitative mass spectrometry approach was employed to characterize the proteome and metabolome. This strategy enabled the identification of 589 plasma proteins (post-filtering process), of which 26 showed significant differences in abundance between the studied groups (Supplementary Table S4). To characterize the proteomic profile that differentiates MetS from the control group, supervised partial least squares-discriminant analysis (PLS-DA) was employed. The score plot revealed a robust and distinct separation between the two cohorts along the primary components (Supplementary Figure S2A). The model demonstrated high predictive performance and reliability (R2 0.91972 and Q2 0.89295), as evidenced by cross-validation metrics reaching an accuracy of 0.967 for two components. This group segregation was statistically validated by PERMANOVA, which indicated a significant difference in protein profiles between the groups (F=81.424,R2=0.584,p=0.001). To identify potential outliers across the datasets, Principal Component Analysis (PCA) was performed on proteins. The proteomic profile (Supplementary Figure S3A) demonstrated robust group separation along the first principal component, showing only one outlier. Complementary machine learning analysis using Random Forest further corroborated these findings, yielding a low out-of-bag (OOB) error of 0.Variable importance analysis, based on Mean Decrease Accuracy (MDA), identified a consensus panel of highly discriminatory proteins. Specifically, Scavenger receptor cysteine-rich type 1 protein M130, Xaa-Pro dipeptidase and Proteoglycan 4 emerged as the top contributors to the classification accuracy, as the Immunoglobulin kappa variable 1D-13 and Intercellular adhesion molecule 1 (Supplementary Table S5 and Figure 1).
Pearson correlation coefficients were utilized to evaluate the association between individual protein expression and the MetS phenotype. Several proteins exhibited strong positive correlations with the syndrome (Supplementary Figure S1B). Notably, Scavenger receptor cysteine-rich type 1 protein M130, Proteoglycan 4, and Intercellular adhesion molecule 1 showed the most significant associations, suggesting a coordinated upregulation of these features in the MetS cohort (Supplementary Table S6). To evaluate the predictive performance of the model based on proteomic signatures, a Receiver Operating Characteristic (ROC) curve analysis was performed. Even with only two variables, the model demonstrated robust performance, achieving an Area Under the Curve (AUC) of 0.908 (95% CI: 0.789–1.000). As model complexity increased to 26 variables, with the AUC increasing to 0.997 (95% CI: 0.974–1.000). These results indicate that the proteomic signature is highly effective in discriminating healthy individuals from patients with MetS, with only marginal error rates (Supplementary Figure S4A).
Finally, to resolve the biological pathways represented by the differentially expressed proteins, we performed a Reactome pathway enrichment analysis. The results indicated that the discriminatory proteomic signature is heavily centered on innate and adaptive immunity. The "Complement Cascade" and "Regulation of Complement Cascade" were the most significantly enriched terms, involving key proteins such as CRP, C7, CFHR2, and C4BPA (Supplementary Figure S5 Supplementary Table S7).
3.3. Plasma Metabolomic Profiles
A total of 410 metabolites were identified in plasma samples, of which 27 exhibited differential abundance between the study groups (Supplementary Table S8). PLS-DA analysis revealed a robust separation between the two groups (Supplementary Figure S2B), exhibiting high predictive power and explanatory capacity (R2 0.94582 and Q2 0.91951), with cross-validation metrics yielding an accuracy 0.98571 for the two-component model. The statistical significance of this separation was further validated by PERMANOVA (F-value = 40.058; R2 = 0.408; p = 0.001). Random Forest analysis yielded an OOB error of 0.The top Random Forest variable importance measures, where Cholest-4-en-3-ol and L-Isoleucine display the highest MDA scores of 0.178 and 0.063, respectively (Figure 1C and Table 9). Metabolomic performance was assessed by ROC curves, which indicated high sensitivity and specificity for the identified metabolic signatures (Supplementary Figure S4B). Potential multivariate outliers were evaluated using PCA. The metabolomic data (Supplementary Figure S3B), distinct group clustering was achieved; however, a single sample from the MetS group positioned itself as a marginal outlier at the far right of the x-axis
Correlation analysis established distinct metabolic patterns associated with the MetS phenotype. Stearic acid and palmitic acid showed the strongest positive correlations with the clinical condition. Significant associations were also observed for amino acids, specifically L-tyrosine, L-tryptophan and phenylalanine (Supplementary Table S10 and Supplementary Figure S1D). In contrast, 3-hydroxybutyric acid showed a negative correlation pattern. Quantitative Enrichment Analysis mapped these metabolic alterations to several pathophysiological pathways. The most significant enrichment was observed for Late-onset preeclampsia and Obesity. Other highly enriched pathways included 2-ketoglutarate dehydrogenase complex deficiency, colorectal cancer, and sepsis (Supplementary Table S11 and Supplementary Figure S6).
3.4. Plasma Lipidomic Profiles
A total of 1,241 lipids were identified in plasma samples, of which 41 showed differential abundance between the study groups (Supplementary Table S12). PLS-DA revealed a robust separation between the two groups along the first two principal components (Supplementary Figure S2C). The predictive performance of the model was validated through cross-validation, yielding high accuracy (0.947, R2 0.89821 and Q2 0.82011). The statistical significance of this separation was further confirmed by PERMANOVA (F-value: 30.404; R-squared: 0.34392; p-value), indicating distinct lipidomic signatures between the control and MetS groups. PCA was applied to the data to screen for multivariate outliers. The lipidomic profile (Supplementary Figure S3C) showed the highest within-group variance, reflecting a highly heterogeneous molecular distribution. Nonetheless, all samples clustered largely within their 95% confidence intervals, indicating that this dispersion represents intrinsic biological diversity rather than technical anomalies.
Random Forest classification was employed to identify the most discriminative lipid species, achieving an overall OOB error rate of 0.Analysis of the MDA identified PI 40:5 as the most influential feature for group discrimination, followed by Cer 32:0; O2 and FA 36:4 (Supplementary Table S13 and Figure 1D). Correlation pattern analysis further delineated the relationship between specific lipid species and the metabolic phenotype. PI 40:5 exhibited the strongest positive correlation with the MetS group, followed by Cer 32:0; O2 and BMP 34:1 (Supplementary Table S14 and Supplementary Figure S1D). Lipidomics performance was evaluated by ROC curves, demonstrating high sensitivity and specificity (Supplementary Figure S4C).
Lipidomic profiling of the MetS group, revealed a profound remodeling of the lipid landscape compared to the control group. Quantitative assessment of class indicated a significant raise of the Phosphatidylcholine and Phosphatidylinositol in the experimental group. Conversely, a marked and highly significant depletion was observed in Sphingomyelin (Supplementary Figure S7A). Subcellular distribution analysis further characterized the possible localization of these lipidomic shifts across cellular components. The case group was characterized by a significant increase in lipidic pathways associated with the mitochondria, while there was a significant decrease in lipid content across multiple other organelles. Specifically, significant reductions were observed in the endosome/lysosome and golgi apparatus (Supplementary Figure S7B).
3.5. Multi-Omics Evaluation
To evaluate the capacity of plasma molecular signatures to discriminate biological profiles and validate the experimental design, an unsupervised K-means clustering algorithm (k = 2) was applied across the proteomics, metabolomics, and lipidomics layers. The results revealed a robust and clear separation between healthy controls and the metabolic dysfunction group across all omics data, with metabolomics displaying the highest spatial segregation power (PC1 of 63.5), followed by proteomics (PC1 of 51.2) and lipidomics (PC1 of 22.3%). Crucially, patients with T2DM and MetS clustered cohesively and indistinguishably from individuals presenting with MetS alone. This convergence confirms that both subgroups share a highly complex inflammatory and metabolic phenotype, statistically validating their consolidation into a single "case" group against healthy controls (Figure 2).
To delineate the molecular scenario related to MetS, we integrated proteomic, metabolomic, and lipidomic datasets within a comprehensive multi-omics framework. PLS-DA of the combined datasets revealed a clear separation between the Control and MetS cohorts, demonstrating a high classification performance (Supplementary Figure S8). Hierarchical clustering analysis, further delineated the differences between the groups, revealing distinct molecular clusters associated with MetS status (Figure 1D). The multi-omics heatmap further highlighted specific protein markers that were co-clustered with metabolic and lipid signatures, suggesting a coordinated systemic response in individuals with MetS.
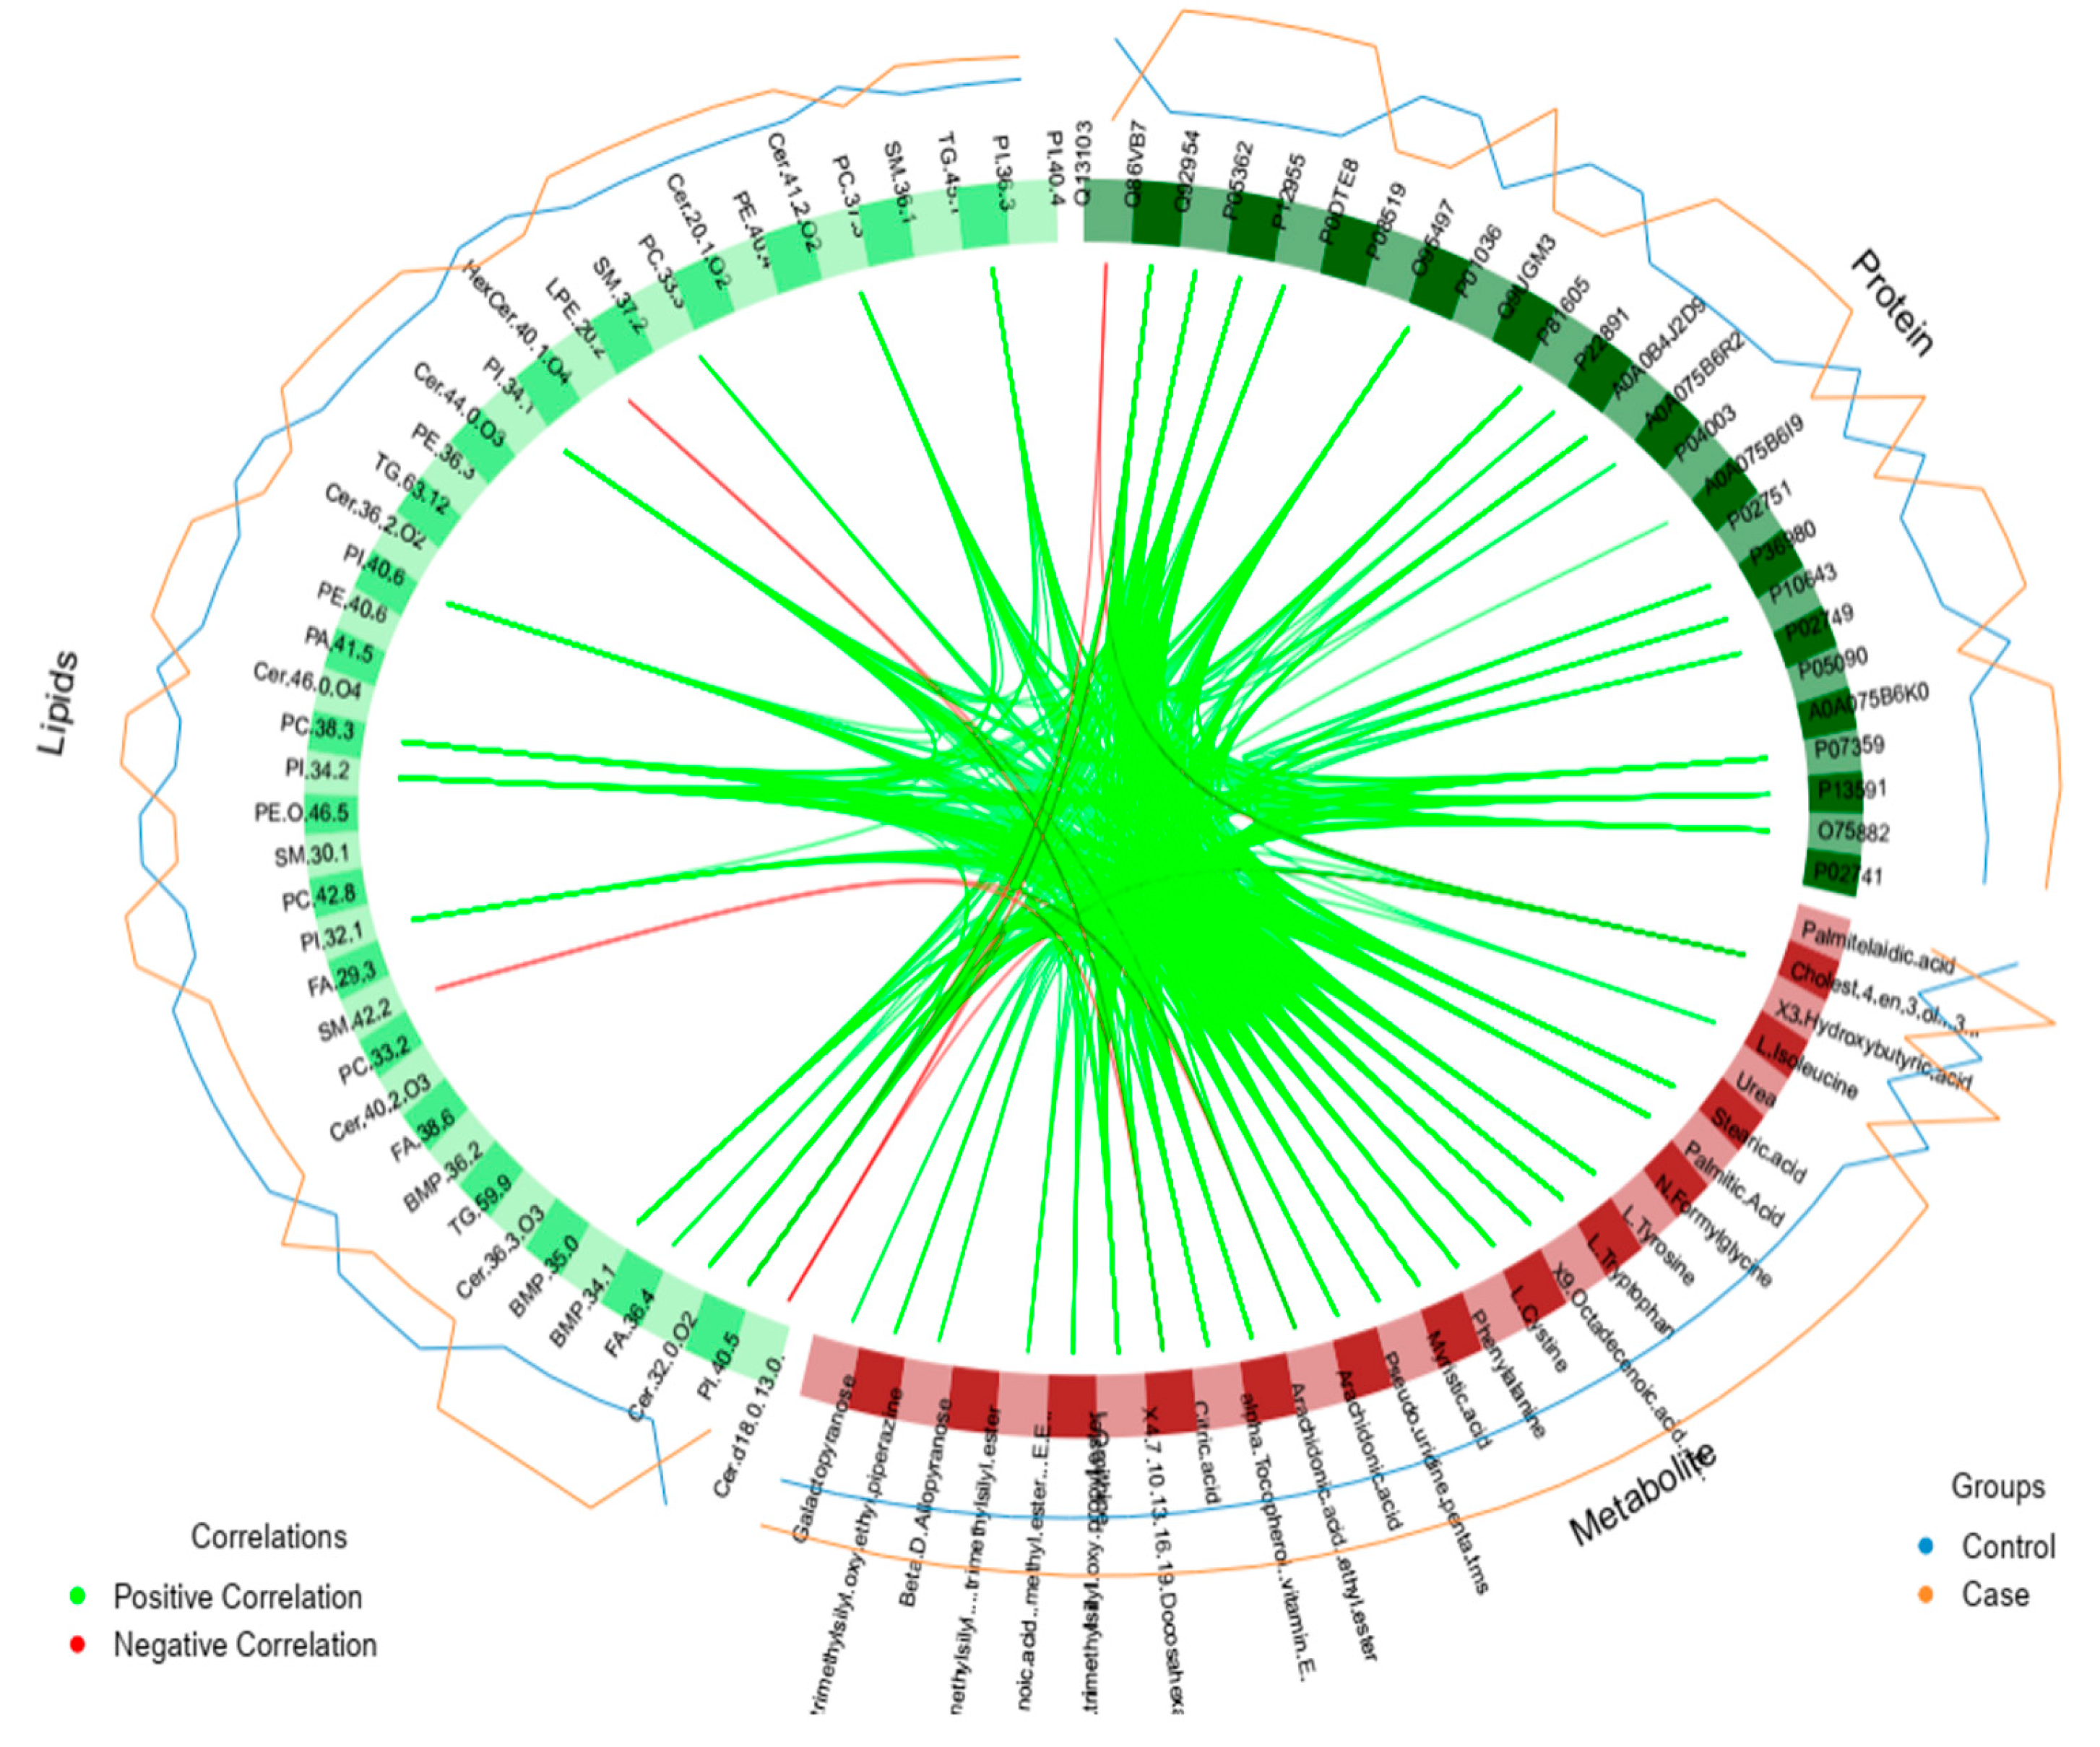
Interactive analysis, integrating proteomics, metabolomics, and lipidomics data, also reveals a highly interconnected molecular portrait that distinguishes the MetS from healthy profiles. The integrated network consists of 107 nodes, including 26 proteins, 27 metabolites, and 41 lipids, just as 13 clinical phenotypic markers (Supplementary Table S15, Figure 3, Supplementary Figure S9).
A central "metabolic syndrome cluster" was identified, characterized by strong positive correlations with BMI, HOMA-IR and triglycerides. Within this cluster, the phosphatidylinositol species PI.40.5 emerged as a primary lipid hub, demonstrating a robust association with insulin resistance. This lipid node was significantly connected to several metabolic markers, particularly amino acids; the strongest inter-omics correlations were observed between PI.40.5 and L-Cystine, Phenylalanine, and L-Tryptophan. Saturated fatty acids, including Stearic acid and Palmitic acid, showed high positive correlations with BMI, further defining the dysmetabolic signature.
Considering proteins, Intercellular adhesion molecule 1 (ICAM-1, P05362) and Scavenger receptor cysteine-rich type 1 protein M130 (Q86VB7) were central inflammatory hubs. ICAM-1 exhibited strong positive associations with both BMI and HOMA-IR, and was highly correlated with several amino acids, such as L-Cystine and Phenylalanine. Similarly, CD163 showed significant connectivity with insulin resistance and triglycerides, suggesting a synchronized activation of inflammatory and metabolic pathways.
To evaluate the contribution of proteins, metabolites, and lipids to diagnostic performance, we developed a series of hypotheses on MetaboAnalyst program that systematically incorporate these molecular features into a baseline model comprising the five most informative clinical variables. We first established a baseline model (Model 1) comprising five conventional clinical variables (HOMA-IR, Blood Glucose, Triglycerides, VLDL, and Age). While Model 1 provided foundational classification performance, it exhibited significant overlap in class prediction probabilities (Supplementary Figure S10A). The confusion matrix highlighted major limitations, with a substantial number of false negatives (n=10) and false positives (n=9), underscoring that traditional markers alone are insufficient for high-resolution patient stratification.
The integration of the proteomic layer (Supplementary Figure S10B–E) yielded incremental improvements. The synergistic effect was most pronounced in Model 5 (Intercellular Adhesion Molecule-1, Vanin-1 and Apolipoprotein D), which significantly reduced misclassification compared to the clinical-only model. Similarly, the addition of metabolites (Supplementary Figure S10F-G and Figure S11A-B) and lipid species (Supplementary Figure S11C-F), specifically phosphatidylinositols (PI), phosphatidylcholines (PC), and sphingomyelins (SM), markedly refined model specificity. Model 13 (Supplementary Figure S10F) emerged as a high-performing classifier, achieving a sharp reduction in total errors.
The most robust performance was achieved by the Integrated Global Model (Supplementary Figure S11G), which combined clinical data with selected protein, metabolite, and lipid signatures (Intercellular Adhesion Molecule-1, Vanin-1 and Apolipoprotein D, Palmitic Acid, 3-Hydroxybutyric acid, L-Isoleucine, L-Tryptophan, L-Tyrosine, Phenylalanine, PI 32:1, PI 34:1, PI 34:2, PI 36:3, PI 40:4, PI 40:5, PI 40:6, PC 33:2, PC 33:3, PC 37:3, PC 38:3, PC 42:8, SM 30:1, SM 36:1, SM 37:2 and SM 42:2). This model demonstrated near-perfect class separation in prediction probability plots, with samples sharply segregated. These findings demonstrate that a multi-omics architecture bridges the informational gaps of individual platforms, providing a high-fidelity diagnostic tool for Metabolic Syndrome.
4. Discussion
Apolipoprotein D (ApoD), a glycoprotein and a prominent member of the lipocalin family, functions as a critical multi-ligand transporter and a key mediator of systemic lipid homeostasis and antioxidant defense [37]. Unlike other apolipoproteins, ApoD is primarily associated with high-density lipoproteins (HDL) and exerts potent anti-inflammatory effects by modulating the oxidation of arachidonic acid and sequestering small hydrophobic molecules that trigger oxidative stress [38]. Within the context of metabolic disorders, ApoD has been identified as a protective factor, where its expression is typically induced under conditions of cellular stress to mitigate lipid peroxidation and neutralize pro-inflammatory signaling [38]. This reduction in ApoD levels in the MetS group observed in our study, suggests a systemic failure of this protective markers in MetS likely and oxidative insult inherent to the syndrome, thereby facilitating the transition from simple insulin resistance to overt vascular dysfunction [39,40]. Consequently, the loss of this anti-inflammatory shield, correlates with the disrupted lipid profiles observed clinically, suggesting that restoring or maintaining ApoD levels could be a viable therapeutic strategy to MetS phenotype [38,39,40].
Vanin-1 (VNN1) is a protein that plays a pivotal role at the interface of lipid metabolism and inflammatory responses [41]. Its primary biological function involves the hydrolysis of pantetheine into pantothenic acid (Vitamin B5), that directly influences the cellular oxidative stress balance [12,42]. The clinical relevance of VNN1 in the pathophysiology of insulin resistance and T2DM is evidenced by its capacity to modulate pro-inflammatory signaling pathways, such as the iNOS/MCP-1/TGF-beta axis, exacerbating systemic and tissue inflammation in obese patients [43]. Furthermore, elevated VNN1 levels have been associated with higher glycated hemoglobin (HbA1c) indices and the progression of cardiovascular complications, suggesting that its upregulation is a critical event in the transition from simple obesity to established MetS [42,44]. Consequently, understanding the mechanisms by which VNN1 integrates metabolic and inflammatory signals is essential for precision therapeutic strategies.
Intercellular Adhesion Molecule-1 (ICAM-1) is a transmembrane glycoprotein belonging to the immunoglobulin superfamily, playing a pivotal role in modulating immune responses and maintaining vascular integrity [45]. Predominantly localized on endothelial cells and leukocytes, facilitating the leukocyte adhesion cascade that culminates in cellular transmigration into inflamed tissues, however in response to pro-inflammatory stimuli, its upregulation becomes a sentinel event of endothelial dysfunction [46]. The exclusive identification of ICAM-1 in the MetS group in our study, in contrast to its absence or non-detection in the control group, reflects a fundamental shift in vascular homeostasis induced by an adverse metabolic environment. Evidence demonstrates that individuals with metabolically unhealthy obesity phenotypes exhibit significantly elevated levels of this protein compared to healthy individuals, which directly correlates with increased visceral adiposity and the reduction of protective adipokines, such as adiponectin, which normally exerts an inhibitory effect on adhesion molecule expression [46,47]. Therefore, this finding positions ICAM-1 as a central pathophysiological component linking metabolic dysregulation to the progression of systemic vascular damage [45,47].
The metabolic landscape of MetS is increasingly defined by systemic shifts in branched-chain amino acids (BCAAs) and aromatic amino acids (AAAs) [48,49]. In this study, we observed a significant elevation of L-isoleucine, L-tyrosine, phenylalanine, and L-tryptophan in the MetS group compared to healthy controls. Specifically, L-isoleucine accumulation correlates with increased BMI and adiposity, whereas its restriction is known to restore insulin sensitivity via fibroblast growth factor 21 (FGF21) secretion [48]. The impaired BCAA catabolism overactivates the mTORC1 pathway, leading to inhibitory phosphorylation of IRS-1 and subsequent insulin resistance[50,51]. Simultaneously, elevated AAAs like phenylalanine and L-tyrosine exacerbate metabolic decline by promoting lipid disorders through increased hepatic bile acid synthesis and contributing to visceral fat accumulation and oxidative stress [52,53]. Furthermore, L-tryptophan dysregulation, driven by chronic low-grade inflammation, accelerates progression toward type 2 diabetes [54,55]. Together, these findings underscore a synergistic role for BCAAs and AAAs, positioning these molecular signatures for early risk stratification and potential therapeutic targets [56].
Palmitic acid (PA), the most prevalent saturated fatty acid in human circulation, representing approximately 20 to 30% of the total fatty acids in membrane phospholipids and triacylglycerols of adipose tissue [57,58]. Our findings reveal a significant upregulation of circulating PA in patients with MetS compared to healthy controls. This elevation reflects a systemic state of lipid overload that drives chronic low-grade inflammation and insulin resistance [59]. Furthermore, our observation of PA enrichment aligns with recent evidence, demonstrating that PA promotes pro-inflammatory M1-type polarization and adipose tissue dysfunction [60]. Beyond its role in glucose metabolism, the increased levels of PA in MetS likely contribute to heightened cardiovascular risk, increasing atherosclerotic plaque vulnerability and premature coronary artery disease [61]. The obesogenic potential of PA is further underscored by its ability to accelerate lipid accumulation and inflammatory responses during the early stages of adipogenesis, exacerbating the expansion of dysfunctional white adipose tissue [62]. Taken together, the marked elevation of PA in MetS patients represents a potent lipotoxic driver that bridges obesity, systemic inflammation, MetS and T2DM [58].
3-Hydroxybutyrate (3HB), is a low-molecular-weight ketone body synthesized endogenously in the liver that acts as a pleiotropic signaling molecule central to the regulation of metabolic and inflammatory homeostasis [63]. Our results reveal a significant reduction in serum 3HB levels in individuals with MetS compared to the control group, losing its protective effects against insulin resistance and worsening glucose tolerance in T2DM [63]. Furthermore, the deficiency of 3HB observed in the MetS group may exacerbate low-grade chronic inflammation and oxidative stress, as adequate concentrations of this metabolite possess anti-inflammatory properties, thereby mitigating the activation of systemic inflammatory pathways in models of metabolic dysfunction [63]. The clinical relevance of this finding is reinforced by the observation that elevated fasting 3HB levels are proportionally associated with weight loss success in intervention programs, serving as an indicator of metabolic health and the organism's capacity to efficiently switch between fuel sources [64]. In summary, the reduction of 3HB identified in our study points to the impairment of essential protective signaling pathways, positioning the restoration of 3HB levels, as a promising therapeutic strategy, risk stratification and monitoring the progression of systemic metabolic disorders [8,63].
Phosphatidylinositol (PI) is a pivotal anionic phospholipid that serves as both a fundamental structural component of cellular membranes and a crucial precursor for essential phosphoinositide signaling molecules, such as PIP3, which orchestrates the PI3K/Akt pathway central to insulin action and glucose homeostasis [65]. In the present study, a distinct molecular signature characterized by the significant upregulation of specific PI species was identified in individuals with MetS compared to healthy controls. This accumulation of PIs suggests a remodeling of the systemic lipidome that aligns with increased adiposity and metabolic dysfunction. Crucially, recent evidence from a comprehensive Mendelian randomization analysis has established a causal link between genetically predicted PI levels and a 17% increased risk of MetS, providing strong support for the hypothesis that the PI elevations observed in our study are drivers of the disease state rather than merely secondary consequences [66]. These findings are intricately tied to the pathophysiology of insulin resistance and chronic low-grade inflammation, where dysregulated PI concentrations may exacerbate glucose intolerance and the progression toward T2DM [67,68,69]. Collectively, these results position these PI species as critical metabolic alteration. Their systemic elevation underscores the metabolic dysregulation underlying MetS pathogenesis, highlighting PI as a promising therapeutic target for restoring insulin sensitivity and mitigating systemic metabolic risk
Phosphatidylcholine (PC) is the most abundant phospholipid in eukaryotic membranes and a primary constituent of circulating lipoproteins. In our study, the significant upregulation of the PC class in individuals with MetS compared to healthy controls. This elevation in circulating PC levels is strongly associated with the development of insulin resistance, T2DM, low-grade chronic inflammation and mitochondrial stress, often serving as an early indicator of metabolic deterioration [70,71]. The expansion of the PC in the context of MetS has been linked to impaired insulin signaling, specifically, recent evidence suggests that high-fat diet-induced increases in exosomal PC can inhibit the insulin receptor pathway in hepatocytes and macrophages via the activation of the aryl hydrocarbon receptor (AhR), thereby driving systemic inflammation and glucose intolerance [72]. In the study of Waś et al. 2025 [73] the PC shifts in individuals at high cardiovascular risk serve as sensitive indicators of preclinical cardiovascular changes, suggesting that the PC imbalances found in our MetS cohort may directly herald an increased susceptibility to major adverse cardiovascular event. Clinically, the increase of PC in the MetS group underscores the profound lipid dysregulation characterizing this syndrome and highlights the therapeutic importance of targeting phospholipid remodeling pathways to mitigate the progression toward overt diabetes and cardiovascular disease.
Sphingomyelins (SM) are primary phosphosphingolipids in mammalian cells, serving as integral structural components of plasma membranes, cholesterol homeostasis, and protein trafficking [74,75]. Our study revealed a significant decrease in circulating SM species in patients with MetS compared to healthy controls. Our findings align with specific lipidomic signatures observed in pediatric populations where decreased levels of specific species and were strongly associated with abdominal obesity and glucose dysregulation, connecting this depletion to the pathogenesis of insulin resistance and T2DM [74,76,77]. It has also been observed that administering SM to obese mice reduced levels of inflammatory cytokines, significantly reduced levels of total hepatic lipids, triglycerides, and total cholesterol, and improved the glycemic profile [77]. This specific lipidomic alteration may offer a promising therapeutic avenue for risk stratification and the prevention of cardiovascular complications in individuals with MetS [77,78].
By adopting a systems-level multi-omics framework, this study transcends traditional single-analyte paradigms to demonstrate that MetS is a coordinated systemic failure rather than a mere cluster of risk factors. Our findings reveal a profound homeostatic breakdown where the disruption of proteomic, lipidomic, and metabolomic axes converges upon a phenotype of systemic insulin resistance and vascular vulnerability. Specifically, the depletion of protective factors, characterized by reduced Apolipoprotein D (ApoD) and sphingomyelin (SM) species, compromises the antioxidant "shield", facilitating the transition from metabolic stress to clinical dysfunction [37,38,39,74,75]. This decline is paralleled by the pathological elevation of pro-inflammatory mediators such as ICAM-1 and Vanin-1; notably, the positive correlation between Palmitic acid and ICAM-1 suggests that saturated fatty acid excess triggers TLR4-mediated endothelial activation [79380], while the strong association of Vanin-1 with HOMA-IR and anthropometric markers positions it as a key risk indicator for diabetes and cardiovascular disease [81]. Furthermore, this systemic dysregulation is compounded by impaired amino acid metabolism, where accumulated branched-chain amino acids (BCAAs) overactivate the mTORC1 pathway to induce insulin resistance via inhibitory IRS-1 phosphorylation [50,51], and elevated aromatic amino acids (AAAs) promote lipid disorders through altered bile acid synthesis [52,53]. These metabolic shifts correlate with the upregulation of phosphatidylcholine (PC) and phosphatidylinositol (PI) species and the concomitant loss of 3-hydroxybutyrate (3HB), further exacerbating glucose intolerance and cardiovascular pathology. Nevertheless, these predictive signatures must be interpreted within the context of certain methodological constraints, including the cross-sectional nature of the study and the cohort size, which demands caution regarding generalizability. Ultimately, the high degree of correlation across these multi-omic layers underscores a synchronized molecular collapse defining the pathophysiology of MetS.
5. Conclusions
This study reinforces that MetS represents a synchronized molecular alteration across proteomic, lipidomic, and metabolomic axes rather than a simple collection of independent risk factors. The findings highlight a profound homeostatic breakdown characterized by the depletion of protective compounds, such as ApoD and sphingomyelin species, which compromises the body's antioxidant and anti-inflammatory defenses. This vulnerability is further exacerbated by the elevation of pro-inflammatory mediators like ICAM-1 and Vanin-1, the accumulation of lipotoxic drivers like Palmitic acid, and a significant disruption in amino acid catabolism (BCAA) that overactivates the mTORC1 pathway. Coupled with the loss of the metabolic signaling molecule 3-hydroxybutyrate and the upregulation of specific phosphatidylinositol and phosphatidylcholine species, these shifts collectively drive systemic insulin resistance and vascular damage. Ultimately, these multi-omic signatures provide a robust framework for early risk stratification for Metabolic Syndrome and comorbidities.
Supplementary Materials
The following supporting information can be downloaded at the website of this paper posted on Preprints.org.
Author Contributions
C.V.F.S.: statistical analysis, analysis and interpretation of data, writing – original draft, visualisation and acquisition of data. C.J.F.S.: statistical analysis, analysis and interpretation of data. T.R.C.: visualisation and acquisition of data, analysis and interpretation of data. C.L.: visualisation and acquisition of data, analysis and interpretation of data. Y.B.S.: analysis and interpretation of data. S.M.N.S.: analysis and interpretation of data. F.L.T.: critical revision of the manuscript for important intellectual content. C.C.T.: critical revision of the manuscript for important intellectual content. E.O.S.: critical revision of the manuscript for important intellectual content.
Funding
This work was supported by the funding agency FAPERJ (E-26/200.340/2024), and also State University of Rio de Janeiro - UERJ, that provided financial resources and grants.
Institutional Review Board Statement
This research was approved by the Ethics Committee in Human Research at Unigranrio, RJ, Brazil (approval number: 3,402,791) and was conducted following the ethical principles outlined in the Declaration of Helsinki (1964) and its subsequent amendments.
Informed Consent Statement
Informed consent was obtained from all subjects involved in the study.
Data Availability Statement
The raw mass spectrometry data are available from the corresponding author upon reasonable request and with the author's permission.
Acknowledgments
We extend our gratitude to all the volunteers who participated in this study. We also thank the National Institute of Metrology, Quality and Technology (Inmetro) for their support in sample preparation and the Laboratory of Functional Genetics of Plants at USP ESALQ University for the MS analysis, and CEMBIO.
Conflicts of Interest
The authors declare no conflicts of interest.
References
- Reaven, G.M. Banting lecture 1988. Role of insulin resistance in human disease. Diabetes 1988, 37, 1595–1607. [Google Scholar] [CrossRef]
- Robberecht, H.; De Bruyne, T.; Hermans, N. Biomarkers of the metabolic syndrome: influence of selected foodstuffs, containing bioactive components. Phytochem. Rev. 2017, 17, 351–377. [Google Scholar] [CrossRef]
- García-Currás, J.; Pérez-Lois, R.; Taboada, G.L.; Pata, M.P. Exploring Biomarkers in Type 2 Diabetes Mellitus versus Normoglycemia Identified through High-Throughput Proteomics: A Systematic Review and Meta-Analysis. J. Proteome Res. 2025, 25, 4–20. [Google Scholar] [CrossRef]
- Noubiap, J.J.; Nansseu, J.R.; Nyaga, U.F.; Ndoadoumgue, A.L.; Ngouo, A.T.; Tounouga, D.N.; Tianyi, F.L.; Foka, A.J.; Lontchi-Yimagou, E.; Nkeck, J.R.; Bigna, J.J. Worldwide trends in metabolic syndrome from 2000 to 2023: a systematic review and modelling analysis. Nat. Commun. 2025, 17(1), 573. [Google Scholar] [CrossRef] [PubMed] [PubMed Central]
- Valadares, L.T.d.S.; de Souza, L.S.B.; Júnior, V.A.S.; Bonomo, L.d.F.; de Macedo, L.R.; Silva, M. Prevalence of metabolic syndrome in Brazilian adults in the last 10 years: a systematic review and meta-analysis. BMC Public Heal. 2022, 22, 1–22. [Google Scholar] [CrossRef]
- INTERNATIONAL DIABETES FEDERATION. IDF Diabetes Atlas, 11. ed.; International Diabetes Federation: Brussels, 2025. [Google Scholar]
- Ricardo, S.J.; Araujo, M.Y.C.; dos Santos, L.L.; Romanzini, M.; Fernandes, R.A.; Turi-Lynch, B.C.; Codogno, J.S. Burden of metabolic syndrome on primary healthcare costs among older adults: A cross-sectional study. Sao Paulo Med. J. 2024, 142, e2023215. [Google Scholar] [CrossRef]
- Da Silva, C. A.; et al. Proteomic and Metabolomic Interplay in the Regulation of Energy Metabolism During Obesity and Metabolic Syndrome. Diabetes/Metabolism Res. Rev. 2025, v. 41(n. 7), e70090. [Google Scholar] [CrossRef]
- FERREIRA DA SILVA, C. V.; et al. Prospecting Specific Protein Patterns for High Body Mass Index (BMI), Metabolic Syndrome and Type 2 Diabetes in Saliva and Blood Plasma From a Brazilian Population. Proteom.-Clin. Appl. 2024, v. 18(n. 6), e202300238. [Google Scholar] [CrossRef]
- YAO, J.; et al. Proteomic analyses in diverse populations improved risk prediction and identified new drug targets for type 2 diabetes. Diabetes Care 2024, v. 47(n. 9), 1704–1712. [Google Scholar] [CrossRef]
- Mei, J.; Yang, F.-Y.; Gong, Q. Branched-chain amino acids and insulin resistance in type 2 diabetes: from metabolic dysregulation to therapeutic targets. Front. Endocrinol. 2026, 16, 1643231. [Google Scholar] [CrossRef]
- Yang, Y.A. Unraveling the causal pathway between phosphatidylinositol, metabolites, and metabolic syndrome: a Mendelian randomization study. Diabetol. Metab. Syndr. 2025, 17(1), 162. [Google Scholar] [CrossRef] [PubMed] [PubMed Central]
- LAKAMRAJU, T.; et al. Multi-fluid, multi-omics signatures of insulin resistance and type 2 diabetes prediction. Front. Endocrinol. 2025, v. 15, e1699656. [Google Scholar] [CrossRef]
- Xie, R.; Herder, C.; Sha, S.; Brenner, H.; Carlsson, S.; Schöttker, B. Improved sex-specific cardiovascular risk prediction with multi-omics data in people with type 2 diabetes. Cardiovasc. Diabetol. 2025, 25. [Google Scholar] [CrossRef]
- Executive summary of the Third Report of the National Cholesterol Education Program (NCEP) Expert Panel on Detection, Evaluation and Treatment Of High Blood Cholesterol in Adults (Adult Treatment Panel III). JAMA 2001, 285, 2486–97. [CrossRef]
- Geloneze, B.; Vasques, A.C.J.; Stabe, C.F.C.; Pareja, J.C.; de Lima Rosado, L.E.F.P.; De Queiroz, E.C.; Tambascia, M.A. HOMA1-IR and HOMA2-IR indexes in identifying insulin resistance and metabolic syndrome: Brazilian Metabolic Syndrome Study (BRAMS). Arq. Bras. Endocrinol. Metabol. 2009, 53, 281–287. [Google Scholar] [CrossRef]
- Gong, R.; Liu, Y.; Luo, G.; Yang, L. Dietary Magnesium Intake Affects the Vitamin D Effects on HOMA-β and Risk of Pancreatic β-Cell Dysfunction: A Cross-Sectional Study. Front. Nutr. 2022, 9, 849747. [Google Scholar] [CrossRef]
- Da Silva, C.V.F.; Sade, Y.B.; Scapin, S.M.N.; Leite, P.E.C.; Da Silva-Boghossian, C.M.; Santos, E.d.O. Relevance of obesity and overweight to salivary and plasma proteomes of human young adults from Brazil / Relevância da obesidade e sobrepeso para os proteomas salivares e plasmáticos de adultos jovens humanos do Brasil. Braz. J. Dev. 2022, 8, 13981–14001. [Google Scholar] [CrossRef]
- Liu, J.; Li, Y.; Li, J.; Zheng, D.; Liu, C. Sources of automatic office blood pressure measurement error: a systematic review. Physiol. Meas. 2022, 43, 09TR02. [Google Scholar] [CrossRef]
- Boaretto, L.F.; Labate, M.T.V.; Franceschini, L.M.; Cataldi, T.R.; Budzinski, I.G.F.; de Moraes, F.E.; Labate, C.A. Proteomics Reveals an Increase in the Abundance of Glycolytic and Ethanolic Fermentation Enzymes in Developing Sugarcane Culms During Sucrose Accumulation. Front. Plant Sci. 2021, 12. [Google Scholar] [CrossRef]
- Cox, J.; Mann, M. MaxQuant enables high peptide identification rates, individualized p.p.b.-range mass accuracies and proteome-wide protein quantification. Nat. Biotechnol. 2008, 26, 1367–1372. [Google Scholar] [CrossRef]
- Cox, J.; Neuhauser, N.; Michalski, A.; Scheltema, R.A.; Olsen, J.V.; Mann, M. Andromeda: A Peptide Search Engine Integrated into the MaxQuant Environment. J. Proteome Res. 2011, 10, 1794–1805. [Google Scholar] [CrossRef]
- Tyanova, S.; Cox, J. Perseus: A Bioinformatics Platform for Integrative Analysis of Proteomics Data in Cancer Research. In Methods in Molecular Biology; Springer Science and Business Media LLC: Berlin, Germany, 2018; Volume 1711, pp. 133–148. [Google Scholar]
- Bligh, E.G.; Dyer, W.J. A rapid method of total lipid extraction and purification. Can. J. Biochem. Physiol. 1959. [Google Scholar] [CrossRef]
- Rudt, E.; Froning, M.; Heuckeroth, S.; Ortmann, L.; Diemand, J.; Hörnschemeyer, L.; Pleger, A.; Vinzelberg, M.; Schmid, R.; Pluskal, T.; et al. Rapid MALDI-MS/MS-Based Profiling of Lipid A Species from Gram-Negative Bacteria Utilizing Trapped Ion Mobility Spectrometry and mzmine. Anal. Chem. 2025, 97, 7781–7788. [Google Scholar] [CrossRef]
- Hinkle, D.E.; Wiersma, W.; Jurs, S.G. Applied Statistics for the Behavioral Sciences, 5th ed.; Houghton Mifflin College Division: Boston, MA, USA, 2003. [Google Scholar]
- Wei, T.; V. Simko, R. Package 'corrplot': Visualization of a Correlation Matrix. Version 0.92. Available online: https://github.com/taiyun/corrplot2021.
- Xie, Z.; Bailey, A.; Kuleshov, M.V.; Clarke, D.J.B.; Evangelista, J.E.; Jenkins, S.L.; Lachmann, A.; Wojciechowicz, M.L.; Kropiwnicki, E.; Jagodnik, K.M.; et al. Gene Set Knowledge Discovery with Enrichr. Curr. Protoc. 2021, 1, e90. [Google Scholar] [CrossRef]
- Pang, Z.; Lu, Y.; Zhou, G.; Hui, F.; Xu, L.; Viau, C.; Spigelman, A.F.; E MacDonald, P.; Wishart, D.S.; Li, S.; et al. MetaboAnalyst 6.0: towards a unified platform for metabolomics data processing, analysis and interpretation. Nucleic Acids Res. 2024, 52, W398–W406. [Google Scholar] [CrossRef]
- Liu, C.-H.; Shen, P.-C.; Tsai, M.-H.; Liu, H.-C.; Lin, W.-J.; Lai, Y.-L.; Wang, Y.-D.; Hung, M.-C.; Cheng, W.-C. LipidSigR: a R-based solution for integrated lipidomics data analysis and visualization. Bioinform. Adv. 2024, 5, vbaf047. [Google Scholar] [CrossRef]
- Koenig, A.M.; Karabatsiakis, A.; Stoll, T.; Wilker, S.; Hennessy, T.; Hill, M.M.; Kolassa, I.-T. Serum profile changes in postpartum women with a history of childhood maltreatment: a combined metabolite and lipid fingerprinting study. Sci. Rep. 2018, 8, 1–10. [Google Scholar] [CrossRef]
- Breiman, L. Random forests. Mach. Learn. 2001, 45, 5–32. [Google Scholar] [CrossRef]
- Sun, T.-H.; Wang, C.-C.; Wu, Y.-L.; Hsu, K.-C.; Lee, T.-H. Machine learning approaches for biomarker discovery to predict large-artery atherosclerosis. Sci. Rep. 2023, 13, 1–14. [Google Scholar] [CrossRef]
- Alladio, E.; Trapani, F.; Castellino, L.; et al. Enhancing Breast Cancer Screening With Urinary Biomarkers and Random Forest Supervised Classification: Comprehensive Investigation. J. Pharm. Biomed. Anal. 2024, 244, 116113. [Google Scholar] [CrossRef]
- Stoessel, D.; Stellmann, J.-P.; Willing, A.; Behrens, B.; Rosenkranz, S.C.; Hodecker, S.C.; Stürner, K.H.; Reinhardt, S.; Fleischer, S.; Deuschle, C.; et al. Metabolomic Profiles for Primary Progressive Multiple Sclerosis Stratification and Disease Course Monitoring. Front. Hum. Neurosci. 2018, 12, 226. [Google Scholar] [CrossRef]
- Rohart, F.; Gautier, B.; Singh, A.; Lê Cao, K.-A. mixOmics: An R package for ‘omics feature selection and multiple data integration. PLoS Comput. Biol. 2017, 13, e1005752. [Google Scholar] [CrossRef]
- Kolanek, A.; Cemaga, R.; Maciejczyk, M. Role and Diagnostic Significance of Apolipoprotein D in Selected Neurodegenerative Disorders. Diagnostics 2024, 14, 2814. [Google Scholar] [CrossRef]
- Kurano, M.; Tsukamoto, K.; Kamitsuji, S.; Kamatani, N.; Hasegawa, K.; Hara, M.; Ishikawa, T.; Yatomi, Y.; Teramoto, T. Apolipoprotein D modulates lipid mediators and osteopontin in an anti-inflammatory direction. Inflamm. Res. 2022, 72, 263–280. [Google Scholar] [CrossRef]
- Ulloque-Badaracco, J.R.; et al. Association of apolipoproteins and lipoprotein(a) with metabolic syndrome: a systematic review and meta-analysis. Lipids Health Dis. 2023, 22(1), 98. [Google Scholar] [CrossRef]
- Tao, X.; Tao, R.; Wang, K.; Wu, L. Anti-inflammatory mechanism of Apolipoprotein A-I. Front. Immunol. 2024, 15, 1417270. [Google Scholar] [CrossRef]
- Lv, L.; Wang, T.; Xie, W.; Wei, J.; Zhou, L.; Qiu, X.; Feng, H.; Gu, W. Revealing VNN1: An Emerging and Promising Target for Inflammation and Redox Balance. Immun. Inflamm. Dis. 2025, 13, e70274. [Google Scholar] [CrossRef]
- Shoura, N.K.; Elbatreek, M.H.; Mousa, M.M.; El-Bassossy, H.M.; El-Azzazy, O.Y. Biomarker potential of vanin-1-derived pantothenic acid in diabetes and its associated cardiovascular complications. Sci. Rep. 2025, 15, 1–11. [Google Scholar] [CrossRef]
- ∙ Mosaad, Y.; Hussein, M.A.; Ateyya, H.; Mohamed, A.H.; A Ali, A.; Youssuf, A.R.; Wink, M.; A El-Kholy, A. Vanin 1 Gene Role in Modulation of iNOS/MCP-1/TGF-β1 Signaling Pathway in Obese Diabetic Patients. J. Inflamm. Res. 2022, ume 15, 6745–6759. [Google Scholar] [CrossRef]
- Geng, S.; Chen, D.; Wang, Y.; Yu, X.; Zuo, D.; Lv, X.; Zhou, X.; Hu, C.; Yang, X.; Ma, X.; et al. Serum levels of Vanin-2 increase with obesity in relation to inflammation of adipose tissue and may be a predictor of bariatric surgery outcomes. Front. Nutr. 2023, 10, 1270435. [Google Scholar] [CrossRef]
- Haydinger, C.D.; Ashander, L.M.; Tan, A.C.R.; Smith, J.R. Intercellular Adhesion Molecule 1: More than a Leukocyte Adhesion Molecule. Biology 2023, 12, 743. [Google Scholar] [CrossRef]
- Liu, M.; Wang, P.; Xie, P.; Xu, X.; He, L.; Chen, X.; Zhang, S.; Lin, Y.; Huang, Y.; Xia, W.; et al. Expression of ICAM-1 and E-selectin in different metabolic obesity phenotypes: discrepancy for endothelial dysfunction. J. Endocrinol. Investig. 2023, 46, 2379–2389. [Google Scholar] [CrossRef]
- Widjaja, N.A.; Caesar, L.A.; Nova, S.; Ardianah, E. Beyond the Scale: Investigating Adiponectin, ICAM-1, and VCAM-1 as Metabolic Markers in Obese Adolescents with Metabolic Syndrome. J. Obes. 2023, 2023, 1–11. [Google Scholar] [CrossRef]
- Yu, D.; Richardson, N.E.; Green, C.L.; Spicer, A.B.; Murphy, M.E.; Flores, V.; Jang, C.; Kasza, I.; Nikodemova, M.; Wakai, M.H.; et al. The adverse metabolic effects of branched-chain amino acids are mediated by isoleucine and valine. Cell Metab. 2021, 33, 905–922.e6. [Google Scholar] [CrossRef]
- Rezaei, M.; Hosseinpour-Niazi, S.; Akhavan, N.; Hosseini-Esfahani, F.; Mirmiran, P.; Azizi, F. The Association Between Dietary Intake of Aromatic Amino Acids and Metabolic Syndrome. J. Nutr. Metab. 2025, 2025. [Google Scholar] [CrossRef]
- Sun, S.; He, D.; Luo, C.; Lin, X.; Wu, J.; Yin, X.; Jia, C.; Pan, Q.; Dong, X.; Zheng, F.; et al. Metabolic Syndrome and Its Components Are Associated With Altered Amino Acid Profile in Chinese Han Population. Front. Endocrinol. 2022, 12, 795044. [Google Scholar] [CrossRef]
- Chen, S.; Miki, T.; Fukunaga, A.; Eguchi, M.; Kochi, T.; Nanri, A.; Kabe, I.; Mizoue, T. Associations of serum amino acids with insulin resistance among people with and without overweight or obesity: A prospective study in Japan. Clin. Nutr. 2022, 41, 1827–1833. [Google Scholar] [CrossRef]
- Chen, J.; Qin, Y.; Li, Z.; Shan, A.; Ma, Q. Aromatic Amino Acids Promote Lipid Metabolism Disorders by Increasing Hepatic Bile Acid Synthesis. J. Nutr. 2024, 154, 1321–1332. [Google Scholar] [CrossRef]
- Hu, W.; Yang, P.; Fu, Z.; Wang, Y.; Zhou, Y.; Ye, Z.; Gong, Y.; Huang, A.; Sun, L.; Zhao, Y.; et al. High L-Valine Concentrations Associate with Increased Oxidative Stress and Newly-Diagnosed Type 2 Diabetes Mellitus: A Cross-Sectional Study. Diabetes Metab. Syndr. Obes. Targets Ther. 2022, ume 15, 499–509. [Google Scholar] [CrossRef]
- Wang, M.; Ou, Y.; Yuan, X.-L.; Zhu, X.-F.; Niu, B.; Kang, Z.; Zhang, B.; Ahmed, A.; Xing, G.-Q.; Su, H. Heterogeneously elevated branched-chain/aromatic amino acids among new-onset type-2 diabetes mellitus patients are potentially skewed diabetes predictors. World J. Diabetes 2024, 15, 53–71. [Google Scholar] [CrossRef]
- Park, J.-S.; Ahmed, K.; Yim, J.-E. Serum branch chain amino acids and aromatic amino acids ratio and metabolic risks in Koreans with normal-weight or obesity: a cross-sectional study. Korean J. Community Nutr. 2024, 29, 212–221. [Google Scholar] [CrossRef]
- Orozco-Ruiz, X.; Anesi, A.; Mattivi, F.; Breteler, M.M.B. Branched-Chain and Aromatic Amino Acids Related to Visceral Adipose Tissue Impact Metabolic Health Risk Markers. J. Clin. Endocrinol. Metab. 2022, 107, e2896–e2905. [Google Scholar] [CrossRef]
- Wang, X.; Zhu, L.; Liu, J.; Ma, Y.; Qiu, C.; Liu, C.; Gong, Y.; Yuwen, Y.; Guan, G.; Zhang, Y.; et al. Palmitic acid in type 2 diabetes mellitus promotes atherosclerotic plaque vulnerability via macrophage Dll4 signaling. Nat. Commun. 2024, 15, 1–17. [Google Scholar] [CrossRef]
- Ceja-Galicia, Z.A.; Cespedes-Acuña, C.L.A.; El-Hafidi, M. Protection Strategies Against Palmitic Acid-Induced Lipotoxicity in Metabolic Syndrome and Related Diseases. Int. J. Mol. Sci. 2025, 26, 788. [Google Scholar] [CrossRef]
- Qiu, T.; Yang, X.; Wang, J.; Pan, C.; Chu, X.; Xiong, J.; Xie, J.; Chang, Y.; Wang, C.; Zhang, J. Obesity-induced elevated palmitic acid promotes inflammation and glucose metabolism disorders through GPRs/NF-κB/KLF7 pathway. Nutr. Diabetes 2022, 12, 1–13. [Google Scholar] [CrossRef]
- Zhao, X.; Zhang, W.; Jiang, F.; Chen, X.; Chen, C.; Wang, M.; Chen, B.; Cannon, R.D.; Saffery, R.; Han, T.-L.; et al. Excessive palmitic acid disturbs macrophage α-ketoglutarate/succinate metabolism and causes adipose tissue insulin resistance associated with gestational diabetes mellitus. Free Radic. Biol. Med. 2024, 222, 424–436. [Google Scholar] [CrossRef]
- Chen, Y.; et al. The association between circulating palmitic acid levels and risk of premature coronary artery disease in Chinese patients: a case-control study. BMC Cardiovasc. Disord. 2025, 25, 412. [Google Scholar] [CrossRef]
- Stanek, E.; Czamara, K.; Kaczor, A. Increased obesogenic action of palmitic acid during early stage of adipogenesis. Biochim. Et. Biophys. Acta (BBA) Mol. Cell Biol. Lipids 2024, 1869, 159525. [Google Scholar] [CrossRef]
- Zhang, Y.; Li, Z.; Liu, X.; Chen, X.; Zhang, S.; Chen, Y.; Chen, J.; Chen, J.; Wu, F.; Chen, G.-Q. 3-Hydroxybutyrate ameliorates insulin resistance by inhibiting PPARγ Ser273 phosphorylation in type 2 diabetic mice. Signal Transduct. Target. Ther. 2023, 8, 1–10. [Google Scholar] [CrossRef]
- Finucane, F.M.; Rafey, M.F.; Leahy, M.; O'SHea, P.; O'BRien, T.; O'DOnnell, M. Weight loss is proportional to increases in fasting serum beta-hydroxybutyrate concentrations in adults with severe obesity undergoing a meal replacement programme. Hum. Nutr. Metab. 2023, 32. [Google Scholar] [CrossRef]
- Takizawa, H.; Uranbileg, B.; Yutaka, Y.; Kurano, M. Serum Sphingolipid and Glycerophospholipid Synthesis, Especially Phosphatidylinositol/Lysophosphatidylinositol, Phosphatidylglycerol/Lysophosphatidylglycerol, and Ceramides, Are Significantly Influenced by Diabetes Mellitus and Associated with Its Complications. Diabetology 2025, 6, 112. [Google Scholar] [CrossRef]
- Yang, Y.; Ma, Y.; Li, M.; Han, Y.; Liu, L. Unraveling the causal pathway between phosphatidylinositol, metabolites, and metabolic syndrome: a Mendelian randomization study. Diabetol. Metab. Syndr. 2025, 17, 162. [Google Scholar] [CrossRef]
- Alvares, D.; Hoffman, S.; Stankovic, B.; Adeli, K. Gut peptide and neuroendocrine regulation of hepatic lipid and lipoprotein metabolism in health and disease. Biochim. Et. Biophys. Acta (BBA) -Mol. Cell Biol. Lipids 2019, 1864, 326–334. [Google Scholar] [CrossRef]
- Auguet, T.; Bertran, L.; Capellades, J.; Abelló, S.; Aguilar, C.; Sabench, F.; del Castillo, D.; Correig, X.; Yanes, O.; Richart, C. LC/MS-Based Untargeted Metabolomics Analysis in Women with Morbid Obesity and Associated Type 2 Diabetes Mellitus. Int. J. Mol. Sci. 2023, 24, 7761. [Google Scholar] [CrossRef]
- Pang, S.-J.; Liu, T.-T.; Pan, J.-C.; Man, Q.-Q.; Song, S.; Zhang, J. The Association between the Plasma Phospholipid Profile and Insulin Resistance: A Population-Based Cross-Section Study from the China Adult Chronic Disease and Nutrition Surveillance. Nutrients 2024, 16, 1205. [Google Scholar] [CrossRef]
- Zhong, J.; Cheung, C.Y.Y.; Su, X.; Lee, C.-H.; Ru, Y.; Fong, C.H.Y.; Liu, Y.; Cheung, C.K.Y.; Lam, K.S.L.; Cai, Z.; et al. Specific triacylglycerol, diacylglycerol, and lyso-phosphatidylcholine species for the prediction of type 2 diabetes: a ~ 16-year prospective study in Chinese. Cardiovasc. Diabetol. 2022, 21, 1–11. [Google Scholar] [CrossRef]
- Al-Sulaiti, H.; Anwardeen, N.; Bashraheel, S.S.; Naja, K.; Elrayess, M.A. Alterations in Choline Metabolism in Non-Obese Individuals with Insulin Resistance and Type 2 Diabetes Mellitus. Metabolites 2024, 14, 457. [Google Scholar] [CrossRef]
- Kumar, A.; Sundaram, K.; Mu, J.; Dryden, G.W.; Sriwastva, M.K.; Lei, C.; Zhang, L.; Qiu, X.; Xu, F.; Yan, J.; et al. High-fat diet-induced upregulation of exosomal phosphatidylcholine contributes to insulin resistance. Nat. Commun. 2021, 12, 213–234. [Google Scholar] [CrossRef]
- Waś, J.; Dobrowolski, P.; Prejbisz, A.; Niedolistek, M.; Kowalik, I.; Drohomirecka, A.; Sokołowska, D.; Krzysztoń-Russjan, J. Early Changes in the Plasma Lipidome of People at Very High Cardiovascular Risk: A New Approach to Assessing the Risk of Cardiovascular Changes. Biomedicines 2025, 13, 643. [Google Scholar] [CrossRef]
- Mir, F.A.; Ullah, E.; Mall, R.; Iskandarani, A.; Samra, T.A.; Cyprian, F.; Parray, A.; Alkasem, M.; Abdalhakam, I.; Farooq, F.; et al. Dysregulated Metabolic Pathways in Subjects with Obesity and Metabolic Syndrome. Int. J. Mol. Sci. 2022, 23, 9821. [Google Scholar] [CrossRef]
- Li, C.-Z.; Wu, L.-M.; Zhu, C.-X.; Du, H.-Y.; Chen, G.-X.; Yang, F. The impacts of dietary sphingomyelin supplementation on metabolic parameters of healthy adults: a systematic review and meta-analysis of randomized controlled trials. Front. Nutr. 2024, 11, 1363077. [Google Scholar] [CrossRef]
- Liang, X.; Tang, X.; Xi, B.; Qu, P.; Ren, Y.; Hao, G. Abdominal obesity-related lipid metabolites may mediate the association between obesity and glucose dysregulation. Pediatr. Res. 2022, 93, 183–188. [Google Scholar] [CrossRef]
- Qin, X.-Y.; Pan, J.; Liu, Y.-N.; Luo, H.-M.; Yang, F. The protective effect of dietary sphingomyelin supplementation against impaired lipid metabolism in obese mice: a systematic review and meta-analysis of randomized controlled trials. Food Nutr. Health 2025, 2, 1–26. [Google Scholar] [CrossRef]
- Rigamonti, A.E.; Cas, M.D.; Caroli, D.; De Col, A.; Cella, S.G.; Paroni, R.; Sartorio, A. Identification of a Specific Plasma Sphingolipid Profile in a Group of Normal-Weight and Obese Subjects: A Novel Approach for a “Biochemical” Diagnosis of Metabolic Syndrome? Int. J. Mol. Sci. 2023, 24, 7451. [Google Scholar] [CrossRef]
- Wang, X.; Zhu, L.; Liu, J.; Ma, Y.; Qiu, C.; Liu, C.; Gong, Y.; Yuwen, Y.; Guan, G.; Zhang, Y.; et al. Palmitic acid in type 2 diabetes mellitus promotes atherosclerotic plaque vulnerability via macrophage Dll4 signaling. Nat. Commun. 2024, 15, 1–17. [Google Scholar] [CrossRef]
- Stanek, E.; Czamara, K.; Kaczor, A. Increased obesogenic action of palmitic acid during early stage of adipogenesis. Biochim. Et. Biophys. Acta (BBA) Mol. Cell Biol. Lipids 2024, 1869, 159525. [Google Scholar] [CrossRef]
- Küçük, Ş.D.; Gezer, E.; Çalan, M.; Yüksel, A. Relationship between serum Vanin 1 level and metabolic parameters in patients with type 2 diabetes mellitus. Int. J. Diabetes Dev. Ctries. 2022, 43, 801–806. [Google Scholar] [CrossRef]
Figure 1.
Feature importance ranked by Random Forest analysis. Plots display the Mean Decrease Accuracy for (A) clinical data, (B) proteomic features, (C) metabolomic features, and (D) lipidomic features. The mini-heatmap on the right illustrates the relative intensity/level of each feature.
Figure 1.
Feature importance ranked by Random Forest analysis. Plots display the Mean Decrease Accuracy for (A) clinical data, (B) proteomic features, (C) metabolomic features, and (D) lipidomic features. The mini-heatmap on the right illustrates the relative intensity/level of each feature.
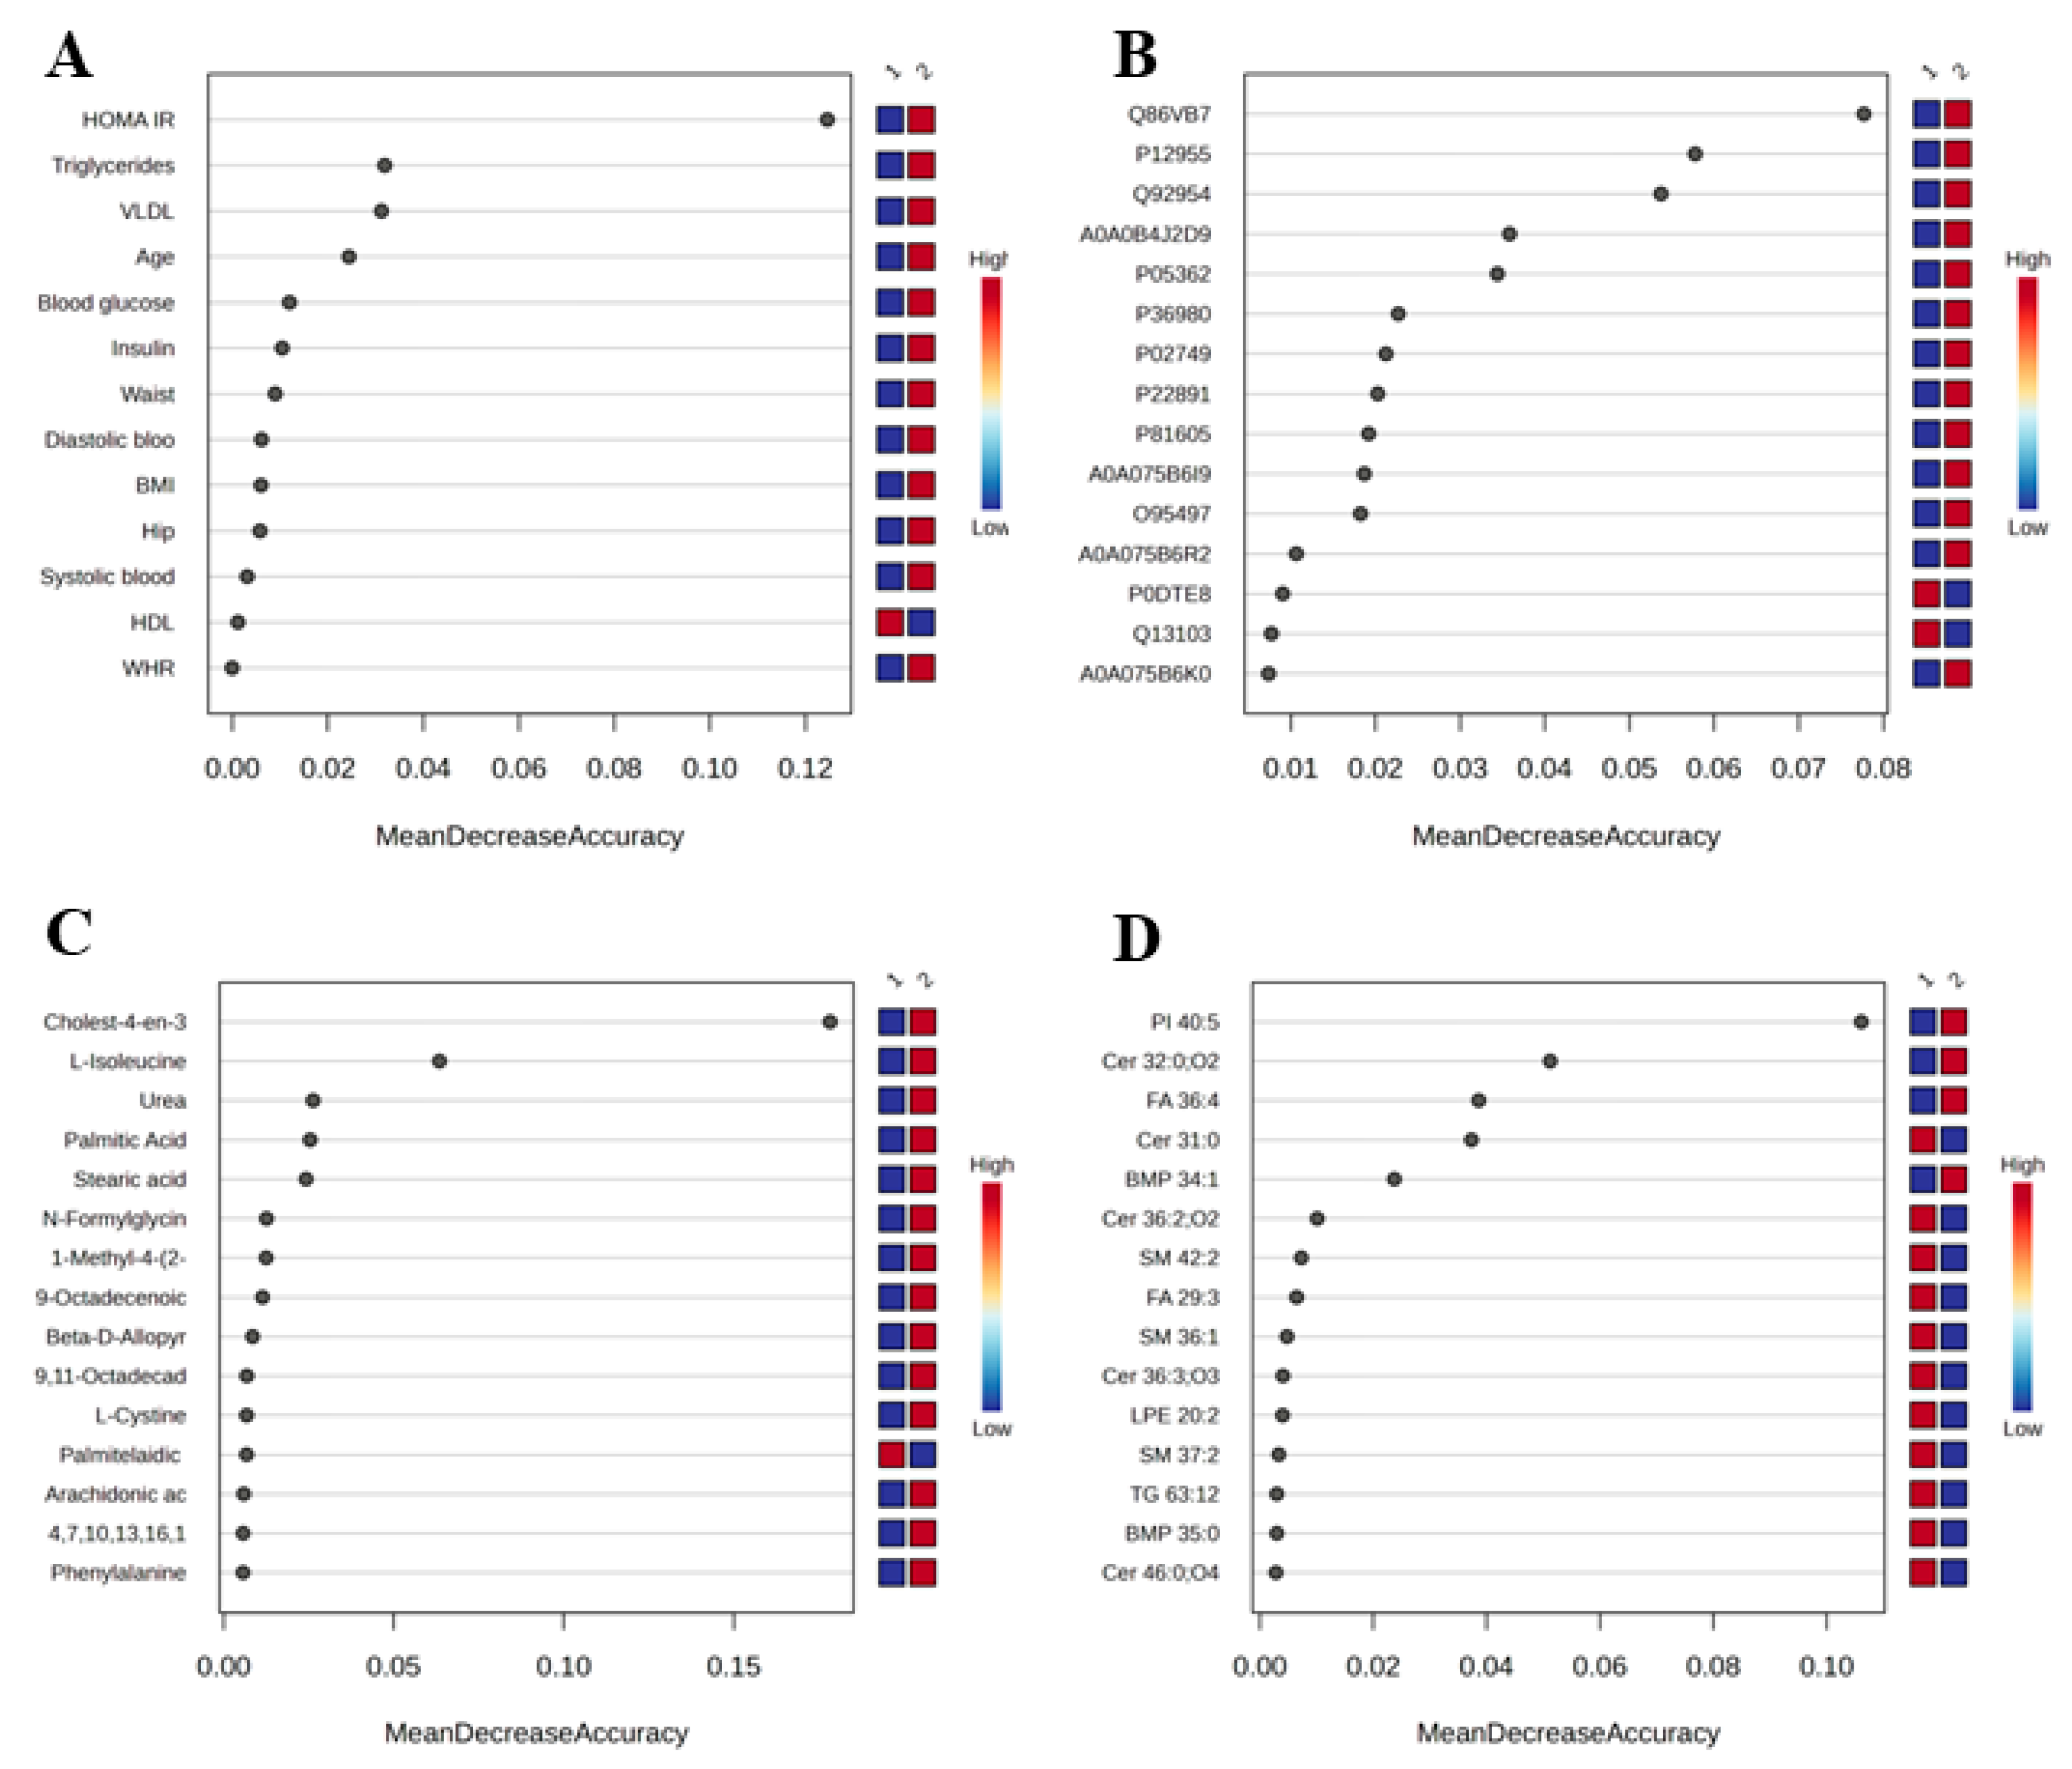
Figure 2.
Unsupervised K-means clustering. A) PCA score plot based on protein profiles. B) PCA score plot of metabolite profiles. C) PCA score plot of lipid profiles.
Figure 2.
Unsupervised K-means clustering. A) PCA score plot based on protein profiles. B) PCA score plot of metabolite profiles. C) PCA score plot of lipid profiles.
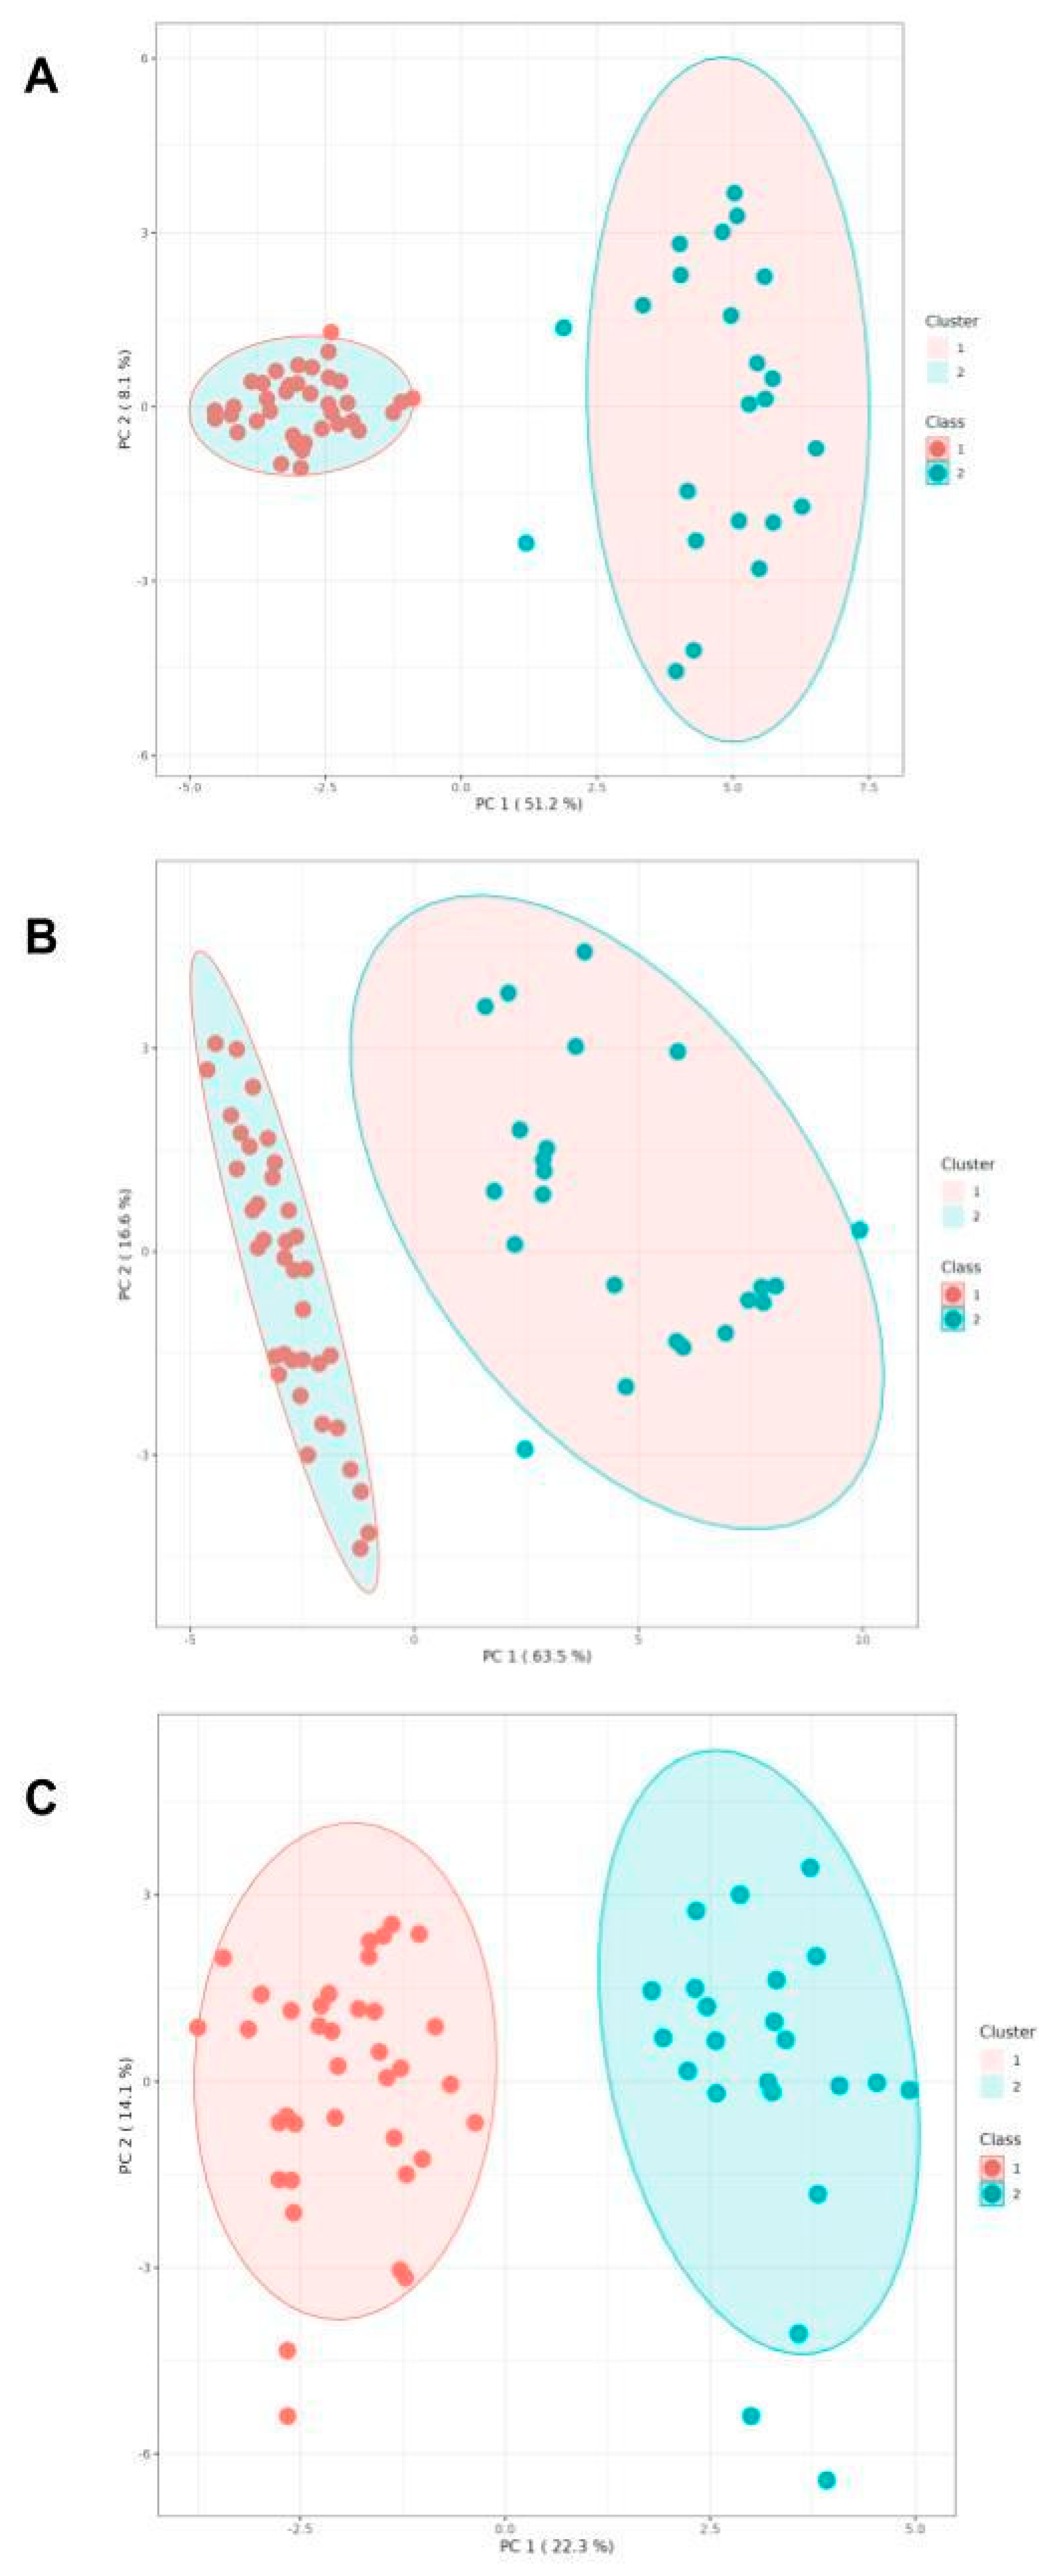
Figure 3.
Multi-omics correlation Circos plot between proteins, lipids, and metabolites. The diagram displays the interconnected landscape of the identified molecular features. The perimeter is divided into three omics sectors (Proteins, Lipids, and Metabolites), with individual feature labels provided along the circumference. The outer line plots reflect the expression/abundance trends for the Control (blue) and Case (orange) groups.
Figure 3.
Multi-omics correlation Circos plot between proteins, lipids, and metabolites. The diagram displays the interconnected landscape of the identified molecular features. The perimeter is divided into three omics sectors (Proteins, Lipids, and Metabolites), with individual feature labels provided along the circumference. The outer line plots reflect the expression/abundance trends for the Control (blue) and Case (orange) groups.
Disclaimer/Publisher’s Note: The statements, opinions and data contained in all publications are solely those of the individual author(s) and contributor(s) and not of MDPI and/or the editor(s). MDPI and/or the editor(s) disclaim responsibility for any injury to people or property resulting from any ideas, methods, instructions or products referred to in the content. |
© 2026 by the authors. Licensee MDPI, Basel, Switzerland. This article is an open access article distributed under the terms and conditions of the Creative Commons Attribution (CC BY) license (http://creativecommons.org/licenses/by/4.0/).
Copyright: This open access article is published under a Creative Commons CC BY 4.0 license, which permit the free download, distribution, and reuse, provided that the author and preprint are cited in any reuse.