

Submitted:
10 September 2026
Posted:
10 September 2026
You are already at the latest version
Abstract
Acute pancreatitis (AP) is an acute inflammatory disorder of the exocrine pancreas with limited therapies. Whether cuproptosis, a copper-dependent cell death pathway, contributes to AP pathogenesis remains unknown. We integrated single-cell transcriptomics (GSE279876), mouse AP model (GSE188819), and human cohort data (GSE194331) to evaluate 13 cuproptosis-related genes across cell types, along with pseudotime trajectory, regulatory networks, and cell-cell communication. Findings were validated in caerulein-induced Severe acute pancreatitis(SAP) mouse models and acinar cell injury using histopathology, electron microscopy, flow cytometry, immunofluorescence, and biochemical assays. Single-cell analysis showed selective cuproptosis pathway activation in acinar cells, with all 13 genes upregulated, most notably Gls and Fdx1. Cuproptosis score increased along pseudotime, and transcription factors Spi1 and Fos/Jun, alongside MIF/CCL inflammatory signals, were enriched, confirmed in independent datasets. In vitro and in vivo, severe AP pancreata and acinar cells exhibited copper accumulation, FDX1/DLAT upregulation, mitochondrial shrinkage, and cristae loss, which are classic cuproptotic phenotypes, all reversed by tetrathiomolybdate (TTM). We conclude that the inflammatory microenvironment drives acinar cells to selectively activate cuproptosis in AP, and copper chelation with TTM attenuates pancreatic injury, suggesting a potential targeted therapeutic strategy.
Keywords:
acute pancreatitis
; cuproptosis
; single-cell transcriptomics
; inflammatory microenvironment
; tetrathiomolybdate
1. Introduction
Acute pancreatitis is an acute, critical illness of the digestive system with high incidence and mortality, and its core pathological event is the injury and death of pancreatic acinar cells [1,2,3]. Despite increasing insight into the pathophysiology of acute pancreatitis in recent years, clinically actionable targeted therapies remain unavailable, primarily because the diversity of acinar cell death modalities and the complexity of their regulatory networks have not been fully elucidated [4,5]. It has traditionally been believed that acinar cell necrosis is the dominant mode of cell death in acute pancreatitis; however, the subsequent identification of multiple programmed cell death modalities, including apoptosis, autophagy, pyroptosis, and ferroptosis, has prompted a multidimensional reappraisal of the pathological mechanisms of this disease [6,7]. Nevertheless, the role of cuproptosis, a recently defined mode of programmed cell death, in acute pancreatitis remains entirely unexplored.
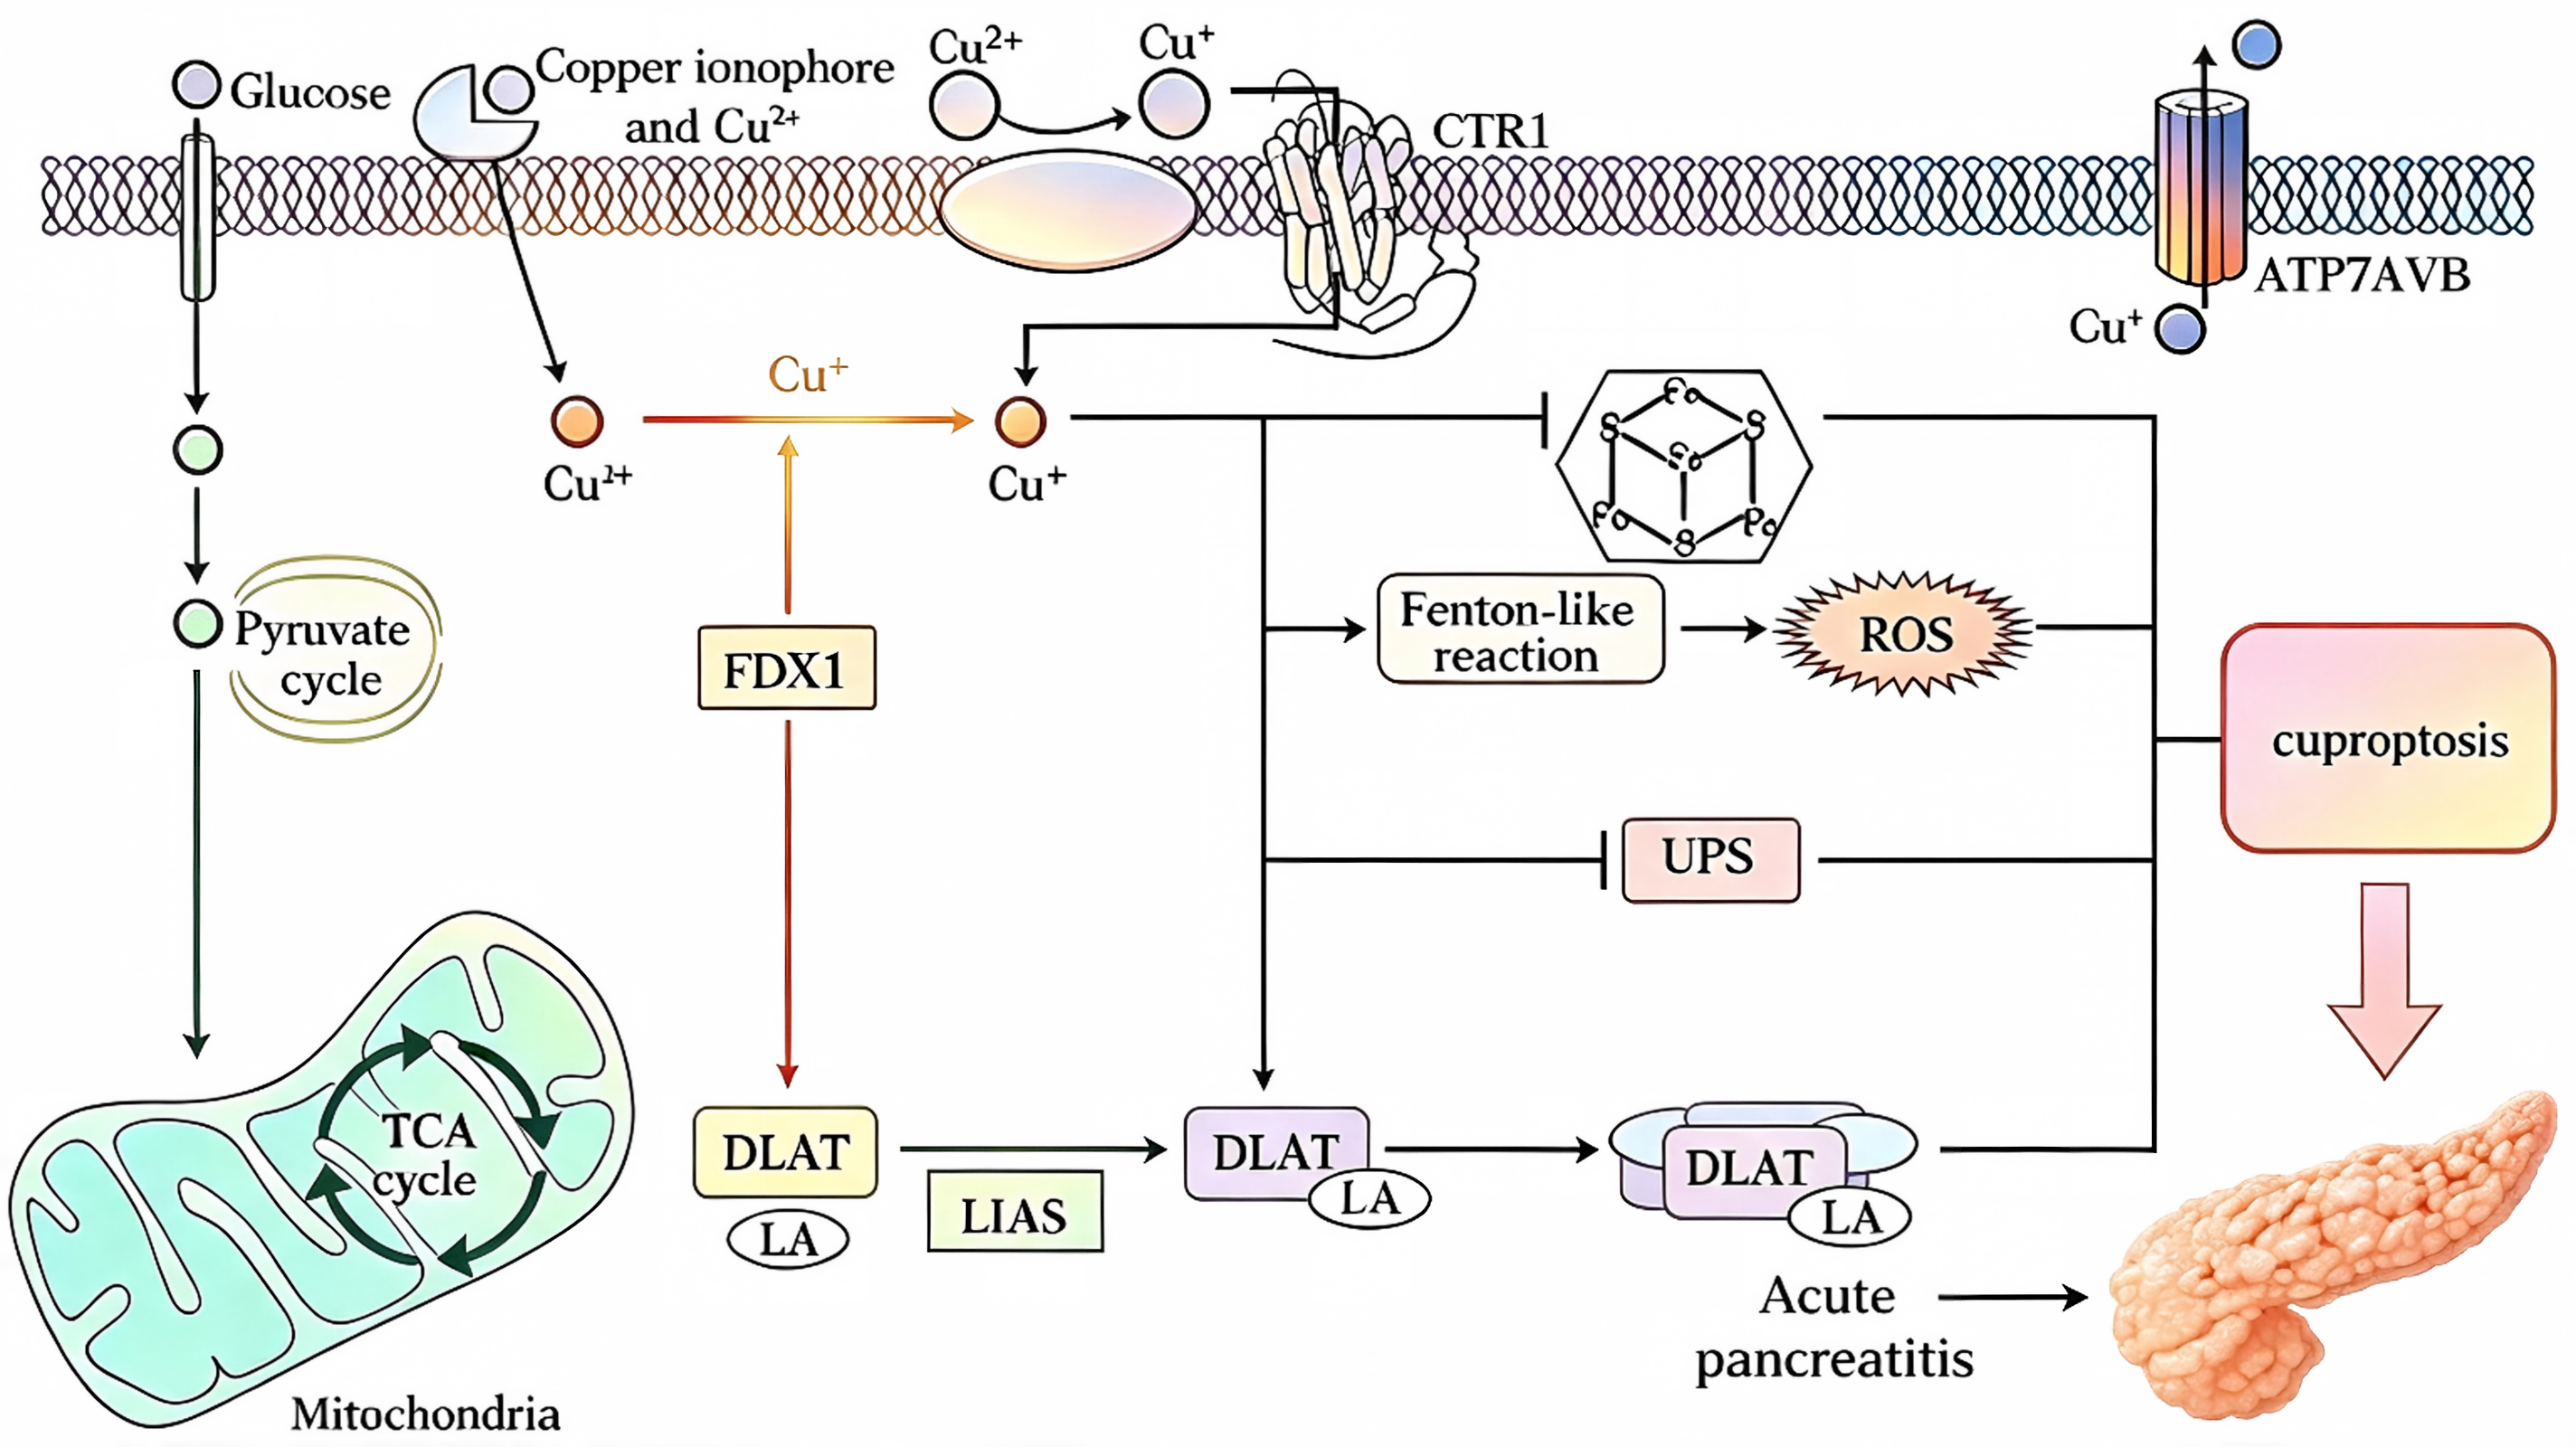
Cuproptosis is a distinct cell death pathway driven by excessive copper accumulation and dependent on mitochondrial respiration. The core mechanism involves copper binding directly to lipoylated TCA cycle enzymes such as DLAT, leading to aberrant protein lipoylation and the loss of iron–sulfur cluster proteins, which ultimately causes mitochondrial dysfunction and cell death [8,9,10]. Since Tsvetkov et al. first described this pathway in Science (2022), cuproptosis has attracted intense interest across oncology, neurodegeneration, and inflammation research [11,12]. In inflammatory contexts, multiple connections between cuproptosis and cellular stress responses have been documented. Oxidative stress promotes the release of copper ions from metalloproteins, and the resulting increase in free copper further amplifies reactive oxygen species (ROS) generation [13,14]. Mitochondrial dysfunction is a central event in cuproptosis; copper accumulation impairs the activity of electron transport chain complexes, suppresses ATP synthesis, and disrupts the mitochondrial membrane potential [15,16]. Copper overload also activates endoplasmic reticulum (ER) stress, evidenced by upregulation of the unfolded protein response and disruption of intracellular calcium homeostasis [15]. Aberrant calcium release can activate calcineurin and inflammatory transcription pathways such as NF-κB [17]. Furthermore, aberrant modifications of cuproptosis-related proteins may serve as damage signals that promote NLRP3 inflammasome assembly and pro-inflammatory cytokine release [18,19]. These mechanisms have been preliminarily validated in other disease models, suggesting a complex bidirectional interplay between cuproptosis and inflammatory signaling.
It should be noted that cuproptosis is not only regulated by the intracellular copper metabolic network but may also be influenced by exogenous inflammatory signals, through which alterations in copper transporter expression, mitochondrial metabolic reprogramming, and elevated oxidative stress levels are induced; favorable cellular niches for cuproptosis are thereby created [20]. Notably, acute pancreatitis is characterized by intense local and systemic inflammatory responses; macrophage infiltration in pancreatic tissue, massive release of pro-inflammatory cytokines, and mitochondrial dysfunction are all highly overlapped with the triggering conditions of cuproptosis [21,22]. However, whether acinar cells undergo cuproptosis driven by the inflammatory microenvironment and whether susceptibility to cuproptosis differs among pancreatic cell types remain critical unanswered questions.
Therefore, in this study, we utilized single-cell transcriptome sequencing (scRNA-seq) and transcriptomic data from independent cohorts to systematically delineate the cell-type specificity, temporal dynamics, and transcriptional regulatory networks of cuproptosis in acute pancreatitis (AP). Building on these analyses, we conducted multi-level experimental validation using animal and cellular models to provide new experimental evidence for the mechanistic understanding of acinar cell injury in AP from the perspective of cell death regulation.
2. Results
2.1. Single-Cell Transcriptomic Atlas of Acute Pancreatitis
To systematically dissect how distinct cell types respond to cuproptosis in acute pancreatitis (AP), we analyzed the GSE279876 single-cell RNA-sequencing dataset. After quality control and Harmony-based batch correction, 36,794 high-quality cells were retained. The UMAP dimensionality reduction plot (resolution = 0.5) showed that cells from the NFD and AP groups were evenly intermingled, indicating satisfactory batch correction (Figure 1A).
Cells were annotated into 10 major types—acinar cells, ductal cells, neutrophils, macrophages, fibroblasts, endothelial cells, T/NK cells, B cells, stellate cells, and others—by combining SingleR automatic annotation with manual curation based on canonical marker genes (Figure 1B). The dot plot displayed the expression of characteristic marker genes in each subpopulation, with high Prss1/Cela1 in acinar cells, Krt19 in ductal cells, S100a8/S100a9 in neutrophils, and Cd68/Apoe in macrophages (Figure 1C). The heatmap further illustrated global expression patterns of these markers, consistent with the dot plot results (Figure 1D). Feature plots confirmed that Prss1, Krt19, and S100a8 were specifically expressed in their respective subpopulations with minimal cross-expression (Figure 1E). A stacked bar plot of cell proportions revealed that the neutrophil fraction in the AP group increased substantially from approximately 2% in the NFD group to about 18%, accompanied by a rise in macrophages and a relative decline in acinar cells, consistent with the neutrophilic infiltration typical of acute pancreatitis Figure 1F).
2.2. Cell-Type-Specific Activation of the Cuproptosis Pathway
To evaluate the activation status of the cuproptosis pathway across different cell types, we calculated a cuproptosis pathway activity score for each cell using the AUCell algorithm, based on the 13 core cuproptosis-related genes defined by Tsvetkov et al. (Fdx1, Lias, Lipt1, Dld, Dlat, Pdha1, Pdhb, Mtf1, Gls, Cdkn2a, Slc31a1, Atp7a, Atp7b). UMAP overlay plots revealed pronounced regional enrichment of the cuproptosis pathway score in specific cell subpopulations, with acinar cells showing the highest scores, indicating selective pathway activation in this population (Figure 2A). Violin plots comparing the score distribution across cell types confirmed that acinar cells had significantly higher cuproptosis pathway scores than other cell types, while ductal cells, neutrophils, and macrophages exhibited relatively lower scores (Figure 2B). Bubble plots of the average expression of the 13 core cuproptosis genes across cell types showed higher abundance of most genes in acinar cells compared to other cell types (Figure 2C). Split bubble plots of expression changes in acinar cells by experimental group revealed generally higher expression of each gene in the AP group relative to the NFD group, indicative of systemic cuproptosis pathway activation in acinar cells under acute pancreatitis conditions (Figure 2D). Heatmaps of the expression patterns of the 13 core cuproptosis genes across cell types (red, high expression; blue, low expression) displayed a distinct high-expression region in acinar cells, validating the cell-type specificity of the cuproptosis pathway (Figure 2E). Within the acinar cell population, all 13 cuproptosis genes were upregulated in the AP group compared to the NFD group, with eight reaching statistical significance (adjusted p < 0.05). The most prominently changed genes were Gls (log2FC = 4.15) and Fdx1 (log2FC = 1.96). Additionally, Pdha1, Dlat, Pdhb, Lias, Dld, and Slc31a1 were significantly upregulated. These genes span key steps including copper uptake (Slc31a1), effector molecules (Fdx1), target complexes (PDC subunits), and metabolic reprogramming (Gls), indicating systemic activation of the cuproptosis pathway in acinar cells under AP conditions. Split violin plots of cuproptosis pathway scores in AP and NFD acinar cells showed significantly higher scores in the AP group, confirming that acute pancreatitis specifically activates the cuproptosis pathway in acinar cells (Figure 2F).To explore the downstream biological functions of cuproptosis-related signalling pathways, we stratified acinar cells into high- and low-cuproptosis-score groups based on the median cuproptosis pathway score and performed enrichment analysis of differentially expressed genes. Gene Ontology (GO) biological process (BP) enrichment analysis showed that differentially expressed genes in the high-score group were significantly enriched in regulation of apoptotic signalling pathways, immune cell activation and differentiation, and regulation of nucleic acid and protein metabolism (including regulation of mRNA metabolic processes, regulation of RNA splicing, and protein complex assembly) (Figure 2G). KEGG enrichment analysis further indicated that differentially expressed genes were mainly enriched in immune and inflammatory signalling pathways (PI3K-Akt, Toll-like receptor, chemokine, and C-type lectin receptor signalling) and in processes related to cytoskeletal and cell adhesion regulation (Figure 2H).
2.3. WGCNA Identifies Cuproptosis-Associated Modules
To systematically dissect the co-expression network architecture of cuproptosis related genes in acute pancreatitis, we applied high-dimensional weighted gene co-expression network analysis (hdWGCNA) to construct a gene co-expression network. Soft-thresholding analysis showed that a power of β = 12 yielded a high scale-free fit index (R2 > 0.85) while preserving mean connectivity, thereby satisfying the scale-free topology criterion and justifying subsequent module identification (Figure 3A).
With this soft threshold, we built a co-expression network from the 6,101 highly variable genes and performed hierarchical clustering based on the topological overlap matrix. The gene dendrogram displayed the expected hierarchical organization by expression similarity; the dynamic tree-cutting algorithm identified 10 co-expression modules, denoted by distinct colour bands (Figure 3B). UMAP visualization overlaid with module eigengene activity scores revealed that the modules occupied distinct regions of the UMAP space, and several modules exhibited pronounced activity enrichment in particular cell subsets, implying preferential association with specific cell types or functional states (Figure 3C). The module–trait correlation heatmap revealed that the red and brown modules were significantly positively correlated with both AP status and cuproptosis score (Spearman correlation coefficient > 0.6, p < 0.001), implicating them in synergistic cuproptosis activation during acute pancreatitis (Figure 3D). Closer inspection of the gene composition showed that the turquoise module was enriched for immune/inflammatory response genes, and the key cuproptosis regulators Gls (encoding glutaminase) and Atp7a (encoding a copper-transporting ATPase) both mapped to this module, indicating potential transcriptional co-regulation between cuproptosis and inflammatory programmes. Additionally, the upstream core cuproptosis regulator Fdx1 was found exclusively in the blue module, which was mainly enriched for ribosomal protein genes, suggesting that Fdx1 may contribute to AP pathogenesis through an independent transcriptional.
2.4. Acinar Cell Injury Trajectory and Temporal Dynamics of Cuproptosis
To investigate the dynamic relationship between cuproptosis activation and the progression of acinar cell injury, we extracted all acinar cells (n=10,155) and constructed a pseudotime trajectory using Monocle3. Setting the centroids of control cells as the origin caused pseudotime values to increase progressively from the normal toward the injured state. In two-panel UMAP plots, the left panel colored by pseudotime showed a continuous transition of acinar cells from low to high values along the trajectory, while the right panel colored by sample group demonstrated that AP cells concentrated in high-pseudotime regions and NFD cells localized predominantly in low-pseudotime regions (Figure 4A). A LOESS locally weighted regression curve was fitted to visualize the trend of cuproptosis pathway scores across pseudotime. The scatter plot revealed that cuproptosis scores rose steadily with increasing pseudotime, and the narrow 95% confidence interval of the fit indicated high robustness of this trend (Figure 4B).This gradual upward pattern suggests that cuproptosis is not abruptly triggered at a single time point but instead intensifies in parallel with the stepwise aggravation of acinar cell injury. Multi-panel UMAP plots displayed the expression distributions of representative core cuproptosis genes along the pseudotime trajectory. These results showed marked upregulation of genes including Gls, Fdx1, Pdha1, Dlat, Slc31a1, and Lias in high-pseudotime (AP-enriched) regions, while their expression remained relatively low in low-pseudotime regions (Figure 4C). A spatial autocorrelation test (graph_test) confirmed that expression changes of these cuproptosis-related genes exhibited significant pseudotime dependence (p < 0.001), reinforcing the tight coupling between cuproptosis pathway activation and acinar cell injury progression. To further evaluate how the differentiation status of acinar cells varied along pseudotime, we computed individual cell stemness scores using the CytoTRACE algorithm. UMAP plots overlaid with CytoTRACE scores revealed that cells in the high-pseudotime region possessed higher stemness scores, indicating lower differentiation, whereas cells in the low-pseudotime region showed comparatively lower differentiation potential (Figure 4D). These findings suggest that, under AP conditions, acinar cells may concurrently undergo dedifferentiation or lineage reprogramming alongside progressive activation of the cuproptosis pathway.
2.5. Transcriptional Regulatory Network of Cuproptosis
To dissect the upstream transcriptional regulatory mechanisms of cuproptosis pathway activation, we collected known transcription factors (TFs) upstream of the core cuproptosis genes from the DoRothEA database (evidence levels A, B, and C) and inferred single-cell TF activity using the decoupleR tool. A heatmap of the average activity of the top 30 most variable TFs in acinar cells, grouped by cell type, revealed extensive differences in TF activity between the AP and NFD groups, with several TFs showing markedly increased or decreased activity in the AP group, suggesting a global transcriptional reprogramming of acinar cells under AP conditions (Figure 5A).By integrating TFs with direct regulatory links to the 13 core cuproptosis genes from DoRothEA, we identified 11 TFs that directly regulate cuproptosis genes. A heatmap of the average activity distribution of these 11 TFs across cell types demonstrated cell-type-specific activity patterns: Spi1 showed the highest activity in macrophages and neutrophils, whereas Myc and Ppara were relatively more active in acinar and ductal cells, indicating that cuproptosis transcriptional regulation is cell-type-dependent (Figure 5B). A horizontal bar plot of the activity differences of these 11 cuproptosis-related TFs between AP and NFD acinar cells revealed that Spi1 (PU.1) activity was substantially elevated in the AP group and reached statistical significance (adjusted p < 0.05); its regulatory links to Gls and Mtf1 were the most well-defined, suggesting that Spi1 serves as a key upstream activator of the cuproptosis pathway. Furthermore, the activities of Fos and Jun (AP-1 complex) were also significantly increased, consistent with the known activation of NF-κB in AP, and the AP-1 complex was predicted to regulate Pdha1 expression. Vdr activity was also significantly upregulated in the AP group. In contrast, Myc activity showed a slight downward trend in the AP group, possibly reflecting the suppression of proliferative programmes. The remaining TFs, such as Hnf4a and Foxa2, did not exhibit significant changes (Figure 5C).
2.6. Remodeling of Cell-Cell Communication in Acute Pancreatitis
To investigate how acinar cells exhibiting cuproptosis activation reshape the microenvironment through signaling molecules in acute pancreatitis, we employed the CellChat algorithm to compare intercellular signaling networks between the NFD and AP groups. The bar plot indicated that both the total communication strength and the number of communication events were significantly greater in the AP group than in the NFD group (Figure 6A). A stacked bar plot of the relative activity (contribution) of each signaling pathway in the NFD and AP groups showed that the proportional contributions of multiple inflammation- and injury-related pathways were markedly altered in AP; among them, the MIF, CCL, Annexin, and Galectin pathways contributed substantially more, indicating their likely involvement in remodeling intercellular communication under AP conditions (Figure 6B).
The differential chord diagram comparing NFD and AP groups (left semicircle, NFD; right semicircle, AP) demonstrated that intercellular interactions were markedly enhanced in the AP group, as reflected by more numerous and wider chords, pointing to a substantial rise in overall communication activity in the acute pancreatitis state (Figure 6C). We next performed decomposition analysis on the signaling pathways whose activity was significantly elevated in the AP group. The MIF pathway chord diagram indicated that ligand–receptor interaction strength between macrophages and neutrophils was notably increased, implying that this pathway may contribute to the synergistic activation of innate immune cells (Figure 6D). The CCL chemokine pathway chord diagram displayed dense communication connections among multiple immune cell types, consistent with active immune cell recruitment in acute pancreatitis (Figure 6E). The Annexin pathway chord diagram indicated that this pathway primarily mediated communication between acinar cells and macrophages, and its alterations may be linked to the clearance of dead cells (Figure 6F). The Galectin pathway chord diagram similarly showed predominant communication between acinar cells and immune cells, suggesting a role in transmitting cell injury-related signals (Figure 6G). Collectively, the differential changes in these four pathways revealed how acinar cells with cuproptosis activation simultaneously modulate the functional states of neighboring immune and stromal cells through multiple signaling molecules.
2.7. Independent Validation Using a Single-Cell Dataset
To validate the above core findings and rule out dataset-specific bias, we analysed an independent single-cell dataset GSE188819 from a mouse acute pancreatitis model induced by caerulein, which comprised CER-treated and WT control groups. Two-panel UMAP plots showed the annotated cell types and group distributions; the left panel, coloured by cell type annotation, revealed a composition consistent with the primary dataset, while the right panel, coloured by sample group, displayed the distribution of CER and WT cells in UMAP space (Figure 7A).UMAP plots overlaid with cuproptosis pathway scores revealed a pronounced dark-colour enrichment in acinar cell regions in the CER group, whereas the WT controls showed overall lighter shading, indicating markedly elevated pathway activity under AP conditions (Figure 7B). Stacked bar plots of cell type proportions between groups showed a marked increase in immune cells (neutrophils, macrophages, etc.) and a relative decrease in acinar cells in the CER group, consistent with the compositional shifts observed in the primary dataset (Figure 7C). Bubble plots comparing core cuproptosis gene expression between CER and WT groups showed that Gls, Fdx1, Pdha1, Dlat, Slc31a1, and Lias all exhibited upward trends in both the percentage of expressing cells and average expression level in acinar cells of the CER group (Figure 7D). Cell-type-stratified box plots of cuproptosis pathway scores indicated that in the CER group, the median score in acinar cells was significantly higher than in other cell types and showed the greatest elevation relative to WT controls (Figure 7E). Violin plots of the score distributions further confirmed the specific enrichment of cuproptosis activity in acinar cells, complementing the box plot findings (Figure 7F). UMAP plots coloured by gene activity scores for each co-expression module revealed distinct spatial enrichment patterns, with the cuproptosis-related module displaying the highest activity in acinar cell regions (Figure 7G). Multi-panel UMAP plots of representative core cuproptosis genes (Gls, Fdx1, Pdha1, Dlat) each showed pronounced high-expression enrichment in acinar cell regions, further validating the primary dataset finding that cuproptosis genes are specifically upregulated in acinar cells (Figure 7H). Collectively, cross-validation using the independent GSE188819 dataset confirmed the robustness and reproducibility of acinar cell cuproptosis activation, ruling out any possibility that the core conclusions stemmed from dataset-specific bias in the primary dataset.
2.8. External Validation Using a Human Clinical Transcriptomic Dataset
To further evaluate the clinical relevance and diagnostic potential of cuproptosis in human acute pancreatitis, we analysed the whole-blood transcriptomic dataset GSE194331, which included 32 healthy controls, 79 patients with acute pancreatitis, and 8 patients with pancreatitis complicated by sepsis. The volcano plot depicted genome-wide differential expression between acute pancreatitis patients and healthy controls, with red dots marking significantly upregulated genes and blue dots marking significantly downregulated genes. Analysis revealed that multiple cuproptosis-related genes, including GLS, FDX1, and SLC31A1, displayed significant expression alterations in the peripheral blood of acute pancreatitis patients, with certain genes trending upward (Figure 8A).
The heatmap of the 13 core cuproptosis genes across all 119 human samples illustrated expression patterns, where red denoted high expression and blue denoted low expression. In the acute pancreatitis group, multiple cuproptosis genes showed enrichment of high-expression (red) signals, whereas healthy controls predominantly exhibited low-expression (blue) patterns. The expression pattern in the pancreatitis with sepsis group resembled that of the acute pancreatitis group, but with even higher levels for some genes, suggesting a coordinated upregulation signature of cuproptosis genes under disease conditions (Figure 8B). Boxplots of representative cuproptosis genes illustrated expression level distributions across the three sample groups: healthy controls, acute pancreatitis, and pancreatitis with sepsis (Figure 8C). Grouped boxplots comparing the three groups revealed that expression levels of genes such as GLS, FDX1, DLAT, and SLC31A1 increased stepwise from healthy controls to acute pancreatitis to pancreatitis with sepsis, indicating a progressive rise with disease severity (Figure 8D). This gradient pattern indicated that cuproptosis genes might not only distinguish disease status but also reflect the degree of disease progression. We assessed the diagnostic performance of cuproptosis genes in discriminating acute pancreatitis patients from healthy controls using receiver operating characteristic (ROC) curve analysis. These curves revealed that several cuproptosis genes had high area under the curve (AUC) values: DLD MTF1 (0.819), SLC31A1 (0.798), FDX1 (0.705), and PDHA1 (0.703), all indicative of good diagnostic potential and suachieved the highest AUC (0.929), followed by DLAT (0.888), GLS (0.838), PDHB (0.827),pporting the use of cuproptosis-related genes as potential biomarkers for acute pancreatitis (Figure 8E).
2.9. Phenotypic Validation of Cuproptosis and TTM Rescue Effects in a Mouse Model of Severe Acute Pancreatitis
To validate the cuproptosis signals identified by single-cell sequencing at the organismal level, we established a caerulein-induced severe acute pancreatitis (SAP) mouse model and administered the copper chelator TTM as an intervention. Haematoxylin and eosin staining revealed that pancreatic tissues from the SAP group exhibited marked interstitial oedema, inflammatory cell infiltration, and disruption of acinar cell architecture, all of which were significantly ameliorated by TTM intervention (Figure 9A). Histopathological scoring and quantitative analysis of oedema further confirmed the attenuating effect of TTM on pancreatic tissue injury (Figure 9B). Along with the histological damage, serum amylase and lipase activities were markedly elevated in the SAP group, whereas TTM treatment significantly reduced both enzyme levels (Figure 9C). Serum cytokine measurements showed that TNF-α, IL-1β, and IL-6 levels were substantially increased in the SAP group, and TTM intervention led to significant decreases in these inflammatory factors (Figure 9D).MPO immunofluorescence staining of pancreatic tissues demonstrated a pronounced increase in neutrophil infiltration in the SAP group, while the intensity of MPO-positive signals was markedly diminished in the TTM-treated group (Figure 9E).
Collectively, these results indicate that the SAP mouse model was successfully established, and that TTM effectively alleviates pancreatic tissue injury and systemic inflammatory responses. Immunoblotting analysis revealed that the protein expression levels of FDX1 and DLAT were significantly upregulated in the pancreatic tissues of the SAP group, and both were markedly reduced following TTM intervention (Figure 9F). Immunohistochemical staining further corroborated this trend at the tissue level, with markedly enhanced immunoreactive signals for FDX1 and DLAT in the SAP group, whereas the staining intensity was notably diminished in the TTM group (Figure 9G). FDX1 and DLAT are core effector molecules of the cuproptosis pathway; their coordinated upregulation in SAP pancreatic tissues suggests that the cuproptosis pathway is systemically activated in the SAP model, and that TTM intervention effectively reverses this molecular event. Inductively coupled plasma mass spectrometry (ICP-MS) measurements showed that the total copper content in pancreatic tissues was significantly higher in the SAP group compared with the control group, and TTM treatment markedly reduced pancreatic copper levels (Figure 9H). Copper ions are the essential upstream trigger for cuproptosis; the substantial elevation of copper content in SAP pancreatic tissues provides the material basis for cuproptosis induction, while the copper-chelating action of TTM blocks this process at its source. Taken together, these histopathological, serological, immunological, and molecular biological lines of evidence confirm the presence of copper overload and cuproptosis pathway activation in the pancreatic tissues of SAP mice, and demonstrate that the copper chelator TTM effectively intervenes in this pathological process.
2.10. In Vitro Phenotypic Validation of Cuproptosis in Acinar Cells and TTM Rescue Effects
To further confirm the occurrence of cuproptosis at the acinar cell level while excluding confounding systemic inflammatory responses in vivo, we isolated primary murine acinar cells, established a caerulein-induced injury model, and treated them with TTM. Flow cytometric analysis revealed that the apoptosis rate in the SAP group was markedly higher than that in the control group, and TTM intervention significantly reduced this rate, indicating a direct protective effect on acinar cells (Figure 10A). Transmission electron microscopy showed normal mitochondrial morphology in control acinar cells, with well-preserved, clearly defined cristae arranged in a lamellar pattern and distinct bilayer membrane boundaries. In contrast, acinar cells in the SAP group exhibited typical cuproptosis-associated ultrastructural changes: mitochondria were markedly shrunken and smaller, with most cristae absent or disrupted, increased matrix electron density, blurred bilayer membranes, and some showing vacuolar degeneration (Figure 10B). These morphological features were highly consistent with the cuproptosis-related mitochondrial damage phenotype reported by Tsvetkov et al. (2022) in Science. In the TTM-treated group, mitochondrial structural damage was substantially alleviated, with partial restoration of cristae architecture. Collectively, these results provide the first direct ultrastructural evidence of cuproptosis-like mitochondrial changes in acinar cells in acute pancreatitis, supporting the involvement of cuproptosis in SAP pathogenesis.We measured intracellular copper accumulation in acinar cells using flow cytometry and immunofluorescence staining. Flow cytometry demonstrated that copper fluorescence intensity in SAP acinar cells was markedly higher than in control cells, and TTM treatment significantly reduced this signal (Figure 10C).
Immunofluorescence staining confirmed this enrichment at the single-cell level, revealing markedly enhanced copper fluorescence in SAP cells that was significantly attenuated after TTM treatment (Figure 10D). Copper ions are the critical upstream initiators of cuproptosis; the marked accumulation of copper in SAP acinar cells therefore supplies the requisite trigger for the pathway, and the copper-chelating action of TTM blocks this initiation step directly at the cellular level.Immunofluorescence staining was used to assess the expression of the core cuproptosis regulatory proteins FDX1 and DLAT in acinar cells. FDX1 fluorescence signals were significantly stronger in SAP acinar cells than in control cells, and TTM intervention markedly reduced FDX1 expression (Figure 10E). DLAT expression exhibited a similar trend, with substantially enhanced fluorescence in the SAP group and a notable decrease after TTM treatment (Figure 10F). FDX1 and DLAT are core executioners in the cuproptosis pathway. FDX1 reduces Cu2+ to Cu+, which then directly binds to and induces aberrant oligomerization of DLAT; their coordinated upregulation in SAP acinar cells further confirms specific activation of the cuproptosis pathway at the cellular level.In summary, based on apoptosis assays, ultrastructural analysis, copper accumulation measurements, and cuproptosis marker expression, we conclude that caerulein directly induces cuproptosis in acinar cells and that TTM effectively rescues this cell death at the cellular level, providing a direct cytological mechanistic explanation for the in vivo protective effects of TTM.
2.11. In Vitro Phenotypic Validation of Cuproptosis-Related Mitochondrial Dysfunction and Oxidative Stress and TTM Rescue Effects
To determine how cuproptosis activation alters mitochondrial function and redox status in acinar cells, we measured mitochondrial membrane potential, ATP content, ROS levels, and antioxidant defense parameters in each group. JC-1 flow cytometry showed a significant decline in mitochondrial membrane potential in SAP acinar cells, indicated by a smaller proportion of PE-H-positive cells and a larger proportion of FITC-A-positive cells; TTM treatment markedly restored this potential (Figure 11A).
Aligned with the loss of mitochondrial membrane potential, ATP levels in SAP acinar cells were substantially lower than in controls, and TTM treatment significantly increased them (Figure 11B). Mitochondrial membrane potential is the principal driver of ATP synthesis via oxidative phosphorylation; the synchronous decline of both parameters in SAP acinar cells indicates that cuproptosis causes profound mitochondrial bioenergetic failure, and that TTM-mediated copper chelation preserves mitochondrial energy production.We next examined oxidative stress in these cells. DCFH-DA staining showed that total ROS levels were significantly higher in SAP acinar cells than in controls, and TTM markedly reduced total ROS (Figure 11C). MitoSOX detection of mitochondrial superoxide revealed substantially elevated mitochondrial ROS in the SAP group, which were significantly attenuated by TTM (Figure 11D). Mitochondria represent the primary source of intracellular ROS; cuproptosis-induced mitochondrial injury invariably causes electron leakage from the respiratory chain, spurring a burst of mtROS. The coordinated rise in total ROS and mtROS points to mitochondria as the main origin of oxidative stress in SAP cells, and demonstrates that TTM curbs excessive ROS production at its source by preserving mitochondrial integrity.Measurement of lipid peroxidation end-products revealed markedly higher levels of MDA and 4-HNE in SAP acinar cells compared to controls, and TTM significantly lowered both (Figure 11E, F). MDA and 4-HNE are terminal breakdown products of ROS-attacked polyunsaturated fatty acids; their accumulation directly indicates the extent of oxidative damage to cell membranes, providing further support for cuproptosis-related oxidative injury.Evaluation of the antioxidant system revealed that the ratio of reduced to oxidized glutathione (GSH/GSSG) was significantly lower in SAP acinar cells than in controls, and TTM treatment substantially restored this ratio (Figure 11G). Total superoxide dismutase (T-SOD) activity was markedly lower in the SAP group than in controls, and TTM treatment significantly rescued SOD activity (Figure 11H). The GSH/GSSG ratio is a key metric of intracellular redox status; its decline signals that copper overload depletes the reduced glutathione pool. SOD serves as the first line of defense against superoxide; diminished SOD activity further amplifies oxidative damage. TTM restored the cellular antioxidant defense by curtailing the ongoing copper influx.Integrating the evidence across mitochondrial membrane potential, ATP synthesis, ROS burst, lipid peroxidation, and antioxidant exhaustion, we conclude that SAP acinar cells undergo severe mitochondrial dysfunction and oxidative injury upon cuproptosis activation, with the two processes reinforcing each other in a vicious cycle. By chelating copper ions and preventing cuproptosis pathway initiation, TTM simultaneously preserves mitochondrial functional integrity and attenuates the cascade amplification of oxidative stress at its source.
3. Discussion
Since cuproptosis was first defined by Tsvetkov et al. in 2022, it has attracted considerable interest across fields such as oncology, neurodegenerative diseases, and ischaemia–reperfusion injury [23,24,25]. Cuproptosis, a unique programmed cell death modality, depends on the direct binding of copper ions to lipoylated enzymes of the tricarboxylic acid (TCA) cycle; its execution is closely associated with mitochondrial metabolic status and intracellular redox balance [26]. Recent studies suggest a bidirectional interplay between copper metabolism and inflammatory responses: inflammatory signals can promote copper influx by upregulating copper transporter expression, while copper ions themselves can activate pro-inflammatory signalling pathways and induce oxidative stress. This interaction has received preliminary validation in animal models of infectious and metabolic inflammation [27,28]. The pathological hallmarks of acute pancreatitis include aberrant intra-acinar trypsinogen activation, a pronounced local and systemic inflammatory storm, and synergistic activation of oxidative and endoplasmic reticulum (ER) stress; however, whether these changes are linked to disturbances in copper metabolism that trigger cuproptosis remains unclear [29,30,31]. Prior studies on acinar cell death in acute pancreatitis have concentrated on necrosis, apoptosis, pyroptosis, and ferroptosis [32]. The present study is the first to establish a direct link between cuproptosis and acinar cell injury in acute pancreatitis at single-cell resolution, systematically revealing the selective activation of the cuproptosis pathway in acinar cells and its dynamic evolution during disease progression. In vitro and in vivo experiments further confirm that copper accumulation and the coordinated upregulation of FDX1 and DLAT proteins are integral to pancreatitis-associated acinar cell injury. These findings address a gap in knowledge concerning cuproptosis in acute pancreatitis and provide new experimental evidence for understanding the molecular basis of acinar cell injury within the inflammatory microenvironment.
Upon entering cells, copper ions are imported via SLC31A1. Inside the cell, Cu2+ is reduced to Cu+ by FDX1; the Cu+ then binds to lipoacylated DLAT in the tricarboxylic acid (TCA) cycle, inducing aberrant protein oligomerization and loss of iron-sulfur cluster proteins [33]. This reductive activation represents a critical rate-limiting step in the initiation of cuproptosis. In the present study, severe acute pancreatitis (SAP) acinar cells exhibited markedly elevated copper content and synchronous upregulation of FDX1 and DLAT protein levels. FDX1, the enzyme that reductively activates copper, may be upregulated in response to the elevated copper load, reflecting a compensatory enhancement that accelerates copper reduction [34]. The upregulation of DLAT, a direct binding target of copper ions, may expand the pool of lipoacylated substrates available for copper attack [35]. The concurrent upregulation of both components under copper overload suggests that, during acute inflammation, acinar cells may upregulate key elements of the cuproptosis pathway to cope with copper stress; paradoxically, this compensatory response renders them more susceptible to cuproptosis, establishing a potential pathological positive feedback loop. Clear experimental evidence indicates that excessive copper accumulation damages mitochondrial ultrastructure. Cu+ binding to lipoacylated DLAT induces aberrant protein oligomerization, which disrupts proteostasis in the mitochondrial matrix and subsequently leads to progressive destruction of the inner mitochondrial membrane and cristae [36]. Ex vivo studies have consistently shown that copper ions directly cause mitochondrial cristae fracture, matrix dissolution, and loss of membrane integrity [37]. The mitochondrial shrinkage, cristae disappearance, and blurred outer membrane observed in SAP acinar cells in this study are consistent with these reported morphological features. Given that the copper ions in this study originated from endogenous accumulation rather than exogenous supplementation, this morphological congruence indicates that the final pattern of mitochondrial structural damage is similar irrespective of how copper ions enter the mitochondrial microenvironment.
Previous studies have established an association between cuproptosis activation and disease severity [38]. Zhang et al. developed a prognostic risk model for lung adenocarcinoma based on cuproptosis- and immune-related genes and demonstrated that patients in the high-risk group had significantly lower survival rates, reduced immune infiltration, and lower immune checkpoint expression than those in the low-risk group [39]. Chong et al. constructed a cuproptosis signature risk scoring system for gastric cancer using transcriptomic data from 16 cuproptosis-related genes and found that patients in the low-risk score group not only achieved significantly superior overall survival but also exhibited a higher tumor mutational burden than the high-risk group [40]. However, the association between cuproptosis and the progression of acute pancreatitis has not been previously reported. In this study, pseudotime analysis revealed a monotonically increasing cuproptosis score as acinar cells transitioned from a normal to an injured state. Meanwhile, data from a human clinical cohort showed a stepwise elevation in the expression levels of cuproptosis-related genes across the three groups: healthy controls, acute pancreatitis, and pancreatitis complicated by sepsis. These two independent lines of evidence—one derived from single-cell dynamic tracing and the other from cross-sectional comparisons of population samples—collectively demonstrate that the activation level of cuproptosis is coupled with the severity of acute pancreatitis. This finding suggests that cuproptosis is not merely a bystander in the disease process but may directly contribute to the progression of acinar cell injury.
The reciprocal regulation between inflammation and copper metabolism has been established in multiple experimental systems. TNF-α upregulates SLC31A1 expression and promotes copper influx in various cell types [18]; IL-1β and IL-6 have also been shown to modulate copper transporter transcription via the STAT3/NF-κB pathway [41]. Conversely, elevated intracellular copper levels can activate the NLRP3 inflammasome and the MAPK pathway, thereby exacerbating the release of pro-inflammatory cytokines [42]. However, these studies have primarily focused on macrophages and tumour cells, and whether inflammatory signals drive the transcriptional upregulation of cuproptosis-related genes in acinar cells remains unexplored. In the present study, we observed a simultaneous increase in inflammatory cytokines and upregulation of key cuproptosis genes in caerulein-stimulated acinar cells. Based on these findings, transcription factor activity inference identified Spi1, Fos, and Jun as potential upstream regulators of core cuproptosis genes. Spi1, a master transcription factor for myeloid cell differentiation and inflammatory responses, directly binds to PU.1-binding motifs in the promoters of various pro-inflammatory genes [43]. In macrophages, Spi1 drives the transcription of pro-inflammatory cytokines upon stimulation with TNF-α and TLR ligands [44]. In our study, Spi1 activity was significantly elevated under AP conditions, and cell-cell communication analysis revealed enhanced inflammatory signalling pathways between Spi1-high myeloid cells and acinar cells, suggesting that Spi1 may act as an intermediary linking inflammatory signals to transcriptional responses in acinar cells. Fos and Jun form the AP-1 complex, classical downstream effectors of TNF-α and IL-1β, and induce target gene transcription in response to MAPK and JNK pathway activation in various cell types [45]. The AP-1 complex has been implicated in regulating stress- and inflammation-related genes in pancreatic acinar cells [46]. Collectively, the concurrence of elevated inflammatory cytokines and cuproptosis activation, the altered transcription factor activities, and the documented roles of Spi1 and AP-1 in inflammatory transcriptional regulation lead us to propose that the inflammatory microenvironment may establish a transcriptional milieu permissive for cuproptosis initiation in acinar cells, mediated by transcription factors such as Spi1 and AP-1. Spi1 may act through direct binding to cuproptosis gene promoters, whereas AP-1 may contribute via inflammatory signals through the MAPK/JNK pathway.
Previous studies have repeatedly confirmed the association between cuproptosis and mitochondrial dysfunction. Copper ions attack lipoylated enzymes in the tricarboxylic acid (TCA) cycle, directly impairing the function of respiratory chain complexes and disrupting electron transfer [47]. When the respiratory chain is damaged, obstructed electron flow diminishes the proton-motive force, leaving ATP synthase unable to maintain normal ATP output. Simultaneously, electrons stalled at complexes I and III of the electron transport chain readily reduce molecular oxygen to superoxide, a major source of mitochondrial ROS [48]. Copper-driven disruption of the TCA cycle also lowers the yield of NADH and FADH2, further restricting electron supply and perpetuating respiratory chain impairment [49]. These mechanistic links have been substantiated in multiple cell types, and the concurrent ATP depletion, mitochondrial membrane potential collapse, and mtROS burst observed in this study align well with this pathway.The reciprocal amplification of mitochondrial dysfunction and oxidative stress characterizes disease progression. Respiratory chain-derived ROS can directly oxidize aconitase—the iron–sulfur cluster enzyme of the TCA cycle—thereby further diminishing TCA cycle flux [50]. Concomitantly, ROS-mediated peroxidation of mitochondrial membrane lipids increases inner membrane permeability and proton leak, further compromising oxidative phosphorylation efficiency. With respect to antioxidant defenses, GSH serves as the predominant intracellular copper chelator and ROS scavenger, and its regeneration depends heavily on NADPH. During a massive copper influx, GSH is directly depleted by copper chelation; meanwhile, mitochondrial ROS continually drive its oxidation to GSSG. This combined assault of copper-induced depletion and ROS-driven oxidation sharply lowers the GSH/GSSG ratio, overwhelming cellular compensatory capacity and shifting oxidative damage from a manageable to an uncontrollable state [51,52].As the central hub of energy metabolism in acinar cells, mitochondrial dysfunction directly compromises cell survival and functional maintenance. Our data show that cuproptosis-induced mitochondrial dysfunction not only results in impaired ATP production and an oxidative burst, but may also exacerbate acinar cell injury by disrupting energy-dependent homeostatic mechanisms. Moreover, oxidative stress arising from mitochondrial dysfunction further compromises membrane integrity and activates local inflammatory responses, thereby propelling the progression of acute pancreatitis from initial acinar cell damage to a systemic inflammatory storm.
These findings provide a theoretical basis for targeting cuproptosis in the treatment of acute pancreatitis. Copper levels were effectively reduced, the aberrant upregulation of FDX1 and DLAT was reversed, and pancreatic injury was ameliorated by TTM both in vitro and in vivo, suggesting that targeting copper accumulation may be a viable therapeutic strategy. Furthermore, in a human clinical cohort, a gradient association was observed between cuproptosis-related gene expression and disease severity, and multiple genes demonstrated favorable diagnostic performance for acute pancreatitis, suggesting that the cuproptosis-related gene signature may hold clinical predictive value. In summary, through single-cell profiling, transcriptional regulatory inference, and in vitro and in vivo phenotypic validation, this study establishes cuproptosis as a novel programmed cell death phenotype in acute pancreatitis and reveals its selective activation features in acinar cells and its potential association with the inflammatory microenvironment. The major limitations of this study include the following: the mechanism of cuproptosis in acinar cells remains incompletely understood, with only phenotypic validation completed; the specific regulatory networks of FDX1 and DLAT under copper overload conditions, as well as the causal relationship between cuproptosis and the inflammatory response, remain to be further clarified. Future studies should investigate the mechanisms of cuproptosis in acinar cells during acute pancreatitis, with a particular focus on the transcriptional regulatory mechanisms by which copper ion accumulation triggers FDX1 and DLAT and the crosstalk between mitochondrial dysfunction and inflammatory signaling.
4. Materials and Methods
4.1. Data acquisition and Processing
The single-cell RNA sequencing dataset GSE279876 was downloaded from the Gene Expression Omnibus (GEO) database, containing pancreatic tissue samples from four experimental groups: NFD, AP, HFD, and HAP. Quality control was performed using the Seurat v5 package with the following criteria: each gene expressed in at least 10 cells; each cell expressing between 300 and 5,000 genes; total UMI counts per cell > 500; and mitochondrial gene content < 10%. A total of 36,794 high-quality cells were retained for downstream analyses.Two independent validation datasets were also downloaded: the mouse AP model bulk RNA-seq dataset GSE188819 (cerulein-induced) and the human clinical whole-blood transcriptome dataset GSE194331 (including 32 healthy controls, 79 acute pancreatitis patients, and 8 pancreatitis patients with sepsis).
4.2. Single-Cell Atlas Construction and Cell Type Annotation
Single-cell data were normalized using the LogNormalize method in Seurat v5. Principal component analysis was performed based on the top 2,000 highly variable genes, and the first 30 principal components were used for UMAP dimensionality reduction and clustering (resolution = 0.5). Automated cell type annotation was performed using the SingleR package with the MouseRNAseqData reference database, followed by manual curation using canonical marker genes (Prss1/Cpa1 for acinar cells, S100a8/S100a9 for neutrophils, Cd68/Cd163 for macrophages, Krt19/Sox9 for ductal cells). Ten distinct cell types were ultimately defined. Batch effects across experimental groups were corrected using the Harmony algorithm.
4.3. Cuproptosis Pathway Scoring
A set of 13 core cuproptosis-related genes (Fdx1, Lias, Lipt1, Dld, Dlat, Pdha1, Pdhb, Mtf1, Gls, Cdkn2a, Slc31a1, Atp7a, Atp7b) was retrieved from previous literature (Tsvetkov et al., Science 2022). Cuproptosis pathway activity scores were calculated for each cell using two independent methods: the AddModuleScore function in Seurat and the AUCell algorithm. The two scoring results were cross-validated in UMAP space.
4.4. Weighted Gene Co-Expression Network Analysis (hdWGCNA)
A weighted gene co-expression network was constructed using the hdWGCNA package. A total of 6,101 highly variable genes from the single-cell data were selected to build an unsigned co-expression network (soft-thresholding power set to 12). Gene modules were identified using the dynamic tree-cutting algorithm, and module eigengenes were calculated. Spearman correlation analysis was performed between module eigengenes and disease status (AP vs. NFD) as well as cuproptosis scores. Modules with significant correlations (p < 0.001) were considered to be strongly associated with AP or cuproptosis.
4.5. Pseudotime Trajectory and Differentiation State Analysis
All acinar cells (n = 10,155) were extracted to construct a Monocle3 object. The cell closest to the centroid of all control cells was set as the trajectory root. The learn_graph function (use_partition = FALSE) was used to reconstruct the continuous transition trajectory from normal to injured states. Pseudotime values were calculated for each cell. LOESS local regression was applied to analyze the trend of cuproptosis scores along pseudotime, and the graph_test function was used for spatial autocorrelation testing. Additionally, CytoTRACE was used to assess the differentiation state (stemness) of acinar cells and its relationship with pseudotime.
4.6. Transcription Factor Regulatory Network Inference
Transcription factor (TF) activity at the single-cell level was inferred using the decoupleR package in combination with the DoRothEA database (only regulons supported by ABC-level literature evidence were retained). TF activity scores were calculated using the weighted mean (wmean) method. TFs regulating cuproptosis genes were specifically examined, and TF activity distributions were compared across different cell types.
4.7. Cell-cell Communication Analysis
Cell-cell communication networks were constructed separately for the NFD and AP groups using the CellChat package. Based on the CellChatDB.mouse database, communication intensities of various signaling pathways between different cell types were calculated. Differences between the AP and NFD groups were compared, with a focus on inflammation- and injury-related pathways.
4.8. External validation using independent datasets
The core findings from the single-cell analysis were cross-validated using the independent mouse AP model bulk RNA-seq dataset GSE188819, reproducing the changes in cuproptosis pathway scores and expression patterns of core genes. For the human clinical dataset GSE194331, differential expression analysis was performed using the limma-voom method to compare cuproptosis gene expression between acute pancreatitis patients and healthy controls. Receiver operating characteristic (ROC) curves were plotted using the pROC package, and the area under the curve (AUC) was calculated to evaluate the diagnostic performance of each cuproptosis gene in distinguishing AP patients from healthy controls.
4.9. Animal Experiments
Eight-week-old male C57BL/6 mice were randomly assigned to three groups: control (CON), caerulein-treated (SAP), and caerulein plus tetrathiomolybdate (TTM) treatment (SAP + TTM). After one week of acclimatisation, the mice were given ten consecutive intraperitoneal injections of caerulein (300 µg/kg per injection) at 1-hour intervals to induce severe acute pancreatitis. For the TTM intervention, a single intraperitoneal dose of TTM (10 mg/kg) was given 1 hour before the first caerulein injection. All mice were euthanised 24 hours after the final injection, and blood and pancreatic tissue samples were collected from each group.
4.10. Histological Analysis
At the end of the experiment, the mice were euthanized, and the pancreata were excised. Pancreatic tissues were fixed in paraformaldehyde, dehydrated, embedded in paraffin, and sectioned. The sections were deparaffinized and rehydrated for hematoxylin and eosin (H&E) staining. The sections were stained with hematoxylin, differentiated, and blued in tap water. After counterstaining with eosin, the slides were dehydrated and examined by light microscopy.
4.11. Immunohistochemical Staining
At the end of the experiment, the mice were euthanized and the pancreata were excised. Pancreatic tissues were fixed in paraformaldehyde, dehydrated, embedded in paraffin blocks, and then sectioned. For immunohistochemical staining, the paraffin sections were deparaffinized and rehydrated. The sections underwent microwave antigen retrieval in citrate buffer (pH 6.0), were allowed to cool to room temperature, and then washed with phosphate-buffered saline (PBS). Endogenous peroxidase activity was blocked with 3% hydrogen peroxide, and non-specific binding was blocked with goat serum. The sections were incubated with diluted primary antibodies overnight at 4 °C in a humidified chamber, washed with PBS, and then incubated with HRP-conjugated secondary antibodies at room temperature, followed by PBS washes. DAB chromogen solution was added, and color development was monitored under a microscope; the reaction was stopped with distilled water. Nuclei were counterstained with hematoxylin, followed by differentiation and bluing in tap water. The sections were then dehydrated, cleared, mounted, and examined under a light microscope, and images were captured for analysis.
4.12. Immunofluorescence Staining
Immunofluorescence staining followed standard protocols. For cellular staining, cells were fixed with 4% paraformaldehyde and permeabilized with 0.2% Triton X-100. After blocking with 5% bovine serum albumin (BSA), the cells were incubated overnight at 4℃ with primary antibodies against DLAT and FDX1. After washing with PBS, cells were incubated with Alexa Fluor 594- or 488-conjugated secondary antibodies and counterstained with DAPI. Images were captured with an Olympus inverted fluorescence microscope and analyzed using ImageJ software.
4.13. Western Blot
Total protein was extracted from mouse pancreatic tissues at the end of the experiment. Protein concentrations were measured by BCA assay, and equal protein amounts were loaded per sample. Proteins were resolved by SDS-PAGE and transferred to methanol-activated polyvinylidene difluoride (PVDF) membranes. Membranes were blocked with 5% non-fat milk in TBST for 1 h at room temperature. Following blocking, membranes were incubated overnight at 4℃ with primary antibodies against FDX1, DLAT, and glyceraldehyde-3-phosphate dehydrogenase (GAPDH) as an internal control. The following day, the membranes were washed three times with TBST and incubated with horseradish peroxidase (HRP)-conjugated secondary antibodies for 1 h at room temperature. Following extensive TBST washes, signals were developed with an enhanced chemiluminescence (ECL) kit and imaged using a chemiluminescence imaging system. Grayscale values of the protein bands were quantified with ImageJ
4.14. Cells and Cell Culture Conditions
266-6 cells were quickly thawed in a 37℃ water bath, resuspended in high-glucose DMEM supplemented with 10% foetal bovine serum (FBS) and 1% penicillin–streptomycin, and cultured in a humidified incubator at 37℃ with 5% CO2. At 80–90% confluence, the spent medium was aspirated, the cells were rinsed with PBS, and digestion was performed using 0.25% trypsin–EDTA at 37℃ for 1–2 min. Once the cells rounded and detached, digestion was immediately terminated by adding complete medium containing serum. The cells were subcultured at a ratio of 1:2 to 1:4, and fresh medium was replaced every 2–3 days.
4.15. Inductively Coupled Plasma Mass Spectrometry (ICP-MS)
After the experiment, the 266-6 cell pellet was washed three times with pre-cooled PBS to remove copper ion interference. The sample was transferred to a digestion vessel, and ultra-pure concentrated nitric acid was added for overnight pre-digestion. The next day, microwave digestion was performed with a programmed temperature ramp until the solution became clear. The digest was evaporated to near dryness on a hot plate at 120–140 °C, and after cooling, it was reconstituted and made up to volume with ultra-pure water. Meanwhile, a copper standard solution was prepared and an equal amount of internal standard was added. **After optimizing the sensitivity of the inductively coupled plasma mass spectrometry (ICP-MS) system**, the copper ion counts of the standards and samples were measured sequentially, and the copper mass concentration was calculated from the standard curve, ultimately expressed as the amount of copper per milligram of protein or per gram of wet tissue.
4.16. Flow Cytometry
After treatment, collect 266-6 cells, digest with trypsin, centrifuge, wash twice with PBS, and resuspend in binding buffer or serum-free medium at 1×10⁶ cells/mL. Transfer 100 μL of the cell suspension to a flow cytometry tube, add the appropriate probes according to the detection purpose (Annexin V/PI for apoptosis, DCFH-DA for ROS, JC-1 for mitochondrial membrane potential), mix, and incubate at room temperature in the dark for 15–30 min. Terminate by adding buffer, filter, and immediately analyze on a flow cytometer. Gate out debris and doublets, record 10,000 live events per sample, and calculate the percentage of positive cells or mean fluorescence intensity (MFI) using FlowJo software.
4.17. Transmission Electron Microscopy
After the experimental treatment, the 266-6 cells were collected, digested with trypsin, and centrifuged at 1000 rpm for 5 min. The supernatant was discarded, and the compact cell pellet was retained. Next, 2.5% glutaraldehyde in 0.1 M phosphate buffer was added gently down the tube wall, and the cells were fixed overnight at 4 °C. The following day,post-fixed with 1% osmium tetroxide at 4 °C in the dark for 1–2 hours. Following PBS rinses, the cells were dehydrated through a graded ethanol series and acetone. The pellet was then infiltrated sequentially with embedding medium–acetone mixtures, followed by pure embedding medium overnight. The next day, the samples were transferred into molds and polymerized at 60–65 °C for 48 hours. Ultrathin sections were cut with an ultramicrotome and collected on copper grids. The sections were stained with uranyl acetate for 15–20 minutes and lead citrate for 5–10 minutes, rinsed with double-distilled water, and air-dried. Images were acquired using a transmission electron microscope at 80–100 kV, focusing on mitochondrial morphology, cristae structure, and changes in membrane density.
4.18. Statistical Analysis
All data analyses were performed using R software (version 4.1.1). Comparisons between groups were conducted using the Wilcoxon rank-sum test (for non-normally distributed data) or Student’s t-test (for normally distributed data). Correlation analyses were performed using Spearman’s rank correlation coefficient. Multiple comparisons were adjusted using the Benjamini–Hochberg method, and an adjusted p-value < 0.05 was considered statistically significant
5. Conclusions
This study is the first to systematically delineate the activation landscape of cuproptosis in pancreatic acinar cells at single-cell resolution and establish cuproptosis as a novel programmed cell death phenotype in acute pancreatitis. The cuproptosis pathway was selectively activated in acinar cells during acute pancreatitis, as evidenced by copper ion accumulation and coordinated upregulation of ferredoxin 1 (FDX1) and dihydrolipoamide S-acetyltransferase (DLAT) proteins; this activation progressively intensified with the progression of acinar cell injury. In vitro and in vivo experiments further demonstrated that the copper chelator tetrathiomolybdate (TTM) effectively reversed these alterations, alongside amelioration of mitochondrial dysfunction and oxidative stress injury. In a human clinical cohort, the expression levels of cuproptosis-related genes exhibited a graded association with disease severity, suggesting potential utility for clinical prediction. Collectively, this study provided a novel perspective on the molecular mechanisms of acinar cell injury in acute pancreatitis and laid a theoretical foundation for therapeutic strategies targeting cuproptosis.
Author Contributions
Q.X. designed the study; Q.X. and M.H. conducted the experiments and wrote the original draft; Q.X. performed the experiments; Q.W. and W.L. contributed to data discussion and manuscript revision; W.L. conceived,designed, and supervised the study. All authors have read and agreed to the published version of the manuscript.
Funding
The work was funded by the Basic Research Program of Jiangsu Province (Grant No. BK20251677).
Institutional Review Board Statement
All experiments conformed to the recommended guidelines for animal experimentation and were approved by the Animal Experiment Ethics Committee of the General Hospital of Eastern Theater Command, PLA (approval No. DZYJSDW20260630001 on 30 June 2026). All appropriate measures were taken to minimize the pain or discomfort of animals.
Informed Consent Statement
Not applicable.
Data Availability Statement
The original contributions presented in this study are included in the article and Supplementary Materials. Further inquiries can be directed to the corresponding authors.
Conflicts of Interest
The authors declare no conflict of interest.
Abbreviations
The following abbreviations are used in this manuscript:
| AP | Acute pancreatitis |
| SAP | Directory of open access journals |
| AP-1 | Activator protein-1 |
| FDX1 | Ferredoxin 1 |
| DLAT | Dihydrolipoamide S-acetyltransferase |
| TTM | Tetrathiomolybdate |
| GSH | Glutathione (reduced) |
| GSSG | Glutathione (oxidized) |
| ROS | Reactive oxygen species |
| ER | Endoplasmic reticulum |
| TCA | Tricarboxylic acid |
| TNF-α | Tumor necrosis factor-alpha |
| IL-1β | Interleukin-1 beta |
| IL-6 | Interleukin-6 |
| MPO | Myeloperoxidase |
| SOD | Superoxide dismutase |
| MDA | Malondialdehyde |
| 4-HNE | 4-Hydroxynonenal |
| NLRP3 | NOD-like receptor protein 3 |
| cGAS-STING | Cyclic GMP-AMP synthase—stimulator of interferon genes |
| TF | Transcription factor |
| scRNA-seq | Single-cell RNA sequencing |
| UMAP | Uniform Manifold Approximation and Projection |
| WGCNA | Weighted gene co-expression network analysis |
| ICP-MS | Inductively coupled plasma mass spectrometry |
| GAPDH | Glyceraldehyde-3-phosphate dehydrogenase |
| PVDF | Polyvinylidene fluoride |
| ROC | Receiver operating characteristic |
| AUC | Area under the curve |
References
- Hu, Q.; Hu, Y.; Tan, C.; et al. Acute pancreatitis: Mechanisms and therapeutic approaches. Signal Transduct. Target. Ther. 2026, 11, 15. [Google Scholar] [CrossRef] [PubMed]
- Hamesch, K.; Hollenbach, M.; Guilabert, L.; et al. Practical management of severe acute pancreatitis. Eur. J. Intern. Med. 2024, 133. [Google Scholar] [CrossRef] [PubMed]
- Fang, H.; You, P.; Lin, S.; et al. Annexin A1 mRNA-loaded liposomes alleviate acute pancreatitis by suppressing STING pathway and promoting efferocytosis in macrophages. Nat. Nanotechnol. 2025, 20, 1514–1525. [Google Scholar] [CrossRef] [PubMed]
- Gardner, T.B. Acute Pancreatitis. Ann. Intern. Med. 2021, 174, ITC17–ITC32. [Google Scholar] [CrossRef] [PubMed]
- Crockett, S.; Falck-Ytter, Y.; Wani, S.; et al. Acute Pancreatitis Guideline. Gastroenterology 2018, 154, 1102. [Google Scholar] [CrossRef] [PubMed]
- Al Mamun, A.; Suchi, S.A.; Aziz, M.A.; et al. Pyroptosis in acute pancreatitis and its therapeutic regulation. Apoptosis Int. J. Program. Cell Death 2022, 27, 465–481. [Google Scholar] [CrossRef] [PubMed]
- Li, H.; Lin, Y.; Zhang, L.; et al. Ferroptosis and its emerging roles in acute pancreatitis. Chin. Med. J. 2022, 135, 2026–2034. [Google Scholar] [CrossRef] [PubMed]
- Guo, Z.; Chen, D.; Yao, L.; et al. The molecular mechanism and therapeutic landscape of copper and cuproptosis in cancer. Signal Transduct. Target. Ther. 2025, 10, 149. [Google Scholar] [CrossRef] [PubMed]
- Tang, D.; Kroemer, G.; Kang, R. Targeting cuproplasia and cuproptosis in cancer. Nat. Rev. Clin. Oncol. 2024, 21, 370–388. [Google Scholar] [CrossRef] [PubMed]
- Liu, W.-Q.; Lin, W.-R.; Yan, L.; et al. Copper homeostasis and cuproptosis in cancer immunity and therapy. Immunol. Rev. 2023, 321, 211–227. [Google Scholar] [CrossRef] [PubMed]
- Tsvetkov, P.; Coy, S.; Petrova, B.; et al. Copper induces cell death by targeting lipoylated TCA cycle proteins. Science 2022, 375, 1254–1261. [Google Scholar] [CrossRef] [PubMed]
- Chen, L.; Min, J.; Wang, F. Copper homeostasis and cuproptosis in health and disease. Signal Transduct. Target. Ther. 2022, 7, 378. [Google Scholar] [CrossRef] [PubMed]
- Vo, T.T.T.; Peng, T.-Y.; Nguyen, T.H.; et al. The crosstalk between copper-induced oxidative stress and cuproptosis: A novel potential anticancer paradigm. Cell Commun. Signal. CCS 2024, 22, 353. [Google Scholar] [CrossRef] [PubMed]
- Li, B.; Jiang, T.; Wang, J.; et al. Cuprorivaite microspheres inhibit cuproptosis and oxidative stress in osteoarthritis via Wnt/β-catenin pathway. Mater. Today. Bio 2024, 29, 101300. [Google Scholar] [CrossRef] [PubMed]
- Xu, W.; Suo, A.; Aldai, A.J.M.; et al. Hollow Calcium/Copper Bimetallic Amplifier for Cuproptosis/Paraptosis/Apoptosis Cancer Therapy via Cascade Reinforcement of Endoplasmic Reticulum Stress and Mitochondrial Dysfunction. ACS Nano 2024, 18, 30053–30068. [Google Scholar] [CrossRef] [PubMed]
- Chen, S.; Zhou, Z.; Wang, Y.; et al. Dysregulated Copper Metabolism-Induced Cuproptosis Contributes to Mitochondrial Dysfunction and Macrophage Inflammatory Response in Acute Lung Injury. Antioxid. Redox Signal. 2026, 44, 770–791. [Google Scholar] [CrossRef] [PubMed]
- Gu, Y.; Wang, H.; Xue, W.; et al. Endoplasmic reticulum stress related super-enhancers suppress cuproptosis via glycolysis reprogramming in lung adenocarcinoma. Cell Death Dis. 2025, 16, 316. [Google Scholar] [CrossRef] [PubMed]
- Bu, N.; Du, Q.; Xiao, T.; et al. Mechanism of S-Palmitoylation in Polystyrene Nanoplastics-Induced Macrophage Cuproptosis Contributing to Emphysema through Alveolar Epithelial Cell Pyroptosis. ACS Nano 2025, 19, 18708–18728. [Google Scholar] [CrossRef] [PubMed]
- Liu, S.; Ge, J.; Chu, Y.; et al. Identification of hub cuproptosis related genes and immune cell infiltration characteristics in periodontitis. Front. Immunol. 2023, 14, 1164667. [Google Scholar] [CrossRef] [PubMed]
- Du, Z.-B.; Wu, X.-M.; Lei, J.-M.; et al. SIRT3 deacetylates STEAP4 to modulate cuproptosis sensitivity via mitochondrial metabolic reprogramming in HBV-related HCC. Cell Death Differ. 2026. [Google Scholar] [CrossRef] [PubMed]
- Ren, Y.; Cui, Q.; Liu, W.; et al. Blocking TRPM4 alleviates pancreatic acinar cell damage via an NMDA receptor-dependent pathway in acute pancreatitis. Theranostics 2025, 15, 6901–6918. [Google Scholar] [CrossRef] [PubMed]
- Yang, Y.; Hu, Q.; Kang, H.; et al. Autophagy-driven lipid regulation by an herbal decoction alleviates cardiac lipotoxicity in severe acute pancreatitis. Theranostics 2025, 15, 8822–8839. [Google Scholar] [CrossRef] [PubMed]
- Jiang, D.; Zhuang, L.; Koong, A.C.; et al. Cuproptosis in cancer: From molecular mechanisms to therapeutic intervention. Trends Cancer 2025, 12, 275–286. [Google Scholar] [CrossRef] [PubMed]
- Yuan, F.; Wu, X.; Yuan, H.; et al. Glioblastoma stem cells resist cuproptosis with circadian variation of copper levels. J. Clin. Investig. 2026, 136. [Google Scholar] [CrossRef] [PubMed]
- Chen, S.; Chen, T.; Xu, C.; et al. Iron overload exaggerates renal ischemia-reperfusion injury by promoting tubular cuproptosis via interrupting function of LIAS. Redox Biol. 2025, 86, 103795. [Google Scholar] [CrossRef] [PubMed]
- Lei, G.; Lu, Z.; Xu, Z.; et al. Cuproptosis-immunity crosstalk informs strategy to overcome immunotherapy resistance. Cell 2026. [Google Scholar] [CrossRef] [PubMed]
- Wang, W.; Gui, H.; Wei, X.; et al. Cuproptosis to Cuproptosis-Like: Therapeutic Strategies for Bacterial Infection. Adv. Mater. 2025, 37, e2506119. [Google Scholar] [CrossRef] [PubMed]
- Yang, W.; Xiao, C.; Zheng, J.; et al. Copper homeostasis and cuproptosis represent emerging targets for therapeutic intervention in inflammatory diseases. Pharmacol. Res. 2025, 221, 107988. [Google Scholar] [CrossRef] [PubMed]
- Kong, L.; Deng, J.; Zhou, X.; et al. Sitagliptin activates the p62-Keap1-Nrf2 signalling pathway to alleviate oxidative stress and excessive autophagy in severe acute pancreatitis-related acute lung injury. Cell Death Dis. 2021, 12, 928. [Google Scholar] [CrossRef] [PubMed]
- Gao, M.; Xiao, G.; Chen, K.; et al. Runx1-Snx9 axis drives the pathological secretion of mitochondrial-derived vesicles to activate cGAS-STING signaling in acute pancreatitis. J. Nanobiotechnology 2026, 24. [Google Scholar] [CrossRef] [PubMed]
- Han, X.; Li, B.; Bao, J.; et al. Endoplasmic reticulum stress promoted acinar cell necroptosis in acute pancreatitis through cathepsinB-mediated AP-1 activation. Front. Immunol. 2022, 13, 968639. [Google Scholar] [CrossRef] [PubMed]
- Fan, R.; Sui, J.; Dong, X.; et al. Wedelolactone alleviates acute pancreatitis and associated lung injury via GPX4 mediated suppression of pyroptosis and ferroptosis. Free Radic. Biol. Med. 2021, 173, 29–40. [Google Scholar] [CrossRef] [PubMed]
- Zhao, D.; Wang, Y.; Guan, Q.; et al. Sunitinib enhances cuproptosis induced by copper ionophores via ROS-ATF3-SLC31A1 axis in thyroid Carcinoma. Cell Death Dis. 2026. [Google Scholar] [CrossRef] [PubMed]
- Sun, L.; Zhang, Y.; Yang, B.; et al. Lactylation of METTL16 promotes cuproptosis via m6A-modification on FDX1 mRNA in gastric cancer. Nat. Commun. 2023, 14, 6523. [Google Scholar] [CrossRef] [PubMed]
- Li, Z.; Zhou, H.; Zhai, X.; et al. MELK promotes HCC carcinogenesis through modulating cuproptosis-related gene DLAT-mediated mitochondrial function. Cell Death Dis. 2023, 14, 733. [Google Scholar] [CrossRef] [PubMed]
- Lu, Y.; Li, Y.; Sun, X.; et al. Mitochondrial uncoupling sensitizes gastric cancer cells to elesclomol-induced cuproptosis via FDX1/DLAT upregulation. Free Radic. Biol. Med. 2025, 244, 284–295. [Google Scholar] [CrossRef] [PubMed]
- Zhang, Y.; Sun, J.; Li, S.; et al. The Potential Mechanism of Cuproptosis in Hemocytes of the Pacific Oyster Crassostrea gigas upon Elesclomol Treatment. Cells 2025, 14. [Google Scholar] [CrossRef] [PubMed]
- Jiang, Z.; Li, J.; Shi, M.; et al. Hypoxia, cuproptosis, and osteoarthritis: Unraveling the molecular crosstalk. Redox Biol. 2025, 85, 103757. [Google Scholar] [CrossRef] [PubMed]
- Zhang, W.; Qu, H.; Ma, X.; et al. Identification of cuproptosis and immune-related gene prognostic signature in lung adenocarcinoma. Front. Immunol. 2023, 14, 1179742. [Google Scholar] [CrossRef] [PubMed]
- Chong, W.; Ren, H.; Chen, H.; et al. Clinical features and molecular landscape of cuproptosis signature-related molecular subtype in gastric cancer. IMeta 2024, 3, e190. [Google Scholar] [CrossRef] [PubMed]
- Wang, X.; Ling, W.; Zhu, Y.; et al. Spermidine alleviates copper-induced oxidative stress, inflammation and cuproptosis in the liver. FASEB J. Off. Publ. Fed. Am. Soc. Exp. Biol. 2025, 39, e70453. [Google Scholar] [CrossRef] [PubMed]
- Zhang, X.; Su, Y.; Yang, W.; et al. Disruption of NF-κB-Mediated Copper Homeostasis Sensitizes Breast Cancer to Cuproptosis. Adv. Sci. 2025, 12, e06201. [Google Scholar] [CrossRef] [PubMed]
- Zong, C.; Xu, G.-L.; Ning, M.; et al. PU.1/Spi1 exacerbates ischemia-reperfusion induced acute kidney injury via upregulating Gata2 and promoting fibroblast activation. Acta Pharmacol. Sin. 2025, 46, 2251–2266. [Google Scholar] [CrossRef] [PubMed]
- Tao, M.; Wang, L.; Chen, C.; et al. Developmentally endothelial locus-1 facilitates intestinal inflammation resolution by suppressing the Cmpk2-cGAS-STING pathway and promoting reparatory macrophage transition. J. Adv. Res. 2025, 80, 593–608. [Google Scholar] [CrossRef] [PubMed]
- Li, X.; Xu, M.; Shen, J.; et al. Sorafenib inhibits LPS-induced inflammation by regulating Lyn-MAPK-NF-kB/AP-1 pathway and TLR4 expression. Cell Death Discov. 2022, 8, 281. [Google Scholar] [CrossRef] [PubMed]
- Ma, X.; Dong, X.; Xu, Y.; et al. Identification of AP-1 as a Critical Regulator of Glutathione Peroxidase 4 (GPX4) Transcriptional Suppression and Acinar Cell Ferroptosis in Acute Pancreatitis. Antioxidants 2022, 12. [Google Scholar] [CrossRef] [PubMed]
- Huo, S.; Wang, Q.; Shi, W.; et al. ATF3/SPI1/SLC31A1 Signaling Promotes Cuproptosis Induced by Advanced Glycosylation End Products in Diabetic Myocardial Injury. Int. J. Mol. Sci. 2023, 24. [Google Scholar] [CrossRef] [PubMed]
- Liu, F.; Liang, T.; Liu, J.; et al. Janus hydrogels delivering low-density lipoprotein receptor-related protein 6 inhibitor enhance myocardial repair via m6A-dependent cuproptosis in bama pigs. Acta Biomater. 2025, 201, 255–265. [Google Scholar] [CrossRef] [PubMed]
- Zhang, S.-Y.; Ren, X.-H.; Zhang, C.-H.; et al. NADH-Reductive Stress Induced by Dihydrolipoamide Dehydrogenase Activation Contributes to Cuproptosis. Adv. Sci. 2025, 13, e20444. [Google Scholar] [CrossRef] [PubMed]
- Zahid, A.; Abiodun, O.S.; Xie, X.; et al. Lipid changes and molecular mechanism inducing cuproptosis in Cryptocaryon irritans after copper-zinc alloy exposure. Pestic. Biochem. Physiol. 2023, 199, 105756. [Google Scholar] [CrossRef] [PubMed]
- Wang, Y.; Yao, X.; Lu, Y.; et al. A PROTAC-Based Cuproptosis Sensitizer in Lung Cancer Therapy. Adv. Mater. 2025, 37, e2501435. [Google Scholar] [CrossRef] [PubMed]
- Zhang, P.; Zhou, C.; Ren, X.; et al. Inhibiting the compensatory elevation of xCT collaborates with disulfiram/copper-induced GSH consumption for cascade ferroptosis and cuproptosis. Redox Biol. 2023, 69, 103007. [Google Scholar] [CrossRef] [PubMed]
Figure 1.
Single-cell transcriptomic atlas of acute pancreatitis.(A) UMAP dimensionality reduction clustering plot (resolution =0.5), with the left panel coloured by cell subpopulations and the right panel coloured by sample origin, showing the distribution of four sample groups in UMAP space.(B) UMAP plot of cell type annotations, with the left panel indicating major cell types (acinar cells, ductal cells, neutrophils, macrophages, etc.) and the right panel coloured by disease group, illustrating the distribution of each cell type across different groups.(C) Dot plot showing the expression levels of characteristic marker genes across cell subpopulations, where dot size represents the proportion of cells expressing the gene and colour intensity indicates the average expression level.(D) Heatmap displaying the expression patterns of characteristic marker genes across cell subpopulations, with cell types annotated on the left and gene names on the right.(E) Feature plots showing the expression distribution of representative marker genes in UMAP space, with colour intensity indicating expression level.(F) Stacked bar plot of cell proportions, showing the percentage of each cell type across the four sample groups.
Figure 1.
Single-cell transcriptomic atlas of acute pancreatitis.(A) UMAP dimensionality reduction clustering plot (resolution =0.5), with the left panel coloured by cell subpopulations and the right panel coloured by sample origin, showing the distribution of four sample groups in UMAP space.(B) UMAP plot of cell type annotations, with the left panel indicating major cell types (acinar cells, ductal cells, neutrophils, macrophages, etc.) and the right panel coloured by disease group, illustrating the distribution of each cell type across different groups.(C) Dot plot showing the expression levels of characteristic marker genes across cell subpopulations, where dot size represents the proportion of cells expressing the gene and colour intensity indicates the average expression level.(D) Heatmap displaying the expression patterns of characteristic marker genes across cell subpopulations, with cell types annotated on the left and gene names on the right.(E) Feature plots showing the expression distribution of representative marker genes in UMAP space, with colour intensity indicating expression level.(F) Stacked bar plot of cell proportions, showing the percentage of each cell type across the four sample groups.
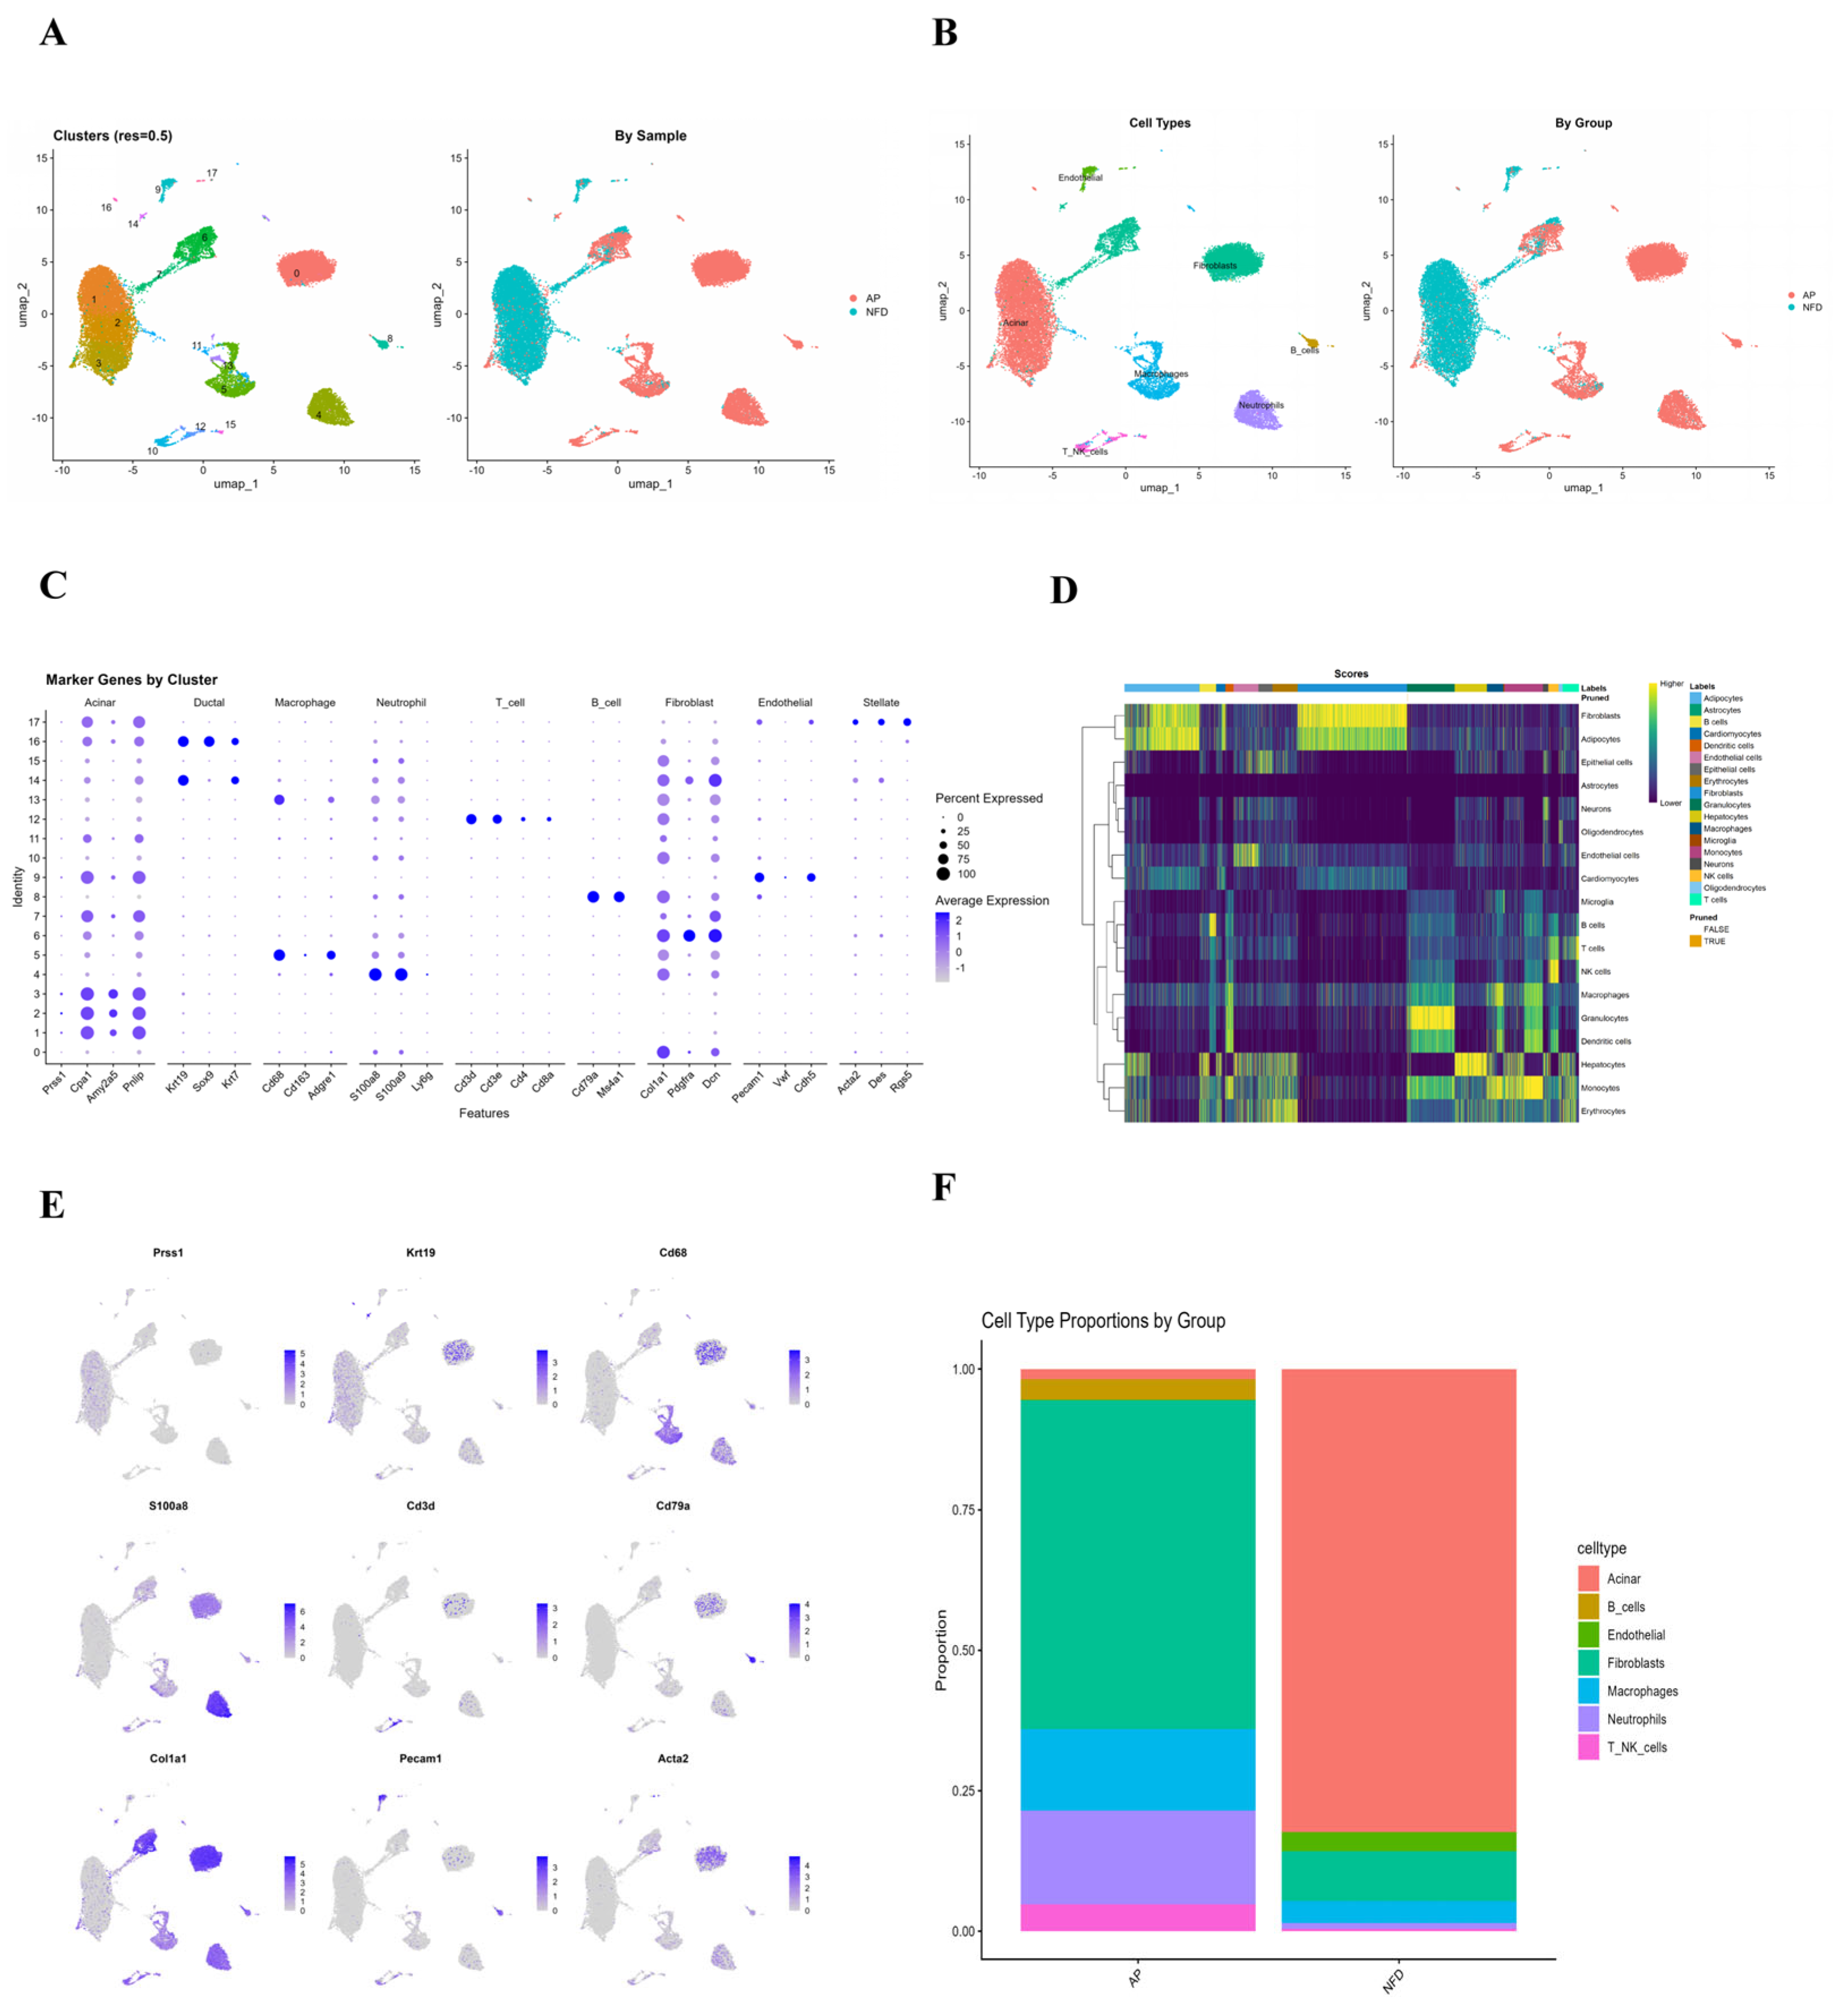
Figure 2.
Cell-type-specific activation of the cuproptosis pathway.(A) UMAP dimensionality reduction overlay plot showing the cuproptosis pathway activity score for each cell, as evaluated by the AUCell algorithm, with color intensity reflecting pathway activity level. (B) Violin plots displaying the distribution of cuproptosis pathway scores across various cell types, with the y-axis representing pathway scores and the x-axis indicating different cell types.(C) Bubble plot illustrating the average expression levels of 13 core cuproptosis-related genes across cell types, where dot size represents the proportion of cells expressing the gene and color depth denotes the average expression level. (D) Split bubble plot showing the expression levels of cuproptosis genes specifically in acinar cells, stratified by experimental group. (E) Heatmap depicting the expression patterns of the 13 core cuproptosis-related genes across cell types, with red indicating high expression and blue indicating low expression. (F) Grouped violin plots showing the differences in cuproptosis pathway score distribution among acinar cells across experimental groups. (G) Bubble plot of Gene Ontology (GO) Biological Process (BP) enrichment analysis, displaying the top 20 biological pathways enriched among differentially expressed genes between high- and low-cuproptosis-score groups, with the x-axis representing gene ratio, the y-axis showing pathway names, and color indicating adjusted p-values. (H) Bubble plot of KEGG pathway enrichment analysis, showing the top 20 signalling pathways enriched among the differentially expressed genes.
Figure 2.
Cell-type-specific activation of the cuproptosis pathway.(A) UMAP dimensionality reduction overlay plot showing the cuproptosis pathway activity score for each cell, as evaluated by the AUCell algorithm, with color intensity reflecting pathway activity level. (B) Violin plots displaying the distribution of cuproptosis pathway scores across various cell types, with the y-axis representing pathway scores and the x-axis indicating different cell types.(C) Bubble plot illustrating the average expression levels of 13 core cuproptosis-related genes across cell types, where dot size represents the proportion of cells expressing the gene and color depth denotes the average expression level. (D) Split bubble plot showing the expression levels of cuproptosis genes specifically in acinar cells, stratified by experimental group. (E) Heatmap depicting the expression patterns of the 13 core cuproptosis-related genes across cell types, with red indicating high expression and blue indicating low expression. (F) Grouped violin plots showing the differences in cuproptosis pathway score distribution among acinar cells across experimental groups. (G) Bubble plot of Gene Ontology (GO) Biological Process (BP) enrichment analysis, displaying the top 20 biological pathways enriched among differentially expressed genes between high- and low-cuproptosis-score groups, with the x-axis representing gene ratio, the y-axis showing pathway names, and color indicating adjusted p-values. (H) Bubble plot of KEGG pathway enrichment analysis, showing the top 20 signalling pathways enriched among the differentially expressed genes.
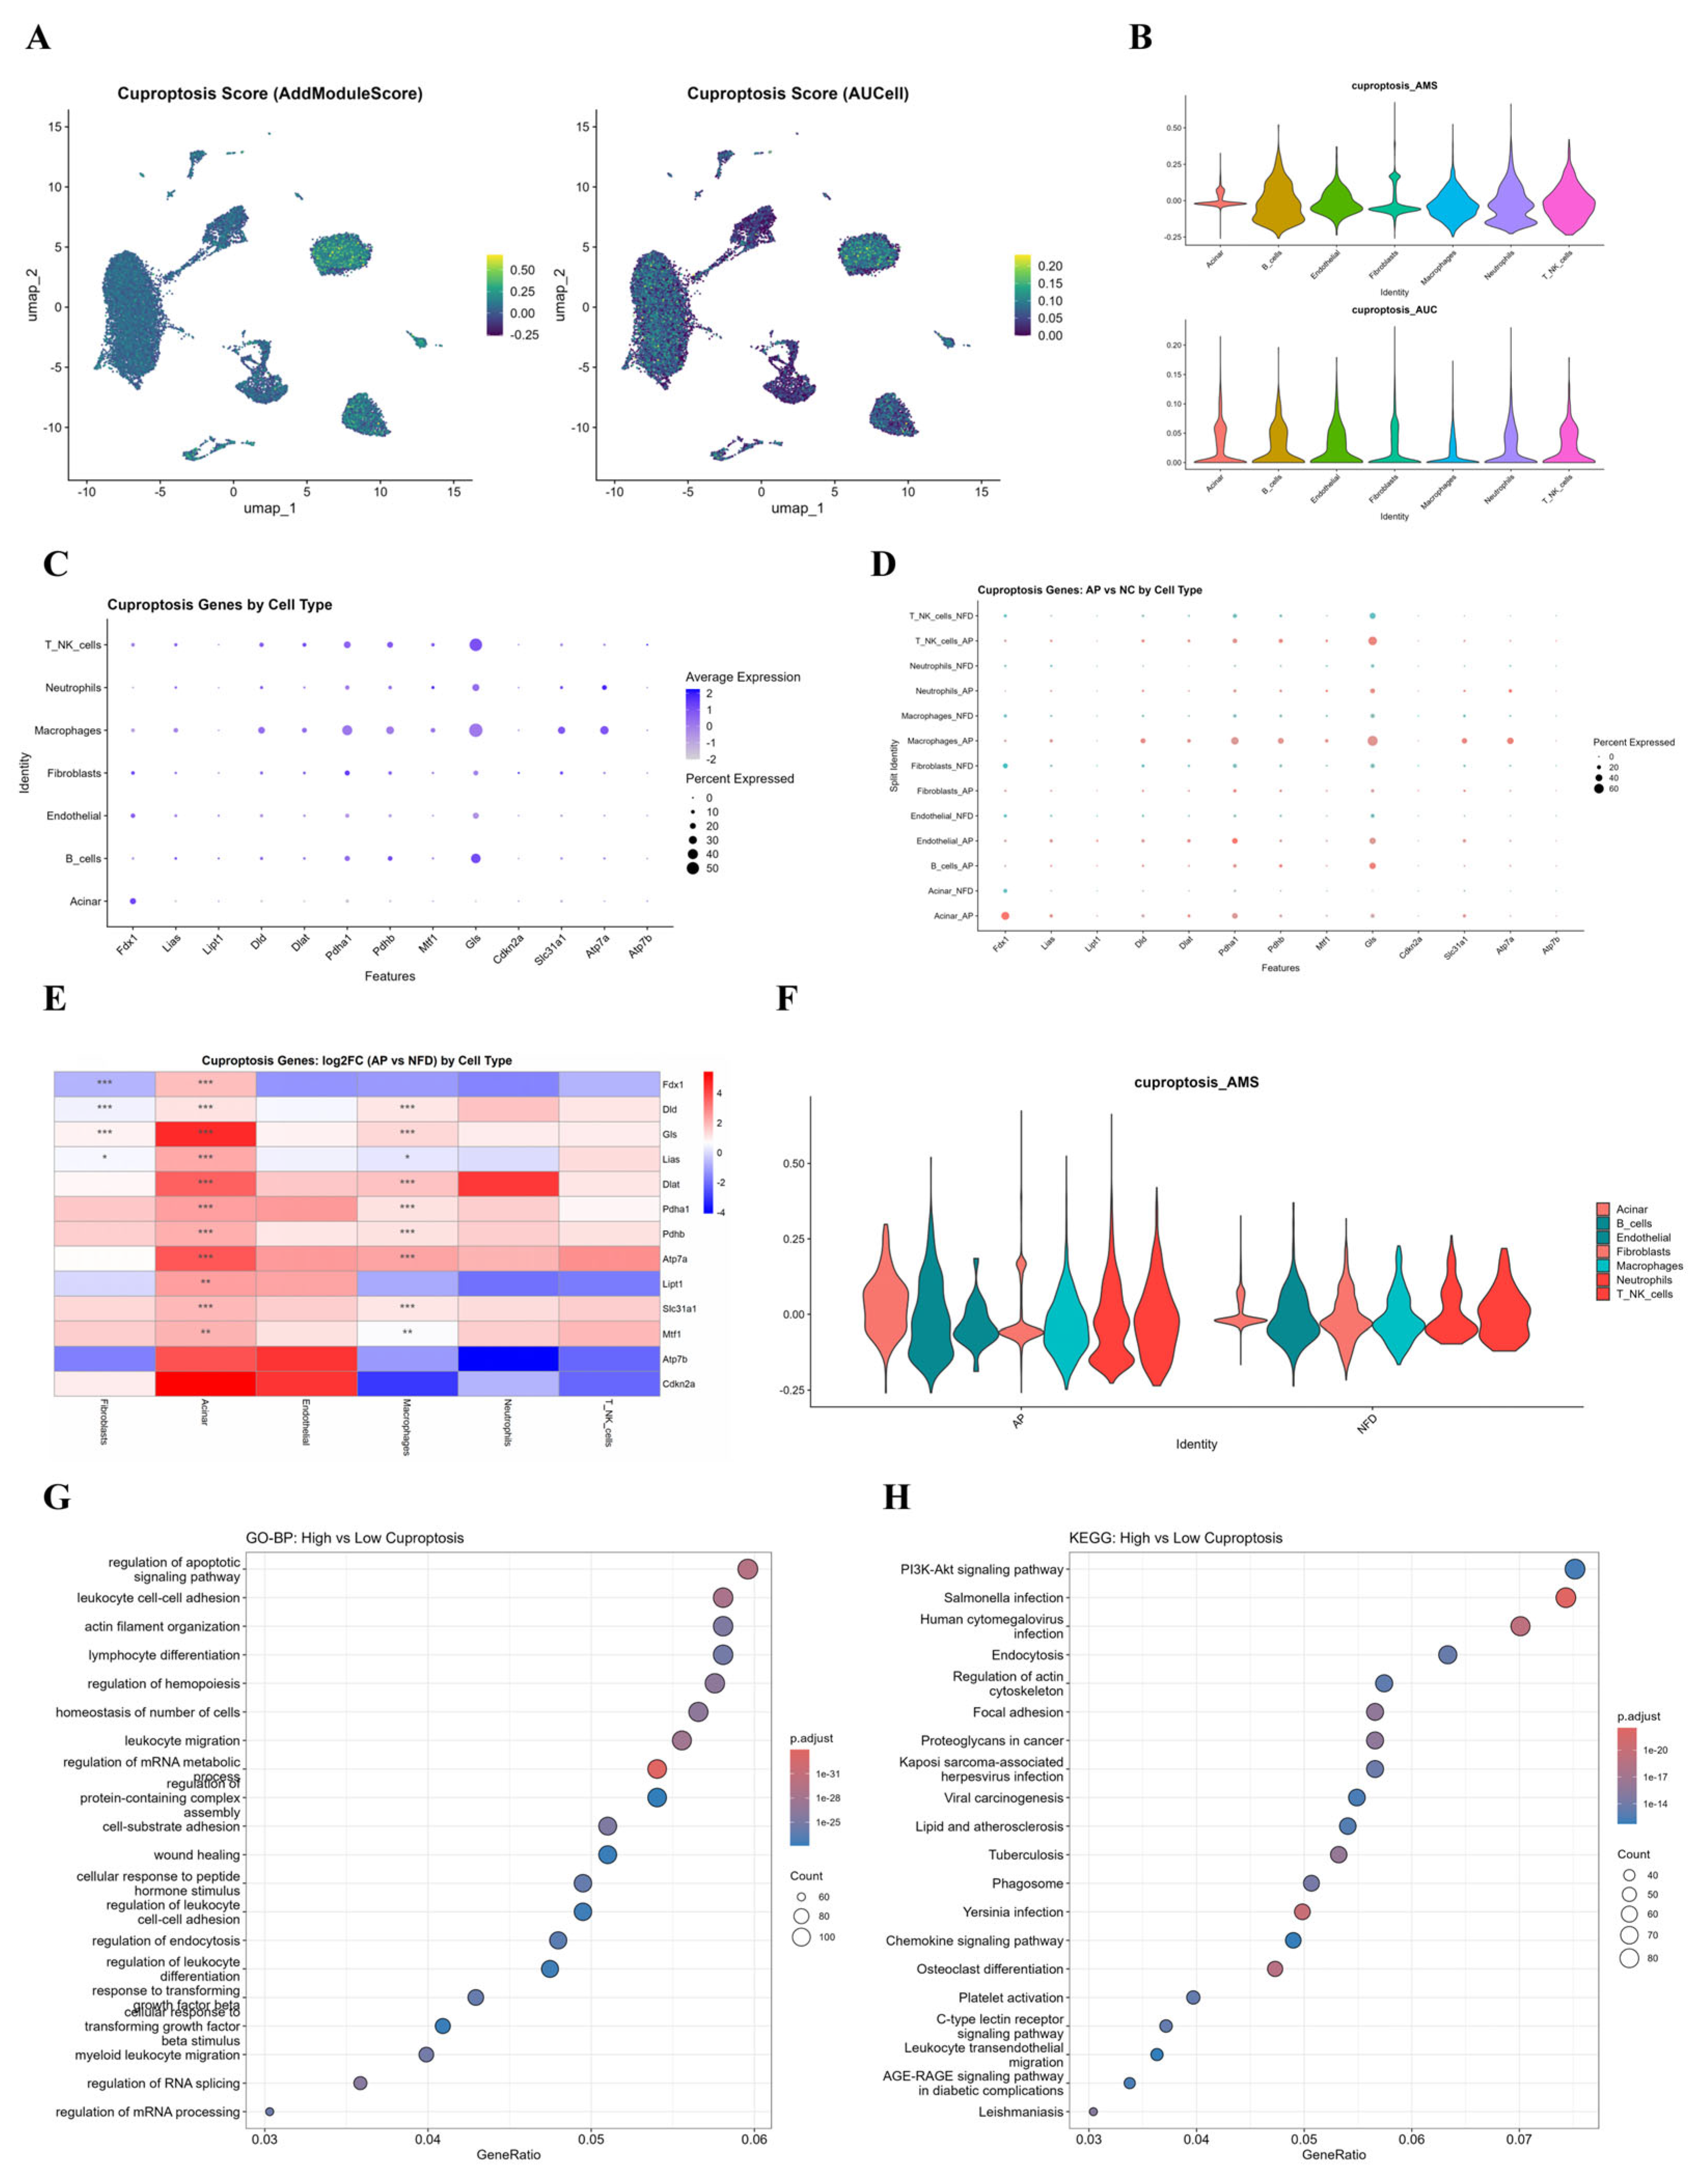
Figure 3.
Organization of cuproptosis genes in the co-expression network.(A) Soft-thresholding diagnostic plot for determining the optimal soft-thresholding power in weighted gene co-expression network analysis (WGCNA). The horizontal axis represents the soft-thresholding power, while the left vertical axis indicates the scale-free fit index and the right vertical axis represents the mean connectivity.(B) Gene clustering dendrogram based on hierarchical clustering of genes using the topological overlap matrix. The vertical axis denotes the distance between modules, and the different colour bands represent co-expression modules identified by the dynamic tree-cut algorithm. (C) UMAP dimensionality reduction plot overlaid with the eigengene activity scores of each module, with colours representing different modules, showing the enriched regions of each module in UMAP space. (D) Module–trait correlation heatmap displaying the Spearman correlation coefficients between each co-expression module and AP status, NFD status, and cuproptosis score. Red indicates positive correlation, blue indicates negative correlation, and the colour intensity represents the strength of correlation. Statistical significance levels are marked with asterisks.
Figure 3.
Organization of cuproptosis genes in the co-expression network.(A) Soft-thresholding diagnostic plot for determining the optimal soft-thresholding power in weighted gene co-expression network analysis (WGCNA). The horizontal axis represents the soft-thresholding power, while the left vertical axis indicates the scale-free fit index and the right vertical axis represents the mean connectivity.(B) Gene clustering dendrogram based on hierarchical clustering of genes using the topological overlap matrix. The vertical axis denotes the distance between modules, and the different colour bands represent co-expression modules identified by the dynamic tree-cut algorithm. (C) UMAP dimensionality reduction plot overlaid with the eigengene activity scores of each module, with colours representing different modules, showing the enriched regions of each module in UMAP space. (D) Module–trait correlation heatmap displaying the Spearman correlation coefficients between each co-expression module and AP status, NFD status, and cuproptosis score. Red indicates positive correlation, blue indicates negative correlation, and the colour intensity represents the strength of correlation. Statistical significance levels are marked with asterisks.
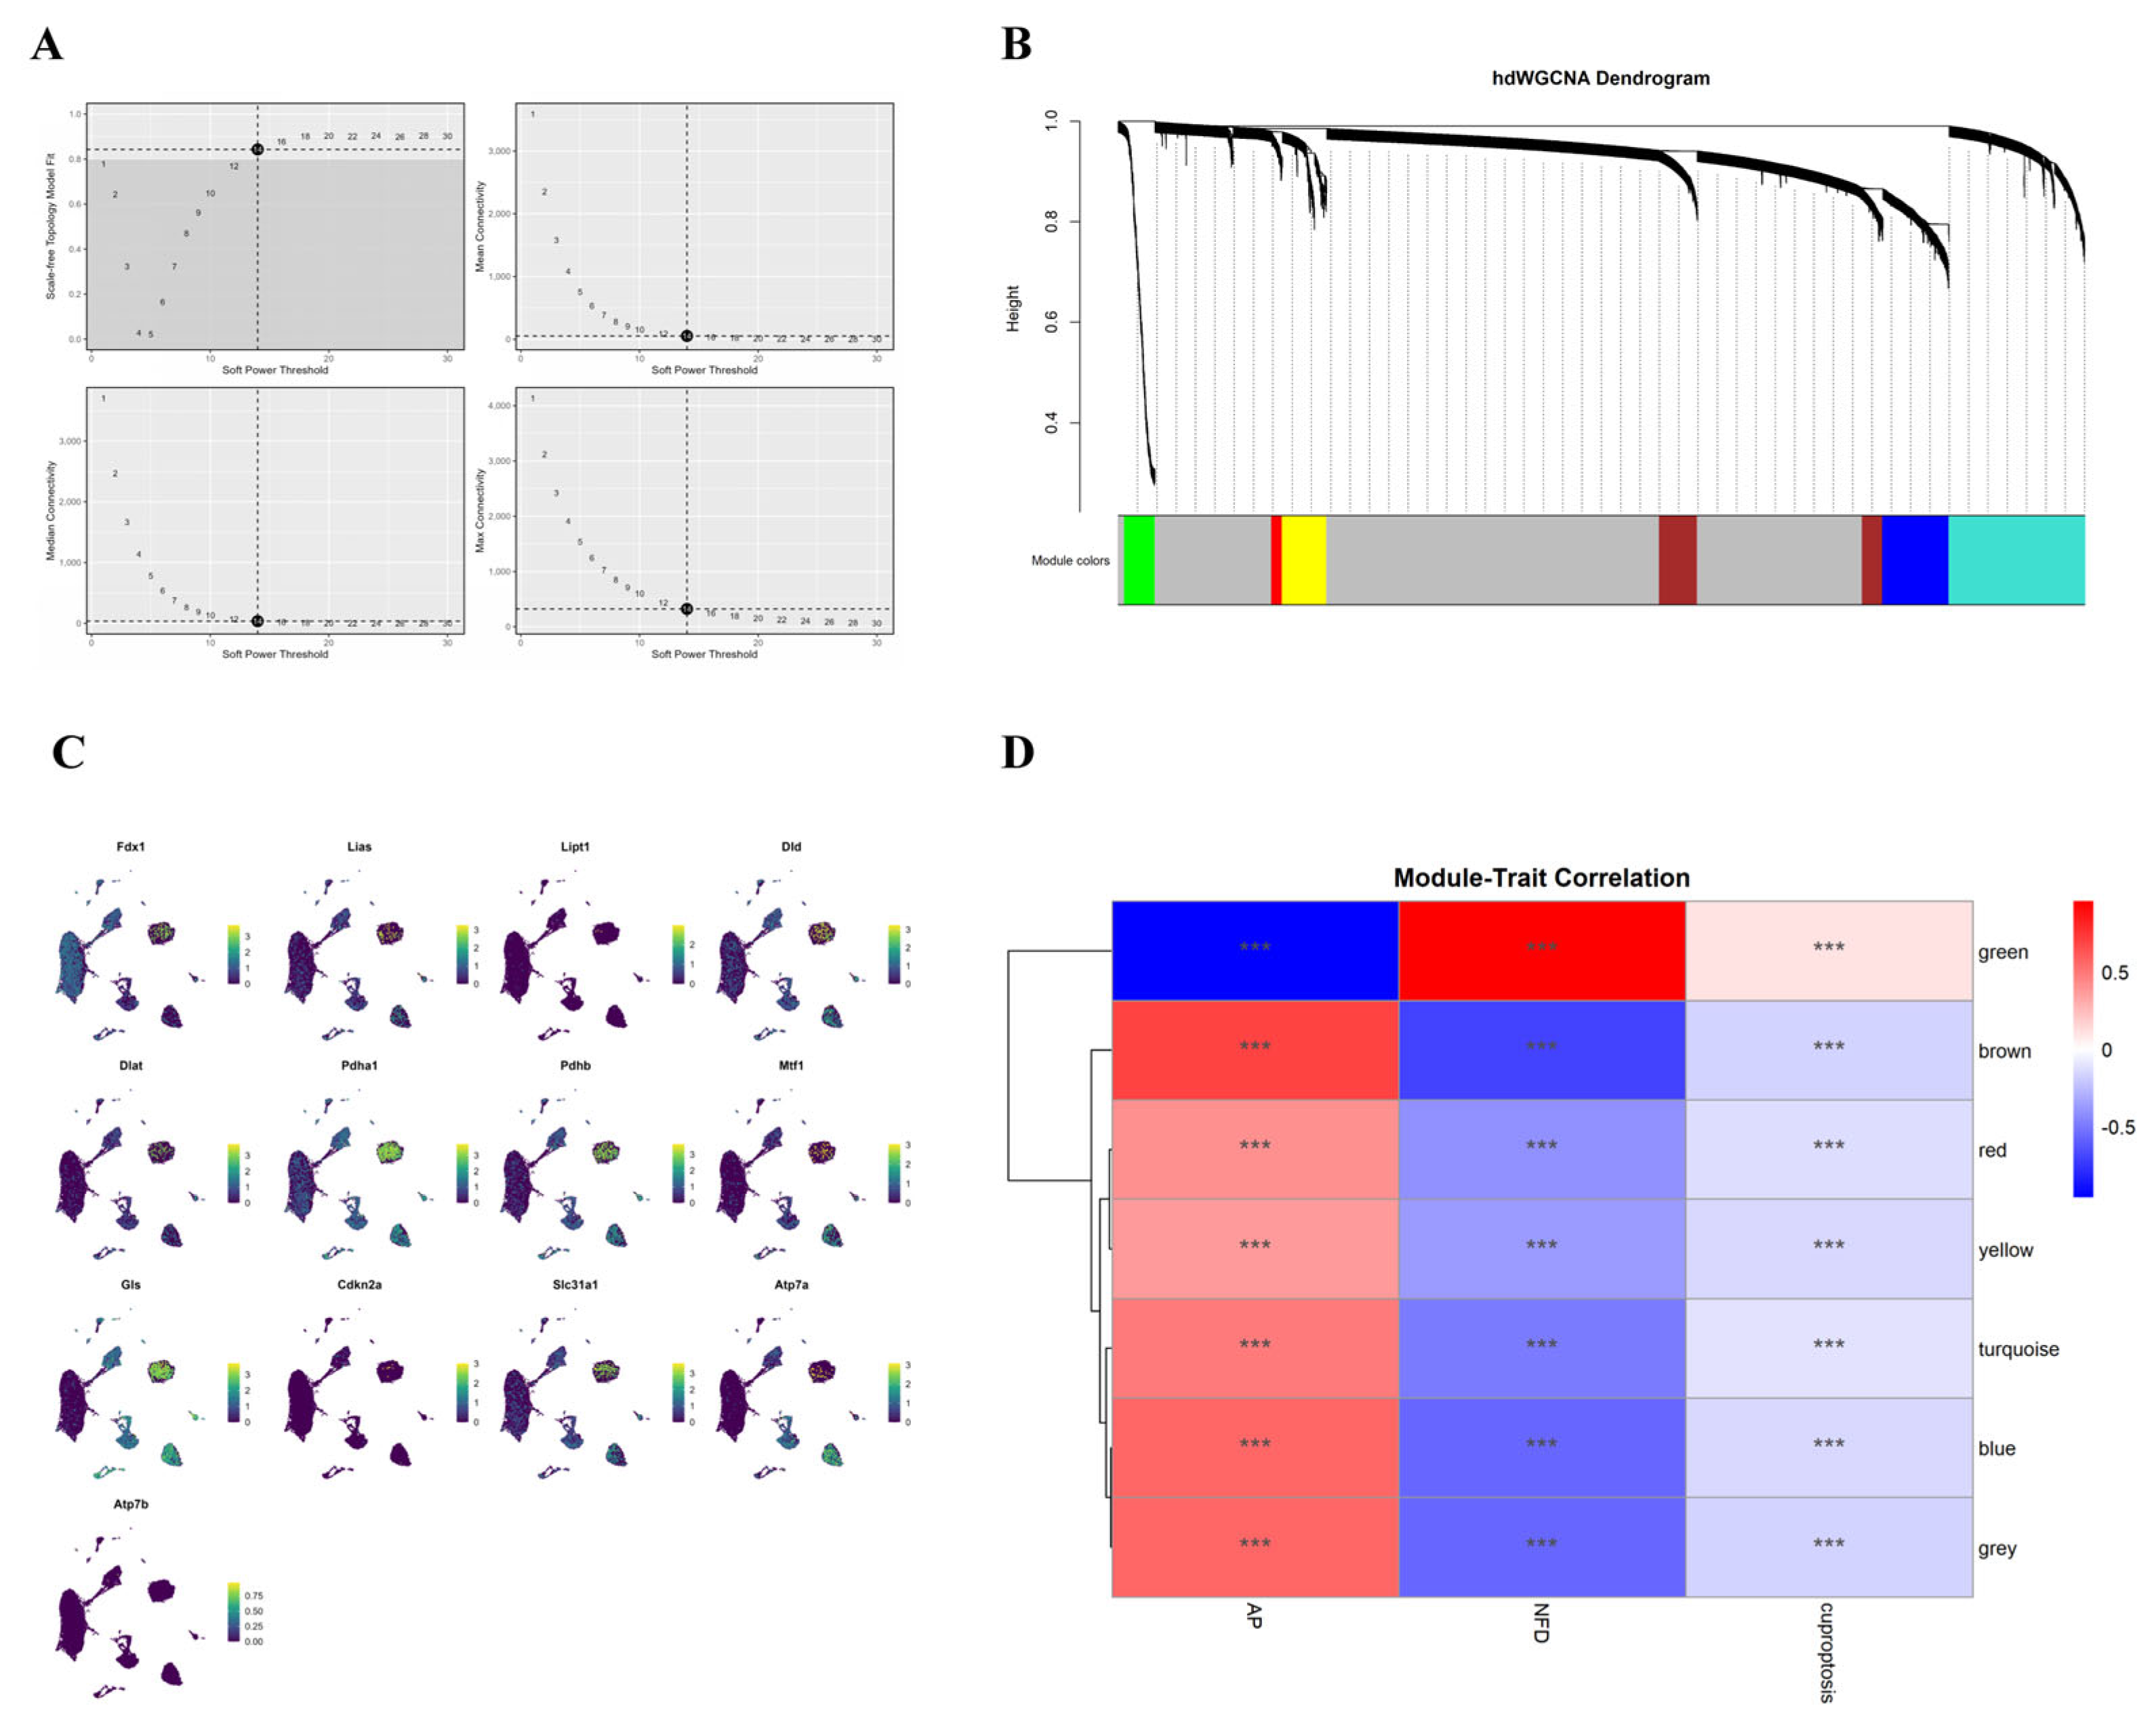
Figure 4.
Temporal dynamics of cuproptosis along the acinar cell injury trajectory.(A) Two-panel UMAP plots showing the Monocle3-reconstructed pseudotime trajectory of acinar cells. The left panel is coloured by pseudotime values, and the right panel is coloured by sample groups. (B) Scatter plot overlaid with LOESS locally weighted regression curve showing the trend of cuproptosis pathway scores along pseudotime. The x-axis represents pseudotime values, the y-axis represents cuproptosis scores, the red curve indicates the fitted line, and the grey band denotes the 95% confidence interval. (C) Multi-panel UMAP plots displaying the expression distributions of representative core cuproptosis genes along the pseudotime trajectory, with colour intensity reflecting gene expression levels. (D) UMAP plot overlaid with CytoTRACE stemness scores, with colour intensity indicating the degree of differentiation.
Figure 4.
Temporal dynamics of cuproptosis along the acinar cell injury trajectory.(A) Two-panel UMAP plots showing the Monocle3-reconstructed pseudotime trajectory of acinar cells. The left panel is coloured by pseudotime values, and the right panel is coloured by sample groups. (B) Scatter plot overlaid with LOESS locally weighted regression curve showing the trend of cuproptosis pathway scores along pseudotime. The x-axis represents pseudotime values, the y-axis represents cuproptosis scores, the red curve indicates the fitted line, and the grey band denotes the 95% confidence interval. (C) Multi-panel UMAP plots displaying the expression distributions of representative core cuproptosis genes along the pseudotime trajectory, with colour intensity reflecting gene expression levels. (D) UMAP plot overlaid with CytoTRACE stemness scores, with colour intensity indicating the degree of differentiation.
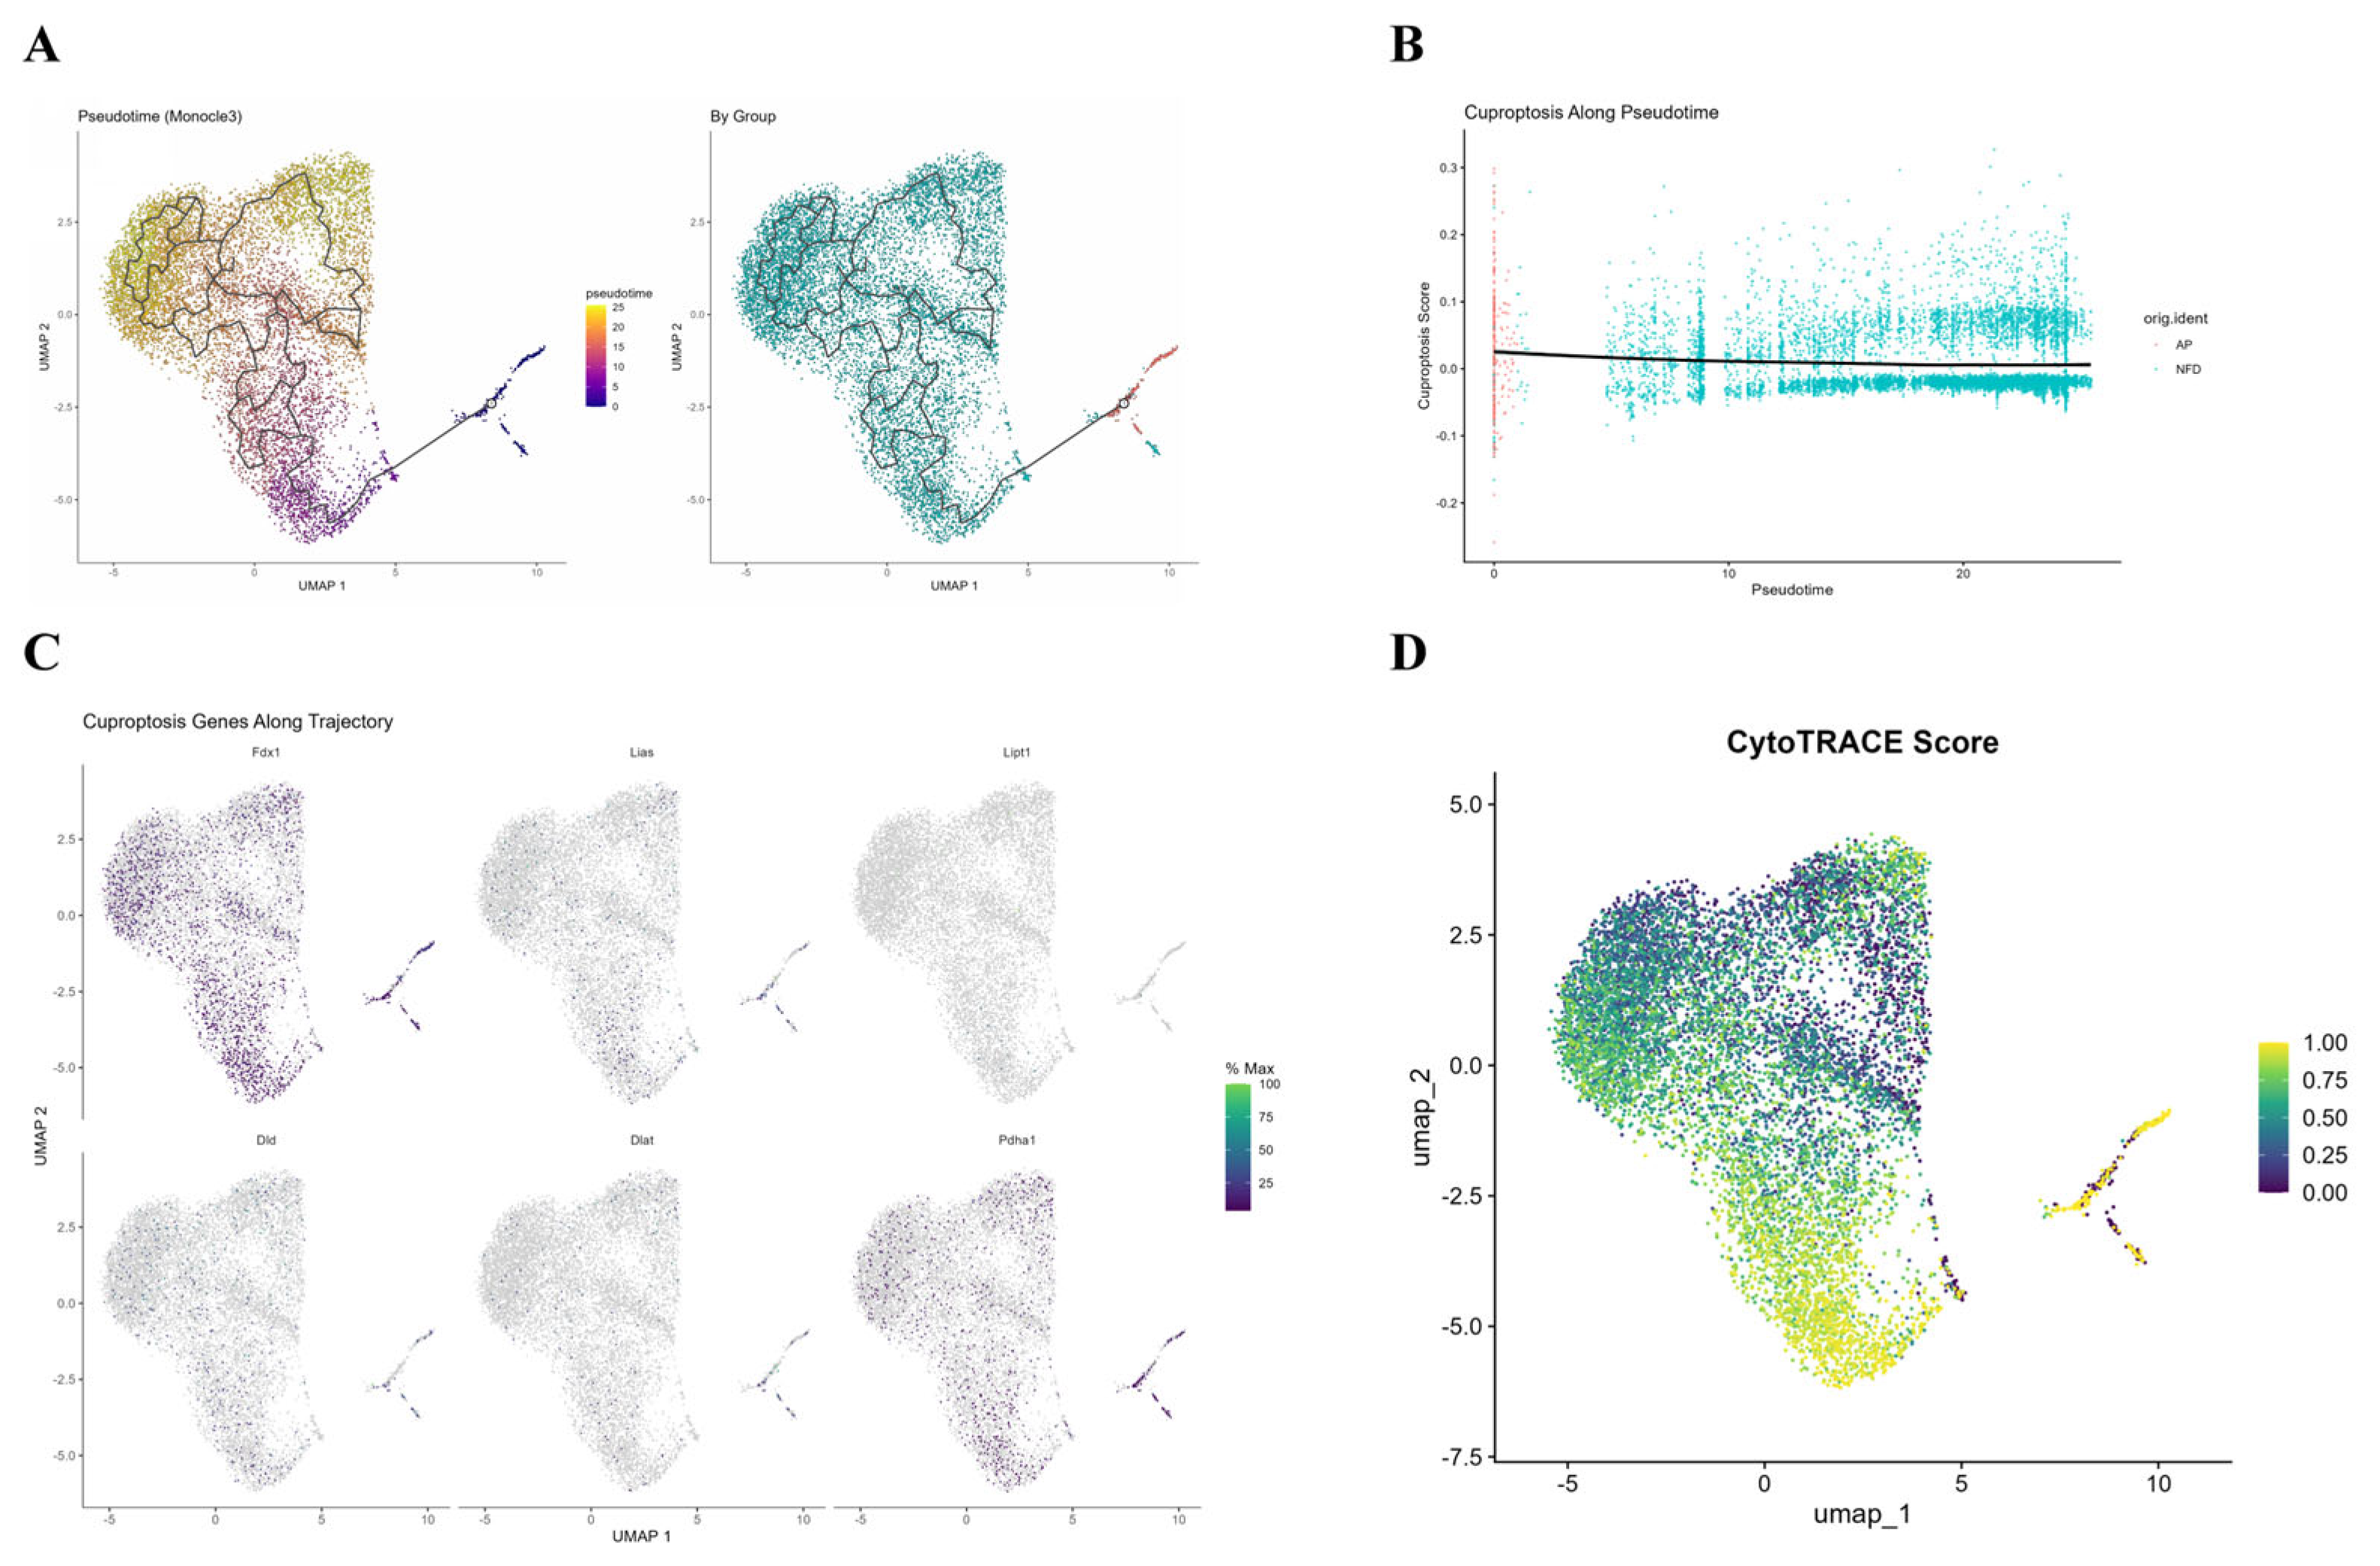
Figure 5.
Transcriptional regulatory network of cuproptosis. (A) Heatmap showing the average activity of the top 30 transcription factors with the greatest variability in acinar cells, grouped by cell type. The color scale indicates differences in transcription factor activity among the groups. (B) Heatmap displaying the average activity distribution of transcription factors directly regulating core cuproptosis genes across various cell types. The horizontal axis represents different cell types, and the vertical axis represents transcription factors, with color intensity indicating the level of transcription factor activity. (C) Horizontal bar plot illustrating the differential activity of cuproptosis-related transcription factors in acinar cells between the AP and NFD groups, expressed as the difference (AP minus NFD). Red bars indicate positive differences, and blue bars indicate negative differences. Asterisks denote statistical significance levels.
Figure 5.
Transcriptional regulatory network of cuproptosis. (A) Heatmap showing the average activity of the top 30 transcription factors with the greatest variability in acinar cells, grouped by cell type. The color scale indicates differences in transcription factor activity among the groups. (B) Heatmap displaying the average activity distribution of transcription factors directly regulating core cuproptosis genes across various cell types. The horizontal axis represents different cell types, and the vertical axis represents transcription factors, with color intensity indicating the level of transcription factor activity. (C) Horizontal bar plot illustrating the differential activity of cuproptosis-related transcription factors in acinar cells between the AP and NFD groups, expressed as the difference (AP minus NFD). Red bars indicate positive differences, and blue bars indicate negative differences. Asterisks denote statistical significance levels.
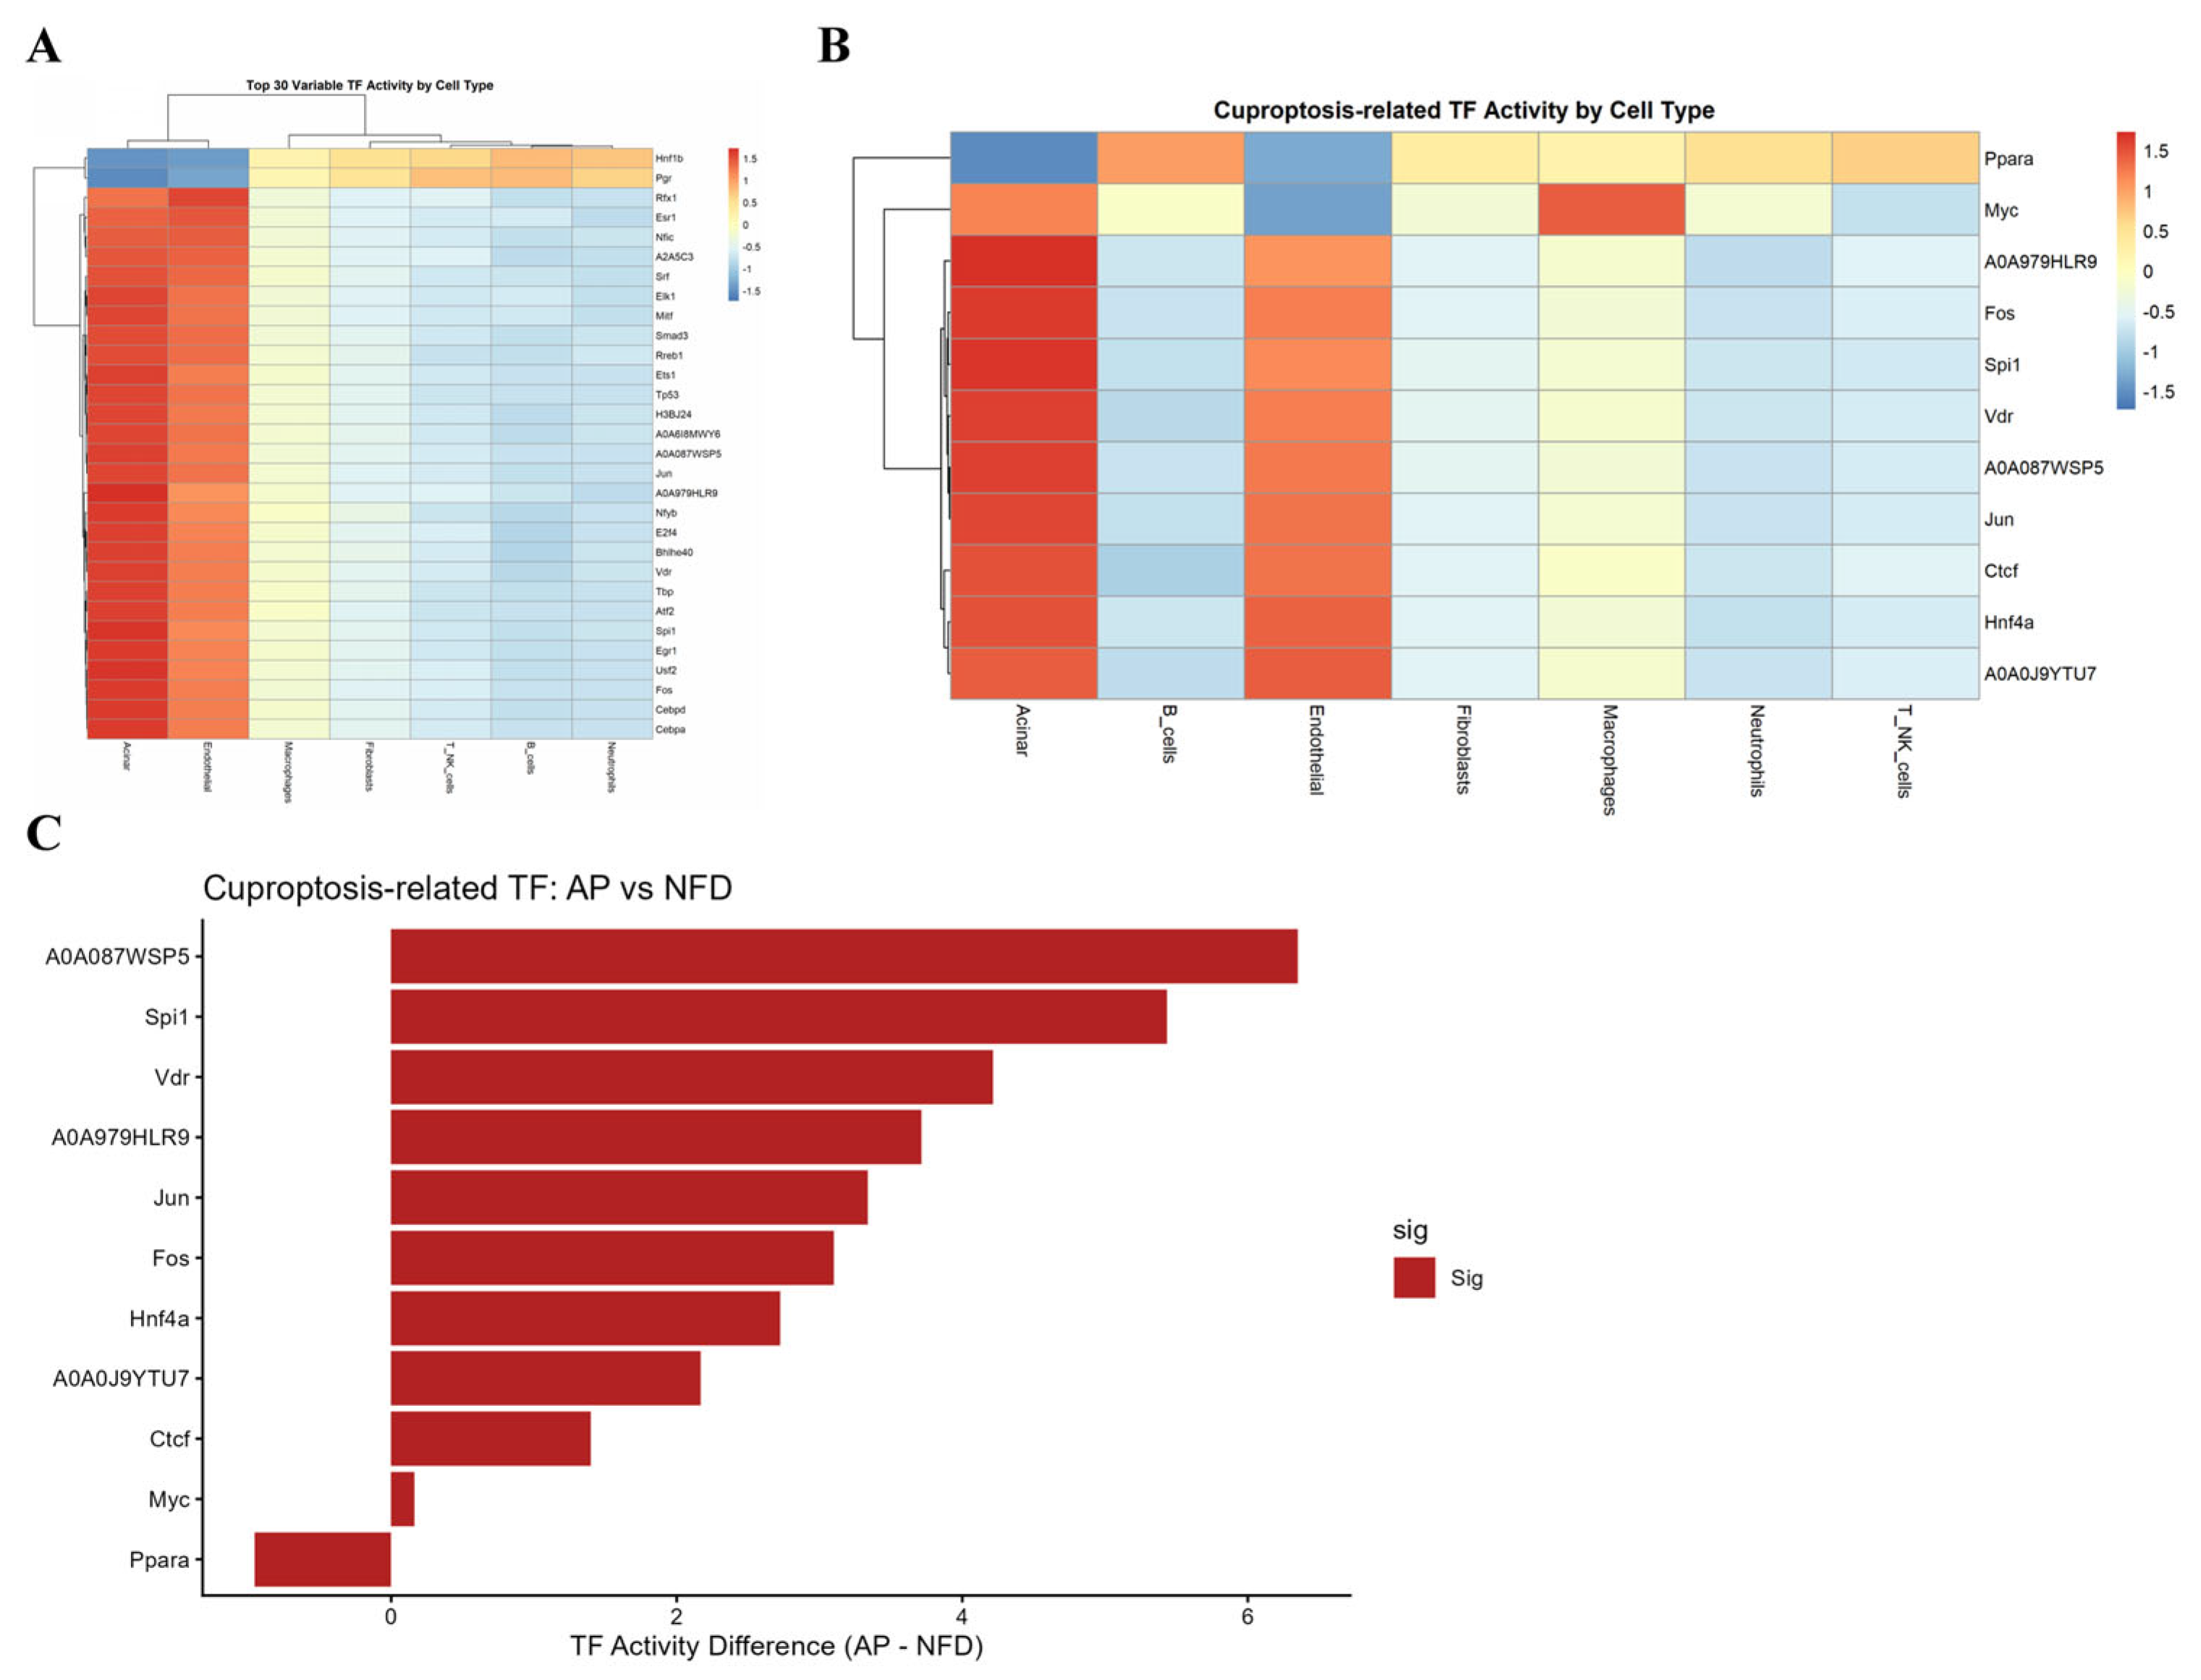
Figure 6.
Remodeling of cell-cell communication in acute pancreatitis.(A) Bar plots comparing the number of intercellular communications (left) and total communication strength (right) between the NFD and AP groups. (B) Stacked bar plot showing the relative activity (contribution) of each signalling pathway in the NFD and AP groups, with the horizontal axis representing pathway names and the vertical axis representing the percentage of relative activity. (C) Chord diagram illustrating the differential communication network between the NFD and AP groups. The left semicircle represents the NFD group, and the right semicircle represents the AP group; different colours denote different cell types, and the width of the chords indicates communication strength. (D) Chord diagram depicting the intercellular communication network of the MIF signalling pathway in the AP group, with different colours representing different cell types and chord width indicating the interaction strength of ligand–receptor pairs. (E) Chord diagram depicting the intercellular communication network of the CCL chemokine signalling pathway in the AP group. (F) Chord diagram depicting the intercellular communication network of the Annexin signalling pathway in the AP group. (G) Chord diagram depicting the intercellular communication network of the Galectin signalling pathway in the AP group.
Figure 6.
Remodeling of cell-cell communication in acute pancreatitis.(A) Bar plots comparing the number of intercellular communications (left) and total communication strength (right) between the NFD and AP groups. (B) Stacked bar plot showing the relative activity (contribution) of each signalling pathway in the NFD and AP groups, with the horizontal axis representing pathway names and the vertical axis representing the percentage of relative activity. (C) Chord diagram illustrating the differential communication network between the NFD and AP groups. The left semicircle represents the NFD group, and the right semicircle represents the AP group; different colours denote different cell types, and the width of the chords indicates communication strength. (D) Chord diagram depicting the intercellular communication network of the MIF signalling pathway in the AP group, with different colours representing different cell types and chord width indicating the interaction strength of ligand–receptor pairs. (E) Chord diagram depicting the intercellular communication network of the CCL chemokine signalling pathway in the AP group. (F) Chord diagram depicting the intercellular communication network of the Annexin signalling pathway in the AP group. (G) Chord diagram depicting the intercellular communication network of the Galectin signalling pathway in the AP group.
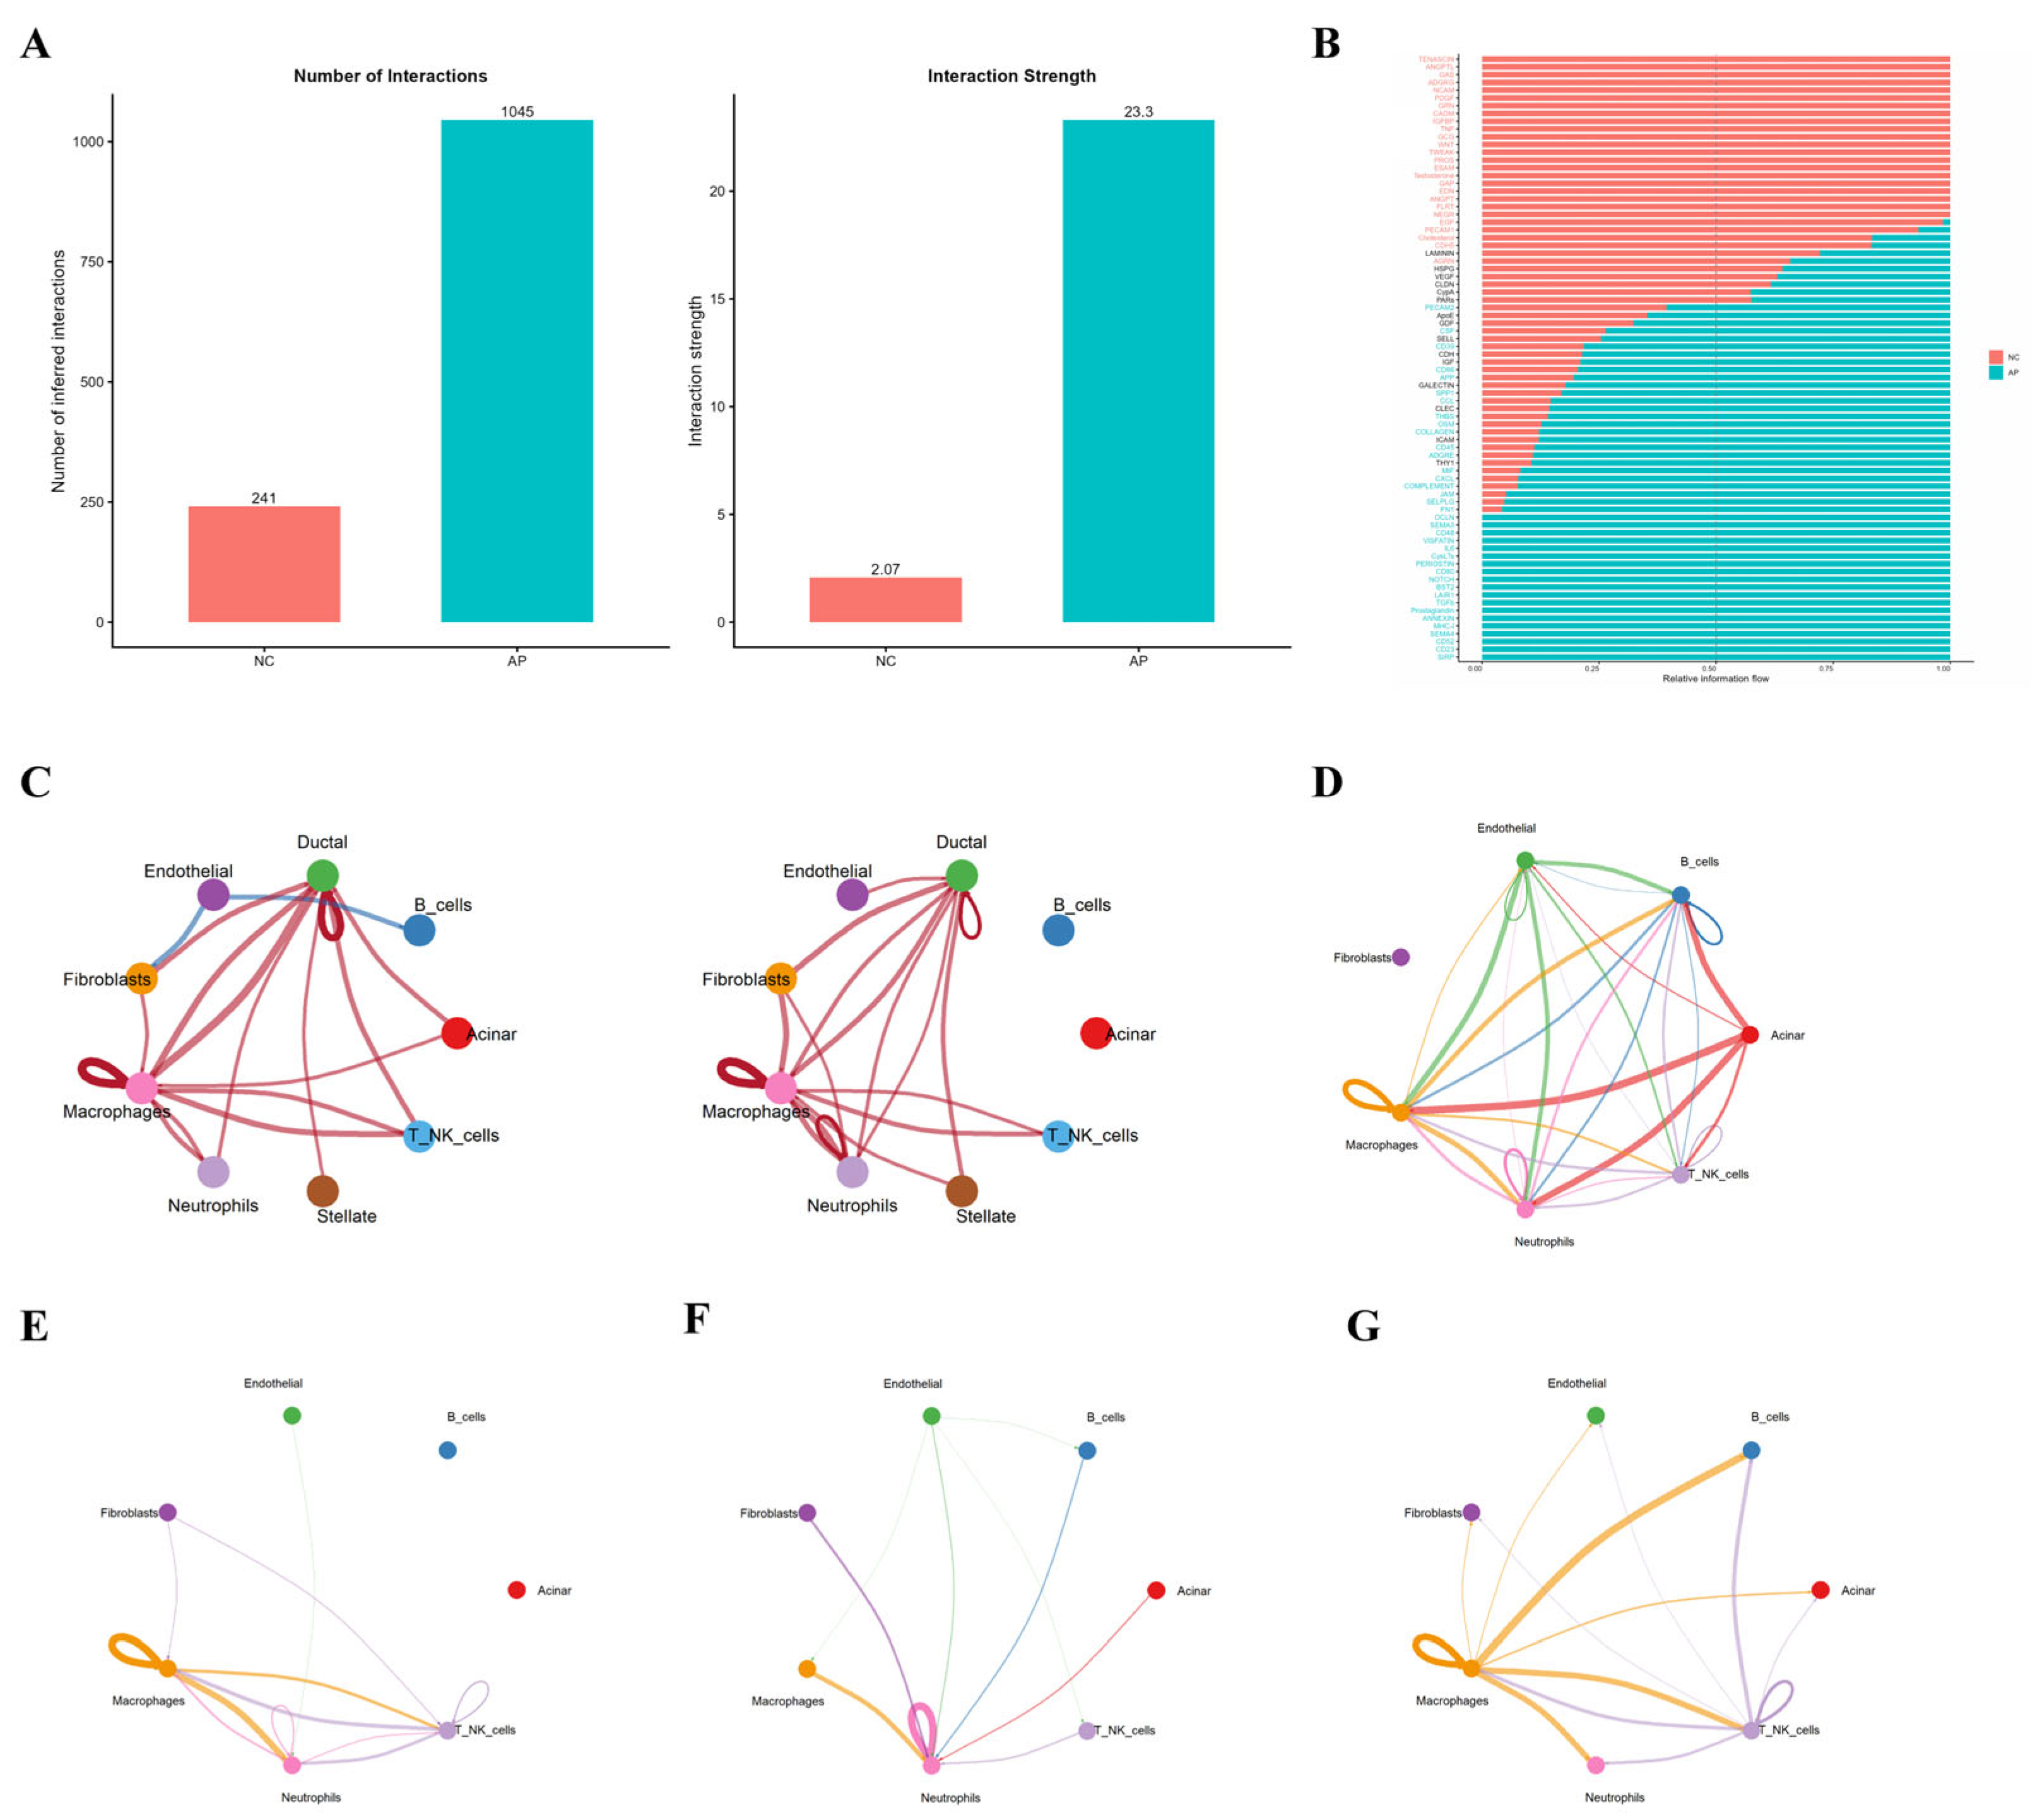
Figure 7.
Independent validation using a single-cell dataset (GSE188819).(A) Two-panel UMAP plot showing cell type annotations (left) and group distribution (CER caerulein-treated group vs. WT control group, right) in the independent mouse AP dataset GSE188819. (B) UMAP plot overlaid with cuproptosis pathway scores, with colour intensity representing the score level. (C) Stacked bar plot showing the proportional distribution of cell types between the CER and WT control groups in the GSE188819 dataset. (D) Bubble plot comparing the expression differences of core cuproptosis genes between the CER and WT control groups in the GSE188819 dataset; dot size indicates the proportion of cells expressing the gene, and colour depth represents the average expression level. (E) Box plots displaying the distribution of cuproptosis pathway scores stratified by cell type, with the horizontal axis representing cell types and the vertical axis representing pathway scores.(F) Violin plots showing the probability density distribution of cuproptosis pathway scores stratified by cell type. (G) UMAP plot overlaid with eigen-gene activity scores of each co-expression module, with different colours representing different modules, showing the enriched regions of each module in the UMAP space. (H) Multi-panel UMAP plots showing the expression distribution of representative core cuproptosis genes, with colour depth indicating the expression level.
Figure 7.
Independent validation using a single-cell dataset (GSE188819).(A) Two-panel UMAP plot showing cell type annotations (left) and group distribution (CER caerulein-treated group vs. WT control group, right) in the independent mouse AP dataset GSE188819. (B) UMAP plot overlaid with cuproptosis pathway scores, with colour intensity representing the score level. (C) Stacked bar plot showing the proportional distribution of cell types between the CER and WT control groups in the GSE188819 dataset. (D) Bubble plot comparing the expression differences of core cuproptosis genes between the CER and WT control groups in the GSE188819 dataset; dot size indicates the proportion of cells expressing the gene, and colour depth represents the average expression level. (E) Box plots displaying the distribution of cuproptosis pathway scores stratified by cell type, with the horizontal axis representing cell types and the vertical axis representing pathway scores.(F) Violin plots showing the probability density distribution of cuproptosis pathway scores stratified by cell type. (G) UMAP plot overlaid with eigen-gene activity scores of each co-expression module, with different colours representing different modules, showing the enriched regions of each module in the UMAP space. (H) Multi-panel UMAP plots showing the expression distribution of representative core cuproptosis genes, with colour depth indicating the expression level.
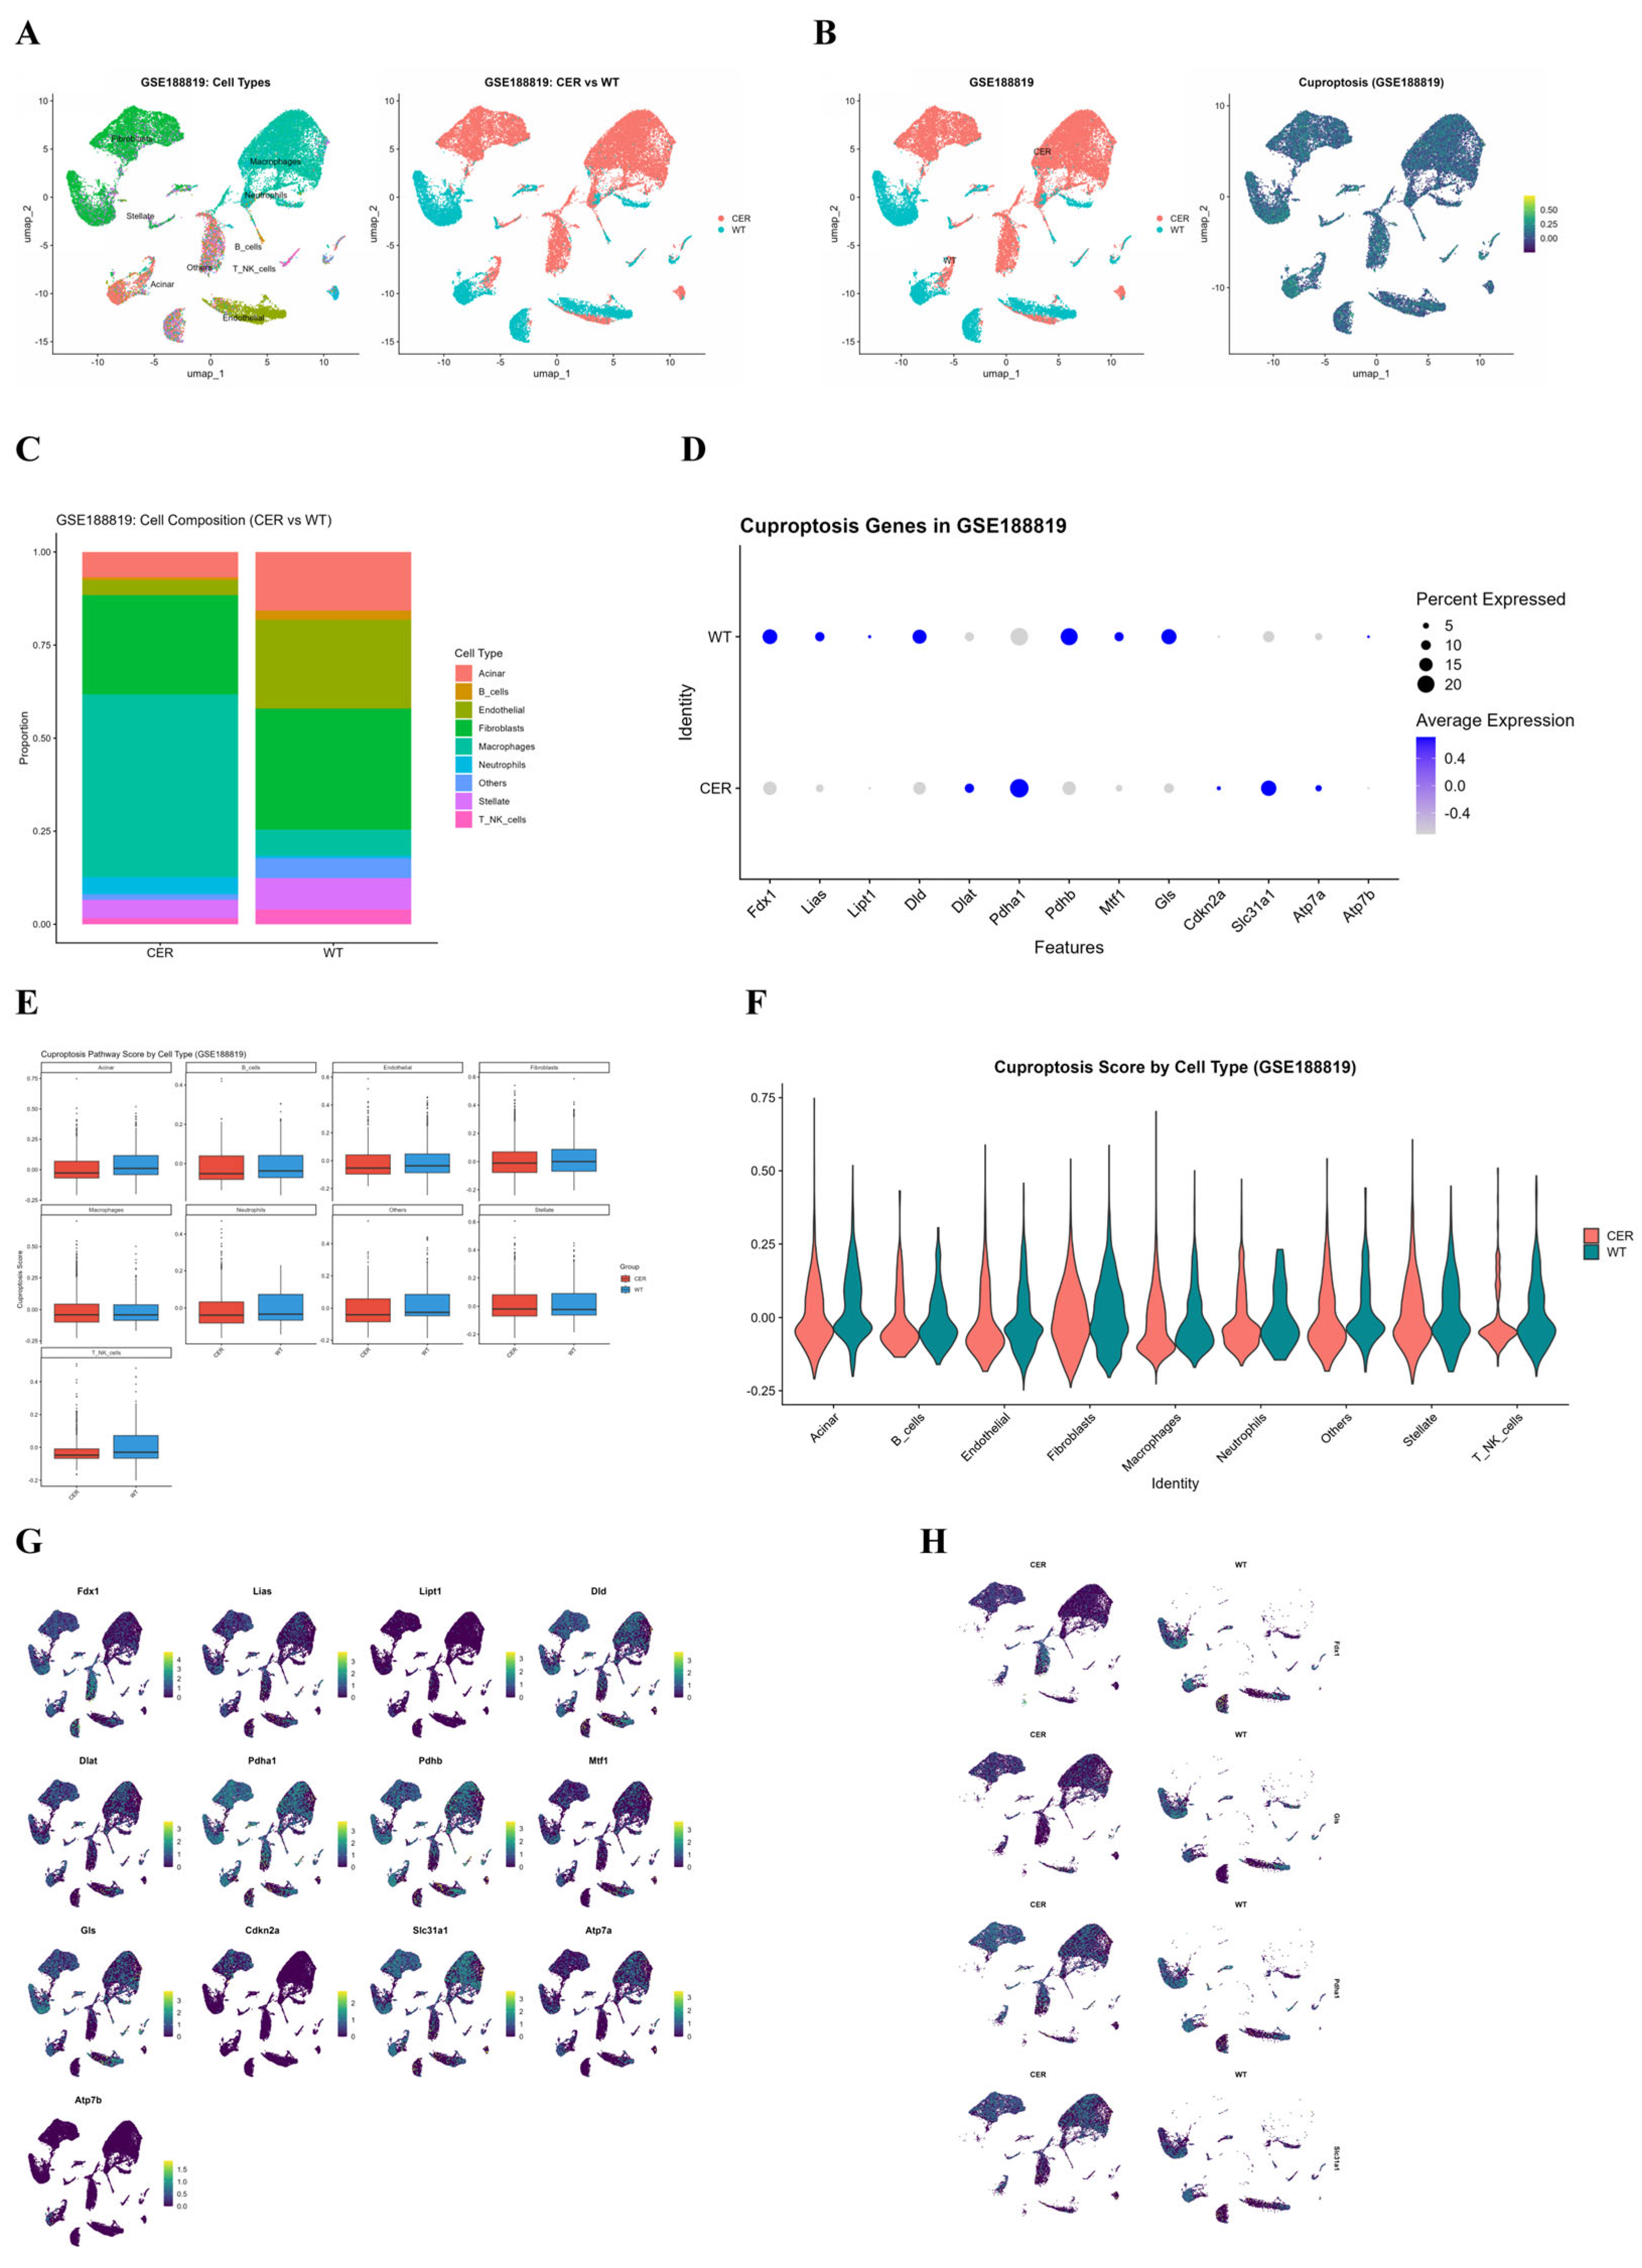
Figure 8.
External validation using a human clinical transcriptomic dataset (GSE194331).(A) Volcano plot showing genome-wide differential expression analysis results between acute pancreatitis patients and healthy controls in the GSE194331 dataset. Red dots represent significantly upregulated genes, blue dots represent significantly downregulated genes, and grey dots indicate genes with no significant difference.(B) Heatmap displaying the expression patterns of the 13 core cuproptosis-related genes across 119 human samples, including healthy controls, acute pancreatitis, and acute pancreatitis with sepsis groups. Red indicates high expression, and blue indicates low expression.(C) Box plots showing the expression level distribution of representative cuproptosis genes across the three human sample groups, with the horizontal axis representing group categories and the vertical axis representing gene expression levels.(D) Grouped box plots illustrating the expression differences of representative cuproptosis genes among the three groups, with the horizontal axis denoting group categories and the vertical axis denoting gene expression levels.(E) Receiver operating characteristic (ROC) curves evaluating the diagnostic performance of cuproptosis genes in distinguishing acute pancreatitis patients from healthy controls.
Figure 8.
External validation using a human clinical transcriptomic dataset (GSE194331).(A) Volcano plot showing genome-wide differential expression analysis results between acute pancreatitis patients and healthy controls in the GSE194331 dataset. Red dots represent significantly upregulated genes, blue dots represent significantly downregulated genes, and grey dots indicate genes with no significant difference.(B) Heatmap displaying the expression patterns of the 13 core cuproptosis-related genes across 119 human samples, including healthy controls, acute pancreatitis, and acute pancreatitis with sepsis groups. Red indicates high expression, and blue indicates low expression.(C) Box plots showing the expression level distribution of representative cuproptosis genes across the three human sample groups, with the horizontal axis representing group categories and the vertical axis representing gene expression levels.(D) Grouped box plots illustrating the expression differences of representative cuproptosis genes among the three groups, with the horizontal axis denoting group categories and the vertical axis denoting gene expression levels.(E) Receiver operating characteristic (ROC) curves evaluating the diagnostic performance of cuproptosis genes in distinguishing acute pancreatitis patients from healthy controls.
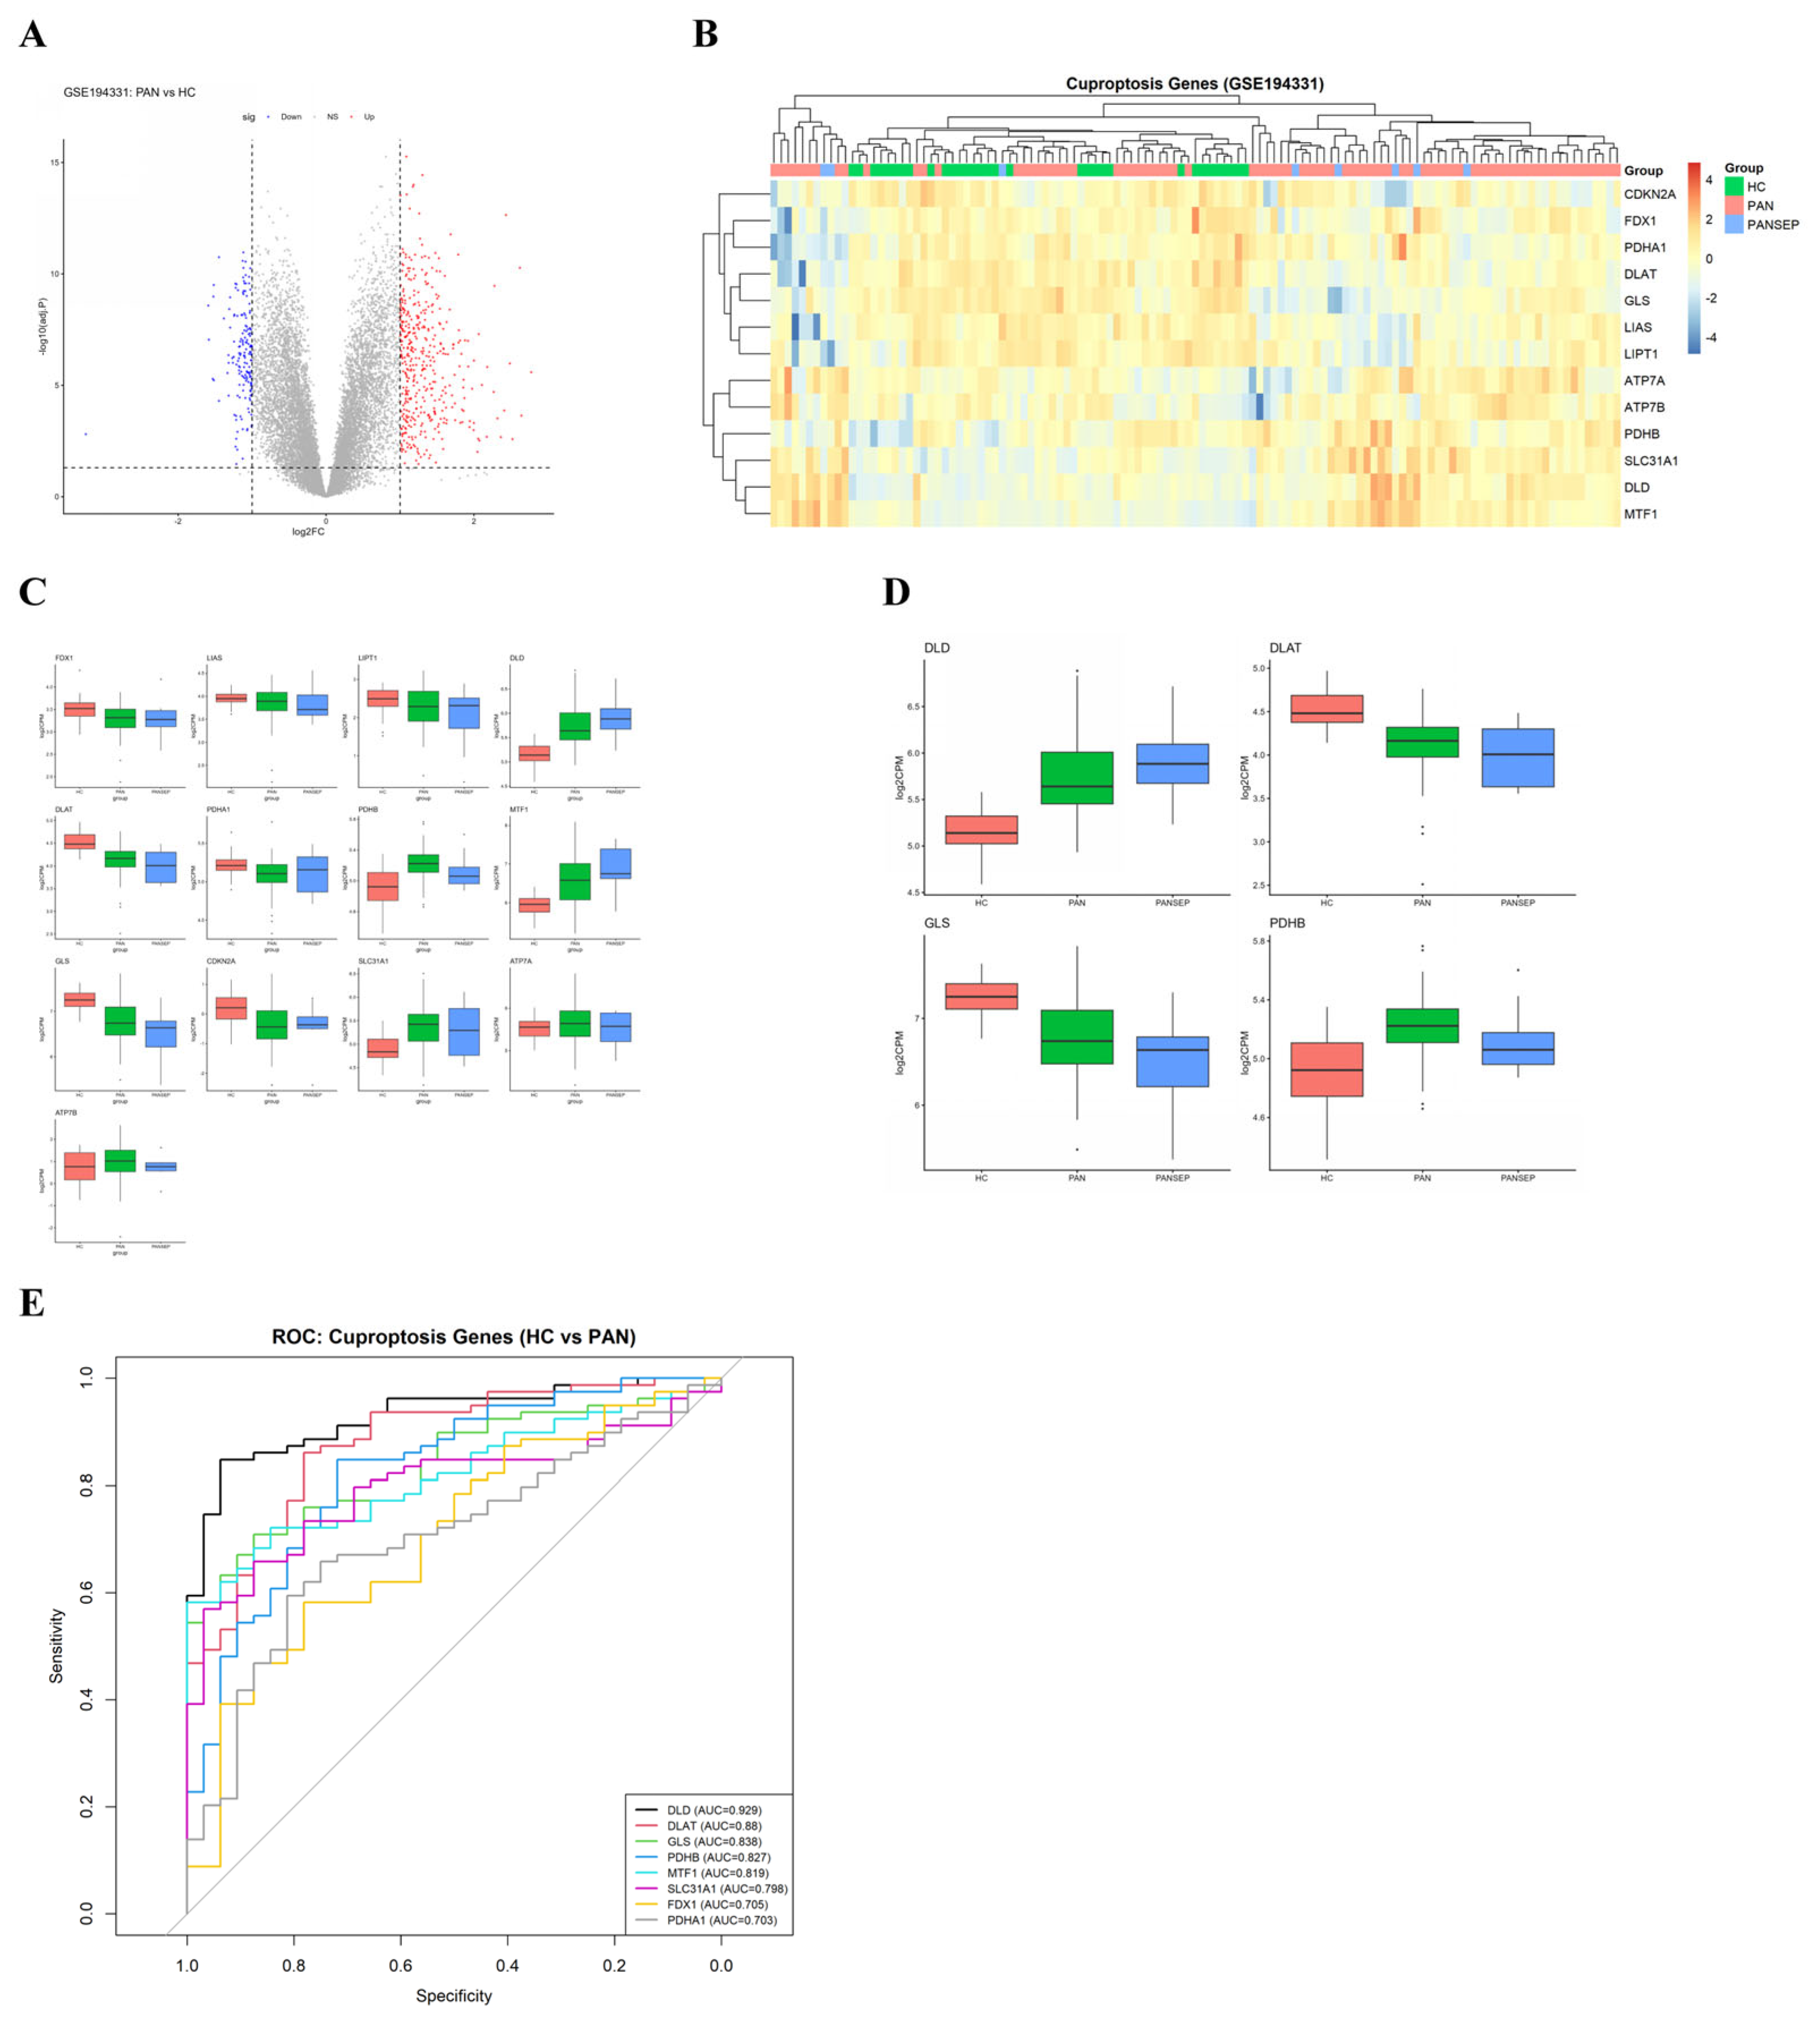
Figure 9.
Phenotypic validation of cuproptosis and effects of TTM intervention in a mouse model of severe acute pancreatitis.(A) Hematoxylin and eosin (H&E) staining showing the histopathological morphology of pancreatic tissues in each group.(B) Bar graphs showing quantitative comparisons of histopathological scores and tissue oedema among groups, with the horizontal axis representing groups and the vertical axis representing score values.(C) Bar graphs showing serum amylase and lipase activity levels in each group, with the horizontal axis representing groups and the vertical axis representing enzyme activity units.(D) Bar graphs showing serum concentrations of inflammatory cytokines (TNF-α, IL-1β, and IL-6) in each group, with the horizontal axis representing groups and the vertical axis representing cytokine concentrations.(E) Representative immunofluorescence images of myeloperoxidase (MPO) in pancreatic tissues of each group.(F) Western blotting showing protein expression bands and quantitative comparisons of ferredoxin 1 (FDX1) and dihydrolipoamide S-acetyltransferase (DLAT) in pancreatic tissues of each group.(G) Representative immunohistochemical staining images of FDX1 and DLAT in pancreatic tissues of each group.(H) Inductively coupled plasma mass spectrometry (ICP-MS) showing quantitative comparisons of total copper content in pancreatic tissues of each group, with the horizontal axis representing groups and the vertical axis representing copper content.
Figure 9.
Phenotypic validation of cuproptosis and effects of TTM intervention in a mouse model of severe acute pancreatitis.(A) Hematoxylin and eosin (H&E) staining showing the histopathological morphology of pancreatic tissues in each group.(B) Bar graphs showing quantitative comparisons of histopathological scores and tissue oedema among groups, with the horizontal axis representing groups and the vertical axis representing score values.(C) Bar graphs showing serum amylase and lipase activity levels in each group, with the horizontal axis representing groups and the vertical axis representing enzyme activity units.(D) Bar graphs showing serum concentrations of inflammatory cytokines (TNF-α, IL-1β, and IL-6) in each group, with the horizontal axis representing groups and the vertical axis representing cytokine concentrations.(E) Representative immunofluorescence images of myeloperoxidase (MPO) in pancreatic tissues of each group.(F) Western blotting showing protein expression bands and quantitative comparisons of ferredoxin 1 (FDX1) and dihydrolipoamide S-acetyltransferase (DLAT) in pancreatic tissues of each group.(G) Representative immunohistochemical staining images of FDX1 and DLAT in pancreatic tissues of each group.(H) Inductively coupled plasma mass spectrometry (ICP-MS) showing quantitative comparisons of total copper content in pancreatic tissues of each group, with the horizontal axis representing groups and the vertical axis representing copper content.
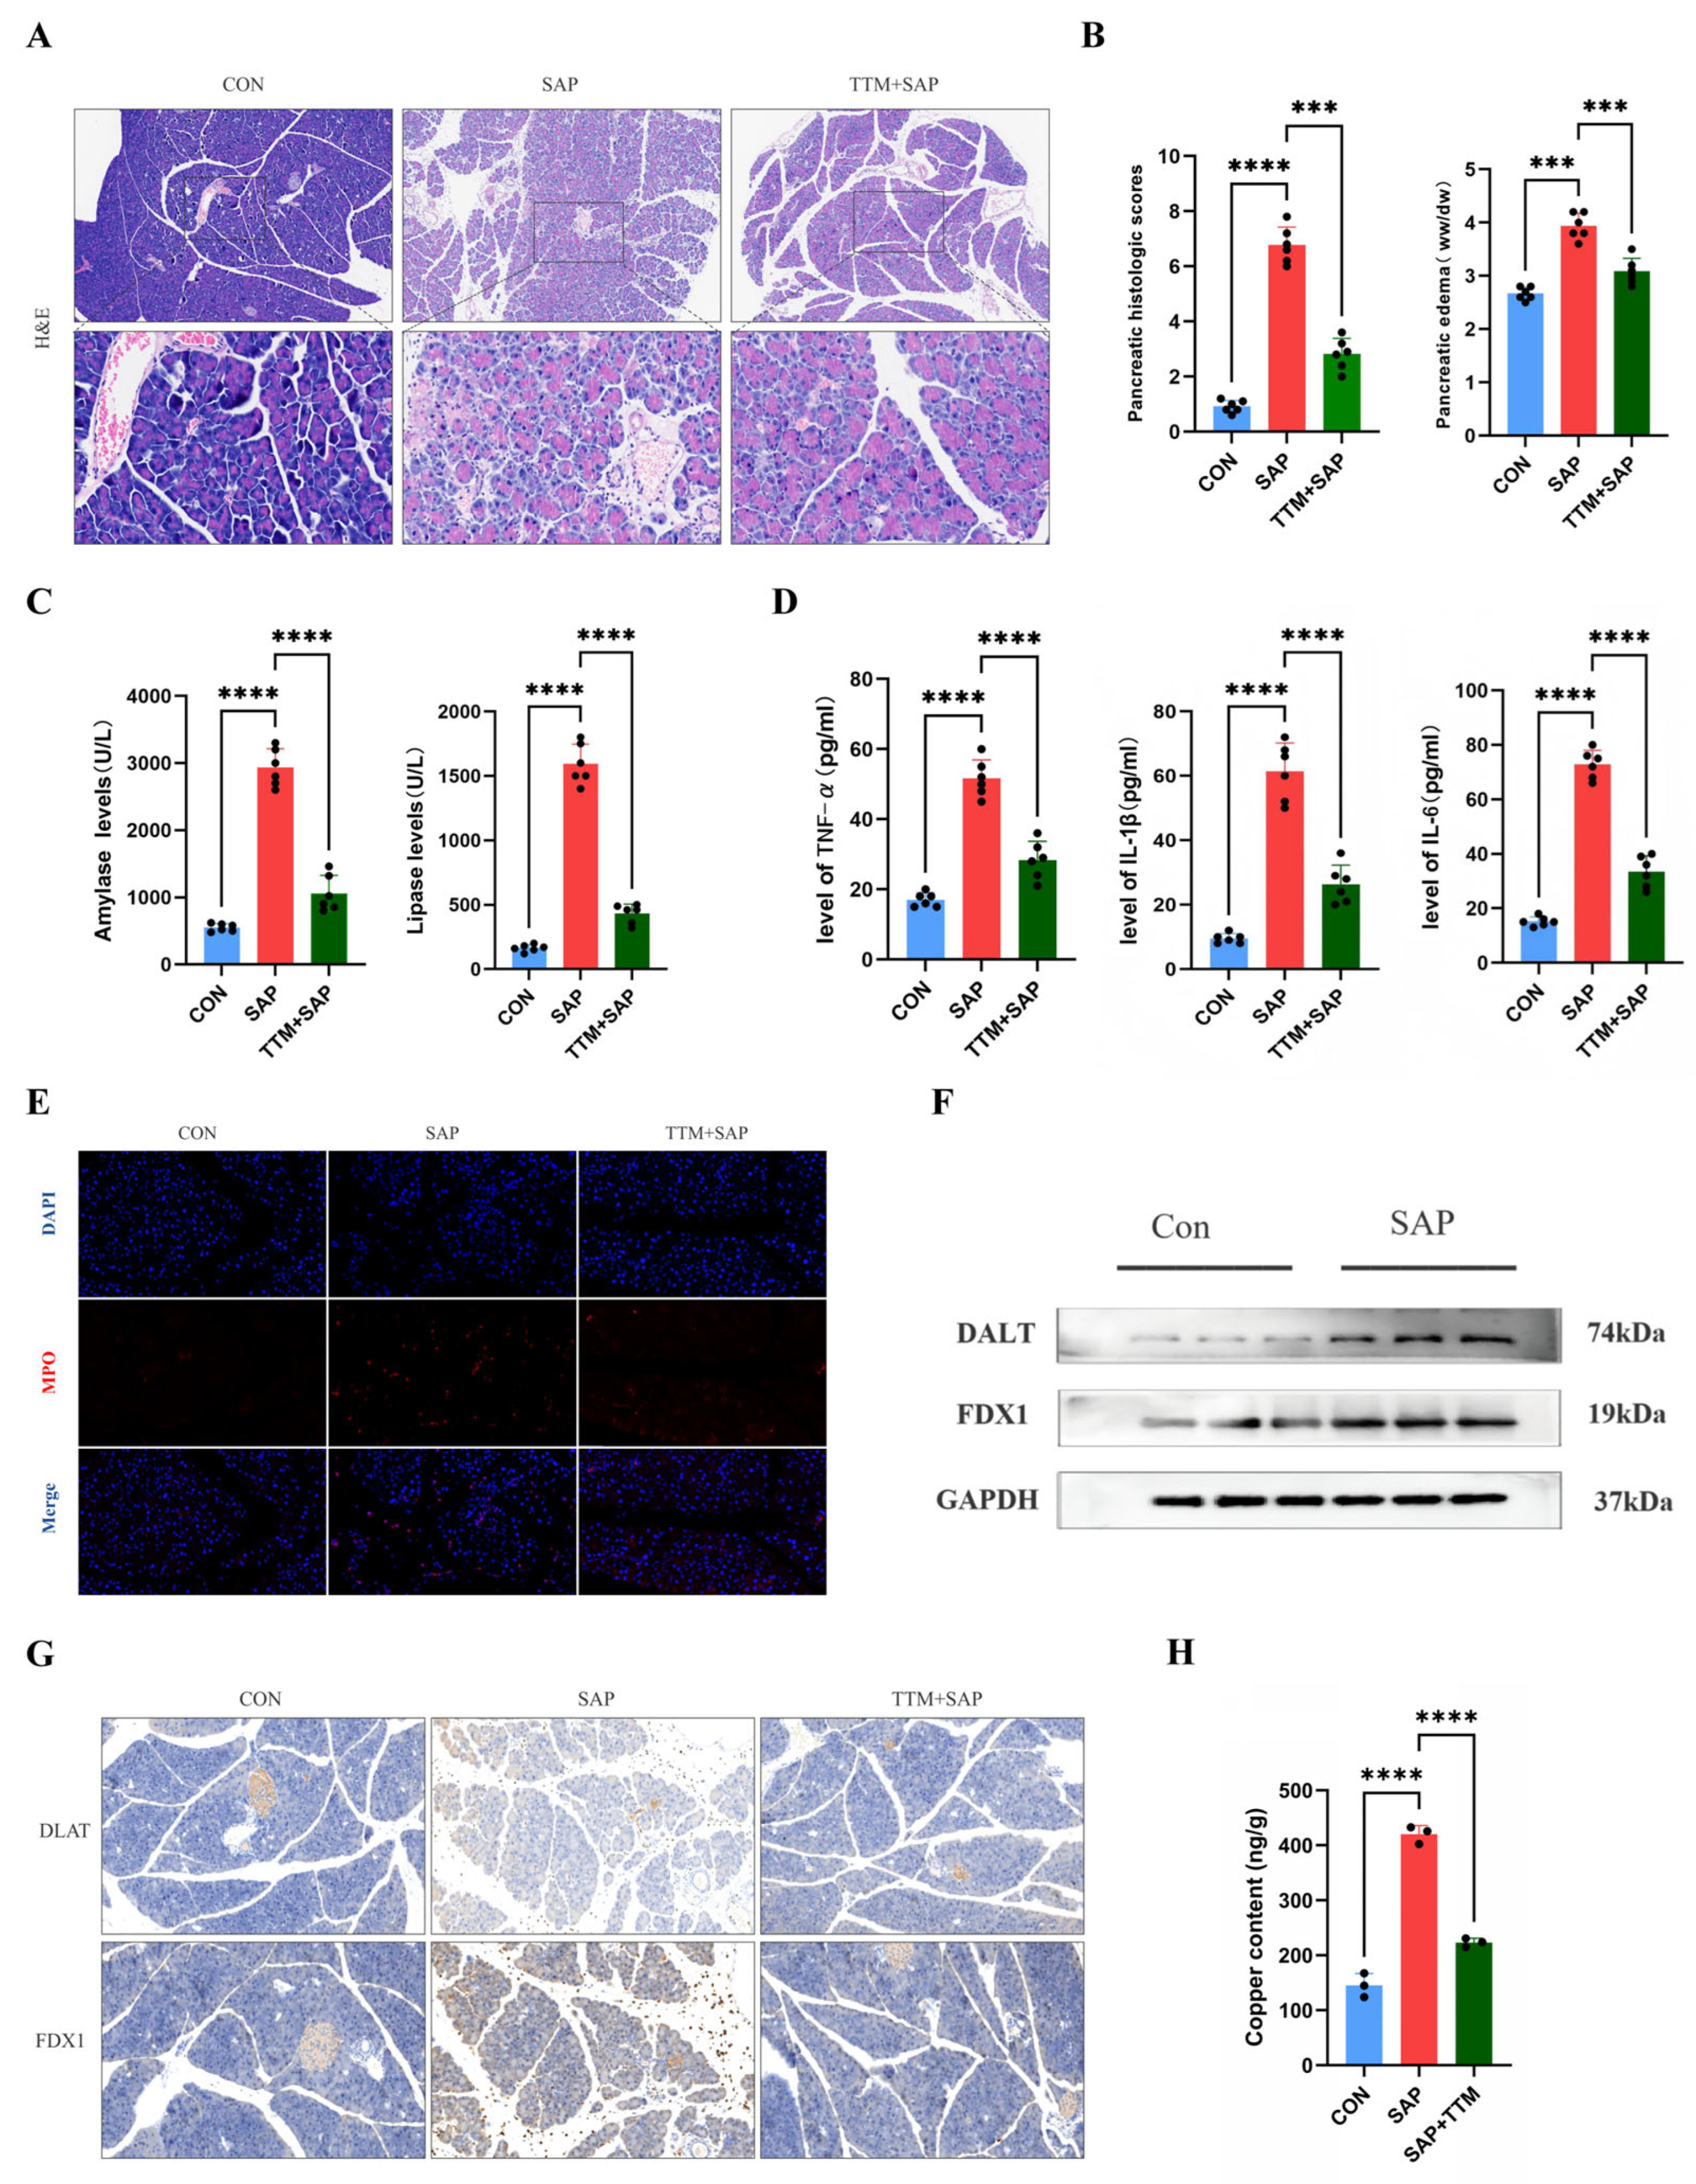
Figure 10.
In vitro phenotypic validation of acinar cell cuproptosis and the rescue effect of TTM.(A) Flow cytometric dot plots and quantitative bar graphs show the apoptosis rates of acinar cells in each group, with groups on the horizontal axis and the percentage of apoptotic cells on the vertical axis.(B) Transmission electron microscopy images display mitochondrial ultrastructure in acinar cells from the control and model groups.(C) Flow cytometric histograms and quantitative bar graphs show intracellular copper ion fluorescence intensity in acinar cells of each group, with groups on the horizontal axis and mean fluorescence intensity on the vertical axis.(D) Immunofluorescence staining presents representative images and quantitative comparisons of intracellular copper accumulation in acinar cells across groups.(E) Immunofluorescence staining shows the expression distribution and quantitative comparison of ferredoxin 1 (FDX1) in acinar cells per group.(F) Immunofluorescence staining shows the expression distribution and quantitative comparison of dihydrolipoamide Sacetyltransferase (DLAT) in acinar cells per group.
Figure 10.
In vitro phenotypic validation of acinar cell cuproptosis and the rescue effect of TTM.(A) Flow cytometric dot plots and quantitative bar graphs show the apoptosis rates of acinar cells in each group, with groups on the horizontal axis and the percentage of apoptotic cells on the vertical axis.(B) Transmission electron microscopy images display mitochondrial ultrastructure in acinar cells from the control and model groups.(C) Flow cytometric histograms and quantitative bar graphs show intracellular copper ion fluorescence intensity in acinar cells of each group, with groups on the horizontal axis and mean fluorescence intensity on the vertical axis.(D) Immunofluorescence staining presents representative images and quantitative comparisons of intracellular copper accumulation in acinar cells across groups.(E) Immunofluorescence staining shows the expression distribution and quantitative comparison of ferredoxin 1 (FDX1) in acinar cells per group.(F) Immunofluorescence staining shows the expression distribution and quantitative comparison of dihydrolipoamide Sacetyltransferase (DLAT) in acinar cells per group.
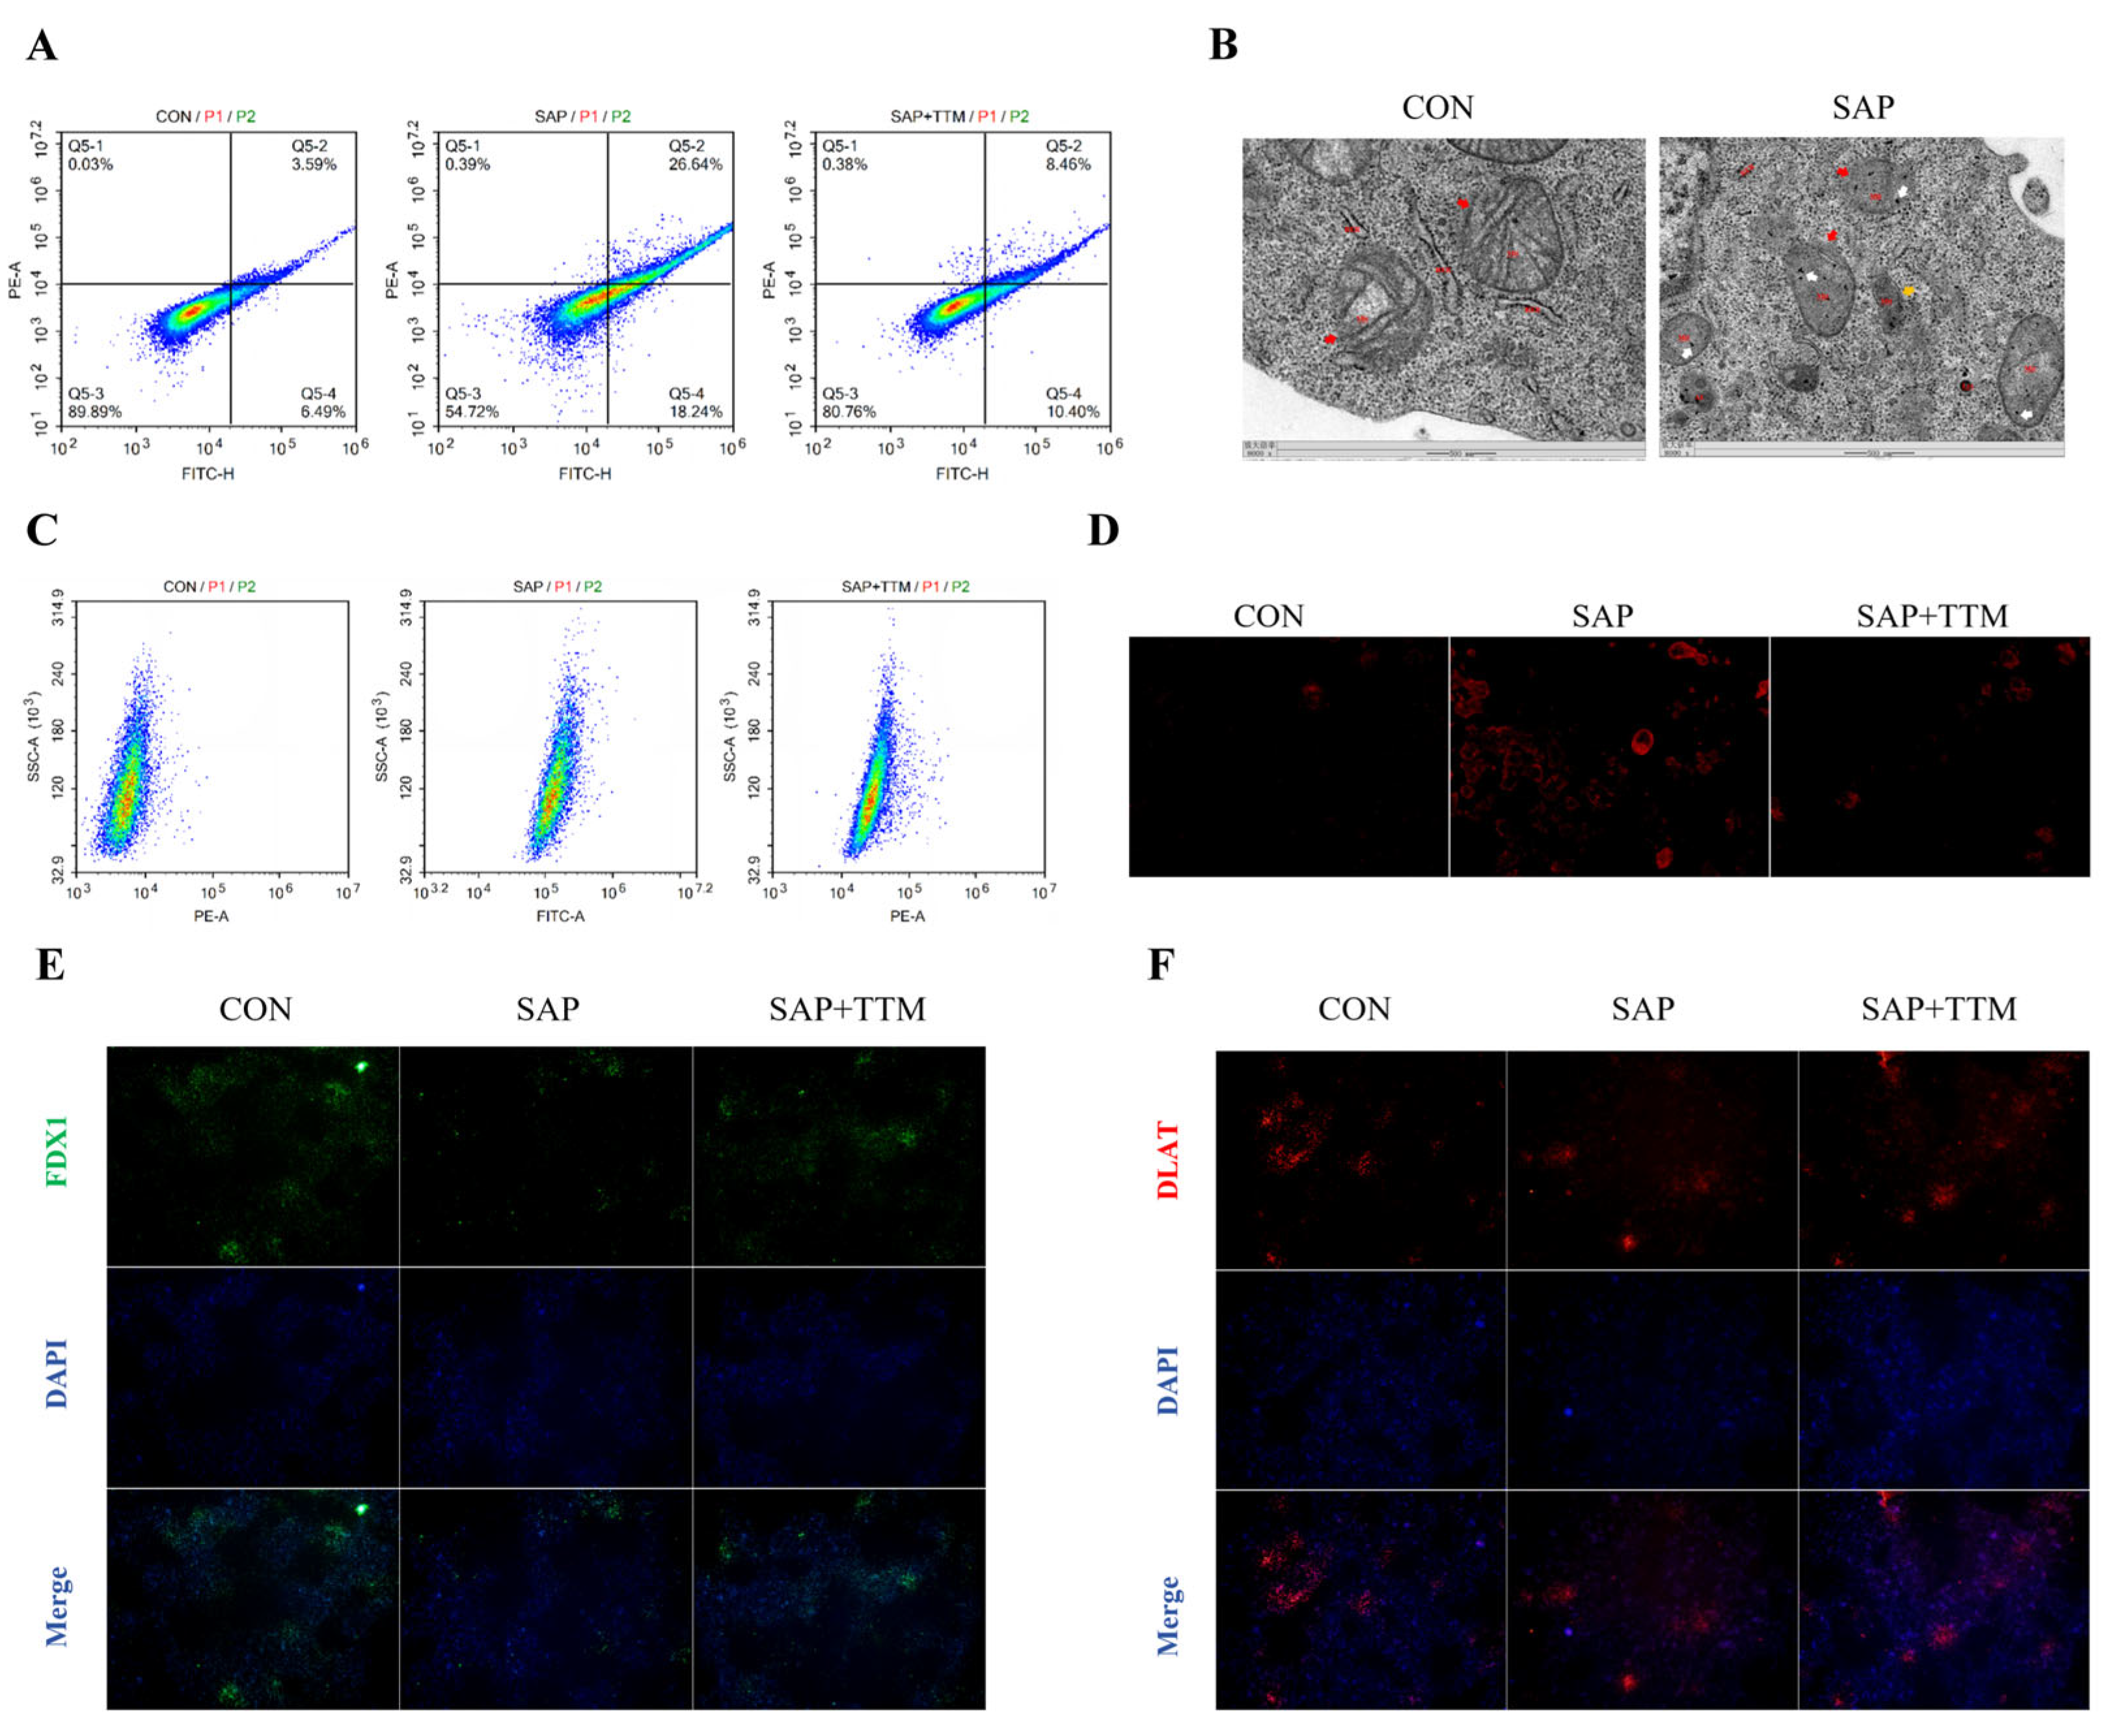
Figure 11.
In vitro phenotypic validation of cuproptosis-related mitochondrial dysfunction and oxidative stress, and the rescuing effect of TTM. (A) Flow cytometry scatter plots showing mitochondrial membrane potential changes in acinar cells from each group detected by JC-1 probe. The x-axis represents FITC-A and the y-axis represents PE-H, which indicate damaged and normal mitochondrial membrane potential, respectively. (B) Bar graph showing relative ATP content in acinar cells from each group measured by chemiluminescence assay. The x-axis represents groups and the y-axis represents relative ATP levels. (C) Fluorescence images and quantitative bar graphs showing total ROS levels in acinar cells from each group detected by DCFH-DA probe. The x-axis represents groups and the y-axis represents relative fluorescence intensity. (D) Fluorescence images and quantitative bar graphs showing mitochondrial ROS levels in acinar cells from each group detected by MitoSOX probe. The x-axis represents groups and the y-axis represents relative fluorescence intensity. (E) Bar graph showing quantitative comparison of malondialdehyde (MDA) content in acinar cells from each group. The x-axis represents groups and the y-axis represents MDA content. (F) Bar graph showing quantitative comparison of 4-hydroxynonenal (4-HNE) levels in acinar cells from each group. The x-axis represents groups and the y-axis represents 4-HNE levels. (G) Bar graph showing quantitative comparison of reduced glutathione/oxidized glutathione (GSH/GSSG) ratio in acinar cells from each group. The x-axis represents groups and the y-axis represents GSH/GSSG ratio. (H) Bar graph showing quantitative comparison of total superoxide dismutase (T-SOD) activity in acinar cells from each group. The x-axis represents groups and the y-axis represents T-SOD activity units.
Figure 11.
In vitro phenotypic validation of cuproptosis-related mitochondrial dysfunction and oxidative stress, and the rescuing effect of TTM. (A) Flow cytometry scatter plots showing mitochondrial membrane potential changes in acinar cells from each group detected by JC-1 probe. The x-axis represents FITC-A and the y-axis represents PE-H, which indicate damaged and normal mitochondrial membrane potential, respectively. (B) Bar graph showing relative ATP content in acinar cells from each group measured by chemiluminescence assay. The x-axis represents groups and the y-axis represents relative ATP levels. (C) Fluorescence images and quantitative bar graphs showing total ROS levels in acinar cells from each group detected by DCFH-DA probe. The x-axis represents groups and the y-axis represents relative fluorescence intensity. (D) Fluorescence images and quantitative bar graphs showing mitochondrial ROS levels in acinar cells from each group detected by MitoSOX probe. The x-axis represents groups and the y-axis represents relative fluorescence intensity. (E) Bar graph showing quantitative comparison of malondialdehyde (MDA) content in acinar cells from each group. The x-axis represents groups and the y-axis represents MDA content. (F) Bar graph showing quantitative comparison of 4-hydroxynonenal (4-HNE) levels in acinar cells from each group. The x-axis represents groups and the y-axis represents 4-HNE levels. (G) Bar graph showing quantitative comparison of reduced glutathione/oxidized glutathione (GSH/GSSG) ratio in acinar cells from each group. The x-axis represents groups and the y-axis represents GSH/GSSG ratio. (H) Bar graph showing quantitative comparison of total superoxide dismutase (T-SOD) activity in acinar cells from each group. The x-axis represents groups and the y-axis represents T-SOD activity units.
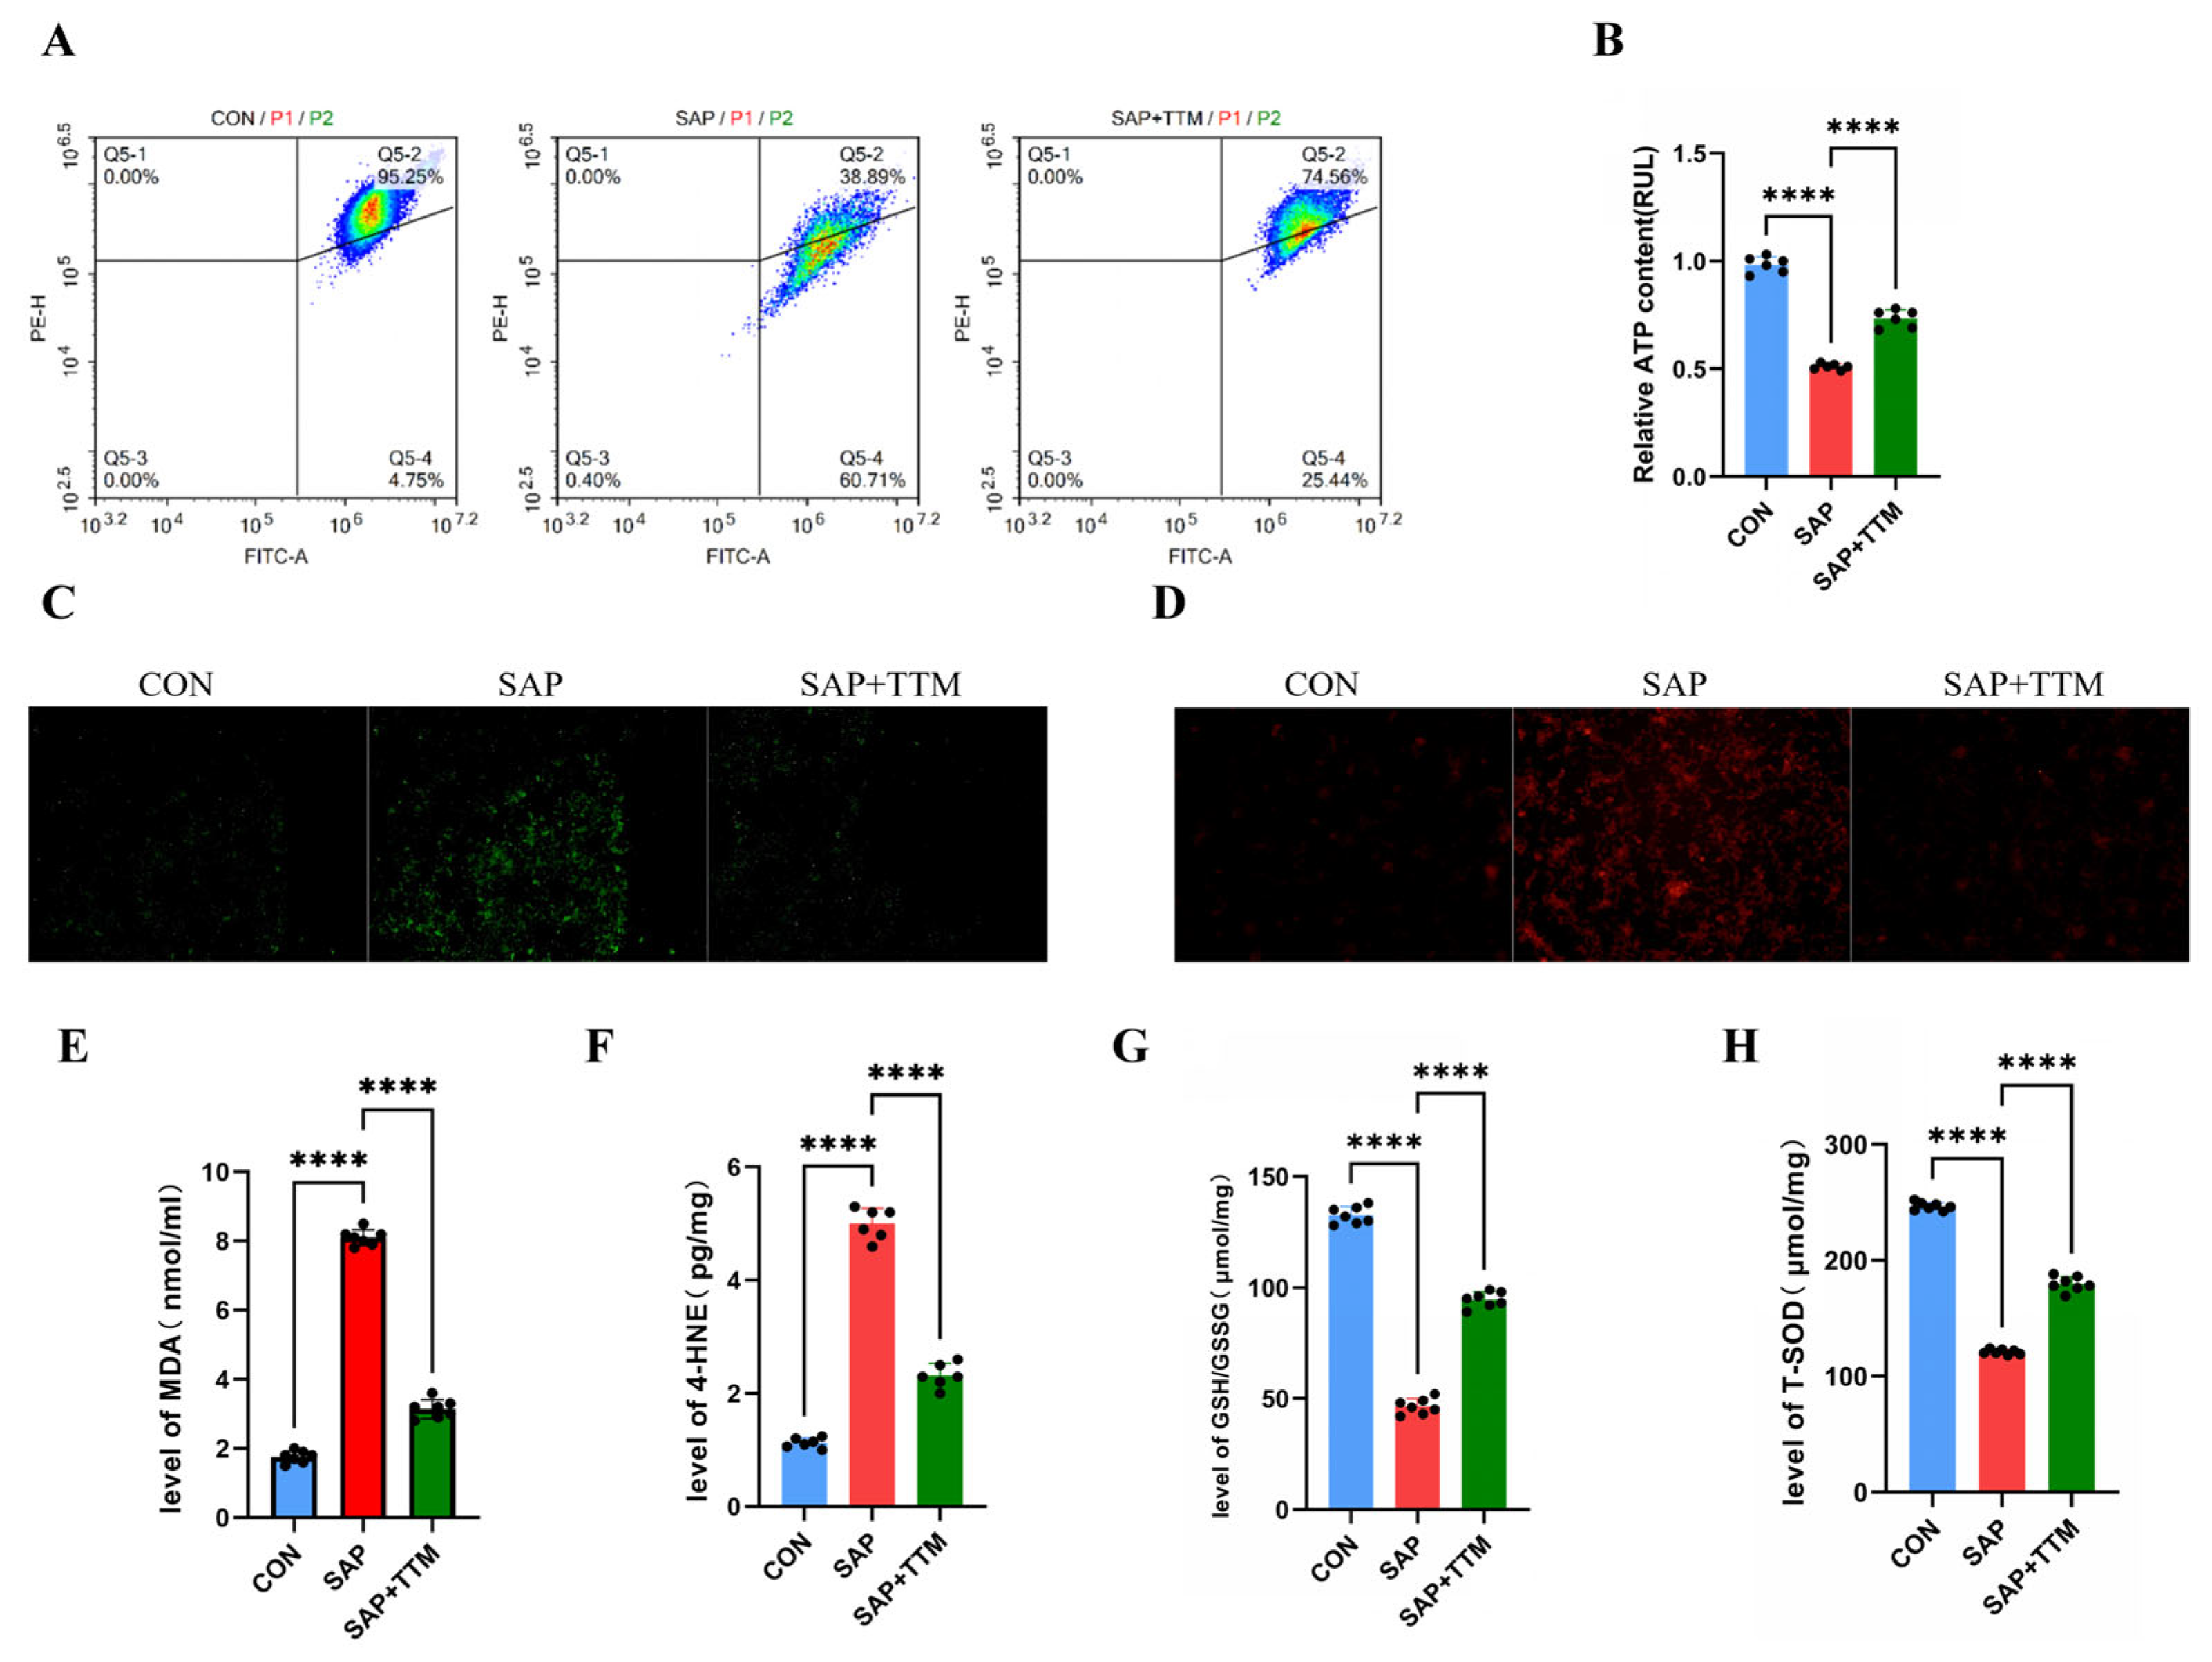
Disclaimer/Publisher’s Note: The statements, opinions and data contained in all publications are solely those of the individual author(s) and contributor(s) and not of MDPI and/or the editor(s). MDPI and/or the editor(s) disclaim responsibility for any injury to people or property resulting from any ideas, methods, instructions or products referred to in the content. |
© 2026 by the authors. Licensee MDPI, Basel, Switzerland. This article is an open access article distributed under the terms and conditions of the Creative Commons Attribution (CC BY) license (http://creativecommons.org/licenses/by/4.0/).
Copyright: This open access article is published under a Creative Commons CC BY 4.0 license, which permit the free download, distribution, and reuse, provided that the author and preprint are cited in any reuse.