

Submitted:
09 September 2026
Posted:
10 September 2026
You are already at the latest version
Abstract
Diabetes mellitus (DM) significantly increases the risk of developing active tuberculosis (TB). Poorly controlled diabetes, particularly with sustained hyperglycemia, is associated with higher TB incidence. Glucagon-like peptide-1 receptor agonists (GLP-1 RAs) have become an important therapeutic option in the management of type 2 diabetes mellitus. GLP-1 RAs may also have immunomodulatory effects. Our study aims to evaluate the incidence of pulmonary TB among diabetic patients, and to examine whether GLP-1 RAs control modifies TB risk and mortality. We conducted a retrospective cohort study using the Global Collaborative Network of the TriNetX™ research platform from 152 participating health care organizations across the United States. We identified adult patients with diabetes mellitus who received either oral hypoglycemic agents (OHAs) containing GLP-1RA or dipeptidyl peptidase-4 inhibitor (DPP-4i) between January 1, 2016, and December 31, 2024. Diabetic patients receiving OHAs containing GLP-1 RA treatment had a significantly lower incidence of TB (HR: 0.55, 95% CI: 0.45-0.69), significantly reduced risk of death (HR: 0.52, 95% CI: 0.51-0.54), and significantly reduced risk of gastrointestinal and hepatobiliary disorders (HR: 0.77, 95% CI: 0.75-0.78), compared to those receiving DPP-4 inhibitor treatment. This observational study demonstrated that the use of GLP-1 RAs, compared with DPP-4i, was associated with a lower incidence of tuberculosis, all-cause mortality, and gastrointestinal adverse events. These findings may have important implications for public health policy.
Keywords:
GLP-1 RA
; diabetes mellitus
; tuberculosis
; incidence
; mortality
1. Introduction
Tuberculosis (TB) remains one of the leading infectious causes of morbidity and mortality worldwide. Despite advances in diagnosis and treatment, TB continues to cause approximately 8.2 million new cases and 1.25 million deaths in 2023 [1]. In parallel, diabetes mellitus (DM) has emerged as a major global epidemic, with an estimated 589 million adults affected worldwide in 2025, and this number is predicted to rise to 853 million by 2050 [2]. The convergence of these two conditions poses a serious public health challenge, particularly in regions with high TB burden and increasing prevalence of diabetes. A growing body of evidence demonstrates that DM significantly increases the risk of developing active TB. Meta-analyses and large cohort studies have consistently shown that individuals with DM have a two- to three-fold higher risk of active TB compared with non-diabetic individuals [3,4,5,6,7,8,9]. The World Health Organization (WHO) estimated that in 2020, nearly 370,000 incident TB cases were attributable to DM, underscoring the contribution of metabolic disease to TB epidemiology [1]. According to a comprehensive systematic review and meta-analysis, the global pooled incidence of pulmonary tuberculosis (PTB) among patients with type 2 diabetes mellitus (T2DM) is estimated at 129.89 per 100,000 person-years (95% CI: 97.55–172.95), while the pooled prevalence stands at 511.19 per 100,000 (95% CI: 375.94–695.09) [10]
The association between diabetes and TB is not uniform across all diabetic patients; rather, it is strongly influenced by the degree of glycemic control. Poorly controlled diabetes, particularly with sustained hyperglycemia, is associated with higher TB incidence [11,12]. For instance, Lee et al. demonstrated in a large prospective cohort study that diabetic patients with elevated fasting glucose had approximately double the risk of TB compared with non-diabetic subjects, while those with well-controlled DM had no significant excess risk [11]. These findings suggest a dose-response relationship between hyperglycemia and TB susceptibility.
The biological mechanisms underpinning this association are increasingly understood. Chronic hyperglycemia impairs both innate and adaptive immune responses, including reduced macrophage function, impaired chemotaxis, defective antigen presentation, and diminished T-helper 1 cytokine production [13,14]. These immune alterations compromise the host’s ability to contain Mycobacterium tuberculosis infection and may contribute to higher bacterial loads, delayed sputum conversion, and more severe radiographic disease in diabetic patients. In addition to increasing TB incidence, diabetes adversely affects TB treatment outcomes. Poor glycemic control has been associated with slower sputum conversion, higher rates of treatment failure and relapse, and increased mortality. [12]. These observations highlight the dual role of glycemic control in both prevention and treatment of TB among diabetic individuals.
Glucagon-like peptide-1 receptor agonists (GLP-1 RAs) have become an important therapeutic option in the management of type 2 diabetes mellitus. Their glucose-lowering effect is mediated through several well-characterized mechanisms. First, GLP-1 RAs enhance glucose-dependent insulin secretion from pancreatic β-cells, thereby improving postprandial and fasting glycemic control. Second, they suppress glucagon secretion from pancreatic α-cells, which reduces hepatic glucose output. In addition, GLP-1 RAs delay gastric emptying, leading to a slower rate of nutrient absorption. Finally, by acting on the central nervous system, particularly the hypothalamus, they reduce appetite and promote satiety. Through this combination of mechanisms, GLP-1 RAs not only improve glycemic control but also contribute to clinically meaningful weight reduction [15,16].
Given the global rise in diabetes prevalence and its implications for TB control, understanding the impact of diabetes and glycemic management on TB incidence and outcomes is critical. The present study aims to evaluate the incidence of pulmonary TB among diabetic patients, and to examine whether GLP-1 RAs control modifies TB risk and mortality, thereby providing evidence to inform integrated management strategies for these comorbid conditions.
Between 2015 and 2023, the net decline in tuberculosis incidence was 8.3%, far short of the World Health Organization's End TB Strategy target of a 50% reduction in tuberculosis incidence by 2025. In addition, the number of tuberculosis deaths worldwide decreased by a net 23%, almost one-third of the way to the 75% reduction milestone set out in the World Health Organization’s End TB Strategy by 2025[1]. Finding appropriate drug interventions to reduce the incidence and mortality of tuberculosis is an important goal at present.
2. Methods
2.1. Data Source
We conducted a retrospective cohort study using the Global Collaborative Network of the TriNetX™ research platform, which integrates de-identified electronic health records from 152 participating health care organizations across the United States. No patients or members of the public were involved in the design, conduct, reporting, or dissemination plans of this study. The database captures longitudinal demographic, diagnostic, procedural, medication, laboratory, and mortality information. This study was approved by the Institutional Review Board of Kaohsiung Veterans General Hospital (IRB number: KSVGH25 -CT11-13), which waived the requirement of informed consent. All the methods in this study were conducted in accordance with the directives of the Declaration of Helsinki.
2.2. Study Population
We identified adults (≥18 years of age) with a diagnosis of diabetes mellitus (ICD-10: E08-E13) or Diabetes mellitus in pregnancy, childbirth, and the puerperium (ICD10 CM:O24) who received either oral hypoglycemic agents (OHAs) containing glucagon-like peptide-1 receptor agonist (GLP-1RA, Anatomical Therapeutic Chemical (ATC) code: A10BJ) or OHAs containing dipeptidyl peptidase-4 inhibitor (DPP-4i, ATC code: A10BH) between January 1, 2016, and December 31, 2024. For the GLP-1RA cohort, the index date was defined as the date of first GLP-1RA prescription, with no DPP-4i use during the 12 months before or after that date. For the DPP-4i cohort, the index date was the date of first DPP-4i prescription, with no GLP-1RA use during the 12 months before or after that date. Patients were excluded if they had a documented diagnosis of tuberculosis (TB) before the index date.
2.3. Propensity-Score Matching
To reduce confounding, we estimated propensity scores using logistic regression models incorporating age, sex, race, documented comorbidities, concomitant medications, and availability of key laboratory values. Each GLP-1RA user was matched 1:1 with a DPP-4i user according to the nearest-neighbor algorithm without replacement.
2.4. Outcomes and Follow-Up
Participants were followed from the index date until the earliest occurrence of TB (ICD-10 A15-A19), death (Diseased), loss to follow-up, or 1 year after the index date. For analyses of gastrointestinal and hepatobiliary disorders, the outcome was defined as the first diagnosis of any of the following: gastroparesis (K31.84), calculus of the bile duct without cholangitis or cholecystitis, cholecystitis, cholangitis, calculus of the gallbladder without cholecystitis (K80.5, K81, K83.0), acute pancreatitis (K80.2, K85), or paralytic ileus and intestinal obstruction without hernia (K56). Follow-up for this outcome ended at the earliest occurrence of the disorder, death, loss to follow-up, or 1 year after the index date.
2.5. Statistical Analysis
Baseline characteristics were compared using standardized differences. Cox proportional-hazards models stratified on matched pairs were fitted to estimate hazard ratios (HRs) and 95% confidence intervals (CIs) for the composite primary outcome of TB, death, or gastrointestinal and hepatobiliary disorders. The proportional-hazards assumption was evaluated using Schoenfeld residuals. Kaplan–Meier curves were generated to illustrate time-to-event distributions, and comparisons were made with the log-rank test. All analyses were performed within the TriNetX Analytics environment, which incorporates built-in privacy safeguards and limits output to aggregate results with cell sizes of at least 10. A two-sided P value of less than 0.05 was considered to indicate statistical significance.
3. Results
3.1. Characteristics of Study Subjects
Figure 1 presents the study flow chart. The characteristics of the GLP-1 RA cohort and the control (DPP-4i) cohort before and after propensity score matching are presented in Table 1. After matching, a total of 438,569 individuals were identified in both cohorts. The cohorts were well matched on the included variables, with standardized differences of less than 0.1, indicating good balance. There are some differences regarding the BMI variable. It is speculated that GLP-1RA is primarily approved by the FDA for the treatment of type 2 diabetes and chronic weight management.

Table 1.
Baseline Characteristics of the GLP-1RA cohort and DPP-4i cohort.
| Unmatched | Matched | |||||
|---|---|---|---|---|---|---|
| DPP-4i N=635834 |
GLP-1RA N=783827 |
Std. diff. | DPP-4i N=438569 |
GLP-1RA N=438569 |
Std. diff. | |
| Age at Index | 63.7 ± 12.3 | 57.3 ± 13 | 0.5051 | 61.1 ± 12.3 | 60.8 ± 12.1 | 0.0241 |
| Gender | ||||||
| Female | 302036(47.50) | 435891(55.61) | 0.1628 | 220197(50.21) | 219518(50.05) | 0.0031 |
| Male | 333798(52.50) | 347936(44.39) | 0.1628 | 218372(49.79) | 219051(49.95) | 0.0031 |
| Race | ||||||
| White | 294179(46.27) | 505695(64.52) | 0.3735 | 262974(59.96) | 258314(58.90) | 0.0216 |
| Black or African American | 90389(14.22) | 150575(19.21) | 0.1342 | 80200(18.29) | 77426(17.65) | 0.0165 |
| Asian | 65757(10.34) | 29624(3.78) | 0.2583 | 22946(5.23) | 25129(5.73) | 0.0219 |
| Comorbidities | ||||||
| Essential hypertension | 388236(61.06) | 549466(70.10) | 0.1912 | 298293(68.02) | 296483(67.6) | 0.0088 |
| Hyperlipidemia | 268838(42.28) | 412767(52.66) | 0.2090 | 218862(49.90) | 218289(49.77) | 0.0026 |
| Diseases of the blood* | 159746(25.12) | 241249(30.78) | 0.1263 | 125602(28.64) | 123014(28.05) | 0.0131 |
| Gastro-esophageal reflux disease | 136439(21.46) | 246059(31.39) | 0.2267 | 114689(26.15) | 114735(26.16) | 0.0002 |
| Ischemic heart diseases | 146471(23.04) | 168649(21.52) | 0.0365 | 102117(23.28) | 100003(22.8) | 0.0114 |
| Chronic lower respiratory diseases | 113369(17.83) | 202824(25.88) | 0.1956 | 93458(21.31) | 93672(21.36) | 0.0012 |
| Mood disorders | 98273(15.46) | 221643(28.28) | 0.314 | 88639(20.21) | 90344(20.6) | 0.0096 |
| Anxiety$ | 99454(15.64) | 228446(29.15) | 0.3283 | 87733(20.00) | 90087(20.54) | 0.0134 |
| Chronic kidney disease | 118648(18.66) | 118643(15.14) | 0.0941 | 77763(17.73) | 75507(17.22) | 0.0135 |
| Type 2 DM with neurological complications | 87845(13.82) | 143327(18.29) | 0.1220 | 73659(16.80) | 72934(16.63) | 0.0044 |
| Type 2 DM with kidney complications | 105764(16.63) | 122026(15.57) | 0.0290 | 73461(16.75) | 71689(16.35) | 0.0109 |
| Mental and behavioral disorders+ | 78426(12.33) | 146539(18.70) | 0.1764 | 69426(15.83) | 69057(15.75) | 0.0023 |
| Nicotine dependence | 62925(9.90) | 117072(14.94) | 0.1533 | 55848(12.73) | 55505(12.66) | 0.0023 |
| Diseases of liver | 68511(10.78) | 123155(15.71) | 0.1460 | 54092(12.33) | 54959(12.53) | 0.0060 |
| Cerebrovascular diseases | 76391(12.01) | 74745(9.54) | 0.0800 | 48854(11.14) | 47594(10.85) | 0.0092 |
| Type 2 DM with ophthalmic complications | 46689(7.34) | 70598(9.01) | 0.0608 | 36973(8.43) | 36483(8.32) | 0.0040 |
| Type 2 DM with circulatory complications | 37480(5.90) | 61106(7.80) | 0.0753 | 31674(7.22) | 30970(7.06) | 0.0062 |
| Melanoma1 | 13572(2.14) | 20955(2.67) | 0.0352 | 11595(2.64) | 11209(2.56) | 0.0055 |
| Malignant neoplasms of breast | 12386(1.95) | 16422(2.10) | 0.0105 | 9652(2.20) | 9302(2.12) | 0.0055 |
| Malignant neoplasms of ill-defined | 15197(2.39) | 13387(1.71) | 0.0482 | 9048(2.06) | 8786(2.00) | 0.0042 |
| Malignant neoplasms of male genital organs | 11751(1.85) | 12112(1.55) | 0.0235 | 8500(1.94) | 7985(1.82) | 0.0086 |
| Malignant neoplasms of digestive organs | 15341(2.41) | 9212(1.18) | 0.0933 | 6629(1.51) | 6883(1.57) | 0.0047 |
| Malignant neoplasms of lymphoid | 9270(1.46) | 10060(1.28) | 0.0150 | 6448(1.47) | 6262(1.43) | 0.0035 |
| Malignant neoplasms of urinary tract | 8200(1.29) | 7850(1.00) | 0.0271 | 5260(1.20) | 5061(1.15) | 0.0042 |
| Unspecified dementia | 13809(2.17) | 5590(0.71) | 0.1226 | 4714(1.08) | 4834(1.1) | 0.0026 |
| Malignant neoplasms of female genital organs | 5681(0.89) | 8567(1.09) | 0.0201 | 4436(1.01) | 4400(1.00) | 0.0008 |
| Malignant neoplasms of respiratory | 7172(1.13) | 4020(0.51) | 0.0682 | 3050(0.70) | 3079(0.70) | 0.0008 |
| Malignant neoplasms of thyroid | 3367(0.53) | 5051(0.64) | 0.0150 | 2531(0.58) | 2582(0.59) | 0.0015 |
| Human immunodeficiency virus | 2590(0.41) | 4715(0.60) | 0.0274 | 2344(0.53) | 2330(0.53) | 0.0004 |
| Malignant neoplasms of lip | 3310(0.52) | 1502(0.19) | 0.0552 | 1094(0.25) | 1181(0.27) | 0.0039 |
| Malignant neoplasms of mesothelial | 1602(0.25) | 1837(0.23) | 0.0036 | 1111(0.25) | 1074(0.25) | 0.0017 |
| Malignant neoplasms of eye, and brain | 1513(0.24) | 1321(0.17) | 0.0154 | 874(0.20) | 850(0.19) | 0.0012 |
| Malignant neuroendocrine tumors | 993(0.16) | 1230(0.16) | 0.0002 | 727(0.17) | 674(0.15) | 0.0030 |
| Malignant neoplasms of bone | 591(0.09) | 627(0.08) | 0.0044 | 407(0.09) | 390(0.09) | 0.0013 |
| Secondary neuroendocrine tumors | 357(0.06) | 303(0.04) | 0.0080 | 240(0.06) | 211(0.05) | 0.0029 |
Diseases of the blood*: Diseases of the blood and blood-forming organs and certain disorders involving the immune mechanism. Anxiety$: Anxiety, dissociative, stress-related, somatoform and other nonpsychotic mental disorders. Mental and behavioral disorders+: Mental and behavioral disorders due to psychoactive substance use. Melanoma1: Melanoma and other malignant neoplasms of skin.
Table 1.
Baseline Characteristics of the GLP-1RA cohort and DPP-4i cohort (cont.).
| Unmatched | Matched | |||||
|---|---|---|---|---|---|---|
| DPP-4i N=635834 |
GLP-1RA N=783827 |
Std. diff. | DPP-4i N=438569 |
GLP-1RA N=438569 |
Std. diff. | |
| Medications | ||||||
| Biguanides | 294086(46.25) | 467953(59.70) | 0.2719 | 235284(53.65) | 237788(54.22) | 0.0115 |
| Insulin | 222619(35.01) | 350568(44.73) | 0.1994 | 176646(40.28) | 175976(40.13) | 0.0031 |
| Sulfonylureas | 166234(26.14) | 196754(25.10) | 0.0239 | 121889(27.79) | 119934(27.35) | 0.01 |
| Sodium-glucose co-transporter 2 inhibitors | 51028(8.03) | 134875(17.21) | 0.2792 | 46631(10.63) | 50474(11.51) | 0.0279 |
| Thiazolidinediones | 39081(6.15) | 47866(6.11) | 0.0017 | 28548(6.51) | 28078(6.40) | 0.0044 |
| Alpha glucosidase inhibitors | 8045(1.27) | 3228(0.41) | 0.0937 | 2203(0.50) | 2466(0.56) | 0.0082 |
| Laboratory | ||||||
| Creatinine in Serum, Plasma or Blood | 1.23 ± 1.93 | 1.02 ± 2.31 | 0.0992 | 1.16 ± 1.98 | 1.07 ± 2.25 | 0.0432 |
| Glucose in Serum, Plasma or Blood | 171 ± 76 | 170 ± 80.2 | 0.0062 | 173 ± 76.7 | 170 ± 78.9 | 0.0394 |
| Hemoglobin A1c | 8.06 ± 2.01 | 8.05 ± 2.09 | 0.0043 | 8.1 ± 2.04 | 8.06 ± 2.05 | 0.0192 |
| BMI | 31.5 ± 7.48 | 36.6 ± 8.22 | 0.6467 | 32.4 ± 7.54 | 35.5 ± 7.86 | 0.4080 |
| Cholesterol in HDL | 42.8 ± 15.9 | 43 ± 15.2 | 0.0078 | 42.3 ± 16.2 | 43.3 ± 15 | 0.0628 |
| Cholesterol | 166 ± 49 | 171 ± 48.4 | 0.0948 | 167 ± 49.9 | 167 ± 47.7 | 0.0101 |
| Cholesterol in LDL | 90 ± 38.3 | 92.7 ± 38.4 | 0.0722 | 90 ± 38.9 | 90.1 ± 38 | 0.0024 |
| Triglyceride | 176 ± 164 | 186 ± 186 | 0.0546 | 180 ± 171 | 180 ± 170 | 0.0021 |
3.2. Risk of TB Occurrence
Compared to the control (DPP-4i) cohort, the GLP-1 RA cohort demonstrated a significantly reduced occurrence of tuberculosis (HR: 0.55, 95% CI: 0.45-0.69). Subgroup analysis showed that young people, male gender, and whites/Asians’ population had more obvious benefits (Figure 2). Kaplan–Meier curves demonstrated a significant difference in the cumulative incidence of tuberculosis between the two cohorts (Figure 3).
3.3. Risk of Mortality
Compared to the control (DPP-4i) cohort, the GLP-1 RA cohort exhibited a significantly reduced risk of death (HR: 0.52, 95% CI: 0.51-0.54). Subgroup analysis suggested benefits across all examined subgroups. (Figure 4). Kaplan–Meier curves demonstrated a significant difference in the survival probability between GLP1-RA cohort and DPP4i cohort. (Figure 5).
3.4. Gastrointestinal and Hepatobiliary Disorders
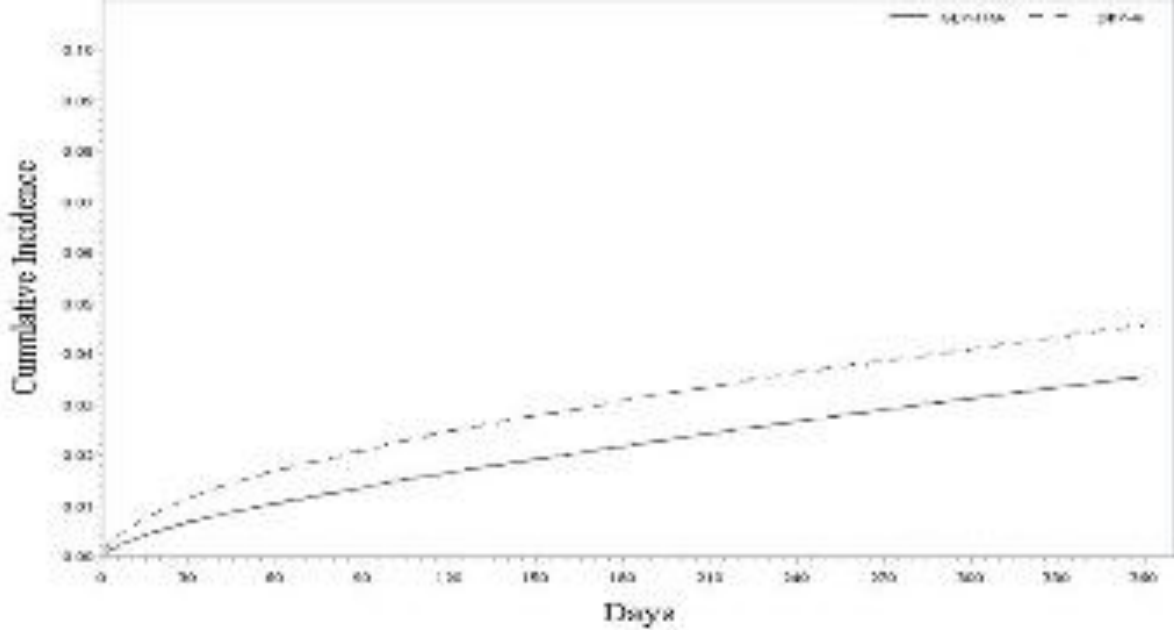
Compared to the control (DPP-4i) cohort, the GLP-1 RA cohort exhibited a significantly reduced risk of gastrointestinal and hepatobiliary disorders (HR: 0.77, 95% CI: 0.75-0.78). Subgroup analysis suggested benefits across all examined subgroups. (Figure 6). Kaplan–Meier curves demonstrated a significant difference in the Cumulative incidence of Gastrointestinal and hepatobiliary disorders between GLP1-RA cohort and DPP4i cohort. (Figure 7).
4. Discussion
This is the first study to show that diabetic patients receiving OHAs containing GLP-1 RA treatment had a significantly lower incidence of TB (HR: 0.55, 95% CI: 0.45-0.69), significantly reduced risk of death (HR: 0.52, 95% CI: 0.51-0.54), and significantly reduced risk of gastrointestinal and hepatobiliary disorders (HR: 0.77, 95% CI: 0.75-0.78), compared to those receiving OHAs containing DPP-4 inhibitor treatment. Among patients with diabetes mellitus, treatment with GLP-1 RA was associated with a significantly lower risk of incident TB compared with DPP-4 inhibitor. In time-to-event analysis, the GLP-1 RA cohort demonstrated a 45% lower hazard of newly diagnosed TB than the DPP-4 inhibitor cohort (hazard ratio [HR], 0.55; 95% confidence interval [CI], 0.45–0.69).
In diabetes treatment guidelines, these two types of drugs are often regarded as second-line treatment options after first-line Metformin failure, and they have similar advantages in terms of low risk of hypoglycemia, [17] so they are suitable for direct comparison. Because GLP-1 receptor agonists have superior metabolic and organ-protective effects, current clinical guidelines increasingly favor GLP-1 receptor agonists over DPP-4 inhibitors for the treatment of patients at high cardiovascular risk or who are obese. [18]. Although both classes of drugs were launched in the mid-2000s (exenatide in 2005 and sitagliptin in 2006), their therapeutic characteristics are quite different. DPP-4 inhibitors are well-tolerated and have little impact on weight and cardiovascular health; while GLP-1 receptor agonists can significantly reduce weight and substantially decrease the incidence of adverse cardiovascular events. [18,19] The 2026 American Diabetes Association (ADA) guidelines strongly recommend the use of GLP-1 inhibitors with proven cardiovascular efficacy in patients diagnosed with atherosclerotic cardiovascular disease (ASCVD), heart failure, or chronic kidney disease, regardless of A1C levels, while DPP-4 inhibitors have demonstrated neutral efficacy in trials such as SAVOR-TIMI 53 and TECOS. [17,20,21,22,23,24,25,26]
The following analysis explains several possible reasons why GLP-1 RA can reduce the incidence of TB. First, GLP-1 RA is more effective than DPP-4i in reducing the incidence of tuberculosis due to its better at controlling blood sugar. GLP-1RAs and DPP-4i are both secretin-related drugs with similar mechanisms of action. [27] However, they differ significantly in pharmacological potency and clinical efficacy. Some review studies showed that GLP-1 RAs provide better glycemic control and weight loss compared to DPP-4 inhibitors. [27,28,29] Second, Real-world evidence and mechanistic studies consistently demonstrate that GLP-1 receptor agonists exhibit superior immunomodulatory effects compared to DPP-4 inhibitors. GLP-1 receptor agonists actively regulate immune function through both systemic and central pathways. At the systemic level, they directly activate receptors on various immune cells, restoring the balance between pro-inflammatory Th17 cells and anti-inflammatory regulatory T cells (Tregs) via the PI3K/Akt/FoxO1 signaling pathway. [30] In addition, GLP-1 RA is involved in the key gut-brain-immune axis, where activation of central neuronal GLP-1 receptors inhibits peripheral inflammation, particularly by recruiting central α1-adrenergic and opioid signaling to attenuate multiple Toll-like receptor (TLR) agonist-induced TNF-α, IL-1β, and IL-6. [31]
Numerous large-scale clinical trials and real-world studies have found that GLP-1 RAs can reduce mortality compared to DPP-4i. Unlike DPP-4i, which have largely demonstrated cardiovascular neutrality, GLP-1 RAs such as liraglutide and semaglutide provide significant reductions in major adverse cardiovascular events and mortality. [20,21,22,23] Results from the SAVOR-TIMI 53 and TECOS trials showed that DPP-4 inhibitors like saxagliptin and sitagliptin did not significantly reduce cardiovascular or all-cause mortality compared to placebo. [20,21] In contrast, the LEADER trial demonstrated that GLP-1 RAs such as liraglutide significantly reduced the risk of death from cardiovascular causes by 22% (HR 0.78) and death from any cause by 15% (HR 0.85). While SUSTAIN-6 showed that semaglutide primarily reduced nonfatal stroke rather than cardiovascular death, it still achieved a significant 26% reduction in the composite primary cardiovascular outcome. [22,23] The superior efficacy of GLP-1 receptor agonists is attributed to mechanisms beyond glycemic control, including clinically significant weight loss, lower systolic blood pressure, and renal protection, which may help improve the progression of atherosclerotic vascular disease. In contrast, DPP-4 inhibitors lack these significant metabolic and anti-atherosclerotic benefits, and some (such as saxagliptin) may even increase the risk of hospitalization for heart failure. [20,21,22,23]
Real-world evidence (RWE) consistently demonstrates that GLP-1 RAs offer superior survival benefits compared to DPP-4i, significantly reducing all-cause mortality and cardiovascular mortality in various high-risk populations, including patients with heart failure, advanced chronic kidney disease, and diagnosed atherosclerotic cardiovascular disease. [18,24,25,26] Furthermore, GLP-1 receptor agonists are associated with improved progression of atherosclerotic vascular disease and reduced sepsis-related mortality, likely due to their ability to alleviate excessive systemic inflammation and microvascular thrombosis through direct receptor activation. These multifaceted benefits, including hemodynamic stability, metabolic regulation, and immune modulation, collectively underpin the significant survival advantages observed in real-world clinical practice with GLP-1 receptor agonists. [24]
4.1. Strength
There were several strengths in this study. First, this retrospective cohort utilize multi-national databases that provide high statistical power and the implementation of propensity score matching. Second, comparing GLP-1 RA and DPP-4i, two of the best drugs for blood glucose control currently available, and given their similar mechanisms of action, allows for a better comparison of their efficacy. Third, this is the first article to explore the incidence of tuberculosis in diabetic patients using different diabetes medications.
4.2. Limitation
First, blood sugar control/medication adherence is unknown. DPP-4i has a high rate of gastrointestinal side effects, making it difficult to assess authentic drug adherence. Second, we acknowledge that patients in the GLP-1 receptor agonist (GLP-1 RA) cohort had a higher prevalence of concomitant use of other glucose-lowering agents, including biguanides, insulin, and sodium–glucose co-transporter 2 (SGLT2) inhibitors. To mitigate potential confounding, propensity score matching (PSM) was applied to balance baseline characteristics and medication use between groups. Although PSM improves comparability and reduces measured confounding, residual imbalance and unmeasured confounders cannot be entirely excluded. Third, information regarding the timing of tuberculosis onset, disease severity at presentation, and treatment outcomes was not available in the present study. Consequently, a more granular assessment of the clinical course and prognosis of tuberculosis could not be performed. This limitation should be considered when interpreting the findings. Fourth, in the analysis of mortality outcomes, the cause of death could not be ascertained. Specifically, it was not possible to distinguish whether deaths were attributable to tuberculosis or to other causes, such as cardiovascular disease. This limitation restricts the interpretation of cause-specific mortality and should be taken into account when evaluating the results. Finally, the database used in this study is global in scope but predominantly comprises data from the United States. Therefore, the generalizability of these findings to regions with a higher tuberculosis burden may be limited. Additional validation in populations from high-incidence countries is warranted before extrapolating these results to such settings.。
5. Conclusions
This observational study demonstrated that the use of GLP-1 RAs, compared with DPP-4i, was associated with a lower incidence of tuberculosis, all-cause mortality, and gastrointestinal adverse events. These findings may have important implications for public health policy.
Author Contributions
C.H. Hsu and R Chang conceived and designed the study. C.H. Hsu and M.H. Lin collected the data. KA Chu, CF Chen and R. Chang analysed and interpreted the data. C.H. Hsu conceptualized and drafted the manuscript. All authors have reviewed the manuscript.
Funding
This study was supported by grants from Kaohsiung Veterans General Hospital, Kaohsiung, Taiwan, to cover publication costs and English revision fees.
Institutional Review Board Statement
This study was approved by the Institutional Review Board of Kaohsiung Veterans General Hospital (IRB number: KSVGH25 -CT11-13, date 2025-11-09), which waived the requirement of informed consent.
Informed Consent Statement
Not applicable.
Data Availability Statement
Data may be obtained from a third party and are not publicly available. The data that support the findings of this study were obtained from the TriNetX Research Network. Restrictions apply to the availability of these data, which were used under license for the current study and therefore are not publicly available. Data may be available from TriNetX upon reasonable request and with permission of TriNetX. All data provided by TriNetX were de-identified in compliance with applicable privacy regulations.
Acknowledgments
The authors express their appreciation to the Department of Medical Education and Research Centre of Medical Informatics in Kaohsiung Veterans General Hospital for inquiries and assistance with data processing.
Conflicts of Interest
The authors declare no competing interests.
References
- World Health Organization. Global Tuberculosis Report 2024.
- International Diabetes Federation. IDF Diabetes Atlas, 11th edition; 2025. [Google Scholar]
- Foe-Essomba, J.R.; Kenmoe, S.; Tchatchouang, S.; Ebogo-Belobo, J.T.; Mbaga, D.S.; Kengne-Ndé, C.; et al. Diabetes mellitus and tuberculosis, a systematic review and meta-analysis with sensitivity analysis for studies comparable for confounders. PLoS ONE 2021, 16(12), e0261246. [Google Scholar] [CrossRef] [PubMed] [PubMed Central]
- Jeon, C.Y.; Murray, M.B. Diabetes mellitus increases the risk of active tuberculosis: a systematic review of 13 observational studies. PLoS Med. 2008, 5(7), e152. [Google Scholar] [CrossRef] [PubMed] [PubMed Central]
- Harries, A.D.; Lin, Y.; Satyanarayana, S.; Lönnroth, K.; Li, L.; Wilson, N.; et al. The looming epidemic of diabetes-associated tuberculosis: learning lessons from HIV-associated tuberculosis. Int. J. Tuberc. Lung Dis. 2011, 15(11), 1436–44. [Google Scholar] [CrossRef] [PubMed]
- Dobler, C.C.; Flack, J.R.; Marks, G.B. Risk of tuberculosis among people with diabetes mellitus: an Australian nationwide cohort study. BMJ Open 2012, 2(1), e000666. [Google Scholar] [CrossRef] [PubMed] [PubMed Central]
- Kim, S.J.; Hong, Y.P.; Lew, W.J.; Yang, S.C.; Lee, E.G. Incidence of pulmonary tuberculosis among diabetics. Tuber. Lung Dis. 1995, 76(6), 529–33. [Google Scholar] [CrossRef] [PubMed]
- Baker, M.A.; Lin, H.H.; Chang, H.Y.; Murray, M.B. The risk of tuberculosis disease among persons with diabetes mellitus: a prospective cohort study. Clin. Infect. Dis. 2012, 54(6), 818–25. [Google Scholar] [CrossRef] [PubMed]
- Hayashi, S.; Chandramohan, D. Risk of active tuberculosis among people with diabetes mellitus: systematic review and meta-analysis. Trop. Med. Int. Health 2018, 23(10), 1058–1070. [Google Scholar] [CrossRef] [PubMed]
- Wu, Q.; Liu, Y.; Ma, Y.B.; Liu, K.; Chen, S.H. Incidence and prevalence of pulmonary tuberculosis among patients with type 2 diabetes mellitus: a systematic review and meta-analysis. Ann. Med. 2022, 54(1), 1657–1666. [Google Scholar] [CrossRef] [PubMed] [PubMed Central]
- Lee, P.H.; Fu, H.; Lai, T.C.; Chiang, C.Y.; Chan, C.C.; Lin, H.H. Glycemic Control and the Risk of Tuberculosis: A Cohort Study. PLoS Med. 2016, 13(8), e1002072. [Google Scholar] [CrossRef] [PubMed] [PubMed Central]
- Baker, M.A.; Harries, A.D.; Jeon, C.Y.; Hart, J.E.; Kapur, A.; Lönnroth, K.; et al. The impact of diabetes on tuberculosis treatment outcomes: a systematic review. BMC Med. 2011, 9, 81. [Google Scholar] [CrossRef] [PubMed] [PubMed Central]
- Restrepo, B.I. Diabetes and Tuberculosis. Microbiol. Spectr. 2016, 4(6). [Google Scholar] [CrossRef] [PubMed] [PubMed Central]
- Kumar Nathella, P.; Babu, S. Influence of diabetes mellitus on immunity to human tuberculosis. Immunology 2017, 152(1), 13–24. [Google Scholar] [CrossRef] [PubMed] [PubMed Central]
- Nauck, M.A.; Meier, J.J. Incretin hormones: Their role in health and disease. Diabetes ObesMetab 2018, 20 Suppl 1, 5–21. [Google Scholar] [CrossRef] [PubMed]
- Drucker, D.J. Mechanisms of Action and Therapeutic Application of Glucagon-like Peptide-1. Cell Metab. 2018, 27(4), 740–756. [Google Scholar] [CrossRef] [PubMed]
- American Diabetes Association Professional Practice Committee for Diabetes*. 9. Pharmacologic Approaches to Glycemic Treatment: Standards of Care in Diabetes-2026. Diabetes Care 2026, 49 (Supplement_1), S183–S215. [Google Scholar] [CrossRef] [PubMed] [PubMed Central]
- Kishimori, T.; Kato, T.; Wada, A.; Tani, A.; Yamaji, R.; Koike, J.; et al. Comparative Outcomes of Glucagon-Like Peptide-1 Receptor Agonists to Dipeptidyl Peptidase 4 Inhibitors in Patients With Heart Failure and Type 2 Diabetes. J. Am. Heart Assoc. 2025, 14(4), e037510. [Google Scholar] [CrossRef] [PubMed] [PubMed Central]
- Alharbi, S.H. Anti-inflammatory role of glucagon-like peptide 1 receptor agonists and its clinical implications. Ther. Adv. Endocrinol. Metab. 2024, 15, 20420188231222367. [Google Scholar] [CrossRef] [PubMed] [PubMed Central]
- Scirica, B.M.; Bhatt, D.L.; Braunwald, E.; Steg, P.G.; Davidson, J.; Hirshberg, B.; SAVOR-TIMI 53 Steering Committee and Investigators. Saxagliptin and cardiovascular outcomes in patients with type 2 diabetes mellitus. N Engl. J. Med. 2013, 369(14), 1317–26. [Google Scholar] [CrossRef] [PubMed]
- Green, J.B.; Bethel, M.A.; Armstrong, P.W.; Buse, J.B.; Engel, S.S.; Garg, J. TECOS Study Group. Effect of Sitagliptin on Cardiovascular Outcomes in Type 2 Diabetes. N Engl. J. Med. Erratum in: N Engl J Med. 2015 Aug 6;373(6):586. doi: 10.1056/NEJMx150029. PMID: 26052984. 2015, 373(3), 232–42. [Google Scholar] [CrossRef] [PubMed]
- Marso, S.P.; Daniels, G.H.; Brown-Frandsen, K.; Kristensen, P.; Mann, J.F.; Nauck, M.A.; LEADER Steering Committee; LEADER Trial Investigators. Liraglutide and Cardiovascular Outcomes in Type 2 Diabetes. N Engl. J. Med. 2016, 375(4), 311–22. [Google Scholar] [CrossRef] [PubMed] [PubMed Central]
- Marso, S.P.; Bain, S.C.; Consoli, A.; Eliaschewitz, F.G.; Jódar, E.; Leiter, L.A. SUSTAIN-6 Investigators. Semaglutide and Cardiovascular Outcomes in Patients with Type 2 Diabetes. N Engl. J. Med. 2016, 375(19), 1834–1844. [Google Scholar] [CrossRef] [PubMed]
- Chen, J.J.; Wu, C.Y.; Jenq, C.C.; Lee, T.H.; Tsai, C.Y.; Tu, H.T.; et al. Association of Glucagon-Like Peptide-1 Receptor Agonist vs Dipeptidyl Peptidase-4 Inhibitor Use with Mortality Among Patients with Type 2 Diabetes and Advanced Chronic Kidney Disease. JAMA Netw. Open 2022, 5(3), e221169. [Google Scholar] [CrossRef] [PubMed] [PubMed Central]
- Tan, X.; Liang, Y.; Rajpura, J.R.; Yedigarova, L.; Noone, J.; Xie, L.; Inzucchi, S.; de Havenon, A. Once-weekly glucagon-like peptide-1 receptor agonists vs dipeptidyl peptidase-4 inhibitors: cardiovascular effects in people with diabetes and cardiovascular disease. Cardiovasc Diabetol. 2023, 22(1), 319. [Google Scholar] [CrossRef] [PubMed] [PubMed Central]
- Evans, M.; Kuodi, P.; Akunna, C.J.; McCreedy, N.; Donsmark, M.; Ren, H.; et al. Cardiovascular and renal outcomes of GLP-1 receptor agonists vs. DPP-4 inhibitors and basal insulin in type 2 diabetes mellitus: A systematic review and meta-analysis. Diab Vasc. Dis. Res. 2023, 20(6), 14791641231221740. [Google Scholar] [CrossRef] [PubMed] [PubMed Central]
- Brunton, S. GLP-1 receptor agonists vs. DPP-4 inhibitors for type 2 diabetes: is one approach more successful or preferable than the other? Int. J. Clin. Pract. 2014, 68(5), 557–67. [Google Scholar] [CrossRef] [PubMed] [PubMed Central]
- Gilbert, M.P.; Pratley, R.E. GLP-1 Analogs and DPP-4 Inhibitors in Type 2 Diabetes Therapy: Review of Head-to-Head Clinical Trials. Front Endocrinol. 2020, 11, 178. [Google Scholar] [CrossRef] [PubMed] [PubMed Central]
- Tan, X.; Divino, V.; Amamoo, J.; Xie, L.; Coyle, K.B.; Gamble, C.L.; et al. Real-World Effectiveness of Once-Weekly Glucagon-Like Peptide-1 Receptor Agonists (OW GLP-1RAs) in Comparison with Dipeptidyl Peptidase-4 Inhibitors (DPP-4is) for Glycemic Control and Weight Outcomes in Type 2 Diabetes Mellitus (RELATE). Clin. Drug Investig. 2024, 44(4), 271–284. [Google Scholar] [CrossRef] [PubMed] [PubMed Central]
- Xu, Q.; Zhang, X.; Li, T.; Shao, S. Exenatide regulates Th17/Treg balance via PI3K/Akt/FoxO1 pathway in db/db mice. Mol. Med. 2022, 28(1), 144. [Google Scholar] [CrossRef] [PubMed] [PubMed Central]
- Wong, C.K.; McLean, B.A.; Baggio, L.L.; Koehler, J.A.; Hammoud, R.; Rittig, N.; et al. Central glucagon-like peptide 1 receptor activation inhibits Toll-like receptor agonist-induced inflammation. Cell Metab. 2024, 36(1), 130–143.e5. [Google Scholar] [CrossRef] [PubMed]
Figure 1.
Flowchart of study population selection. Patients were identified from the TriNetX™ research platform between 2016 to 2024. After excluding individuals age < 18-years-old, subject without diagnosis of diabetes mellitus, and history of tuberculosis before the index date, a total of 1419661 participants were included. Propensity score matching was performed, resulting in 877138 matched pairs included in the final analysis.
Figure 1.
Flowchart of study population selection. Patients were identified from the TriNetX™ research platform between 2016 to 2024. After excluding individuals age < 18-years-old, subject without diagnosis of diabetes mellitus, and history of tuberculosis before the index date, a total of 1419661 participants were included. Propensity score matching was performed, resulting in 877138 matched pairs included in the final analysis.
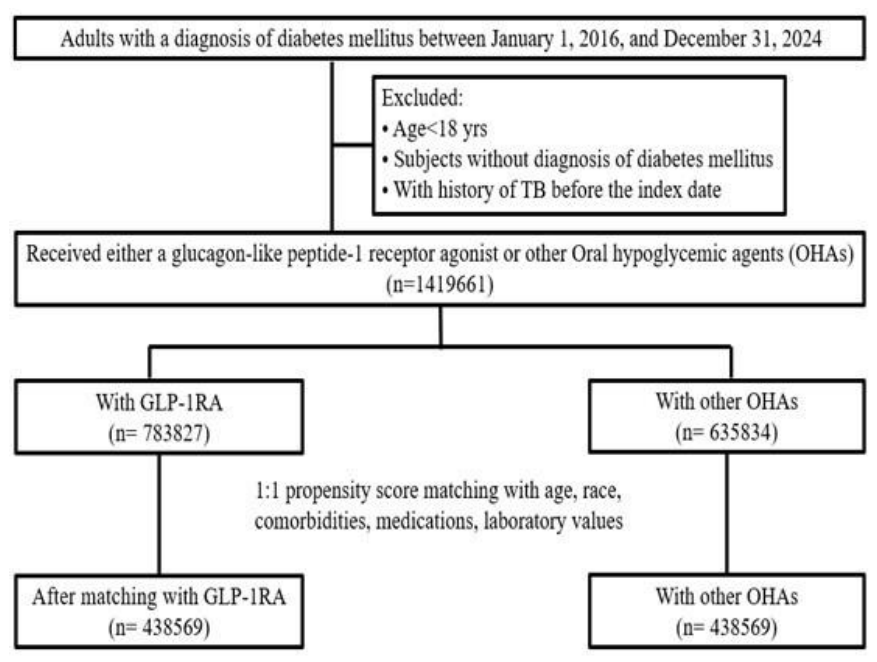
Figure 2.
A forest plot showing the hazard ratio and 95% confidence intervals associated with variables considered in the univariable analyses with time to the primary endpoint (tuberculosis) as the dependent variable. Blocks represent the hazard ratio and the horizontal bars extend from the lower limit to the upper limit of the 95% confidence interval of the estimate of the hazard ratio.
Figure 2.
A forest plot showing the hazard ratio and 95% confidence intervals associated with variables considered in the univariable analyses with time to the primary endpoint (tuberculosis) as the dependent variable. Blocks represent the hazard ratio and the horizontal bars extend from the lower limit to the upper limit of the 95% confidence interval of the estimate of the hazard ratio.
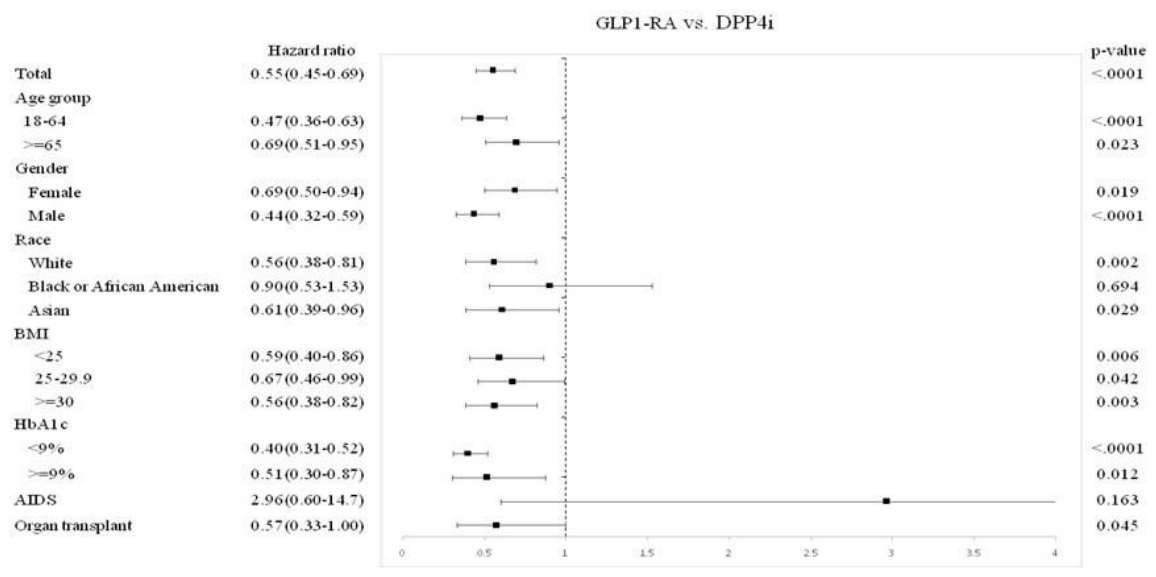
Figure 3.
Cumulative incidence of tuberculosis between GLP1-RA cohort and DPP4i cohort.
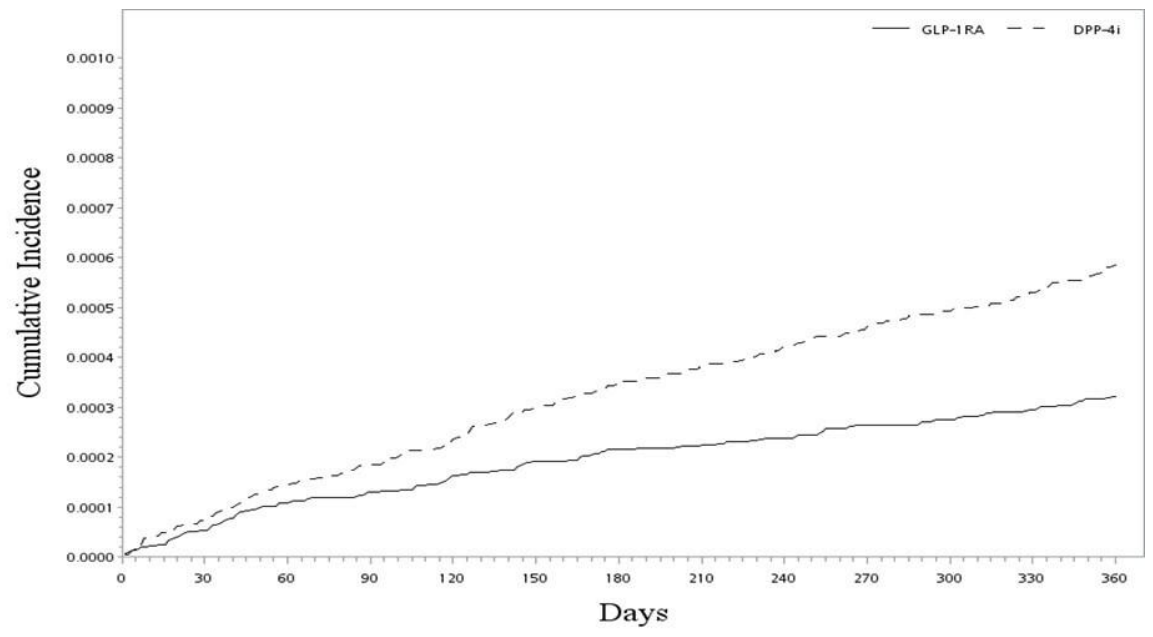
Figure 4.
A forest plot showing the hazard ratio and 95% confidence intervals associated with variables considered in the univariable analyses with time to the primary endpoint (death) as the dependent variable. Blocks represent the hazard ratio and the horizontal bars extend from the lower limit to the upper limit of the 95% confidence interval of the estimate of the hazard ratio.
Figure 4.
A forest plot showing the hazard ratio and 95% confidence intervals associated with variables considered in the univariable analyses with time to the primary endpoint (death) as the dependent variable. Blocks represent the hazard ratio and the horizontal bars extend from the lower limit to the upper limit of the 95% confidence interval of the estimate of the hazard ratio.
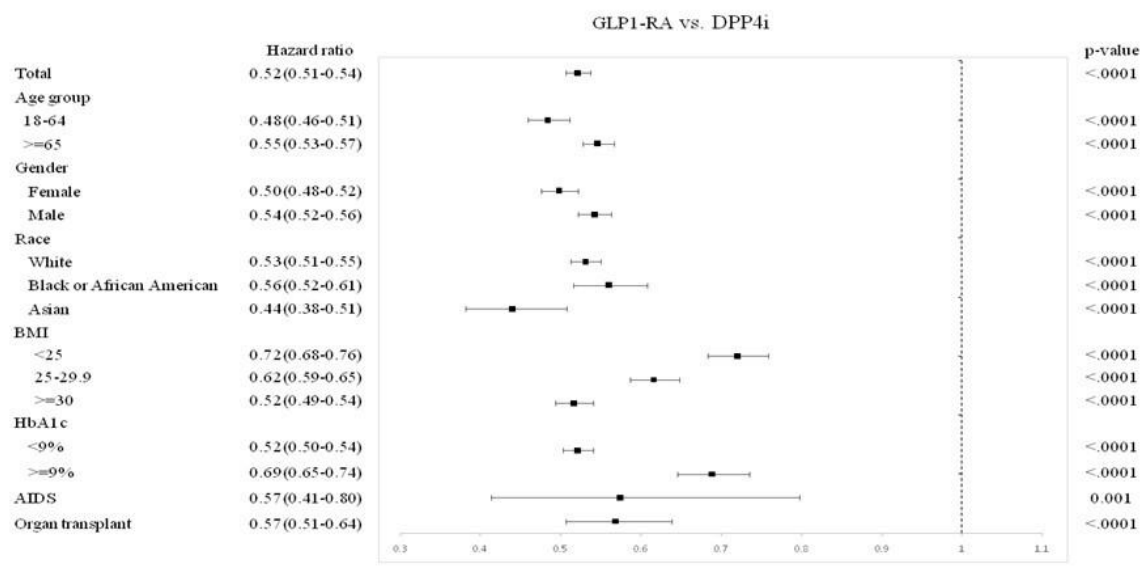
Figure 5.
Survival probability between GLP1-RA cohort and DPP4i cohort.
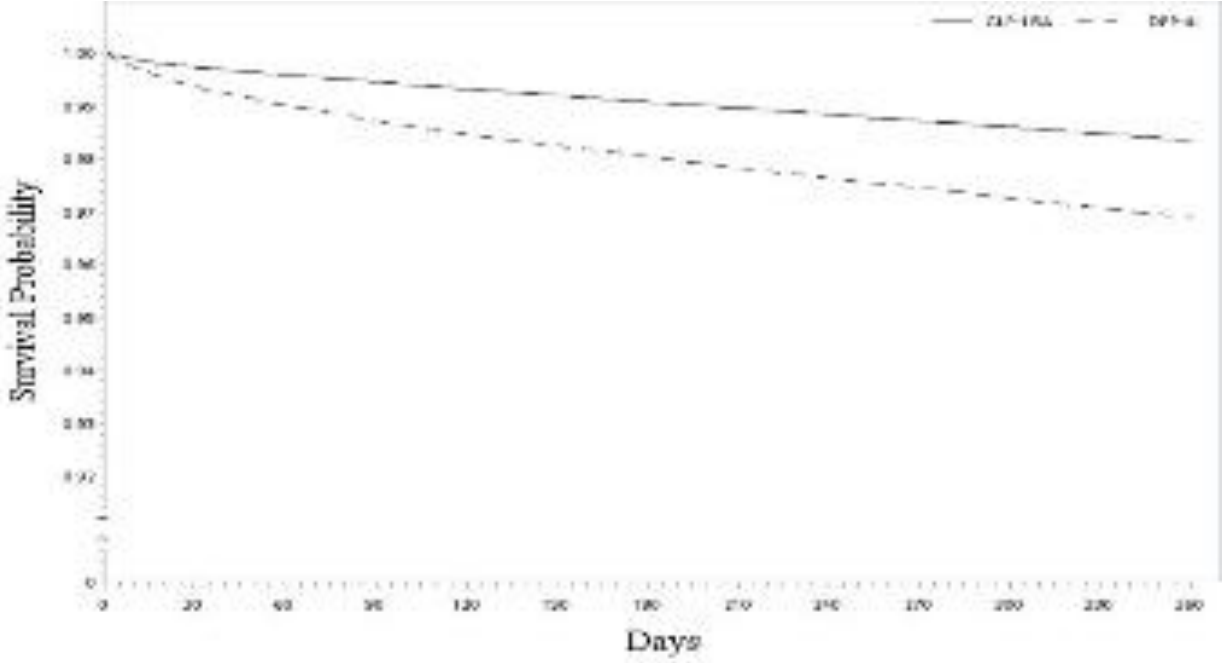
Figure 6.
A forest plot showing the hazard ratio and 95% confidence intervals associated with variables considered in the univariable analyses with time to the primary endpoint (Gastrointestinal and hepatobiliary disorders) as the dependent variable. Blocks represent the hazard ratio and the horizontal bars extend from the lower limit to the upper limit of the 95% confidence interval of the estimate of the hazard ratio.
Figure 6.
A forest plot showing the hazard ratio and 95% confidence intervals associated with variables considered in the univariable analyses with time to the primary endpoint (Gastrointestinal and hepatobiliary disorders) as the dependent variable. Blocks represent the hazard ratio and the horizontal bars extend from the lower limit to the upper limit of the 95% confidence interval of the estimate of the hazard ratio.
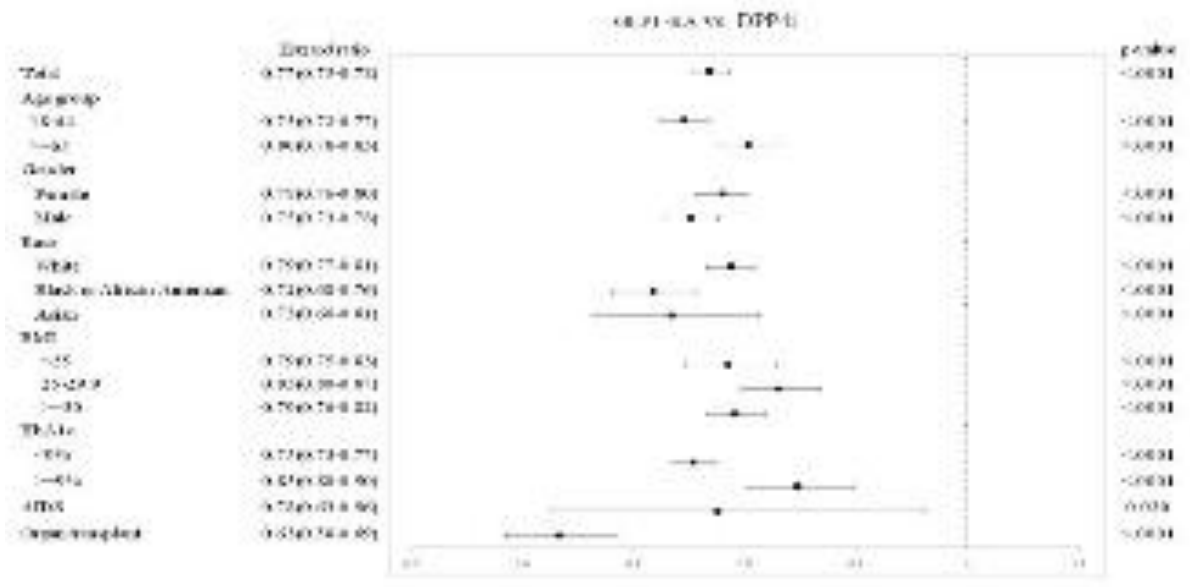
Figure 7.
Cumulative incidence of Gastrointestinal and hepatobiliary disorders between GLP1-RA cohort and DPP4i cohort.
Figure 7.
Cumulative incidence of Gastrointestinal and hepatobiliary disorders between GLP1-RA cohort and DPP4i cohort.
Disclaimer/Publisher’s Note: The statements, opinions and data contained in all publications are solely those of the individual author(s) and contributor(s) and not of MDPI and/or the editor(s). MDPI and/or the editor(s) disclaim responsibility for any injury to people or property resulting from any ideas, methods, instructions or products referred to in the content. |
© 2026 by the authors. Licensee MDPI, Basel, Switzerland. This article is an open access article distributed under the terms and conditions of the Creative Commons Attribution (CC BY) license (http://creativecommons.org/licenses/by/4.0/).
Copyright: This open access article is published under a Creative Commons CC BY 4.0 license, which permit the free download, distribution, and reuse, provided that the author and preprint are cited in any reuse.