

Submitted:
09 September 2026
Posted:
10 September 2026
You are already at the latest version
Abstract
The diversity of modern structural glasses is immense, and their mechanical properties vary significantly. Reliable evaluation of glass fracture toughness enables the rational design of structural elements, accurate prediction of their service life, and guaranteed operational safety. This study introduces a novel specimen configuration for determining the static fracture toughness of glass. The specimen design incorporates a stabilizing zone, which reduces its sensitivity to loading device stiffness and ensures straight crack propagation. Specimen preparation is simple and requires no specialized, expensive equipment. Utilizing this approach, static fracture toughness testing of glass can be performed on a standard tensile testing machine. This specimen configuration enables the analysis of crack deceleration and arrest stages. At these stages, the crack tip is fully formed, and the crack front exhibits a natural, rectilinear profile. Consequently, the quality of initial crack preparation in the specimen becomes non-critical. The application of numerical simulation in experimental data processing yielded the dependence of the critical stress intensity factor on the crack propagation velocity. The developed specimen was successfully tested on silicate glass. The advantages of the proposed approach are demonstrated by comparing the results with data obtained using a traditional compact tension specimen.

Keywords:
structural glass
; static fracture toughness
; specimen configuration
; crack propagation velocity
; stress intensity factor
; numerical simulation
; mechanical testing
1. Introduction
The modern construction industry is dynamically expanding its repertoire of structural materials. Driven by technological advancements, load-bearing elements are increasingly fabricated from materials historically reserved for architectural decoration, such as silicate glass. Glass components not only serve as translucent barriers but are also utilized as floor slabs, columns, and cladding panels [1,2,3]. This material is environmentally sustainable, chemically inert, and exhibits high resistance to weathering and ultraviolet radiation. Furthermore, its favorable strength-to-weight ratio minimizes the dead load of engineered structures.
In this study, our focus is directed toward silicate glasses. From a practical perspective, these glasses are attractive due to their relatively high specific strength. However, glass is a classically brittle material. Consequently, the reliability of predicting its ultimate limit state directly depends on the accuracy of data regarding crack nucleation and propagation patterns. Investigating crack initiation and growth under various loading conditions provides the necessary informational foundation for safely expanding the structural application domain of glass. Such studies are critically important given that the diversity of modern glasses is immense, and their brittle behavior varies significantly [4,5].
The mechanisms of crack nucleation and propagation in glass have been investigated in a number of classical and contemporary studies [6,7,8,9], which discuss the combined effects of mechanical and chemical factors governing these processes. One of the key parameters characterizing the fracture resistance of glass is the stress intensity factor (SIF). The wide nomenclature of modern glasses, coupled with their pronounced brittle behavior, necessitates the development of simple and reliable tools to determine the critical SIF values of the actual material [10].
To determine the fracture toughness of brittle materials, tensile testing is conducted using specimen configurations such as the compact tension (CT) specimen and the double cantilever beam (DCB). Additionally, flexural testing of notched beams with various notch profiles is widely applied. Each of these testing methodologies possesses distinct advantages and inherent limitations.
In fatigue testing, the compact tension specimen is most frequently utilized. In this case, a stable crack growth is achieved, and the crack propagation velocity can be precisely controlled by defining the loading amplitude and frequency. Furthermore, the preparation of the initial precrack is straightforward, as it develops uniformly from the stress concentrator [11,12].
Conducting quasi-static fracture toughness testing on brittle materials imposes rigorous constraints on specimen configuration. The key problem is that under static loading conditions, immediately after initiation, the crack enters an unstable, catastrophic propagation regime and instantly fractures the entire specimen [13,14]. This phenomenon severely hinders the ability to monitor crack growth kinetics or accurately evaluate the critical stress intensity factor directly at the advancing crack tip. Analyzing such transient fracture behavior necessitates specialized, cost-prohibitive high-speed equipment. Consequently, standard testing practice typically relies on registering the peak load immediately preceding total catastrophic failure. This maximum force is then used to calculate the SIF, which strictly corresponds only to the crack initiation threshold. Crucially, this initiation value can significantly overestimate the actual SIF governing steady-state crack propagation [15]. In static fracture toughness testing, the experimental results are highly sensitive to the quality of specimen preparation. The closer the notch geometry approximates a sharp crack tip (i.e., the smaller the notch root radius), the more accurate the evaluation becomes. The most reliable stress intensity factor values are achieved when a fatigue precrack is introduced. However, incorporating fatigue precracking substantially complicates the specimen preparation workflow, especially for highly brittle materials [16].
An alternative approach focuses on analyzing the crack behavior during its deceleration and arrest stages [17]. Under this scenario, the initial notch geometry becomes non-critical; however, specific experimental boundary conditions must be established to ensure successful crack arrest. The double cantilever beam (DCB) specimen is historically considered the most suitable configuration for this testing methodology [18,19]. Nevertheless, directional crack growth in plain DCB geometry is highly unstable, frequently causing the crack path to deviate laterally and shear off one of the beam arms. To prevent this failure mode, side-grooves are typically machined along the target propagation line to constrain the stress concentration to a strictly rectilinear trajectory [20]. It should be noted that the introduction of such side grooves inevitably requires the calculation of SIFs considering the three-dimensional stress-strain state and the curvilinear profile of the crack front, which significantly complicates the processing of experimental data. Furthermore, the precision machining of side grooves significantly increases the labor intensity and cost of specimen preparation.
Another critical factor governing the crack propagation process in a double cantilever beam is the magnitude of the crack “jump” (i.e., the rapid, quasi-dynamic increment in crack length from initiation to arrest). The magnitude of this jump depends heavily on the stiffness of the loading system. If the testing machine possesses low stiffness, a substantial crack extension is required to reduce the load at the grips. This, in turn, necessitates a significant increase in the overall dimensions of the specimen to ensure the reliable detection of the crack arrest moment [21].
One of the common methods to increase loading stiffness is the use of the wedge splitting configuration, which is described in detail in both classic and contemporary studies [22,23]. The application of wedge loading allows minimizing the crack jump magnitude and, consequently, significantly reducing the specimen dimensions. However, this approach involves uncertainty in determining the true force transmitted by the wedge to the specimen. This error is caused by a variable coefficient of friction in the contact zone between the wedge and the gripping elements (jaws), which heavily depends on a set of difficult-to-control parameters: surface roughness, type of lubricant applied, and contact stress level.
To overcome the catastrophic (unstable) failure of brittle materials under conditions where propagating a fatigue precrack is unfeasible, specimen geometries with a chevron notch (Chevron Notch) were developed [24]. Such tests enable the accurate determination of the critical stress intensity factor at the crack arrest stage. However, the precision machining of a chevron notch with a specified geometry in glass poses a complex technological challenge and requires specialized, expensive equipment.
To overcome these difficulties in determining the static fracture toughness parameters of silicate glass, this paper proposes and scientifically substantiates an original specimen configuration. The developed specimen configuration incorporates a stabilization zone that significantly reduces the specimen’s sensitivity to the stiffness of the loading device. This design feature ensures strictly rectilinear crack propagation and enables stable regimes of deceleration and complete arrest of crack growth. The experimental data recorded under these controlled regimes provide a reliable basis for the accurate determination of critical stress intensity factors. The proposed specimen type allows fracture toughness testing to be conducted on standard tensile testing machines. Processing of the obtained experimental data allowed establishing the relationship between the critical SIF and the crack growth rate. The advantages of the proposed specimen configuration are clearly demonstrated by comparing the results with data obtained using a traditional compact tension specimen.
2. Materials and Methods
The developed specimen was cut from 4-mm-thick silicate glass and has the form of a rectangular plate with dimensions of 180×90 mm. Pin holes 5 mm in diameter for mounting the loading device grips are located at a distance of 65 mm from the plate edge, with a center-to-center distance of 50 mm between them. A key feature of the specimen is that the 30-mm-long initiating crack is located inside the specimen and is bounded on one side by a 5-mm diameter hole. It is introduced using a glass cutter and then propagated from the opposite side of the plate by a light tapping impact along the score line. This initial notch configuration arrests the crack on the hole side but does not impede its propagation in the opposite direction. Thus, an additional stiffness zone is formed in the plate to the left of the hole, remaining constant throughout the entire crack propagation process. Selecting an appropriate stiffness value for this zone prevents catastrophic crack growth along the main direction and ensures a controlled crack arrest process. This, in turn, allows for obtaining the experimental data necessary to determine the critical stress intensity factor (KIc) of the specimen material. Having established the stabilizing role of this additional stiffness zone, we shall hereinafter refer to the proposed configuration as the stabilized specimen.
For comparison, a specimen closely resembling the shape of a traditional compact tension (CT) specimen was used, adapted for brittle materials test requirements in accordance with ASTM C1421 guidelines [25]. It consists of a rectangular glass plate measuring 135×90×4 mm with 5 mm diameter grip holes located at a distance of 20 mm from the edge. The center-to-center distance between the grip holes is 50 mm. A symmetrical initial edge crack 30 mm long was formed at the edge of the sample. I n our work, we will refer to it as the CT specimen. Both types of specimens are shown schematically in Figure 1.
Figure 2a shows the schematic of the developed specimen, and Figure 2b presents a photograph of the specimen mounted in the grips of the loading device. The magnified inset illustrates the specimen region with the initial crack bounded on the left by the hole.
Tensile testing of the glass specimen was performed using a MIM.2-20 universal testing machine. The technical characteristics of the machine are as follows: a loading capacity range of 0.2–20 kN (with a relative force measurement error of ±0.5%), a displacement measurement range of 10–1300 mm (with a relative displacement measurement error of ±1%), and a crosshead speed range under nominal load of 0.001–500 mm/min.
Crack front propagation was recorded using high-speed video imaging. The video recording was performed with a Sony Cyber-shot DSC-HX300 camera at a frame rate of 50 frames per second. Based on the video data, the crack front position was determined with a time step of 10 ms. Concurrently with the video recording, the force applied to the specimen by the testing machine was registered. This enabled the synchronization of the crack position with the corresponding applied load for each moment in time. These experimental data are sufficient to determine the critical stress intensity factor based on numerical simulation.
When processing the experimental data, numerical simulation method for crack propagation in brittle materials was applied within the framework of linear elastic fracture mechanics [26]. Without going into the details of the computational procedures, the following should be noted. The numerical experiment based on finite element analysis was performed using the ANSYS software package. The SMART technology [27] was utilized to construct the necessary sequences of elastic solutions and to calculate the SIF. The SIF values for each current crack position and the corresponding tensile forces were determined based on J-integral evaluations [28]. The following elastic properties of silicate glass were used in the calculations: Young’s modulus of 70 GPa and Poisson’s ratio of 0.25.
3. Results
3.1. Numerical Experiment on Evaluating the Effect of Loading Device Stiffness
The testing machine and the grips fixing the specimen possess a certain stiffness. The stiffness of the loading system significantly influences the crack propagation process. If the stiffness is low, the accumulated elastic energy is released and abruptly transferred to the crack. In brittle materials, this leads to catastrophic crack propagation, making it practically impossible to study slow fracture kinetics. The crack propagates instantaneously across the entire specimen, preventing the recording of the crack arrest moment. Specimen configurations of different geometries exhibit varying levels of sensitivity to the loading system stiffness.
The results of the numerical experiment on simulation the crack propagation in glass specimens under a quasistatic tensile load are presented below. The primary objective of the experiments is to compare the crack propagation process in the two types of specimens described above under varying stiffness of the loading device.
The schematic model for the calculation is presented in Figure 1. In accordance with this diagram, it is assumed that the lower grip hole is fixed, while the upper one is connected to a spring with a stiffness of Сi, which models the stiffness of the loading system. The action of the loading device is assumed to be defined by a displacement U0 of the spring along the vertical axis. This displacement remains constant throughout the entire numerical experiment. The value of U0 was selected such that the SIF at the crack tip was 0,8 МПа·m1/2, which corresponds to the crack propagation onset. The SIF corresponding to the crack arrest was assumed to be 0,7 МПа·m1/2.
Figure 3 illustrates crack propagation during the loading process, displaying the vertical displacement fields for three different crack configurations. The top row corresponds to the initial crack state, while the middle and bottom rows correspond to crack length increments of 4 cm and 8 cm, respectively. The fields are displayed on a deformed mesh with a displacement scaling factor of 350. The loading system stiffness, Ci, was assumed to be 5 N/μm.
Comparing the calculated SIF values for the compact specimen and the stabilized specimen clearly highlights the advantages of the modified configuration. Under loading, the CT (Figure 3a) exhibits SIF values of 0.93 and 0.92 MPa·m1/2 at crack length increments of 4 cm and 8 cm, respectively. Since these exceed the threshold KIc = 0.7, continuous crack propagation occurs. In contrast, the stabilized specimen (Figure 3b) yields lower SIF values (0.68 and 0.67 MPa·m1/2) at identical crack extensions, remaining below the critical threshold. This demonstrates that crack growth is reliably arrested in the stabilized specimen. Consequently, using the stabilized specimen enables controlled crack propagation under quasi-static loading conditions.
During the numerical simulation, the SIF values were calculated for each stage of crack propagation. Consequently, the SIF dependences on the crack length were plotted (Figure 4). Similar calculations were performed for other stiffness values. In the Figure, 4 curves (1, 2, 3...10) correspond to decreasing stiffness values (C1, C2, C3...C10) of the loading system, specifically [5,6,7,8,9,10,12,15,20,30] N/µm. Figure 4a corresponds to the CT specimen, while Figure 4b corresponds to the stabilized specimen. On the plots, the horizontal red line marks the threshold SIF value, which indicates crack arrest.
The obtained relationships lead to the following conclusions. In the CT specimen (Figure 4a), a decrease in the loading stiffness leads to a significant increase in the crack length. At stiffness values below 8 N/µm (curves 8, 9, and 10), the threshold SIF for crack arrest is not achieved, even if the crack extension reaches 8 cm. In contrast, the stabilized specimen exhibits a fundamentally different behavior. Across the entire range of investigated stiffness (from 30 to 5 N/µm), the crack extension remains below 1.5 cm. Consequently, the crack propagation process becomes controlled over a wide range of loading stiffness variations, highlighting the effectiveness of the proposed specimen geometry.
3.2. Assessing the Significance of Precrack Positioning Accuracy
Our experiments demonstrate that the crack propagation trajectory under quasi-static tension significantly depends on the specimen preparation accuracy. In a traditional CT specimen, even a minor deviation of the crack starter from the symmetrical position causes the crack to deflect from a straight path, potentially cutting through one part of the specimen. Consequently, the resulting KIc measurements exhibit a strong dependency on the quality of specimen preparation, which is confirmed by studies [29].
Figure 5 illustrates the experimental result of tensioning a glass specimen where the crack starter was offset by 0.5 mm from the axis of symmetry. Figure 6 presents the numerical simulation results for this scenario. During specimen loading, the crack initially propagates in the direction prescribed by the starter and then deflects toward the bottom edge of the specimen, ultimately splitting the plate into two parts.
Figure 7 compares the experimentally obtained crack trajectory with the numerical simulation results. Figure 7a shows the specimen after failure, with the crack path indicated by a thin black line. Figure 7b demonstrates the calculated crack trajectory at the final stage of fracture, where the fracture zone obtained from the simulation is highlighted by a yellow line. Its width is 2.5 mm. The experimentally recorded crack trajectory, superimposed on this image, lies completely within this zone (the black line in Figure 7b). Thus, it can be concluded that the error in calculating the crack propagation trajectory in our numerical simulation does not exceed 2.5 mm.
An analysis of the numerical simulation results made it possible to determine how the offset of the initial notch position affects the crack behavior in both conventional and modified specimens. We performed a numerical experiment in which the crack starter was shifted along the vertical axis to induce crack deflection from a straight path. The predicted crack propagation trajectories are shown in Figure 8. The horizontal line 1 displays the trajectory of the crack initiated from a notch located strictly on the axis of symmetry, while curves 2–5 correspond to initial crack offsets of 0.5, 1, 2, and 4 mm along the vertical axis, respectively.
As seen from the figure, in the CT specimen , a crack starter offset of mere 0.5 mm from the axis of symmetry is sufficient to cause significant crack deflection from a straight trajectory. The modified specimen demonstrates considerably higher stability of the crack propagation path. Even a 4 mm notch offset does not cause the crack to reach the bottom edge of the specimen or split it into pieces. Thus, the stabilized specimen proved to be significantly less demanding regarding preparation accuracy. When the position of the initial crack changes, its trajectory deflects only marginally from a straight path.
3.3. Determination of the Critical Stress Intensity Factor KIc
The developed testing algorithm enabled the successful realization of crack deceleration and arrest modes in the glass specimen. The video imaging results of the crack propagation process in the stabilized specimen under a tensile load are shown in Figure 9. The frames in the figure show the crack position at 6 consecutive time steps from initiation to 90 s.
The data obtained from this video recording regarding the changes in crack length over time and the corresponding tensile force are presented as graphs in Figure 10. These data are sufficient to determine the critical stress intensity factor based on numerical simulation.
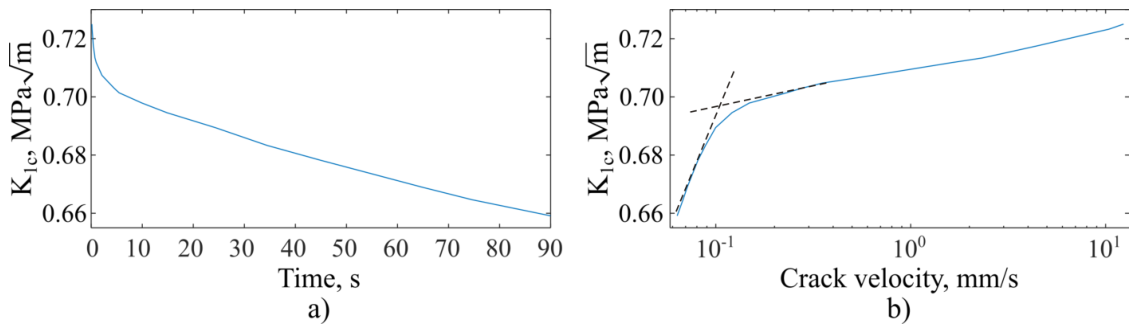
Figure 11a presents the fracture toughness КIc determined from these data as a function of time. This value is not constant and exhibits an increasing trend with the growth of the crack propagation velocity. The dependence of the КIc on the crack propagation rate is shown in Figure 11b. The graph, plotted using a logarithmic scale for the velocity axis, reveals two distinct characteristic regions. The linear segment at velocities below 10⁻¹ mm/s corresponds to subcritical crack growth, which is characterized by a sharp increase in the SIF. At crack propagation velocities exceeding 10⁻¹ mm/s, a second, nearly linear region emerges on the graph, corresponding to rapid crack growth. This finding aligns well with the established framework regarding the transition from subcritical to critical crack propagation regimes in glass, as reported, for instance, in [30,31].
4. Conclusions
In this study, a new specimen configuration has been successfully developed and validated for determining the static fracture toughness KIc of silicate glass under a quasistatic tensile load. The key design feature of the specimen is the integration of an additional stiffness zone, which enables the realization of slow crack propagation and crack arrest modes, where the crack tip is fully formed and exhibits its natural geometry.
Based on the experimental and numerical results, the following main conclusions can be drawn:
- Crack Growth Stabilization: The proposed specimen design effectively stabilizes subcritical crack growth and provides controlled crack deceleration and arrest stages.
- Insensitivity to Machine Stiffness: Finite element numerical simulation demonstrated that the additional stiffness zone significantly reduces the specimen’s sensitivity to the compliance of the loading device. This enables steady tracking of the crack arrest using standard tensile testing machines.
- Geometric Robustness: Due to the realization of a natural, straight crack front at the arrest stage, the fracture toughness evaluation becomes independent of the pre-crack preparation accuracy and its positioning precision.
- Velocity-Dependent Stress Intensity Factor: Based on experimental data regarding crack propagation in the specimen and the corresponding force changes, as well as the analysis of numerical simulation results, the dependence of KIc on the crack propagation velocity was obtained. Two fracturing regimes were experimentally recorded: subcritical crack growth at a crack velocity below 10-1mm/s and rapid crack propagation above this threshold, demonstrating good agreement with classical fracture mechanics concepts for brittle materials.
The developed specimen was successfully validated on silicate glass. The advantages of the proposed specimen configuration are emphasized by comparing the obtained results with data gathered from a traditional compact tension specimen.
The developed approach offers a simple, cost-effective, and highly reliable methodology for evaluating the mechanical reliability of modern structural glasses. It is expected that the proposed specimen configuration and the results validating its advantages will enable the effective use of this methodology to determine the static fracture toughness parameters for a wide range of glasses applied in the construction industry.
Author Contributions
Conceptualization, A.S. and I.S.; methodology, A.S. and I.S..; software, A.S. and O.S.; validation, A.S., O.S. and I.G..; formal analysis, A.S. and I.S.; investigation, A.S., I.G. and O.S.; resources, A.S. and I.S.; data curation, A.S.; writing—original draft preparation, A.S., and I.S.; writing—review and editing, I.S. and I.G..; visualization, A.S., and I.G.; supervision, I.S. project administration, A.S.; funding acquisition, I.S. and A.S. All authors have read and agreed to the published version of the manuscript.” Please turn to the CRediT taxonomy for the term explanation. Authorship must be limited to those who have contributed substantially to the work reported.
Funding
This research was funded by the Russian Science Foundation (Grant No. 22-19-00108, rscf.ru).
Data Availability Statement
The data that support the findings of this study are available from the corresponding author upon reasonable request.
Acknowledgments
During the preparation of this manuscript, the authors used Google’s Gemini language model (developed by Google DeepMind) for assistance with text translation, academic style refinement, and bibliographical formatting to improve the manuscript’s clarity. Upon generating draft modifications, the authors thoroughly reviewed, edited, and verified all text and references, and they take ultimate responsibility for the final content of this publication.
Conflicts of Interest
The authors declare no conflicts of interest. The funders had no role in the design of the study; in the collection, analyses, or interpretation of data; in the writing of the manuscript; or in the decision to publish the results.
References
- Haldimann, M.; Luible, A.; Overend, M. Structural Use of Glass; Structural Engineering Documents; International Association for Bridge and Structural Engineering (IABSE): Zurich, Switzerland, 2008. [Google Scholar]
- Bedon, C.; Zhang, X.; Santos, F.; Honfi, D.; Kozłowski, M.; Arrigoni, M.; Figuli, L.; Lange, D. Performance of structural glass elements under extreme loads—A state-of-the-art review. Eng. Struct. 2018, 163, 215–237. [Google Scholar]
- Schittich, C.; Staib, G.; Balkow, D.; Schuler, M.; Sobek, W. Glass Construction Manual, 2nd ed.; Birkhäuser: Basel, Switzerland, 2007. [Google Scholar]
- Rouxel, T. Fracture mechanics of glasses: Knowing the context for better understanding. J. Am. Ceram. Soc. 2021, 104, 1541–1559. [Google Scholar]
- Wondraczek, L. Cyclic fracture behavior and composition-dependent toughness of structural oxide glasses. Int. J. Fract. 2019, 218, 45–61. [Google Scholar]
- Pukh, V.P. Strength and Destruction of Glass; (In Russian). Nauka: Leningrad, USSR, 1973. [Google Scholar]
- Lawn, B.R.; Wilshaw, T.R. Fracture of Brittle Solids, 2nd ed.; Cambridge University Press: Cambridge, UK, 1993. [Google Scholar]
- Wiederhorn, S.M.; Fett, T. Kinetic analysis of subcritical crack growth in glass. J. Am. Ceram. Soc. 2011, 94, 115–122. [Google Scholar]
- Freiman, S.W.; Wiederhorn, S.M.; Mecholsky, J.J., Jr. Environmentally assisted fracture of glass: A historical perspective. J. Am. Ceram. Soc. 2009, 92, 1371–1382. [Google Scholar] [CrossRef]
- Richter, C.; Tasche, M.; Schneider, J. Determination of stress intensity factors for structural glass applications. Glass Struct. Eng. 2022, 7, 185–203. [Google Scholar]
- Suresh, S.; Brockenbrough, J.R. Cyclic fatigue crack growth in ceramics: A geometric and mechanism-based analysis. Acta Metall. 1988, 36, 1463–1470. [Google Scholar]
- Jacobs, D.S.; Chen, I.W. Cyclic fatigue of a glass-ceramic with a sub-critical crack growth exponent. J. Am. Ceram. Soc. 1995, 78, 513–520. [Google Scholar]
- Anderson, T.L. Fracture Mechanics: Fundamentals and Applications, 4th ed.; CRC Press: Boca Raton, FL, USA, 2017. [Google Scholar]
- Sakai, M.; Bradt, R.C. Fracture toughness testing of brittle materials. Int. Mater. Rev. 1993, 38, 53–78. [Google Scholar] [CrossRef]
- Fettweis, G.; Marlière, C.; Bouaziz, J.; Fett, T. Fracture toughness, fracture energy and slow crack growth of glass. Acta Mater. 2018, 149, 111–123. [Google Scholar] [CrossRef]
- Quinn, G.D.; Swab, J.J. Fracture toughness of glasses as measured by the SCF and SEPB methods. J. Eur. Ceram. Soc. 2017, 37, 4243–4257. [Google Scholar] [CrossRef]
- Sglavo, V.M.; Prezzi, A.; Green, D.J. In situ observation of crack propagation in ESP (engineered stress profile) glass. Eng. Fract. Mech. 2007, 74, 1383–1398. [Google Scholar] [CrossRef]
- Kandil, F.A. A review of double cantilever beam (DCB) testing methods for fracture toughness. Int. J. Fract. 2001, 110, 315–332. [Google Scholar]
- Urata, S.; Hirobe, S.; Oguni, K. Double cantilever beam fracture toughness measurement of glass in an inert atmosphere. J. Am. Ceram. Soc. 2022, 105, 3217–3228. [Google Scholar] [CrossRef]
- Aaldenberg, J.S.; Aaldenberg, E.M.; Picu, C.R.; Tomozawa, M. Double cantilever beam fracture toughness measurement method for glass. J. Am. Ceram. Soc. 2022, 105, 3949–3958. [Google Scholar] [CrossRef]
- Škec, L.; Alfano, G.; Jelenić, G. Fracture mechanical stability of DCB and 4ENF tests. Int. J. Solids Struct. 2023, 265, 112118. [Google Scholar]
- Brühwiler, E.; Wittmann, F.H. The wedge splitting test, a new method of performing stable fracture mechanics tests. Eng. Fract. Mech. 1990, 35, 117–125. [Google Scholar] [CrossRef]
- Takahashi, J.; Tanaka, M.; Yoshimura, A.; Ogasawara, T. Experimental method for Mode I fracture toughness of composite materials using wedge-loaded DCB specimen. Compos. Part A Appl. Sci. Manuf. 2018, 112, 1–8. [Google Scholar]
- Bubsey, R.T.; Munz, D.; Pierce, W.S.; Shannon, J.L. Compliance calibration of the short rod chevron-notch specimen for fracture toughness testing of brittle materials. Int. J. Fract. 1982, 18, 125–133. [Google Scholar] [CrossRef]
- ASTM E399-24; Standard Test Method for Linear-Elastic Plane-Strain Fracture Toughness of Metallic Materials. ASTM International: West Conshohocken, PA, USA, 2024.
- Cherepanov, G.P. Mechanics of Brittle Fracture; McGraw-Hill: New York, NY, USA, 1979. [Google Scholar]
- Help System, Ansys. Fracture Mechanics Analysis Guide: SMART Method for Crack-Growth Simulation; Ansys, Inc.: Canonsburg, PA, USA, 2021. [Google Scholar]
- Rice, J.R. A Path Independent Integral and the Approximate Analysis of Strain Concentration by Notches and Cracks. J. Appl. Mech. 1968, 35, 379–386. [Google Scholar] [CrossRef]
- Schellenberger, A.; et al. On the robustness of the Single-Edge-Precracked-Beam (SEPB) method for fracture toughness testing of ceramic materials. Eng. Fract. Mech. 2023, 290, 109483. [Google Scholar] [CrossRef]
- Yoda, M. Subcritical crack growth of glass. Eng. Fract. Mech. 1987, 28, 77–84. [Google Scholar] [CrossRef]
- Ciccotti, M. Stress-corrosion mechanisms in silicate glasses. J. Phys. D. Appl. Phys. 2009, 42, 063001. [Google Scholar] [CrossRef]
Figure 1.
Specimen configuration and loading diagram: (a) CT specimen; (b) Stabilized specimen.
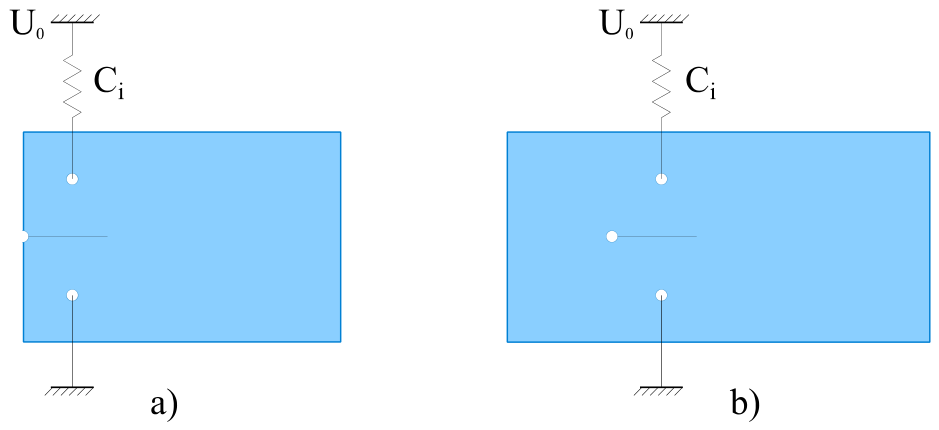
Figure 2.
Stabilized specimen: (a) Schematic representation; (b) Photograph of the specimen with an initial crack mounted in the grips of the loading device.
Figure 2.
Stabilized specimen: (a) Schematic representation; (b) Photograph of the specimen with an initial crack mounted in the grips of the loading device.
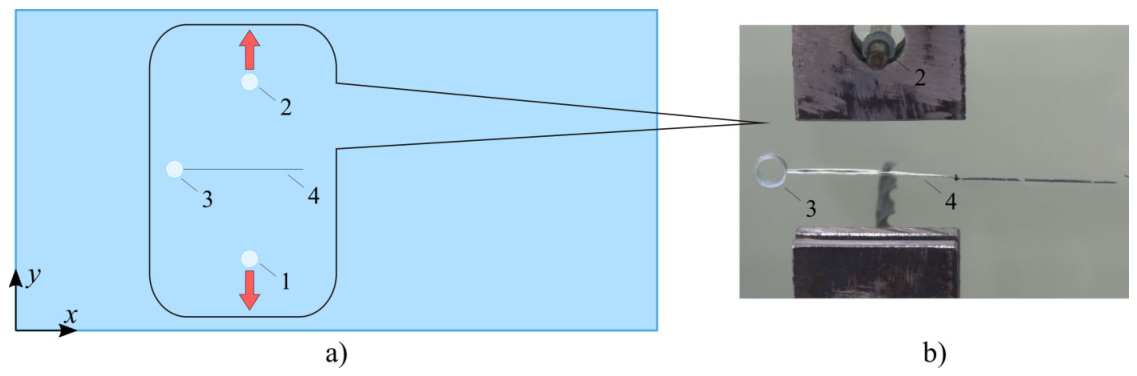
Figure 3.
Numerical simulation of crack propagation during the loading process: (a) a CT specimen; (b) Stabilized specimen.
Figure 3.
Numerical simulation of crack propagation during the loading process: (a) a CT specimen; (b) Stabilized specimen.
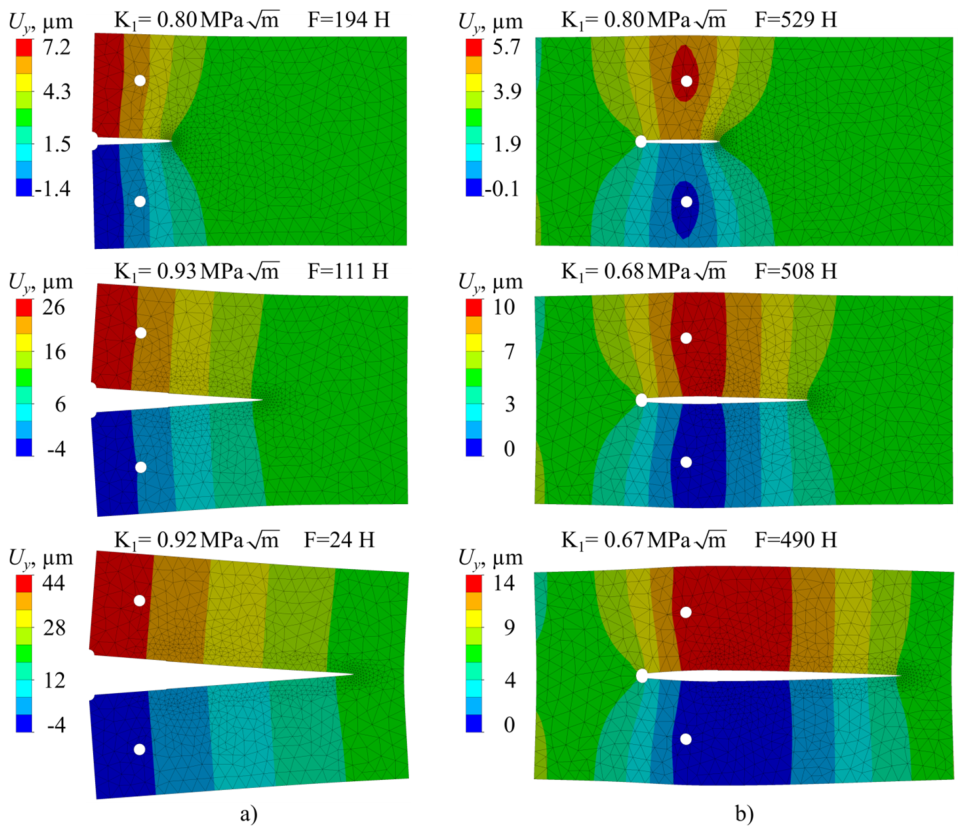
Figure 4.
Change in SIF depending on crack increment: (a) CT specimen; (b) Stabilized specimen.
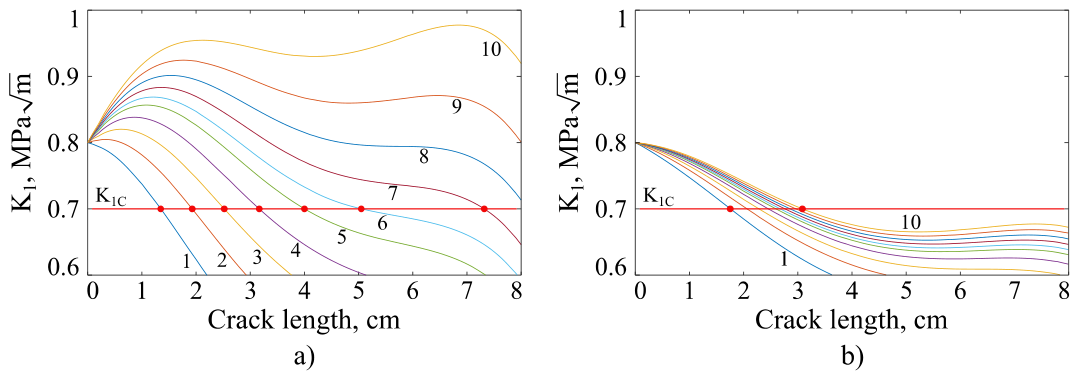
Figure 5.
Physical experiment of crack growth in a CT specimen with the initial crack offset by 0.5 mm from the axis of symmetry: (a) Initial stage, (b) Final moment of specimen splitting.
Figure 5.
Physical experiment of crack growth in a CT specimen with the initial crack offset by 0.5 mm from the axis of symmetry: (a) Initial stage, (b) Final moment of specimen splitting.
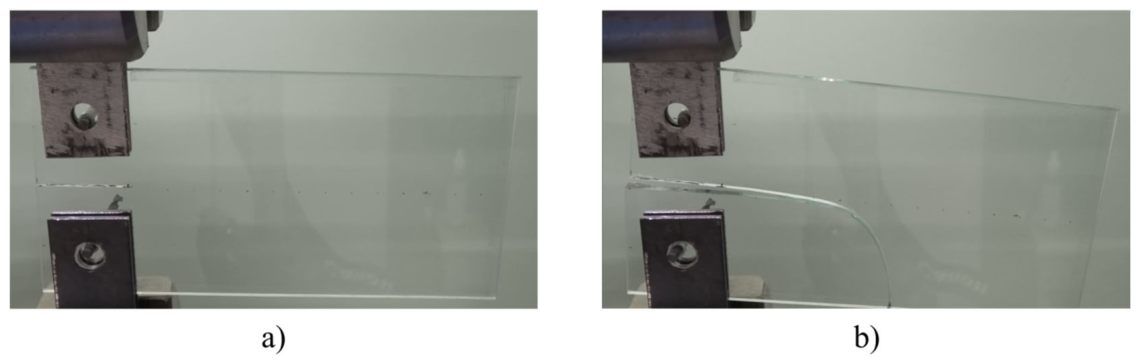
Figure 6.
Numerical simulation of crack growth in a CT specimen with the initial crack offset by 0.5 mm from the axis of symmetry: (a) Initial stage, (b) Final moment of specimen splitting.
Figure 6.
Numerical simulation of crack growth in a CT specimen with the initial crack offset by 0.5 mm from the axis of symmetry: (a) Initial stage, (b) Final moment of specimen splitting.
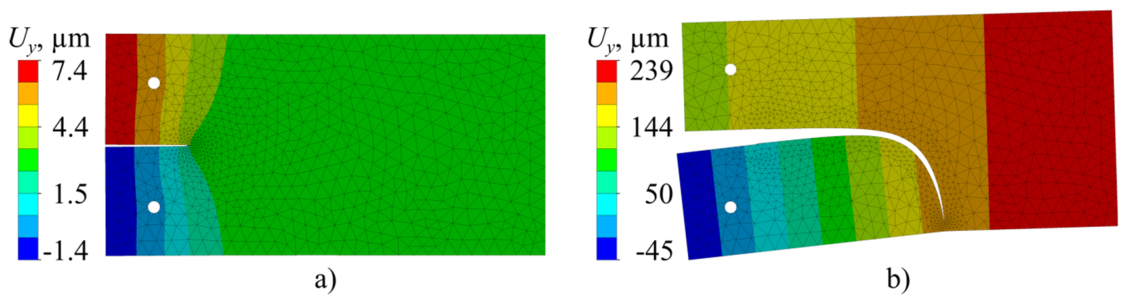
Figure 7.
Comparison of crack trajectories in CT specimen obtained in the experiment and calculation: (a) Photograph of the specimen after splitting; (b) Calculated and experimental crack trajectories at the final stage of specimen splitting.
Figure 7.
Comparison of crack trajectories in CT specimen obtained in the experiment and calculation: (a) Photograph of the specimen after splitting; (b) Calculated and experimental crack trajectories at the final stage of specimen splitting.
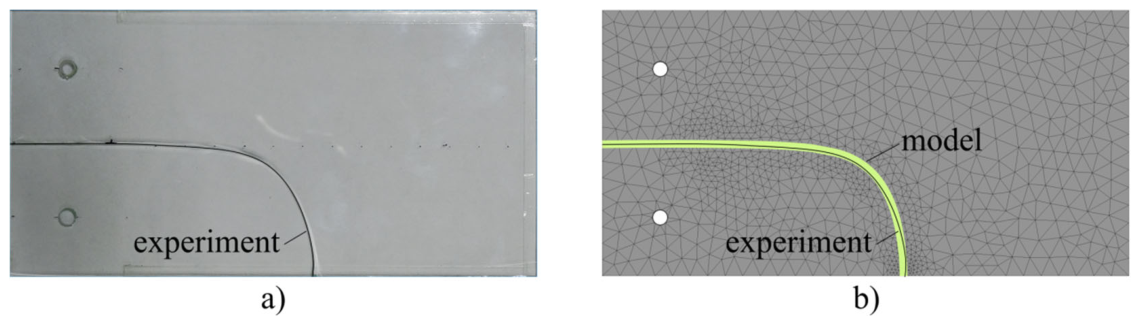
Figure 8.
Crack trajectories with initial crack offset along the vertical axis: (a) CT specimen, (b)—Stabilized specimen. 1–5—crack starter offsets of 0, 0.5, 1, 2, and 4 mm, respectively.
Figure 8.
Crack trajectories with initial crack offset along the vertical axis: (a) CT specimen, (b)—Stabilized specimen. 1–5—crack starter offsets of 0, 0.5, 1, 2, and 4 mm, respectively.
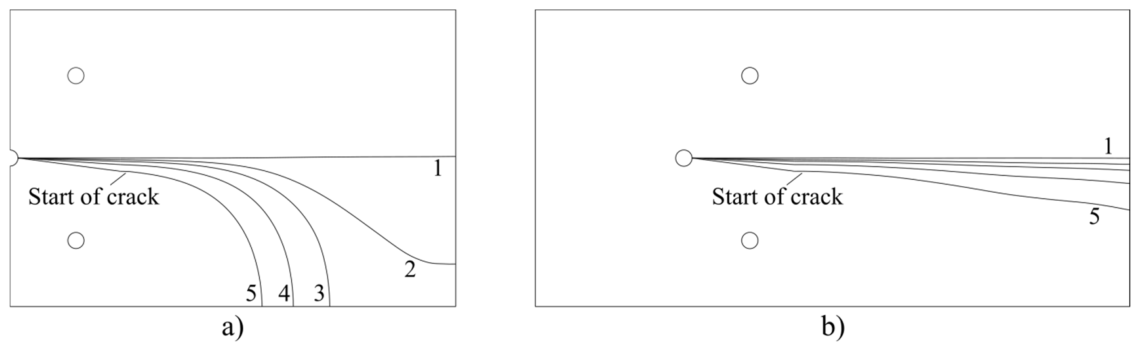
Figure 9.
Crack front evolution in a stabilized silicate glass specimen under tensile loading.
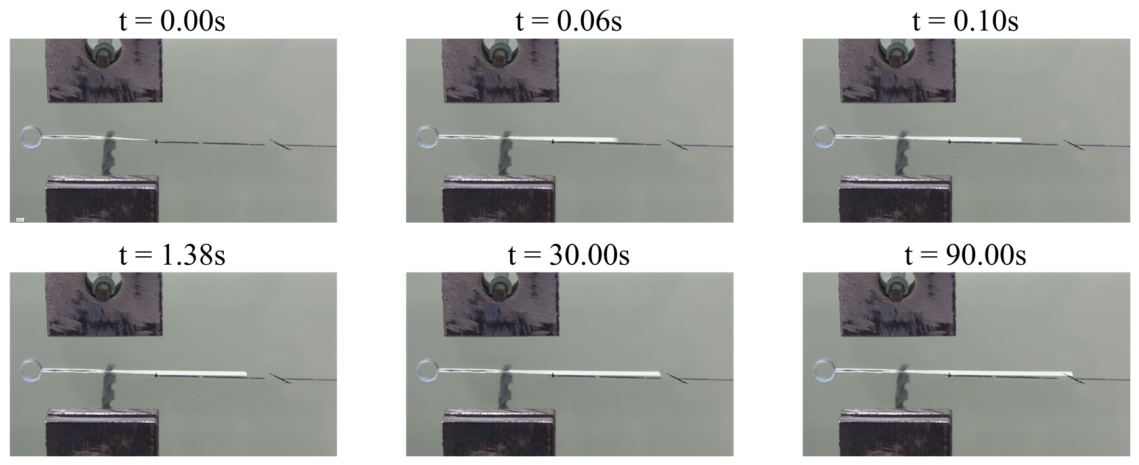
Figure 10.
Experimentally recorded curves during tensile loading of a stabilized glass specimen: (a) Crack length versus time; (b) Tensile force versus time.
Figure 10.
Experimentally recorded curves during tensile loading of a stabilized glass specimen: (a) Crack length versus time; (b) Tensile force versus time.
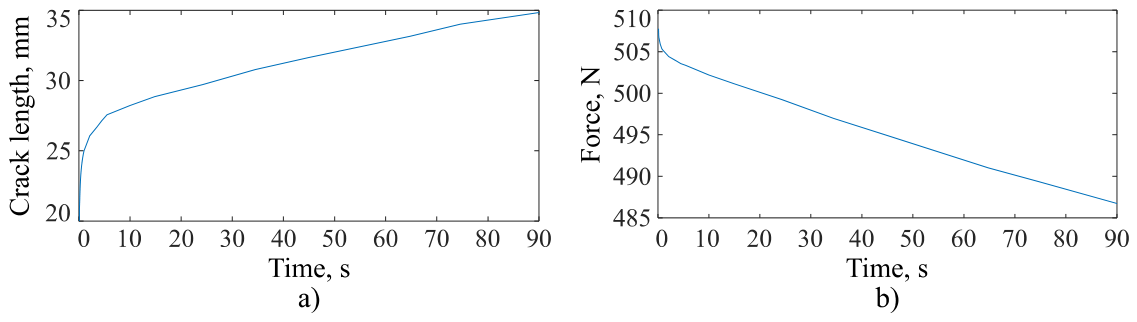
Figure 11.
Critical stress intensity factor of silicate glass calculated from experimental data: (a) КIc as a function of time, (b) КIc as a function of crack propagation velocity.
Figure 11.
Critical stress intensity factor of silicate glass calculated from experimental data: (a) КIc as a function of time, (b) КIc as a function of crack propagation velocity.
Disclaimer/Publisher’s Note: The statements, opinions and data contained in all publications are solely those of the individual author(s) and contributor(s) and not of MDPI and/or the editor(s). MDPI and/or the editor(s) disclaim responsibility for any injury to people or property resulting from any ideas, methods, instructions or products referred to in the content. |
© 2026 by the authors. Licensee MDPI, Basel, Switzerland. This article is an open access article distributed under the terms and conditions of the Creative Commons Attribution (CC BY) license (http://creativecommons.org/licenses/by/4.0/).
Copyright: This open access article is published under a Creative Commons CC BY 4.0 license, which permit the free download, distribution, and reuse, provided that the author and preprint are cited in any reuse.