

Submitted:
09 September 2026
Posted:
09 September 2026
You are already at the latest version
Abstract
Multimodal molecular profiles are often assumed to improve cancer drug-response prediction simply by adding information. We developed an evidence-bounded DepMap workflow to test that assumption across expression, copy-number, and mutation features. The declared evaluation universe contained 15 compounds from GDSC1, GDSC2, and CTD². Models used fold-local feature selection and Ridge regression, with drug-held-out and leave-one-dataset-out validation. In full-universe drug-held-out validation across five repeated splits, fusion had mean RMSE 0.2322 versus 0.2328 for expression alone (mean fusion-minus-expression RMSE −0.0006; seed-level SD 0.0013). Fusion improved in three of five splits and was slightly worse in two. In cross-study validation, fusion was slightly worse in all three held-out datasets: CTD² 0.3238 versus 0.3231, GDSC1 0.2339 versus 0.2322, and GDSC2 0.2387 versus 0.2347. Structured missingness and weak-to-moderate row-level modality correlations accompanied dataset-sensitive performance. These findings support evaluating multimodal models by incremental value, transferability, and failure modes rather than assuming that more omics is always better.

Keywords:
information fusion
; drug response
; multi-omics
; cancer
; missing data
; cross-study validation
1. Introduction
Cancer pharmacogenomics increasingly combines multiple molecular assays to predict drug response. More measurements can capture complementary biology, but they also increase dimensionality, missingness, and sensitivity to study-specific measurement processes. We therefore specified a workflow that treats incremental predictive value, missingness, and modality conflict as joint evaluation targets.
1.1. Brief Literature Context
Drug response is a heterogeneous phenotype shaped by lineage, genomic alterations, transcriptional state, assay conditions, and drug-specific mechanisms. The Cancer Cell Line Encyclopedia established a large-scale link between cancer cell-line molecular profiles and pharmacologic sensitivity [1]. The Genomics of Drug Sensitivity in Cancer subsequently provided a broad pharmacogenomic map across drugs and cell lines, showing that response associations are distributed across tissue context and molecular features rather than being reducible to a single biomarker class [2]. DepMap and related resources further consolidated molecular and functional measurements for systematic cancer-model analysis [3]. These resources made computational response prediction possible, but they also made the data-integration problem more visible: assays are not uniformly measured across all models, and response data are generated under source-specific experimental protocols.
For pharmaceutical research, the relevant endpoint is not only predictive accuracy but whether a model can support transparent prioritization of compounds, biomarkers, and follow-up experiments. A model that performs reliably across a declared validation target may help rank candidate molecular contexts for early discovery studies; however, cell-line prediction alone does not establish clinical utility, prospective benefit, or suitability for dosing decisions. These boundaries motivate an evaluation that reports transfer failures and data-availability constraints alongside average error metrics.
The literature contains several complementary modeling strategies. Expression-only models have often been competitive because transcriptomic state captures pathway activity and lineage context, whereas mutation and copy-number features can provide sparse but mechanistically informative signals. Multimodal models combine these signals through early concatenation, late integration, multitask learning, or biologically structured architectures. MOLI, for example, integrates expression, copy-number, and mutation information through modality-specific encoders and reported gains in external validation [5]. DrugCell uses a biologically structured neural network and drug representations to model response and synergy [8], while other deep-learning frameworks have reported strong performance in cell-line settings and more variable transfer to clinical or external cohorts [9,10]. These results motivate multimodal integration, but they do not imply that adding an assay is beneficial under every population, response definition, or validation design.
The practical question is therefore not whether a modality is biologically informative in isolation, but whether it adds reliable information after the strongest available baseline and the data-construction rules have been fixed. An additional block may improve predictions because it captures complementary biology, because it changes the effective regularization of the learner, or because it changes which rows and features are usable. These explanations have different implications for deployment. A gain that depends on complete-case filtering, a particular response scale, or a shared source protocol may not survive when the model is moved to another screening resource. Conversely, a small gain that persists under entity-level holdout could be useful even if it does not imply a mechanistic contribution from every included feature.
This distinction also matters for interpreting negative results. A fusion model that fails to improve a compact expression baseline does not show that copy-number or mutation data are irrelevant. It may indicate that the chosen learner, feature budget, imputation rule, or response universe did not convert those measurements into additional predictive accuracy. The appropriate conclusion is consequently conditional: the benchmark estimates incremental value under a declared construction, rather than ranking the biological importance of the assays themselves. We designed the analysis around that narrower estimand.
There are three reasons to be cautious when comparing such results. First, the prediction target can change from continuous viability or IC50 to a binary responder label, making error metrics and biological interpretations non-equivalent [4,5]. Second, random splitting of cell-line–drug pairs can place related observations, or the same cell-line molecular profile, on both sides of a split; this can answer an easier question than prediction for an unseen drug or a new study. Recent work has explicitly identified leakage risks from random tuple splits in drug-response modeling [9]. Third, feature selection and preprocessing performed before validation can leak information from held-out observations even when model fitting itself is separated. These concerns are particularly important in high-dimensional multi-omics data, where dimensionality and preprocessing choices materially affect model behavior [6,7].
Published comparisons therefore leave a practical gap: it remains difficult to tell whether a reported multimodal gain reflects complementary biology, a favorable split, source-specific assay coverage, or preprocessing choices. Cross-study transfer is also less frequently treated as a primary test than within-dataset cross-validation, despite differences in response scales, cell-line coverage, and molecular measurement between screening resources. We address this gap with a deliberately modest benchmark: the same Ridge learner, the same feature budget, fold-local selection from the full raw modality universe, explicit single-modality baselines, drug-held-out evaluation, and leave-one-dataset-out transfer. The aim is not to outperform deep-learning systems, but to estimate the incremental value of adding modalities under a transparent and leakage-controlled comparison.
1.2. Research Questions and Hypotheses
We asked three questions: (Q1) Does feature-level fusion improve prediction when drugs, rather than cell lines alone, are held out? (Q2) Does any improvement transfer when an entire response dataset is held out? (Q3) Are fusion effects accompanied by structured missingness or modality redundancy? We specified the following directional expectations before interpreting the results: H1, fusion may improve drug-held-out prediction relative to expression alone; H2, fusion gains may not transfer across datasets; and H3, missingness and redundancy may vary across source datasets and coincide with unstable fusion effects. These are benchmark hypotheses, not claims of biological causality.
2. Methods
We harmonized DepMap response and molecular data from GDSC1, GDSC2, and CTD2 using release identifiers recorded in the repository manifest. The response variable was the source-provided AUC value; response scales were retained by source and were not interpreted as identical assay measurements. Expression, copy-number, and damaging-mutation features were evaluated separately and in concatenated fusion models. Within each held-out fold, the top 2,000 features per modality were selected from the complete raw feature universe using training rows only. Models used training-fold median imputation, training-fold standardization, and Ridge regression with alpha = 1.0. Drug-held-out splits grouped rows by drug; leave-one-dataset-out folds held out each source dataset in turn. Outer joins were retained for structured missingness analyses.
2.1. Evaluation Scope
The declared evaluation universe contains 15 compounds: five from GDSC1, five from GDSC2, and five from CTD2. This is a declared cross-dataset subset, not the complete drug universe available in any one portal release. The exact compound identifiers, source-specific row counts, and cell-line counts are provided in Supplementary Table S1. Because the datasets do not contain a broad common set of identical compounds, leave-one-dataset-out results measure cross-study transfer rather than same-drug replication.
2.2. Metrics and Interpretation
We report mean absolute error (MAE) and root mean squared error (RMSE). Fusion deltas are defined as fusion RMSE minus expression RMSE; negative values favor fusion and positive values favor expression. Missingness strata are descriptive availability strata, not a replacement for imputation-aware model evaluation. All formal result tables and split manifests are versioned with the workflow.
2.3. Dataset Harmonization and Response Definition
The workflow treats the response table as the analysis backbone and joins molecular features through stable cell-line identifiers. Drug identifiers were normalized within source datasets before defining the declared compound universe. The analysis does not assume that nominally similar compounds across sources are interchangeable. Consequently, source-specific response measurements remain associated with their originating dataset, and leave-one-dataset-out evaluation is interpreted as a domain-transfer test.
2.4. Feature Construction and Leakage Control
Expression, copy-number, and damaging-mutation matrices were processed as separate modality blocks. Feature selection was repeated inside every training fold, using only training-row variance and the declared feature budget. The selected blocks were then imputed and standardized using training-derived quantities before model fitting. Test rows were transformed with those fitted quantities. This ordering prevents response information from the held-out drugs or datasets from influencing feature selection or preprocessing.
2.5. Model Specification and Baselines
Each modality was evaluated as a standalone baseline, and fusion was defined as concatenation of the selected expression, copy-number, and mutation blocks. All models used the same Ridge estimator and alpha value so that the comparison isolates the effect of adding blocks rather than changing the learner. This deliberately conservative design does not claim that Ridge is optimal; it provides a reproducible reference against which more flexible fusion methods can be compared.
This is a fixed-learner fusion ablation rather than a state-of-the-art model comparison. It does not include drug chemical structure, drug-target information, pathway representations, imaging, foundation-model embeddings, or learned modality-completion modules. The design therefore isolates the incremental value of the three cell-line molecular blocks under one transparent model specification.
2.6. Split Manifests and Reproducibility
Five drug-held-out manifests were persisted before model evaluation. Grouped splitting prevents rows from the same drug from appearing in both training and test partitions. The leave-one-dataset-out manifests hold out one complete response source at a time. Result JSON files retain the seed, row counts, selected-feature counts, model label, and error metrics. The supplementary package provides the complete manifest and artifact inventory needed to audit these choices.
2.7. Analysis Sequence and Implementation Controls
The analysis sequence was fixed before interpreting performance: define the 15-compound response universe; normalize dataset and cell-line identifiers; construct outer-joined modality tables for availability auditing; create grouped split manifests; select features using training rows only; fit training-derived imputation and scaling; fit the same Ridge specification for each modality; and calculate held-out MAE and RMSE. No test response values were used for feature ranking, imputation, scaling, or model selection. The formal comparisons therefore estimate the incremental predictive value of concatenating modality blocks under a common pipeline, not the value of a separately tuned learner for each modality.
All formal seeds, selected-feature manifests, row counts, and model metrics are retained as machine-readable artifacts. The clean-environment rerun used the locked dependency specification and regenerated the reported tables and figures. Earlier candidate-table and cell-line-held-out analyses are retained as exploratory history and are not used for the manuscript headline claims.
3. Results
3.1. Drug-Heldout Validation
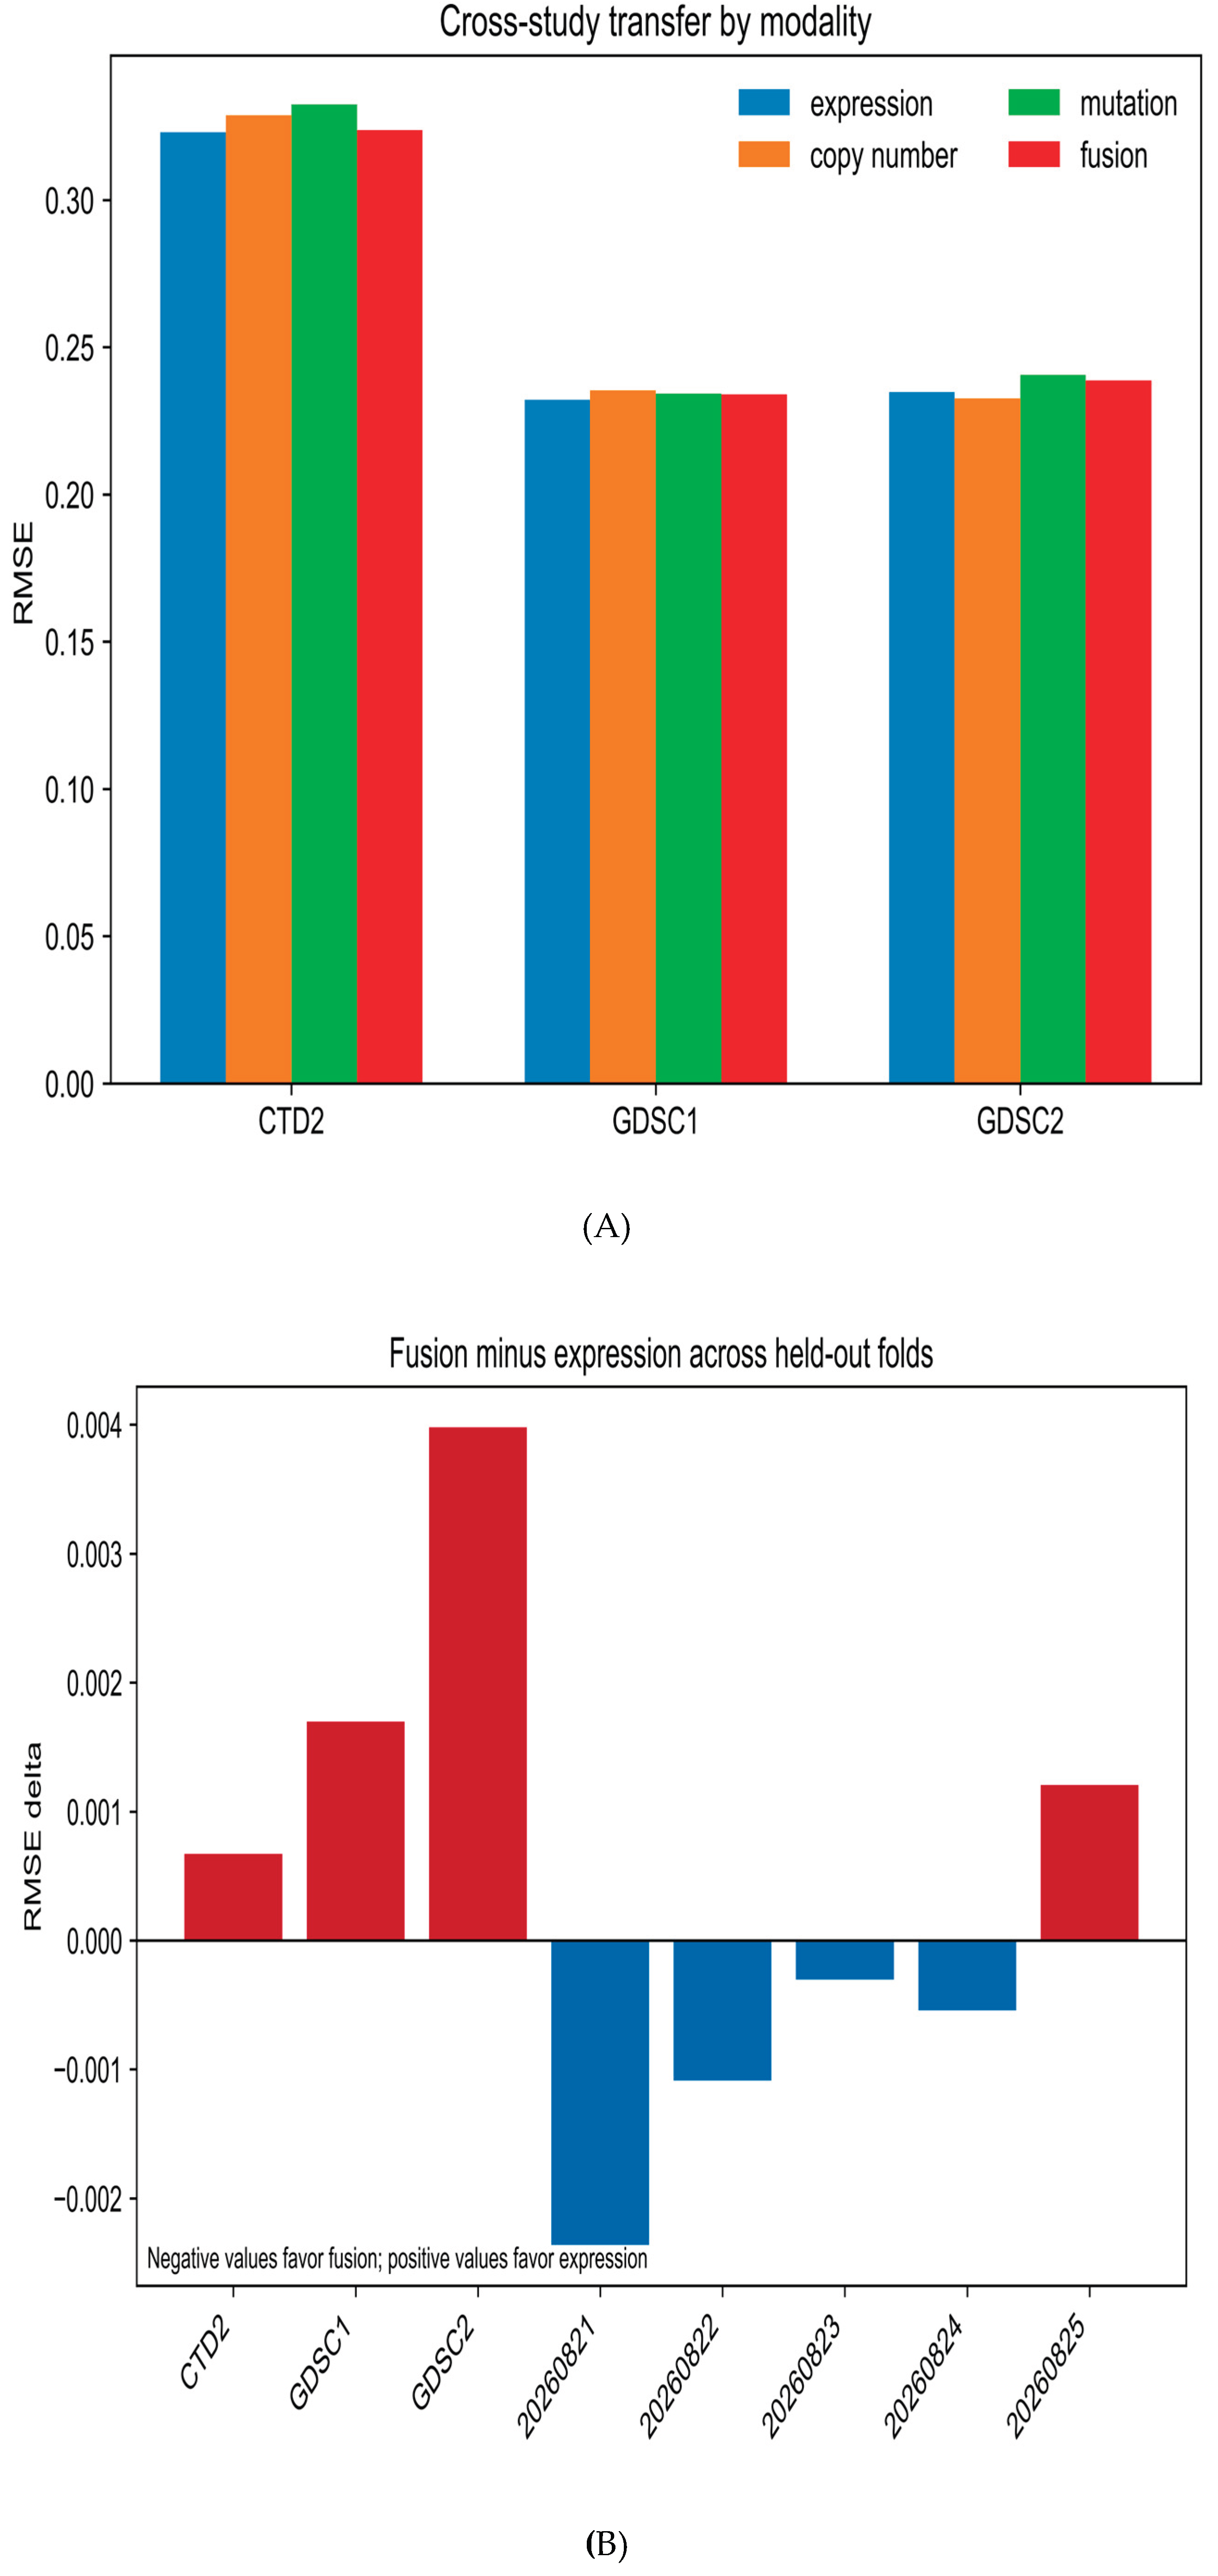
Drug-held-out performance was small and seed-sensitive across five full-universe splits. The mean RMSE across seeds was 0.2322 for fusion versus 0.2328 for expression alone; this arithmetic mean is not a pooled observation-level RMSE and should not be interpreted as a universal gain. Per-seed and per-model values are reported in Table 2 and Supplementary Table S3.
As a secondary diagnostic, a training-set mean-response baseline was worse than expression and fusion in four of five seeds; in the fifth seed it was better than both. A per-drug audit covered eight unique held-out compounds across 15 drug-seed cells; fusion improved RMSE in 11 cells and worsened it in four. Because compounds recur across seeds and only three drugs are held out per split, this audit is descriptive rather than an independent estimate of generalization.
3.2. Cross-Study Transfer
In leave-one-dataset-out validation, expression was consistently stronger than fusion, with the largest fusion degradation on CTD2. These folds test transfer across source datasets, not replication of the same drug. The signed fusion-minus-expression RMSE deltas are shown in Figure 2 and Supplementary Table S4.
The magnitude of the transfer differences should be read together with the source-specific row counts and response construction. The held-out datasets are not interchangeable partitions of one identical experiment: they differ in compound composition, cell-line coverage, assay procedures, and the availability of molecular blocks. Thus, the LOOD comparison asks whether the complete modeling pipeline transfers to a new response source, not whether the same drug effect is reproduced in a second assay. This makes the result a stress test for portability, while also limiting the specificity of any explanation for the observed degradation.
3.3. Missingness and Redundancy
Row-level modality summaries showed weak-to-moderate correlations, while outer-joined tables showed dataset-dependent modality availability. These analyses describe data structure and model behavior; they do not establish that missingness or redundancy caused the observed performance differences.
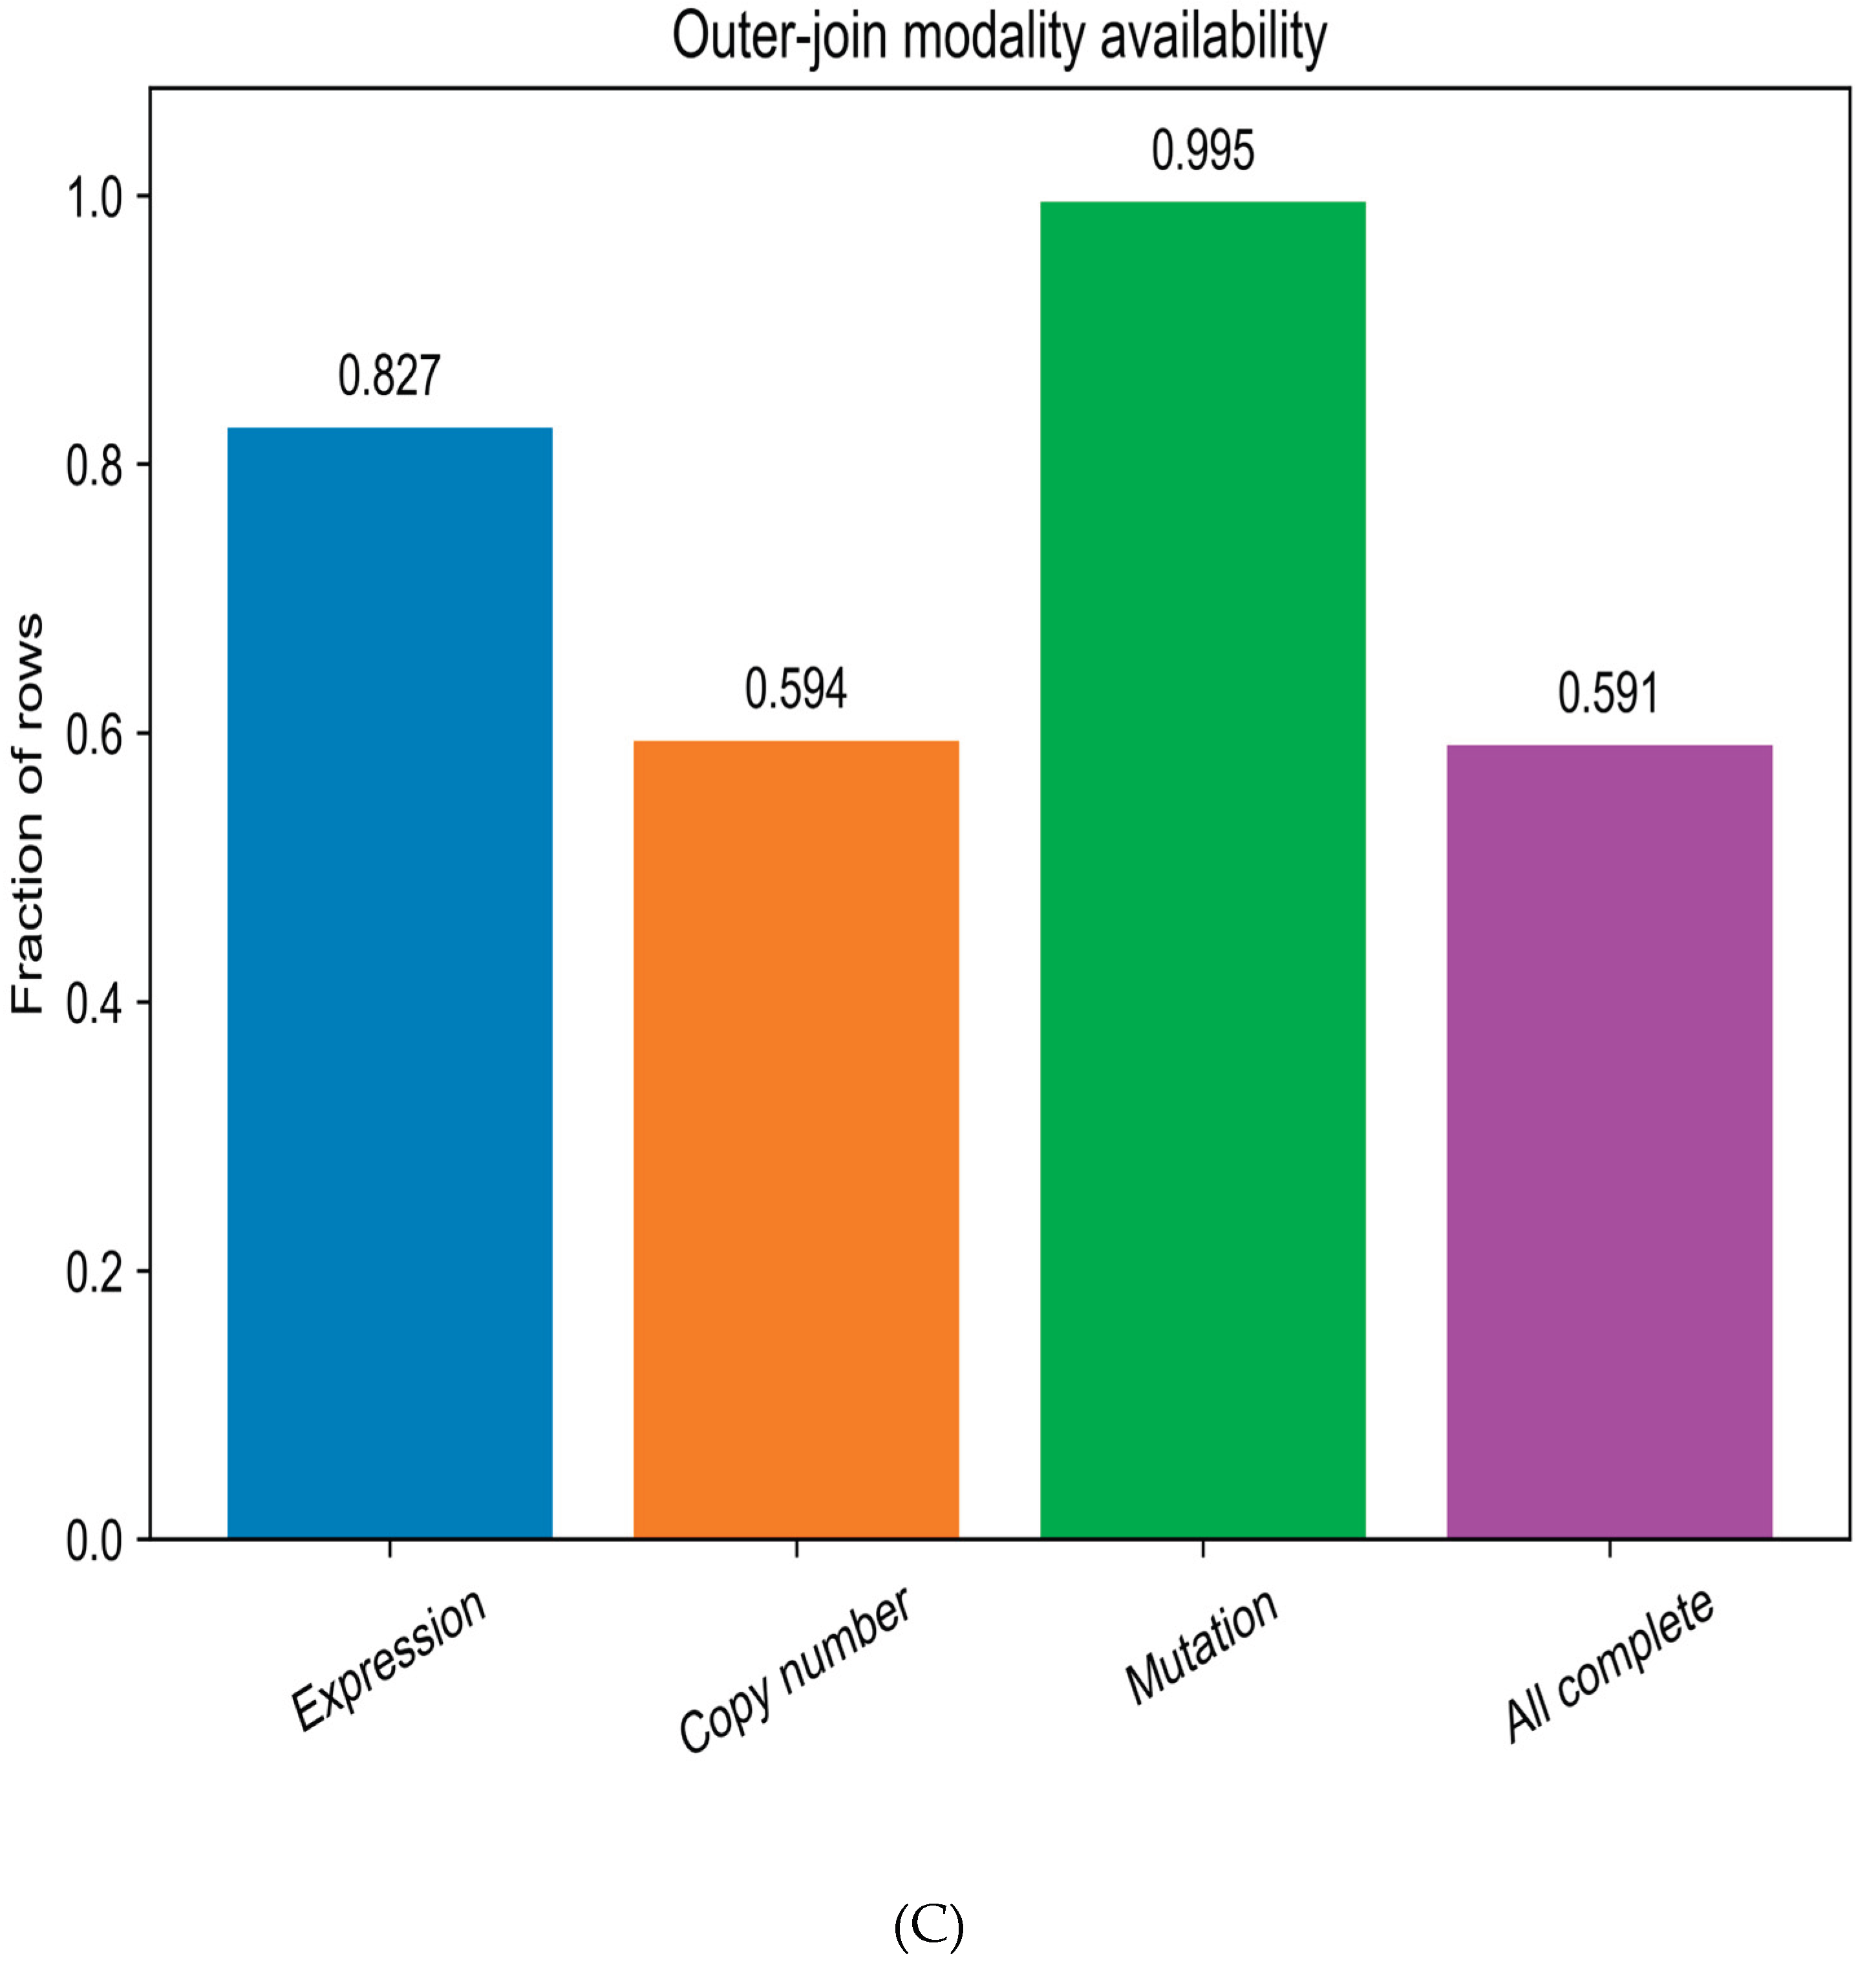
The outer-join audit found mean availability of 0.827 for expression, 0.594 for copy number, and 0.995 for damaging mutation, with 0.591 of rows complete across all three blocks. These values are calculated from the prepared outer-joined tables before fold-specific feature selection. They describe the 15-compound tables and selected cell-line intersection, not complete-case availability of the selected fold-specific 2,000-feature blocks, portal-wide availability, or clinical assay availability. Models retained incomplete rows through training-fold median imputation.

Table 1.
Leave-one-dataset-out RMSE.
| Held-out dataset | Expression | Copy number | Mutation | Fusion |
| CTD2 | 0.3231 | 0.3287 | 0.3325 | 0.3238 |
| GDSC1 | 0.2322 | 0.2353 | 0.2342 | 0.2339 |
| GDSC2 | 0.2347 | 0.2326 | 0.2406 | 0.2387 |
Table 2a.
Declared compounds and response-row counts.
| Dataset | Compound | Response rows |
| CTD2 | AZD-8055 | 779 |
| CTD2 | LEPTOMYCIN B | 786 |
| CTD2 | OUABAIN | 778 |
| CTD2 | SR-II-138A | 781 |
| CTD2 | VINCRISTINE | 782 |
| GDSC1 | ACY-1215 (GDSC1:264) | 889 |
| GDSC1 | AICA RIBONUCLEOTIDE (GDSC1:1001) | 903 |
| GDSC1 | DACOMITINIB (GDSC1:363) | 889 |
| GDSC1 | GSK1059615 (GDSC1:374) | 889 |
| GDSC1 | TENOVIN-6 (GDSC1:342) | 888 |
| GDSC2 | MG-132 (GDSC2:1862) | 938 |
| GDSC2 | MK-2206 (GDSC2:1053) | 937 |
| GDSC2 | NAVITOCLAX (GDSC2:1011) | 937 |
| GDSC2 | PICTILISIB (GDSC2:1058) | 936 |
| GDSC2 | STAUROSPORINE (GDSC2:1034) | 938 |
Table 2.
Drug-held-out repeated-seed RMSE.
| Seed | Expression | Fusion | Fusion delta |
| 20260821 | 0.1696 | 0.1672 | -0.0024 |
| 20260822 | 0.2538 | 0.2527 | -0.0011 |
| 20260823 | 0.2329 | 0.2326 | -0.0003 |
| 20260824 | 0.2299 | 0.2294 | -0.0005 |
| 20260825 | 0.2776 | 0.2788 | +0.0012 |
Table 3.
Drug-held-out MAE and RMSE by model and seed.
| Seed | Model | MAE | RMSE | Selected features |
| 20260821 | expression | 0.1398 | 0.1696 | 2000 |
| 20260821 | copy_number | 0.1483 | 0.1786 | 2000 |
| 20260821 | mutation | 0.1374 | 0.1674 | 2000 |
| 20260821 | fusion | 0.1370 | 0.1672 | 6000 |
| 20260822 | expression | 0.2226 | 0.2538 | 2000 |
| 20260822 | copy_number | 0.2319 | 0.2620 | 2000 |
| 20260822 | mutation | 0.2208 | 0.2529 | 2000 |
| 20260822 | fusion | 0.2206 | 0.2527 | 6000 |
| 20260823 | expression | 0.1913 | 0.2329 | 2000 |
| 20260823 | copy_number | 0.1939 | 0.2332 | 2000 |
| 20260823 | mutation | 0.1904 | 0.2325 | 2000 |
| 20260823 | fusion | 0.1902 | 0.2326 | 6000 |
| 20260824 | expression | 0.1955 | 0.2299 | 2000 |
| 20260824 | copy_number | 0.1991 | 0.2313 | 2000 |
| 20260824 | mutation | 0.1937 | 0.2293 | 2000 |
| 20260824 | fusion | 0.1937 | 0.2294 | 6000 |
| 20260825 | expression | 0.2396 | 0.2776 | 2000 |
| 20260825 | copy_number | 0.2349 | 0.2699 | 2000 |
| 20260825 | mutation | 0.2395 | 0.2787 | 2000 |
| 20260825 | fusion | 0.2397 | 0.2788 | 6000 |
Table 4.
Leave-one-dataset-out MAE, RMSE, and evaluation strata.
| Held-out dataset | Model | Train rows | Test rows | MAE | RMSE |
| CTD2 | expression | 9144 | 3906 | 0.2745 | 0.3231 |
| CTD2 | copy_number | 9144 | 3906 | 0.2779 | 0.3287 |
| CTD2 | mutation | 9144 | 3906 | 0.2803 | 0.3325 |
| CTD2 | fusion | 9144 | 3906 | 0.2744 | 0.3238 |
| GDSC1 | expression | 8592 | 4458 | 0.1961 | 0.2322 |
| GDSC1 | copy_number | 8592 | 4458 | 0.2015 | 0.2353 |
| GDSC1 | mutation | 8592 | 4458 | 0.1966 | 0.2342 |
| GDSC1 | fusion | 8592 | 4458 | 0.1963 | 0.2339 |
| GDSC2 | expression | 8364 | 4686 | 0.1973 | 0.2347 |
| GDSC2 | copy_number | 8364 | 4686 | 0.1980 | 0.2326 |
| GDSC2 | mutation | 8364 | 4686 | 0.2000 | 0.2406 |
| GDSC2 | fusion | 8364 | 4686 | 0.1986 | 0.2387 |
Figure 1.
Leave-one-dataset-out performance.
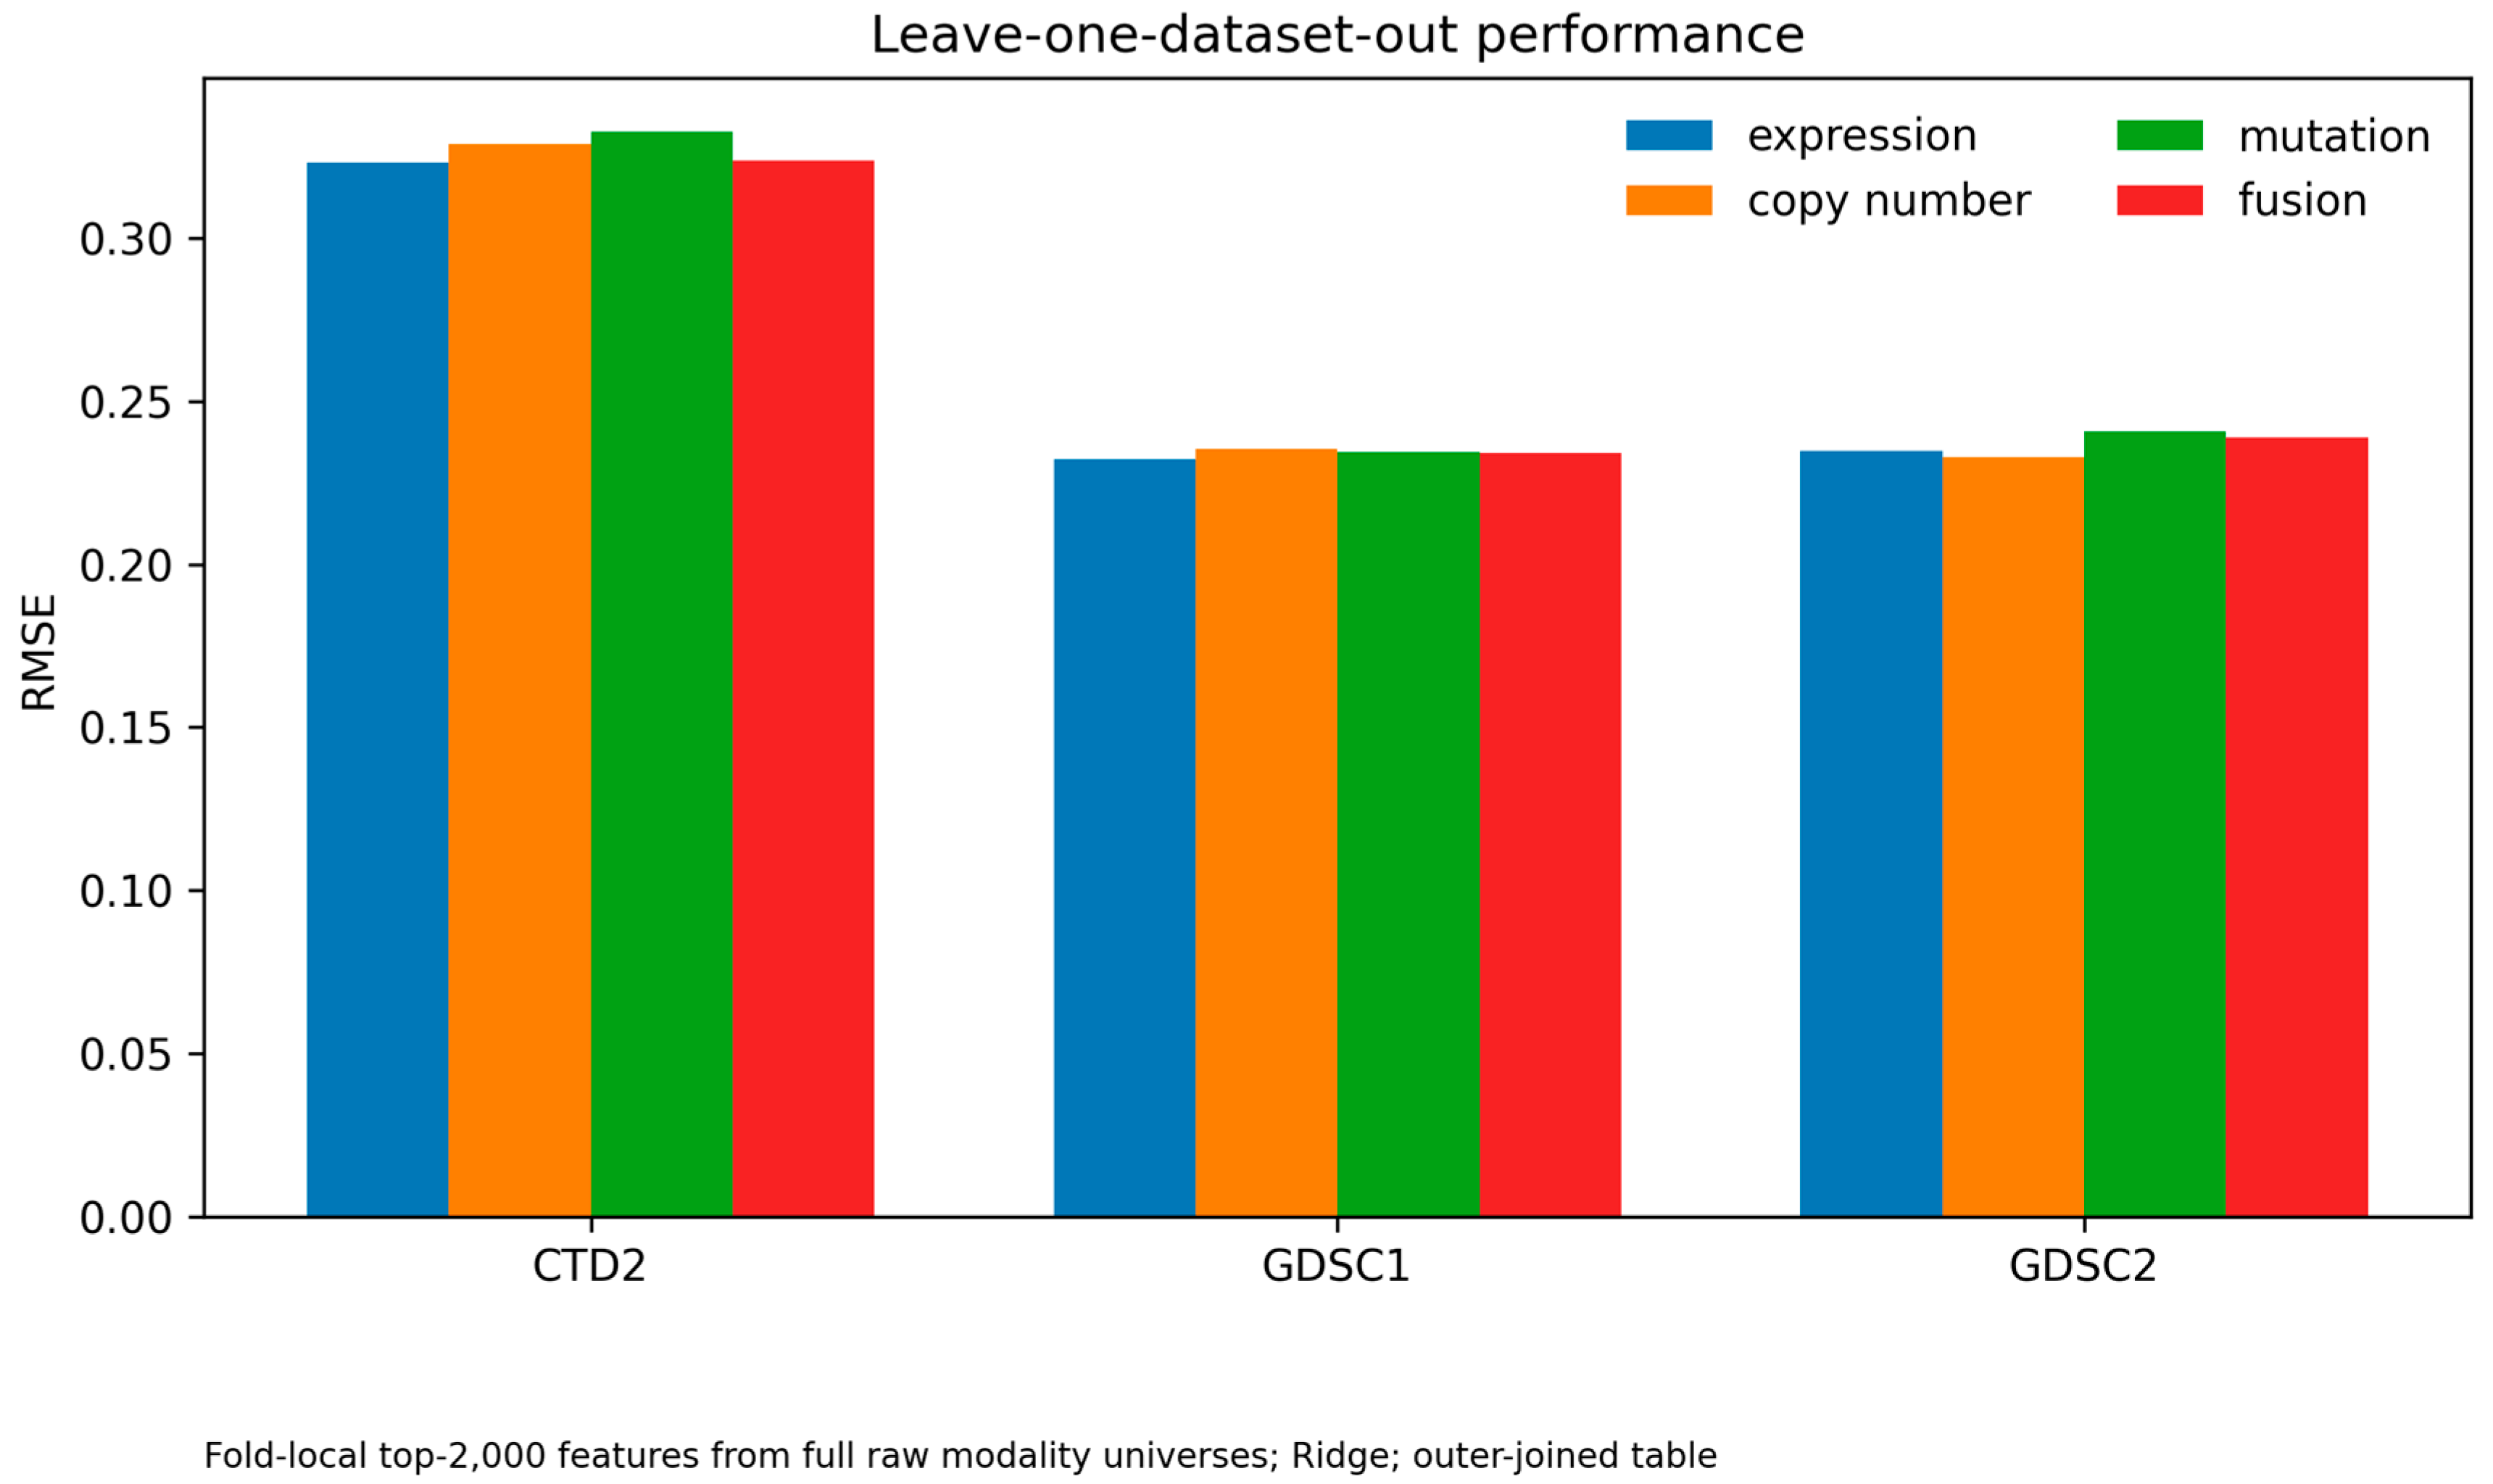
Figure 2.
Modality conflict and fusion-minus-expression error differences.
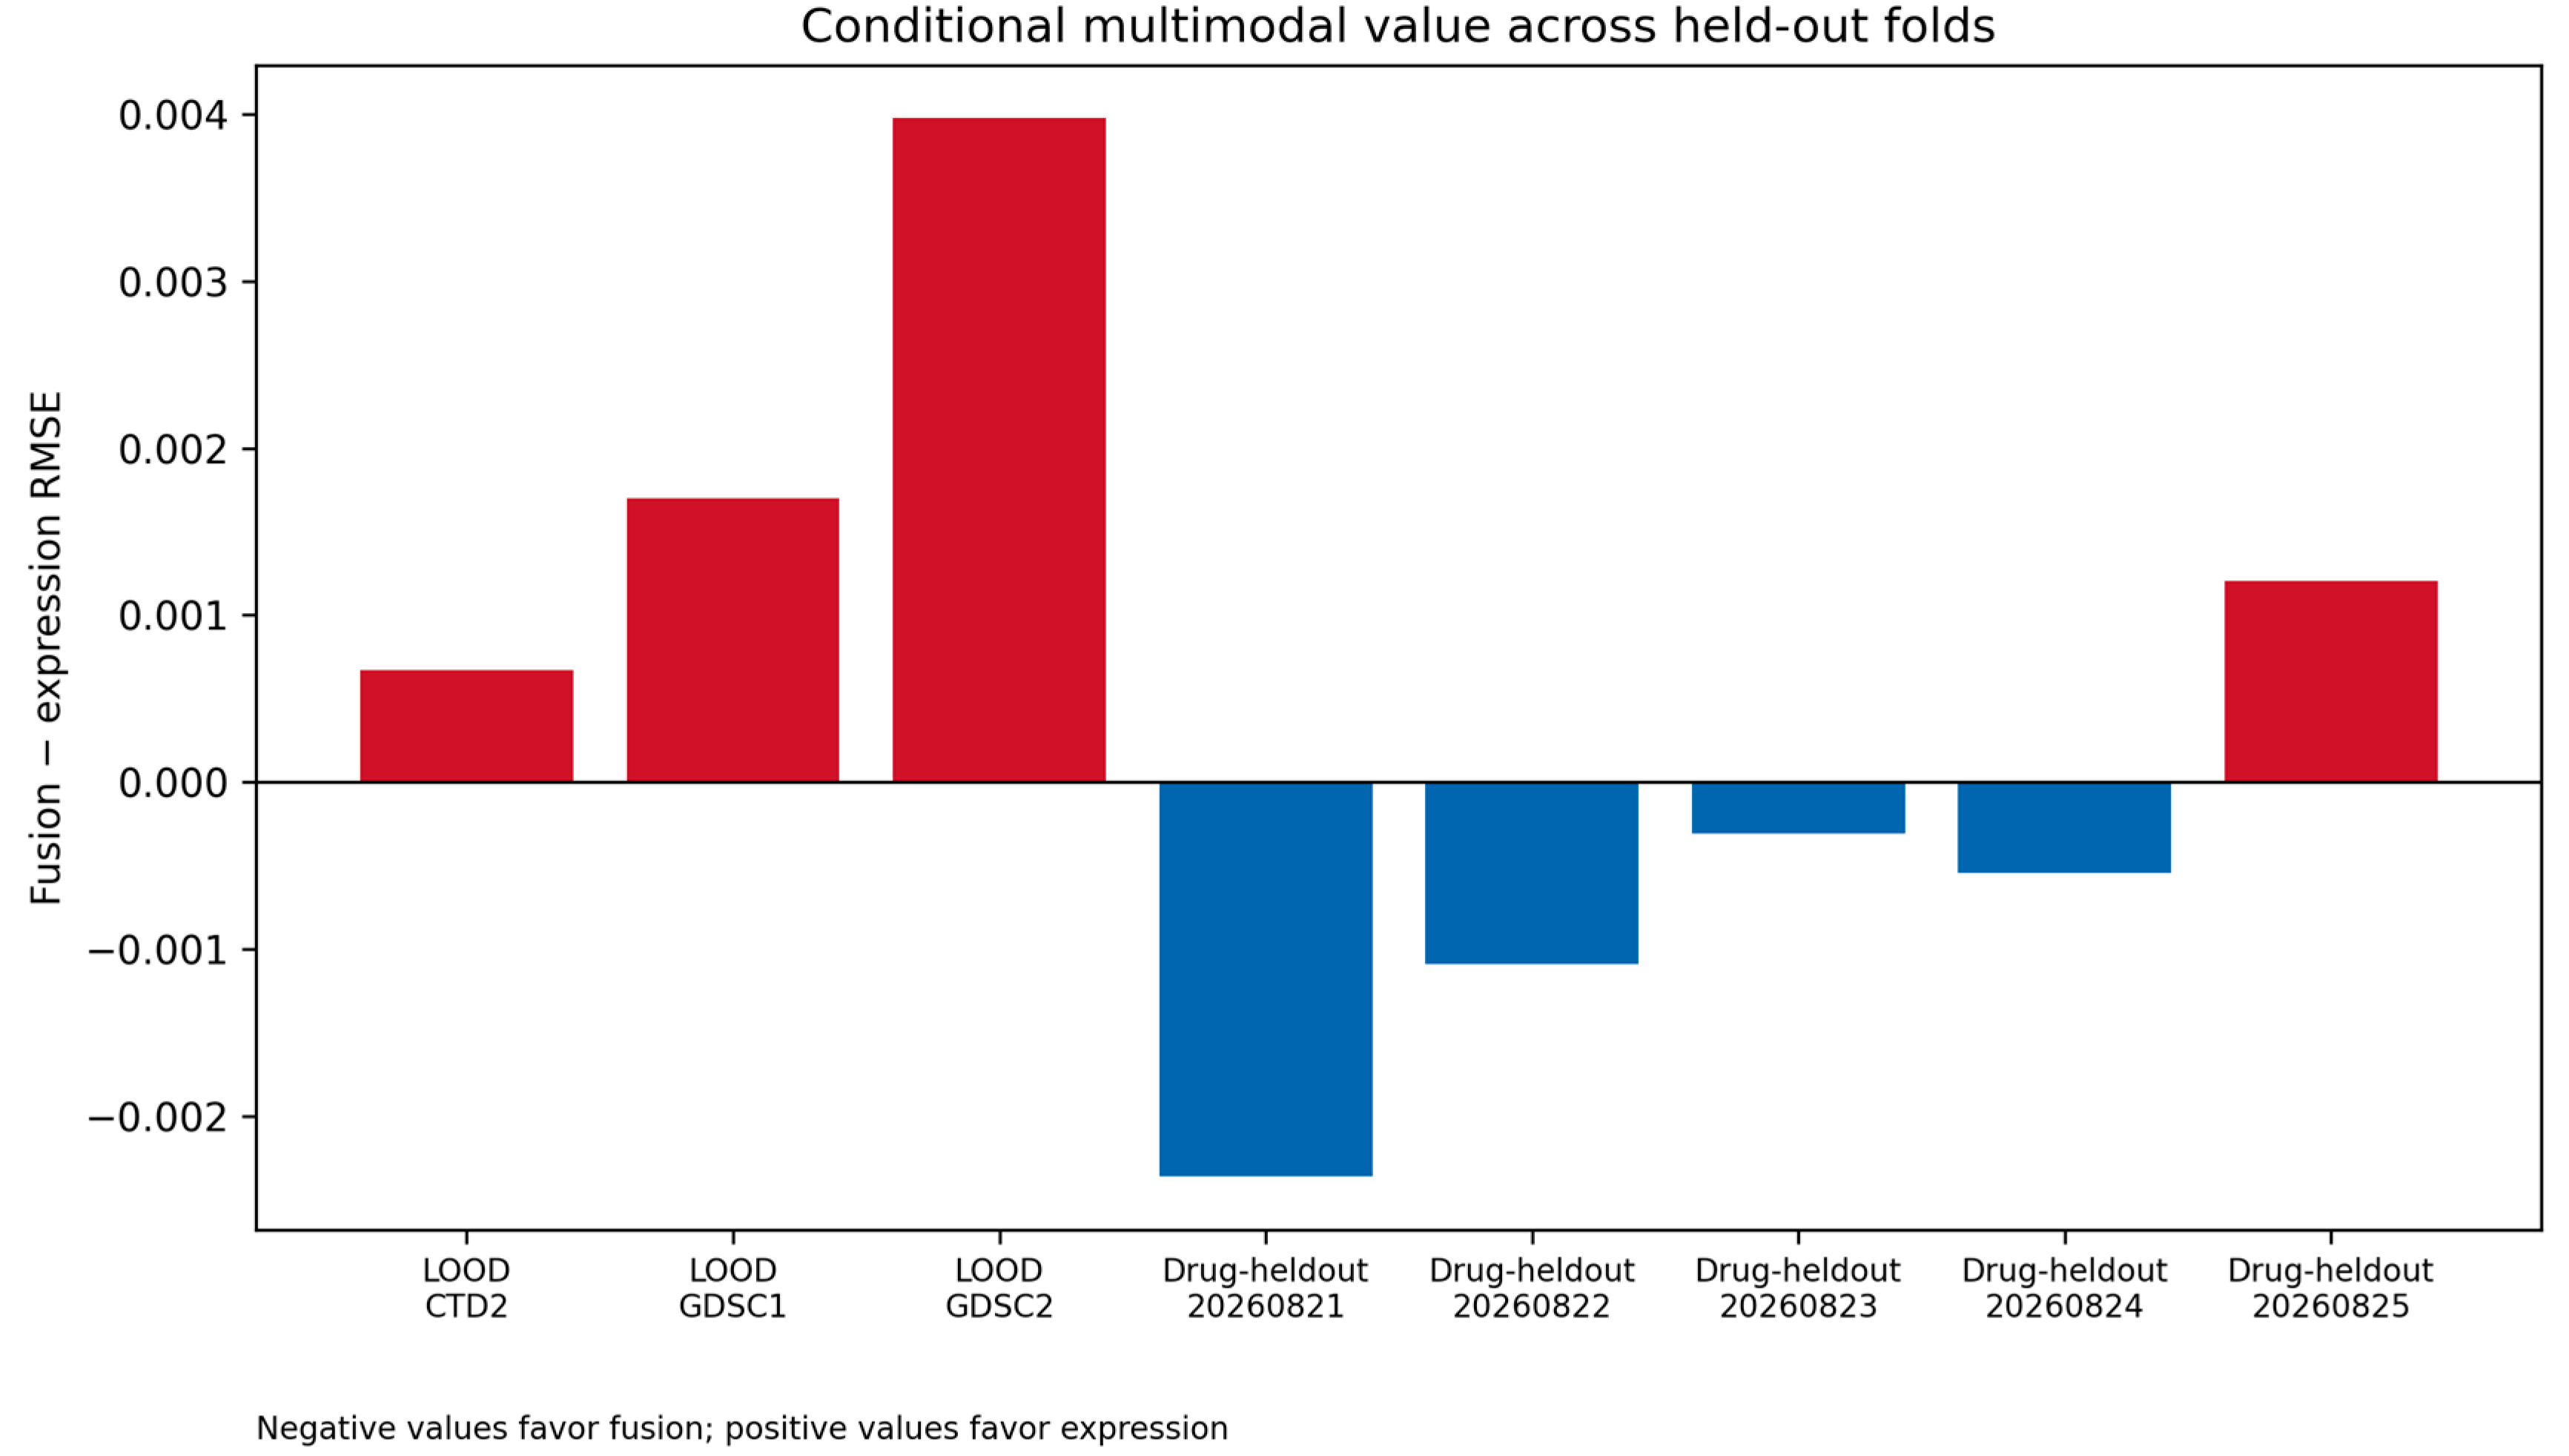
Figure 3.
(A) Cross-study transfer by modality. (B) Fusion-minus-expression RMSE by held-out split. (C) Outer-join modality availability.
Figure 3.
(A) Cross-study transfer by modality. (B) Fusion-minus-expression RMSE by held-out split. (C) Outer-join modality availability.
4. Discussion
The results do not support a universal multimodal advantage. Fusion can help within a drug-held-out universe yet fail under study transfer, consistent with domain-specific response scales, assay coverage, and feature distributions. This pattern is compatible with prior reports that multimodal integration can improve prediction under particular data and validation settings [5,8], while benchmarking work shows variation across algorithms, drugs, and transfer targets [9,10]. Our controlled comparison adds a more modest observation: the incremental fusion effect is small within the declared drug-held-out benchmark and reverses direction under source-dataset transfer. This does not refute multimodal modeling; it shows why a gain observed in one validation regime should not be generalized to another without direct testing. The study is limited by the small declared 15-drug universe, limited same-drug overlap across datasets, and the use of compact Ridge baselines rather than a broad model class.
H1 was only partially supported: fusion improved the mean across five drug-held-out seeds, but the sign was favorable in three seeds and unfavorable in two. H2 was supported in this evaluation: fusion degraded performance in all three leave-one-dataset-out folds. H3 was supported descriptively because modality availability and row-level correlations differed across source tables, but the study does not identify a causal explanation. These findings argue for reporting effect size and transfer failures alongside the direction of the fusion comparison.
The methodological implication is that validation design is part of the scientific claim. A random cell-line–drug split can estimate interpolation within an existing response system, whereas a drug-held-out split asks whether molecular features support prediction for compounds not represented in training. A leave-one-dataset-out split adds a different stress test: it asks whether the learned relationship survives a change in source, assay, and coverage. These estimands should not be conflated. Our study uses them sequentially to show that the answer to ‘does fusion help?’ depends on which generalization target is intended.
For early drug discovery and biomarker prioritization, the practical implication is a decision-support role rather than an autonomous selection rule. Expression-only models may be preferable when they provide similar accuracy with broader availability and lower maintenance burden; additional modalities should be retained when they yield reproducible gains for a clearly defined use case. The present analysis does not test prospective compound prioritization, biomarker clinical validity, manufacturing decisions, or patient treatment selection, so these implications remain hypotheses for future validation.
The small size of the observed within-universe effect is itself informative for model development. The mean difference is much smaller than the variation in absolute RMSE across seeds, and the direction changes in two of five comparisons. This pattern does not justify selecting fusion solely because its arithmetic mean is lower. A reasonable decision rule would also consider the cost of obtaining and maintaining the extra modalities, the completeness of those modalities in the intended population, and whether the improvement is reproduced under a declared external test. Under the present evidence, expression remains a competitive reference and fusion is best treated as a candidate extension requiring further validation.
The analysis also suggests a reproducibility principle for future information-fusion studies: preserve the split manifests and the feature-selection scope as first-class artifacts. Without them, a later rerun can silently change the estimand while retaining the same model name and headline metric. Reporting the sign of each fold-level delta, rather than only an aggregate score, makes such changes easier to detect. This is particularly important when the expected effect is small, as in the present benchmark.
4.1. Interpretation of the Within-Dataset Result
The drug-held-out result is compatible with a limited benefit from complementary features when the training and test rows share a source-defined response system. Fusion improved the mean across five seeds, but only three of five seed-level comparisons favored fusion and the effect sizes were small relative to the absolute error. We therefore describe this result as uncertain, conditional evidence that fusion can be useful under a matched evaluation regime, not as evidence that fusion should replace a strong single-modality baseline.
4.2. Interpretation of Cross-Study Degradation
The consistent cross-study degradation is the most important cautionary result. It may reflect differences in assay design, response scaling, compound composition, cell-line coverage, molecular measurement, or feature distributions. The present benchmark does not separate these explanations. It does show that a model selected for within-universe performance can lose accuracy when the response source changes, which makes transfer validation necessary for claims about general-purpose multimodal prediction.
4.3. Missingness, Redundancy, and Model Choice
The outer-join analysis shows that the usable intersection of modalities differs by dataset. A complete-case fusion analysis can therefore change the population being evaluated before any model is fitted. Conversely, median imputation preserves rows but may weaken modality-specific structure. The current analysis reports both availability and model performance, but it does not compare missingness-aware architectures, learned imputation, modality dropout, or late-fusion weighting. Those are appropriate follow-up tests rather than conclusions supported here.
4.4. Relation to Prior Multimodal Work
The findings do not contradict prior reports that multimodal integration can improve drug-response prediction under particular data and validation settings [4,5,6,8]. Recent reviews and benchmarking frameworks further emphasize drug representations, missing-modality handling, broader metric sets, and clinically relevant validation designs [11,12,13]. Instead, they emphasize that the reported gain is inseparable from the response universe, split strategy, preprocessing, and transfer target. The distinction is especially relevant when a study combines data sources that differ in coverage or measurement. A fair comparison should therefore report the single-modality baseline, fold-local processing, held-out entities, and the direction and size of the fusion delta. In practical terms, a multimodal model should be retained only when its incremental accuracy is large enough, stable enough, and transferable enough to justify the added data requirements.
4.5. Limitations and Next Experiments
The principal limitations are the 15-compound evaluation universe, the limited overlap of identical drugs across datasets, the use of a fixed Ridge model, the descriptive per-drug audit with eight unique held-out compounds across repeated seed-specific cells, and the absence of prospective experimental validation. The modality set also excludes potentially informative assays such as proteomics, methylation, drug chemical structure, and lineage-aware representations. We report RMSE and MAE but do not provide a complete ranking-oriented evaluation using Pearson or Spearman correlation, and we do not test chemical-scaffold separation between training and held-out drugs. Source-specific AUC scales were retained rather than harmonized, so LOOD error magnitudes should not be read as directly comparable biological difficulty across datasets. No patient, organoid, PDX, or prospective external cohort was evaluated. Future work should enlarge the common-drug benchmark, compare response harmonization strategies, evaluate modality dropout and missingness-aware models, and predefine an external test set before model selection. These steps would test whether the observed transfer failure is specific to the current construction or a broader property of multimodal pharmacogenomics.
5. Conclusions
In this small, declared DepMap benchmark, adding copy-number and mutation blocks to expression produced a small mean improvement in drug-held-out prediction, but the direction changed across repeated splits and the improvement did not transfer to any of the three held-out source datasets. The result is therefore conditional rather than universal. The practical contribution is a reproducible comparison framework that makes the held-out entity, fold-local feature selection, structured availability, and transfer target explicit. Larger common-drug universes, external test sets, missingness-aware models, and alternative learners are needed before deciding whether the observed pattern generalizes beyond this Ridge-based construction.
Supplementary Materials
The following supporting information can be downloaded at the website of this paper posted on Preprints.org.
Funding
No external funding.
Institutional Review Board Statement
Ethics approval is not applicable because the study uses publicly available, de-identified cell-line and molecular datasets and involves no human participants, patient intervention, or animal experimentation.
Use of Generative AI tools: Assisted with language editing, document formatting, and coding under author review; the author verified the final content. DepMap/GDSC/CTD2 files were obtained under the provider’s applicable terms; raw provider files are not redistributed.
Data Availability Statement
Code, manifests, derived result summaries, figures, and reproducibility notes are provided in the project repository. Raw DepMap files must be obtained from the provider under the applicable terms; see the public-data access note. The repository does not redistribute raw molecular matrices.
Conflicts of Interest
The author declares no competing interests.
Appendix A. Reproducibility and Reporting Specification
This appendix makes explicit the decisions that determine the benchmark’s estimand. It is included so that a future implementation can reproduce the same comparison without inferring choices from code or from the headline results. The appendix is procedural: it does not add new biological claims.
A.1. Analysis Sequence
The analysis sequence is: (i) identify the declared response rows and source dataset; (ii) normalize identifiers and join modality matrices; (iii) create grouped split manifests; (iv) fit all preprocessing steps on training rows; (v) select the feature budget separately within each modality; (vi) transform training and test rows; (vii) fit the same Ridge specification for each modality and fusion; (viii) calculate MAE and RMSE on the held-out response rows; and (ix) write metrics, row counts, and manifest identifiers to machine-readable result files. The order is part of the method and should not be changed when comparing extensions.
Table A1.
Reproducibility controls and their purpose.
| Control | Implementation | Reason |
| Drug grouping | GroupShuffleSplit by drug_id_raw | Prevents the same drug response group crossing train/test |
| Feature selection | Top 2,000 per modality inside training fold | Prevents test-informed feature ranking |
| Imputation | Training-fold median applied to test rows | Avoids test-derived preprocessing parameters |
| Scaling | Training-fold standardization | Places feature blocks on a common fitted scale |
| Learner | Ridge, alpha = 1.0 for every block | Keeps the model comparison controlled |
| Primary metrics | MAE and RMSE | Reports typical and squared-error sensitivity |
| Transfer test | Hold out one full source dataset | Measures domain transfer rather than same-drug replication |
A.2. Estimands and Comparison Rules
The primary within-universe estimand is the change in held-out response error produced by concatenating the three modality blocks relative to expression alone under the same drug-grouped split. The primary transfer estimand is the analogous change when the response source is held out in full. A negative fusion-minus-expression RMSE indicates lower error for fusion; a positive value indicates lower error for expression. No statistical significance claim is made from the five seeds or three transfer folds, because these are repeated benchmark partitions rather than independent biological experiments.
A.3. Missingness and Availability Audit
Availability was audited before interpreting fusion results. For each source table, the audit records the number of rows with each modality available, the number complete across all selected blocks, and the number requiring imputation. Outer joins are used for this audit because an inner join can conceal the extent of modality-specific attrition. These counts characterize the constructed analysis table; they are not estimates of missingness in all DepMap data.
Table A2.
Interpretation guardrails for the reported evidence.
| Observed result | Permitted interpretation | Not supported |
| Fusion improves in 3 of 5 drug-held-out seeds | Small conditional improvement under this benchmark | Universal multimodal superiority |
| Fusion worsens all 3 LOOD folds | Transfer failure in these source-held-out folds | Proof of a biological incompatibility |
| Availability differs by dataset | Data structure is source-dependent | Missingness caused the error difference |
| Modality correlations are weak-to-moderate | Some redundancy and complementarity coexist | A causal redundancy mechanism |
| Ridge is reproducible and controlled | A transparent reference baseline | The best possible learner |
| 15 compounds are declared | Results are bounded to the declared universe | Generalization to all compounds |
A.4. Recommended Extensions
The next validation layer should preserve the current manifests while adding a larger common-drug universe and a completely external test partition. Candidate model extensions include late fusion with modality-specific regularization, modality dropout during training, explicit missingness indicators, and domain adaptation. Each extension should retain expression-only and single-modality baselines, report the same error metrics, and separate model selection from final evaluation. This will allow improvements in architecture to be distinguished from improvements caused by a more favorable split or response harmonization.
A.5. Minimum Reporting Checklist for Future Comparisons
For comparability, future benchmark reports should identify the data release, response scale, compound inclusion rule, cell-line identifier rule, modality availability rule, feature-selection scope, imputation scope, split grouping variable, number of repeated seeds, model-selection procedure, primary baseline, primary metric, and external-transfer target. They should also report the number of rows entering each fold and the number excluded or imputed. These fields are more informative for interpretation than a single pooled accuracy value.
Table A3.
Minimum fields to preserve with each future result table.
| Field | Required record |
| Data provenance | Provider, release label, download date, checksum |
| Population | Dataset, compound list, cell-line identifier, row count |
| Preprocessing | Imputation, scaling, filtering, feature-selection order |
| Validation | Split type, grouping unit, seed, train/test counts |
| Model | Modality, learner, hyperparameters, feature count |
| Performance | MAE, RMSE, delta to expression baseline |
| Availability | Complete rows, modality-specific availability, missing rows |
| Interpretation | Transfer target, limitations, and whether claims are causal |
References
- Barretina, J.; et al. The Cancer Cell Line Encyclopedia enables predictive modelling of anticancer drug sensitivity. Nature 2012, 483, 603–607. [Google Scholar] [CrossRef] [PubMed]
- Iorio, F.; et al. A landscape of pharmacogenomic interactions in cancer. Cell 2016, 166, 740–754. [Google Scholar] [CrossRef] [PubMed]
- Tsherniak, A.; et al. Defining a cancer dependency map. Cell 2017, 170, 564–576.e16. [Google Scholar] [CrossRef] [PubMed]
- Azuaje, F. Computational models for predicting drug responses in cancer research. Brief. Bioinform. 2017, 18, 820–829. [Google Scholar] [CrossRef] [PubMed]
- Sharifi-Noghabi, H.; et al. MOLI: multi-omics late integration with deep neural networks for drug response prediction. Bioinformatics 2019, 35, i501–i509. [Google Scholar] [CrossRef] [PubMed]
- Cai, Z.; et al. Machine learning for multi-omics data integration in cancer. iScience 2022, 25, 103798. [Google Scholar] [CrossRef] [PubMed]
- DepMap. How should I cite DepMap data? DepMap Portal Updated. 2025. [Google Scholar] [CrossRef] [PubMed]
- Kuenzi, B.M.; et al. Predicting drug response and synergy using a deep learning model of human cancer cells. Cancer Cell 2020, 38, 672–684.e6. [Google Scholar] [CrossRef] [PubMed]
- Chawla, S.; Rockstroh, A.; Lehman, M.; et al. Gene expression based inference of cancer drug sensitivity. Nat. Commun. 2022, 13, 5680. [Google Scholar] [CrossRef] [PubMed]
- Baptista, D.; Ferreira, P.G.; Rocha, M. Deep learning for drug response prediction in cancer. Brief. Bioinform. 2023, 24, bbac605. [Google Scholar] [CrossRef] [PubMed]
- Gouru, G. Precision oncology: Computational methods for multi-omics data integration to improve drug response prediction. Camb. Prism. Precis Med. 2025, 3, e6. [Google Scholar] [CrossRef] [PubMed]
- Li, D.; et al. Multi-omics modality completion and knowledge distillation for drug response prediction in cervical cancer. Front Oncol. 2025, 15, 1622600. [Google Scholar] [CrossRef] [PubMed]
- Del Real, K.S.; et al. Foundation models and deep learning for cancer drug response prediction: a framework for data, metrics, and validation. Brief. Bioinform. 2026, 27, bbag225. [Google Scholar] [CrossRef] [PubMed]
Disclaimer/Publisher’s Note: The statements, opinions and data contained in all publications are solely those of the individual author(s) and contributor(s) and not of MDPI and/or the editor(s). MDPI and/or the editor(s) disclaim responsibility for any injury to people or property resulting from any ideas, methods, instructions or products referred to in the content. |
© 2026 by the authors. Licensee MDPI, Basel, Switzerland. This article is an open access article distributed under the terms and conditions of the Creative Commons Attribution (CC BY) license (http://creativecommons.org/licenses/by/4.0/).
Copyright: This open access article is published under a Creative Commons CC BY 4.0 license, which permit the free download, distribution, and reuse, provided that the author and preprint are cited in any reuse.