

Submitted:
09 September 2026
Posted:
09 September 2026
You are already at the latest version
Abstract
Wood-fired ovens used in pizzerias represent a potential source of air pollution, particularly in urban areas where they are most concentrated. The combination of wood combustion and cooking operations is a distinctive feature of these appliances and results in a unique emission profile. Local emission inventories indicate that restaurants and pizzerias with wood-fired ovens have a non-negligible contribution to the emission of several air pollutants, especially particulate matter and polycyclic aromatic hydrocarbons. This study presents an integrated framework combining data-driven source identification, experimentally measured emission factors, atmospheric dispersion modelling, and air-quality observations to assess the impact of wood-fired pizza ovens in the urban context of Milan (Italy). To validate and strengthen the robustness of the modelling framework, analogous simulations were also performed for road traffic and heating systems, representing the major urban emission sources, and compared with measurements from the ARPA Lombardia monitoring network. Results showed that wood-fired oven emissions are concentrated in the city center and can contribute appreciably to local primary particulate matter concentrations (0.085 – 3.34 µg m−3 PM10). While their contribution to NOx concentrations is limited (0.0044 - 1.75 µg m−3), simulations indicated a measurable influence on biomass-burning tracers, including levoglucosan (19.70 - 34.28%) and benzo(a)pyrene (34.95 - 37.47%). Overall, wood-fired pizza ovens are not a dominant source of urban air pollution but represent a relevant local contributor to particulate matter and combustion-related tracers.

Keywords:
wood-fired pizza ovens
; emissions
; air quality
; atmospheric concentrations
; AI
; urban environment
; data-science
1. Introduction
Urban air quality remains a critical environmental and public health issue, particularly in densely populated metropolitan areas where a complex mixture of emission sources contributes to atmospheric pollution [1,2]. While major ones such as traffic and residential heating have been extensively investigated [3], comparatively less attention has been devoted to small-scale commercial activities that may collectively contribute locally to air pollution. Among these, wood-fired ovens used in pizzerias represent a potentially relevant source in urban centers [4], where they are both highly concentrated and largely unregulated in terms of emissions.
Previous experimental studies have demonstrated that wood-fired ovens contribute to the emissions of several major air pollutants, especially fine particulate matter (PM2.5) [5], polycyclic aromatic hydrocarbons (PAHs) [4], and black carbon [6]. In addition, these appliances emit well-known tracers of biomass combustion, such as benzo(a)pyrene (BaP) [4] and levoglucosan (LG) [7], which are widely used to identify and apportion biomass combustion sources in atmospheric studies [8,9]. The emission factors outlined in Bergomi et al. [4] have been applied in local emission inventories, which estimate contributions in urban areas of around 5% for PM10 and more than 30% for selected PAHs [10]. However, the integration of such emission factors into urban-scale air quality assessments remains limited, mainly due to the lack of high-resolution spatial data on the distribution of these activities.
Recent advances in data science and geospatial analysis provide new opportunities to overcome these limitations by enabling the identification and mapping of sources, such as wood-fired ovens used in pizzerias, which are typically difficult to locate due to the absence of dedicated registries or official databases. In this context, the present study leverages data-driven and artificial intelligence techniques to reconstruct a geolocation dataset of facilities employing wood-fired ovens across the Municipality of Milan. This information is then combined with experimentally derived emission factors for wood-fired ovens [4] to perform a detailed assessment of their impact on urban air quality, including the dispersion of biomass-burning tracers, which may improve source attribution in urban environments.
Specifically, a Lagrangian puff dispersion modelling approach was adopted using the CALPUFF modelling system, driven by meteorological data obtained from the WRF (Weather Research and Forecasting) model. While CALPUFF is commonly used for source-specific and multi-source air quality assessments, applications involving a very large number of distributed emitters often become computationally demanding [11]. To overcome this limitation, the present work employs a hybrid modelling framework in which a reference concentration field generated by CALPUFF is linearly combined according to the location and emission strengths of each source. This approach exploits the linearity of dispersion processes for primary pollutants and enables the efficient estimation of cumulative concentration fields from many emitters while preserving the atmospheric transport and dispersion patterns reproduced by the original model.
Similar source-superposition principles and reduced-complexity approaches have been exploited in previous studies to support urban air-quality assessment and scenario analysis while reducing computational requirements [11,12]. However, previous reduced-complexity applications generally relied on urban background or city-increment estimates derived from measurements at air quality monitoring stations. While effective for improving the representation of urban concentration gradients, such approaches do not explicitly account for the combined effects of the spatiotemporal variability of emissions and meteorological conditions on pollutant accumulation and transport. In contrast, the framework proposed in this study performs continuous simulations throughout the entire year and dynamically represents the contribution of multiple source categories without relying on monitoring-derived background concentrations.
Moreover, the new EU Ambient Air Quality Directive (EU 2024/2881) [13] significantly strengthens the role of air quality modelling and points towards the use of high-resolution urban assessments, including microscale applications in areas characterized by pollution hotspots and strong spatial concentration gradients [13]. The Directive places modelling at the core of air quality assessment, requiring Member States to combine monitoring, indicative measurements and modelling tools in a more integrated way. It also emphasizes the need for assessments that can adequately capture population exposure, particularly in locations where pollutant concentrations may vary significantly over short distances.
The framework developed in this study enabled the simulation of pollutant dispersion at a high spatial resolution, with a specific focus on the pollutants of greatest concern in the investigated area: PM10, PM2.5, and NOx. The modelling approach also provided a basis for interpreting the spatial variability of biomass-burning tracers. This aspect is particularly relevant in urban contexts where the contribution of residential biomass heating is relatively low compared with rural areas, yet measurable concentrations of both LG and BaP are still observed [14,15]. The model outputs were then compared with measured air quality data from the regional monitoring network of ARPA Lombardia, enabling an assessment of the relative contribution of wood-fired ovens to observed pollutant concentrations.
The main aim of this study is therefore to quantify the potential impact of wood-fired pizzerias on urban air quality in Milan, combining innovative data acquisition methods, experimental emission characterization, and advanced atmospheric dispersion modelling. By addressing a largely overlooked emission source, this work contributes to a more comprehensive understanding of urban pollution dynamics and may support future policies and regulatory strategies targeting small-scale combustion sources.
2. Materials and Methods
The area of interest of this study is the Municipality of Milan (Figure 1).
As one of the largest metropolitan areas in Italy, Milan faces significant air quality challenges associated with dense urbanization, intensive mobility, and high energy consumption.
The INEMAR (INventario EMissioni ARia) emission inventory is the official regional system used in Lombardy to estimate and monitor atmospheric emissions from both anthropogenic and natural sources. It provides a detailed, spatially resolved database of air pollutant emissions, supporting air quality assessment, environmental planning, and policy development. The INEMAR inventory therefore provides a crucial scientific basis for developing evidence-based strategies aimed at reducing emissions, improving public health, and achieving sustainability and decarbonization goals [10].
For the city of Milan, the inventory quantifies emissions from a wide range of sources, including road transport, heating systems, industrial activities, energy production, waste management, agriculture, and commercial activities. Among the latter, pizzerias represent a specific emission source due to the combustion and cooking processes occurring in pizza ovens, particularly wood-fired ovens. Indeed, according to the latest release of INEMAR, pizzerias with wood-fired ovens contribute to the total emissions of several air pollutants (Figure 2).
Although the contribution to the total emissions of Lombardy can be less relevant, the large number of pizzerias operating within the urban areas may result in a non-negligible contribution to local air pollutant concentrations, especially in densely populated districts.
2.1. Emission Factors from Wood-Fired Pizza Ovens
The air pollutant mass fluxes used to quantify emissions from wood-fired pizza ovens (Table 1) were derived from emission factors reported in [4]. These values were selected as reference emission factors because they currently constitute the only experimentally based quantification of emissions from wood-fired pizza ovens available in the scientific literature.
The dilution tunnel method was used to sample emissions from the wood-fired ovens. NOx mass fluxes were calculated from measurements performed on hot flue gases, whereas particulate matter mass fluxes were derived from diluted samples collected from diluted flue gases. This approach accounts for the condensation of semi-volatile compounds, which contribute significantly to total particulate emissions of wood-fired ovens and should therefore be considered in dispersion assessments.
Emissions of the chemical tracers, benzo[a]pyrene (BaP) and levoglucosan (LG), were estimated as a fraction of the total PM10 emissions, as these compounds are not explicitly included among the species available for dispersion simulations in the CALPUFF model. Consequently, only their particulate-bound fractions were considered in modelling simulations. These fractions were derived from contributions stemming from the original experimental study, which reported that BaP and LG account for 0.0111% and 3.78% of particulate matter emissions, respectively [7].
2.2. Number and Location of Wood-Fired Pizza Ovens in Milan
To estimate emissions generated by wood-fired pizza ovens, the first step was to construct an inventory of the emission sources within the study area (Metropolitan City of Milan). Since no official registry exists identifying food service activities equipped with wood-fired ovens, a dedicated data-driven methodology was developed to identify these establishments based on official business records and online data sources accessed either openly or under commercial licensing agreements. The approach combines administrative data, online business directories (i.e., structured listings of commercial activities such as OpenStreetMap [16] and The Data Appeal [17]), user-generated content (i.e., unstructured contributions such as reviews, photos, and other media shared by users on Google Places [18]), and artificial intelligence techniques within a multi-stage identification pipeline aimed at constructing a reliable inventory of potential emission sources. Access to The Data Appeal and the Google Places API was made possible through contractual licensing agreements between ARIA and the respective data providers.
The starting point of the analysis was the PARIX business register [19], a national administrative database containing official records of registered economic activities, including their legal status, economic activitiy classification according to the Italian statistical coding system (ATECO, “Attività Economiche”), and basic identifying information such as business name and registered address. From this source, 22,342 active food service establishments belonging to the selected ATECO categories (i.e., food service businesses with and without table service, codes 56.11.11 and 56.11.12 respectively) were extracted as the reference population. At this stage, businesses were identified exclusively through their registered name and address.
The resulting dataset was subsequently enriched through the integration of activity-type information (such as restaurant type, cuisine type, etc.) available from multiple complementary data sources, namely OpenStreetMap (OSM), The Data Appeal (TDA), and Google Places. Since no common identifier linking records across the different data sources was available, records from the complementary sources were reconciled with the PARIX businesses through a progressive record-matching procedure based on address and business name normalization, and both exact and threshold-based fuzzy string-matching algorithms. This process enabled the association of each PARIX establishment with the corresponding information available from the complementary sources, whenever a reliable match was found.
A preliminary candidate selection was then performed using structured semantic information available from these external sources, including business categories, Google Places types, and OSM tags related to restaurants, pizzerias, bakeries, and other activities potentially associated with wood-fired cooking. This filtering stage reduced the initial data population from 22,342 establishments to 9,993 candidate businesses (44.7%), while 12,349 establishments (55.3%) were filtered out due to the absence of keywords indicative of wood-fired cooking in their primary metadata. The aim of this stage was to exclude businesses clearly unrelated to the target activity, thereby substantially reducing the number of establishments subjected to the successive computationally intensive analyses.
For each record in the candidate set, up to five images and ten user reviews were retrieved through the Google Places API under the commercial agreement. User reviews were available for 8,486 establishments (84.9% of the candidate set), while 8,381 establishments (83.9%) had at least one image available for visual analysis. Images were analyzed using a CLIP-based vision-language model to identify visual evidence of traditional wood-fired ovens and using Optical Character Recognition (OCR) to detect textual references appearing in signs, menus, or other images. In parallel, user reviews were analysed using Natural Language Processing techniques. In addition to conventional keyword matching, a multilingual Natural Language Inference (NLI) model was fine-tuned to determine whether the semantic content of each review provided evidence supporting the hypothesis that the restaurant used a wood-fired oven. This approach improves robustness compared with simple lexical matching by enabling the recognition of semantically equivalent expressions in multiple languages and reducing ambiguities associated with context-dependent mentions.
Finally, the outputs of the different analytical modules were combined through a conservative logical aggregation strategy, whereby positive evidence generated by any independent source was considered sufficient to classify an establishment as equipped with a wood-fired oven. The proposed methodology identified 6,339 establishments as potentially equipped with a wood-fired oven, corresponding to 63.4% of the candidate establishments analyzed through the multimodal pipeline. Among the identified establishments, 6,319 (63.2%) were detected through visual analysis, 167 (1.7%) through OCR-based textual evidence, and 126 (1.3%) through semantic analysis of user reviews. Note that some establishments were detected by more than one method; the counts above therefore sum to more than the total of 6,339 unique identified establishments in the metropolitan area. As a final step, only establishments falling within the administrative boundaries of the Municipality of Milan were retained, resulting in a dataset comprising of 3,743 wood-fired ovens. The resulting inventory constitutes the basis for atmospheric dispersion modelling presented in the following sections.
2.3. Additional Major Emission Sources in the Area
In Milan’s urban environment, the INEMAR emission inventory estimates that more than 80% of NOx emissions originate from road traffic and non-industrial combustion. These sources, together with population-density-related activities such as tobacco smoking and fireworks, also account for a large share of primary PM10 emissions [10].
To validate the results obtained for wood-fired ovens, road traffic and heating systems were also considered in the modelling study. The emission estimates were taken from the regional emission inventory (Table 2).
Specifically, total road-transport emissions (Macrosector Level 07), excluding road dust resuspension (Activity Level 07), were used for road traffic. Instead, total emissions from non-industrial combustion (Macrosector 02) were considered for heating systems, excluding plants from agriculture, forestry and aquaculture facilities (Sector Level 03) and pizzerias with wood-fired ovens (Sector Level 01, Activity Level 07) to avoid double counting.
The spatial distribution in the urban areas was calculated based on the public register of thermal plants in Lombardy [20] and on highly detailed information on traffic intensity in the city of Milan made available by the Lombardy Region Administration.
2.4. Air Pollutant Dispersion Simulation Model
Atmospheric dispersion simulations were performed using the CALPUFF modelling system, driven by meteorological fields generated by the WRF (Weather Research and Forecasting) model for the year 2019. The meteorological domain consisted of a 40×36 cell grid with a horizontal resolution of 500 meters, covering the Municipality of Milan. The south-western corner of the domain was located at coordinates (502000, 5025000) in the UTM coordinate system (WGS84, Zone 32N). The same domain was adopted as the computational domain for the CALPUFF simulations.
To characterize the dispersion patterns associated with wood-fired pizza ovens, an initial reference simulation was performed by representing the emission source as a point source located near the center of the modelling domain with unit emissions (1 g s−1). This configuration was adopted to minimize potential boundary effects and to obtain representative first-guess concentration fields. To validate the modelling approach used for wood-fired pizza ovens, analogous simulations were performed for heating systems, represented by a point-source boiler, and for road traffic, represented as an area source (50m × 50m).
Source-specific temporal emission profiles were implemented in the CALPUFF model (Figure 3). For wood-fired ovens, hourly emission variations were based on activity patterns associated with meal preparation periods. Heating systems emissions were modulated daily using heating degree days (HDD) as a proxy for heating demand, calculated based on a previously validated method [21].
The modulation factors were expressed through the i-th daily contribution of HDD to the annual HDD total (Equation 1), while they were set to zero during the non-heating season, from 15 April to 15 October:
where is the average temperature of the i-th day, and is the average temperature of each day of 2019. Road traffic emissions were adjusted using detailed temporal profiles derived from traffic intensity data.
Post-processing of model results was performed using CALPOST and a linear combination workflow to calculate the cumulative contribution of all wood-fired ovens, heating boilers, and 50m × 50m road traffic areas identified within the Municipality of Milan. The methodology varied according to source type, with distinct approaches adopted for road traffic and heating systems versus wood-fired ovens. Both approaches were based on the assumption that meteorological conditions are sufficiently homogenous across the metropolitan area, allowing the concentration field generated by a representative source located around the center of the domain to be spatially translated while preserving the validity of the associated meteorological conditions. The contribution of each source was therefore calculated independently and subsequently aggregated to obtain the overall concentration field. This linear combination strategy reduced computation times by 99% while allowing the inclusion of all identified sources without limitations on the number of simulated sources within each run.
The dispersion model starts from the CALMET meteorological domain previously defined. A nesting factor of 2 was applied, resulting in a grid composed of cells measuring 250m × 250m. In the approach adopted for road traffic and heating systems, for each grid cell, a source-specific weighting factor was calculated and used to spatially distribute emissions across the modelling domain.
For road traffic, the weight associated with each grid cell is proportional to the annual number of vehicles crossing the area:
where, is the annual traffic volume associated with each grid cell, and is the set of grid cells located within the municipality of Milan.
For heating systems, the weight associated with each grid cell is proportional to the thermal power of all boilers located within that cell:
where, is the thermal power of boiler located in grid cell , and is the number of boilers within grid cell .
Only emission sources located within the municipality of Milan were considered. Consequently, non-zero weights were assigned exclusively to cells belonging to the municipality:
where, denotes the considered source category: traffic or heating.
These weights were then used to calculate the emission intensity within each grid cell. The share of total emission values allocated to each grid cell () was calculated using:
where is the total annual emission of pollutant from source category . Annual emissions of the air pollutants investigated in the municipality of Milan were taken from the INEMAR inventory, as described in Section 2.3.
A different approach was adopted for wood-fired ovens when calculating the spatial allocation of total emissions. Although Equation 5 was also applied to this source category, the experimentally derived mass fluxes (Section 2.1) were used to estimate the emissions (), which were then weighted by the total number of wood-fired ovens in each cell (), identified using the data-driven methodology described in Section 2.2.
Simulation results from all three sources where then post-processed with CALPOST to generate a first-guess concentration field, . For each grid cell, this unit concentration field associated with road traffic and heating systems was spatially translated so that the reference source location coincided with the center of the destination cell, and subsequently scaled according to the corresponding allocated emission, . A similar procedure was applied to wood-fired ovens; however, in this case, the translations were based on the actual locations of the ovens rather than on the grid cell centers.
The contribution of each grid cell to the concentration at location was therefore:
where, represent the coordinates of the center of the grid cell (road traffic and heating systems) or the location of the wood-fired pizza ovens.
The final concentration field for each pollutant and source category was obtained through the superposition of the contributions of all cells:
or, equivalently,
Simulations were carried out for PM10, PM2.5, and NOx and the resulting concentration fields represent the annual average values attributable to wood-fired pizza ovens, traffic and residential heating throughout the Municipality of Milan.
In addition, concentration values were extracted at the location of the air-quality monitoring stations operated by ARPA Lombardia within the study area (Table 3, Figure 4). The monitoring network in Milan comprises five air-quality stations representative of different exposure settings, including urban traffic (UT) and urban background (UB) environments. The station typology and the associated pollutants/tracers investigated in the analysis are also indicated in Table 3.
These results were subsequently used to evaluate the contribution of wood-fired pizza ovens, heating systems, and road traffic to ambient pollutant concentrations and to compare model estimates with observed air quality measurements.
2.5. Modelling Approach
Figure 5 summarizes the overall methodological framework adopted in this study to assess the air quality impact of wood-fired pizza ovens. The approach integrates information from multiple sources, including geospatial data, experimentally measured emission factors, atmospheric dispersion modelling, and air quality measurements.
The workflow starts with the identification and geolocation of pizzerias and restaurants equipped with a wood-fired oven through a data-driven procedure. The resulting geospatial dataset is then combined with experimentally determined emission factors for the investigated air pollutants and tracers, allowing the calculation of source-specific emission fluxes for each identified facility. Meteorological fields generated with the WRF model were used to produce the three-dimensional meteorological input required by the CALPUFF dispersion model. Reference dispersion simulations were performed for unitary emission sources located within the modelling domain, post-processed using CALPOST to derive concentration fields that were subsequently spatially translated according to the actual location of each source and aggregated to estimate their cumulative impact. The resulting concentrations were then compared with observations from the regional air-quality monitoring network.
2.6. Measurements from the ARPA Lombardia Air Quality Network (Methodology and Analysis of PM Composition)
The air quality monitoring network operated by ARPA Lombardia consists of 83 fixed monitoring stations distributed across urban, suburban, rural background, and industrial environments, providing long-term observations of atmospheric pollutants and ensuring representative spatial coverage of the Lombardy region. Within this framework, the present study focuses on the monitoring stations located within the Municipality of Milan (Figure 4).
Mass concentrations of PM10 and PM2.5 are continuously measured using beta attenuation monitors [22], while nitrogen oxides (NO, NO2, and NOx) are continuously monitored according to the European reference method EN 14211, based on the chemiluminescence measurement principle [23]. At the MI-P_UB, MI-S_UT, and MI-M_UT sites, PM10 samples are collected using reference gravimetric samplers and beta attenuation monitors, aimed at determining the chemical composition of atmospheric particulate matter.
In the present study, particular attention was also devoted to the analysis of specific tracers such as BaP and LG. The former is routinely monitored as a marker of incomplete combustion processes and is recognized as one of the most relevant carcinogenic components associated with atmospheric particulate matter [24,25]. Polycyclic aromatic hydrocarbons (PAHs), including BaP, were determined according to the European reference method EN 15549, with a sampling frequency of one sample every three days, as prescribed by current European air-quality legislation, [26]. Instead, LG was determined daily by ion chromatography coupled with pulsed amperometric detection (IC–PAD), providing sensitive and selective quantification of this compound in particulate matter samples.
The minimization of measurement errors and the proper estimation of measurement uncertainty require the reduction of both random and systematic sources of uncertainty. This objective is achieved through the implementation of comprehensive Quality Assurance and Quality Control (QA/QC) procedures, in accordance with the requirements of Directive 2008/50/EC and the Italian Ministerial Decree of 30 March 2017 (DM 62/2017) [27,28]. Quality Control activities include routine operational and procedural checks performed by ARPA Lombardia to verify instrument performance, calibration stability, and data validity, ensuring compliance with the data-quality objectives established by European legislation. Quality Assurance activities comprise regular participation in proficiency-testing schemes, inter-laboratory comparison exercises, blind tests, and performance audits aimed at assessing measurement accuracy, comparability, traceability, and long-term consistency. The implementation of these QA/QC procedures ensures the reliability, traceability, robustness, and scientific integrity of the air-quality measurements and chemical-speciation data used in the present study.
2.7. Source Apportionment of Particulate Matter
Among the objectives of the PrepAIR project [29], the activation of a measurement network for the chemical characterization of PM10 was envisaged. This network was created based on existing monitoring stations and consists of four urban background sites - Turin, Milan, Vicenza and Bologna - and one rural background site - Schivenoglia - to which, during the project, the suburban background site of Cavallermaggiore (CN) was added. By means of specific laboratory analyses of the samples collected daily at the 6 sites, a database was created that covers a total of six years (from 1 April 2018 to 31 March 2024). A source apportionment analysis was then performed, carried out with Positive Matrix Factorization (PMF) [30].
The source apportionment analysis allowed the identification, albeit with margins of uncertainty, of the main sources and/or processes of particulate formation. In summary, 7 factors common to all receiving sites were resolved: two factors of secondary origin, Secondary Background and Winter Secondary, as well as Biomass Burning, Traffic, Salt, Soil and Anthropogenic Mix. On average over the Po basin, the two factors Soil and Salt together explain more than 15% of the reconstructed PM10 mass. Soil has a contribution of more than 10%, while salt has a contribution of about 5%. The primary factors of anthropogenic origin, Traffic and Biomass Combustion have a similar contribution, around 10%. The secondary component represents about 50% of the total mass of PM10 and is divided equally into the two factors that characterize it: Winter Secondary and Secondary Background. In particular, the secondary background is enriched with a carbonaceous component which probably indicates that the ammonium sulphate may have formed very far from the receptor, thus enriching itself during an aging process. As also pointed out in the analysis of the chemical composition, the contributions of the different sources are uniform over the basin. It should be noted that there is an accumulation of ammonium nitrate during the winter months, which leads the winter secondary to account for over 30% of the PM10 mass in January and February.
PM10 sampling has been active at the Milan site since 2013, so a long series of chemical composition is available, which combines the measurements made during the project with those collected previously. In the last decade, there has been a decline in the total mass of PM10 and in the concentration of elemental carbon (EC); there is therefore a reduction in the contribution of the factor associated with traffic tailpipe emissions. The fraction of winter secondary (ammonium nitrate in particular) is instead rather stable.
3. Results
3.1. Validation of Pizza Ovens Identification Method
To evaluate the reliability of the identification methodology, a validation dataset was constructed by randomly selecting 1,713 establishments (approximately 10% of the sample). The presence or absence of a wood-fired oven was then determined through manual review, using evidence such as venue photographs, customer reviews, and business websites. This manual assessment provided the ground truth against which the automatic classification was evaluated.
A total of 276 businesses were confirmed to operate a wood-fired oven. The classifications generated by the employed methodology were then compared against the manually established ground truth labels to evaluate its ability to correctly identify potential emission sources.
Performance was assessed using Recall, Precision, and F1-score, computed against the manually established ground truth. Recall was defined as:
where denotes true positives and denotes false negatives, representing the proportion of establishments with a wood-fired ovens that were correctly identified.
Instead, precision was defined as:
where denotes false positives, representing the proportion of identified establishments that were confirmed to have a wood-fired oven.
Finally, the F1-score was defined as the harmonic mean of and , providing a summary measure of their trade-off:
Emphasis was placed on Recall, as the primary objective of our approach was to minimize the number of emission sources omitted from the inventory. In the context of atmospheric emission assessment, missing a true wood-fired oven has a greater impact than temporarily including a false positive.
The proposed methodology achieved a Recall of 77%, indicating that more than three quarters of the establishments equipped with a wood-fired oven were correctly identified (Table 4). The corresponding Precision was 20%, while the overall F1-score reached 31%, reflecting the expected trade-off resulting from a methodology intentionally optimized for coverage rather than strict selectivity.
An additional analysis was conducted to investigate the performance across different business categories. The highest results were obtained for establishments explicitly classified as pizzerias, achieving a Recall of 87% and a Precision of 50% (Table 5). Conversely, more generic business categories (e.g., generic restaurant) generated a substantially larger number of false positives, confirming that the lack of specificity of the available business metadata is the primary limiting factor for classification precision.
The validation also confirmed the effectiveness of the structured semantic filtering adopted during the candidate selection stage. Business tags collected from PARIX, OpenStreetMap, The Data Appeal, and Google Places were consistent with the manually assigned labels in 85.7% of the analyzed establishments. This result demonstrates that integrating structured metadata from multiple heterogeneous sources provides a robust basis for constructing the candidate inventory before applying computationally intensive multimodal analyses. The remaining mismatches primarily concern generic or ambiguous business categories, indicating that the specificity of source classifications remains a primary constraint on pipeline precision.
3.2. Validation of the Modelling Approach
The reliability of the parallel processing method was evaluated by comparing its results against those obtained from a conventional CALPUFF simulation in which all identified wood-fired pizza ovens were explicitly included as individual emission sources. Both approaches were applied to the same geospatial database of facilities equipped with wood-fired ovens and were driven by identical emission rates. Annual average concentration fields obtained with the two methods were then compared on a cell-by-cell basis over the entire modelling domain (Figure 5).
The comparison showed an excellent agreement between the two approaches, confirming the validity of the proposed methodology. A strong linear relationship was observed between the concentrations estimated by the conventional CALPUFF simulations and those derived from the parallel processing approach (r = 0.986). Furthermore, the regression line (y = 1.00x − 0.04) is nearly coincident with the 1:1 reference line, confirming the near-linear additivity of source contributions and the absence of significant systematic bias. Although a small dispersion is observed at higher concentration levels, the overall results demonstrate that the proposed parallel processing method can accurately reproduce the concentration fields generated by traditional multi-source CALPUFF simulations in the investigated domain, while significantly reducing computational requirements.
It should be noted that the quality of the agreement depends on the location selected for the test source prior to the linear combination. In this study, the test source was placed at the location providing the best agreement with the reference multi-source CALPUFF simulation, which was considered the most representative of the meteorological conditions across the modelling domain. Consequently, the methodology was adopted for the assessment of the cumulative impact of all wood-fired pizza ovens, heating systems, and road traffic within the study area.
3.3. Spatial Distribution of Major Air Pollutants
Annual average air pollutant concentrations obtained from the dispersion simulations were analyzed to assess the impact of wood-fired pizza ovens and other major urban emission sources on air quality within the study area. Figure 6 presents the spatial distribution of annual average PM10, PM2.5, and NOx concentrations associated with the investigated sources. For heating systems, average concentrations were calculated considering only simulated values in the winter period during which these sources are active.
The spatial distribution of the modelled pollutant concentrations exhibits distinct patterns depending on the emission source. For wood-fired pizza ovens, the highest contributions to all the pollutants investigated are concentrated in the central districts of the city, with progressively lower concentrations towards the outskirts. This pattern reflects the spatial distribution of restaurants and pizzerias equipped with wood-fired ovens, which are predominantly located in the city center where commercial activities, population density and recreational services are more concentrated.
A different spatial pattern is observed for road traffic emissions. The concentration fields of all investigated pollutants closely follow the structure of Milan’s road network, with elevated values along the major arterial roads and ring-road system and lower contributions in less busy areas. The strong correspondence between modelled concentration gradients and the actual road layout indicates that the dispersion modelling framework adequately reproduces the spatial influence of traffic-related emissions.
Instead, emissions from heating systems show a distribution that is broadly consistent with both residential density and the spatial concentration of commercial and institutional activities, in line with the pattern observed for wood-fired ovens. Indeed, higher contributions were observed in the most densely populated and built-up areas of the municipality, where residential buildings coexist with offices, schools, retail establishments, and other service-sector activities. Conversely, lower concentrations characterize peripheral zones with lower population density and fewer commercial and institutional facilities. This pattern is evident for both particulate matter and nitrogen oxides and reflects the spatial distribution of heating demand and energy use across the city.
Although exhibiting distinct spatial patterns, the model results indicate that road traffic is the dominant contributor to particulate matter concentrations (0.075 – 10.42 µg m−3 PM10), followed by wood-fired pizza ovens (0.085 – 3.34 µg m−3 PM10) and, to a lesser extent, heating systems (0.0054 – 0.61 µg m−3 PM10). These findings highlight the non-negligible role of emissions from restaurants and pizzerias as a source of primary particulate matter in the urban environment. In contrast, the contribution of wood-fired ovens to NOx concentrations is relatively limited (0.0044 – 1.75 µg m−3). Road traffic remains the principal source of NOx across the municipality (1.05 – 146.23 µg m−3), while heating systems also provide a significant contribution during the winter season (0.14 – 16.25 µg m−3). Overall, the results suggest that particulate matter concentrations arise from a combination of sources with varying relative importance, whereas NOx levels are driven primarily by traffic emissions, with heating systems representing an additional relevant source, particularly during periods of increased demand.
3.4. Impact Assessment on Air Quality
To assess the impact of wood-fired pizza ovens relative to other major urban emission sources, simulated pollutant concentrations were extracted at selected receptor locations corresponding to the ARPA air-quality monitoring stations within the Municipality of Milan. Daily average concentrations derived from the dispersion model were then compared with the corresponding measurements collected at each monitoring site, allowing for an evaluation of the modelling framework's ability to reproduce the observed temporal variability of pollutant concentrations. Figure 7 shows the results obtained for NOx at the MI-P_UB monitoring station (data from other stations can be found in the SM: Figure S1-S4).
The results indicate that the model can reproduce almost all the observed NOx concentrations at the monitoring stations, accounting for between 95.16% and 123.06% of the measured values. Model performance was further supported by a moderate positive correlation between simulated and observed concentrations (r = 0.50 - 0.62), indicating a good representation of the temporal variability of NOx levels. Road traffic was identified as the dominant contributor throughout the year, accounting for the largest share of NOx concentrations at all monitoring sites (89.75 – 92.29%). During the winter season, heating systems also exerted a significant influence on ambient NOx levels (12.37 – 27.67%), whereas the contribution of wood-fired pizza ovens remained negligible in comparison with the other emission sources (0.45 – 2.09%).
Different trends were observed for particulate matter, with no significant differences between PM10 and PM2.5. Unlike NOx, the relative contribution of wood-fired pizza ovens to total simulated particulate matter concentrations was substantial at all monitoring stations (16.97 – 48.27%), indicating an influence that extends across the entire urban area. At the MI-P_UB urban background station, road traffic remained the dominant source, although wood-fired ovens also accounted for a significant share of particulate matter concentrations (Figure 8, Figure S5). A similar pattern was observed at the MI-M_UT station, where the contribution from road traffic was particularly pronounced, while the relative impact of pizzerias was lower, consistent with the nature of the station and its location outside of the city center (Figure S6).
By contrast, stations located closer to the city center, such as MI-S_UT and MI-V_UT, where the density of restaurants and pizzerias is greatest, exhibited a markedly higher contribution from wood-fired pizza ovens to total simulated particulate matter concentrations (Figure 9, Figure S7 and Figure S8). These results are consistent with the spatial patterns described in the previous section, which showed a stronger influence of wood-fired oven emissions in the central districts of Milan and a gradual decline towards the urban periphery.
This effect was particularly evident during the summer months, when heating systems are inactive and traffic-related emissions are generally reduced. Under these conditions, wood-fired pizza ovens emerged as one of the main contributors to particulate matter, in some locations exceeding the contribution of road traffic. Figure 9(d) highlights the significant contribution of wood-fired ovens to PM10 concentrations at the MI-V_UT site. During the summer months, this source emerges as the dominant contributor to PM10 levels, accounting for up to 80% of the total concentration. Unlike heating emissions, which are strongly seasonal, and traffic emissions, which exhibit substantial temporal variability, restaurant and pizzeria activities operate throughout the year and therefore provide a relatively constant source of primary particulate matter emissions.
Overall, the findings indicate that the contribution of wood-fired pizza ovens to urban particulate matter is strongly influenced by both local source density and seasonal conditions. In areas characterized by a high concentration of food-service activities, their impact can become comparable to, or even exceed, that of more traditionally recognized urban sources.
Despite the relatively important contribution of wood-fired pizza ovens within the simulated source categories, their contribution to the total observed particulate matter concentrations remains limited. Indeed, the model accounts for only 11.98 – 17.78% of measured PM10 concentrations and 16.92 – 25.69% of the measured PM2.5 concentrations. This is because the simulations include only primary particulate matter emissions from three of the major urban sources, whereas a substantial fraction of ambient particulate matter originates from secondary aerosol formation processes and from regional and long-range transport, which are not represented in the source-specific simulations [31]. This interpretation is supported by data from the Copernicus Atmosphere Monitoring Service (CAMS), which indicates that only 32.64% of PM10 concentrations in Milan originate from local emissions within the city, whereas more than 65% are associated with contributions from outside the municipal boundaries [32].
Further support is provided by Positive Matrix Factorization (PMF) analyses performed on measurements collected at the MI-P_UB monitoring station. These analyses indicate that biomass burning and road traffic together account, on average, for 26.82% of the total PM10 concentration, a fraction that could also include part of secondary particulate matter formed from precursors emitted by these sources. Therefore, the contribution estimated by the modelling framework is consistent with the range of impacts identified through receptor-based source apportionment techniques.
Overall, the agreement between the model results and PMF estimates, together with the good positive correlation observed between simulated and PMF-derived concentrations (Figure 10), suggests that the modelling framework provides a realistic representation of the primary particulate matter contribution from the investigated urban sources and is consistent with both observational evidence and previous source-apportionment studies.
3.5. Wood-Fired Pizza Ovens Impact Assessment on Selected Tracers
A similar analysis was also performed to assess the contribution of wood-fired pizza ovens to particulate-bound levoglucosan (LG), a tracer of biomass burning, and benzo(a)pyrene (BaP), a marker of incomplete combustion. Emission fluxes for these species were estimated as fractions of PM10 emissions; consequently, their dispersion maps exhibit the same spatial pattern as that shown in Figure 6, with proportionally lower absolute concentrations. Hence, as was the case for particulate emissions, the contribution of wood-fired ovens to both tracers is highest in the city center and progressively decreases towards the outskirts.
The comparison between simulated and observed LG concentrations at the urban background monitoring station of MI-P_UB indicates a good level of agreement (r = 0.480), demonstrating that the model can reproduce a substantial fraction of the observed spatial and temporal variability. Instead, only a moderate level of agreement (r = 0.343) was observed between simulated and observed values at the MI-S_UT monitoring station. However, in both cases, the model captures the pronounced seasonal pattern, with higher concentrations during winter and lower values during summer, reflecting once again the influence of meteorological conditions on pollutant accumulation and dispersion (Figure 11, Figure S9).
The simulated wintertime contribution of wood-fired pizza ovens was lower in absolute terms, reflecting the influence of other biomass-burning sources, particularly residential heating, which is employed during the cold season. Nevertheless, wood-fired ovens still accounted for a substantial share of LG concentrations, contributing on average 19.70% of the total levels at MI-P_UB and 34.28% at MI-S_UT. This is in line with previous observations which showed a greater concentration of restaurants and pizzerias around the MI-S_UT monitoring station. These devices therefore represent a non-negligible additional source of biomass-burning emissions in urban environments, where the use of woody biomass for residential heating is generally less common than in rural areas.
In contrast, measured LG concentrations during the summer months frequently fall below the limit of detection, whereas the modelled contribution from wood-fired ovens remains non-negligible because pizzerias and other establishments operating these appliances remain active throughout the entire year. In some cases, the discrepancy can be explained by the fact that the simulated concentrations are below the experimental detection limit and therefore cannot be reliably quantified in particulate matter samples. In other cases, the difference between modelled and measured concentrations may be related to the atmospheric degradation of LG during the warm season. Although emitted continuously by wood-fired ovens, LG is susceptible to oxidation by hydroxyl radicals, and its degradation is enhanced under conditions of elevated solar radiation and intense photochemical activity [33]. Consequently, its atmospheric lifetime is reduced during summer, leading to lower ambient concentrations than would be expected based solely on emissions and dispersion processes.
Instead, the comparison between modelled and measured BaP concentrations shows a weaker level of agreement at both monitoring sites: r = 0.223 and r = 0.261 at the MI-P_UB and MI-S_UT monitoring sites, respectively (Table S1 and Table S2). This suggests that additional combustion sources likely play a significant role in determining the spatial and temporal variability of ambient BaP concentrations across the study area, including residential biomass burning, vehicular traffic, and industrial activities [34]. Nevertheless, the model was able to reproduce the main seasonal pattern, which broadly mirrored that observed for levoglucosan, with higher concentrations during the winter months and lower levels during summer.
Despite the weaker correlation with experimental observations, the simulations indicate a substantial contribution of wood-fired ovens to atmospheric BaP concentrations, accounting on average for 34.95% and 37.47% of the measured levels at MI-P_UB and MI-S_UT, respectively. These results highlight that wood-fired ovens can represent a significant source of combustion-related pollutants in urban environments and may contribute appreciably to the overall BaP burden. At the same time, the similar contribution estimated at the two monitoring sites, despite their different urban settings, supports the hypothesis that wood-fired pizza ovens are not the primary drivers of the spatial variability of BaP concentrations. Unlike levoglucosan, whose spatial distribution appears to be more closely associated with the density of wood-fired ovens, BaP is influenced by a broader range of combustion sources, which likely exert a stronger control on the observed concentration patterns across the city.
4. Discussion
This study represents urban air pollution as the combined effect of three major emission sources: wood-fired pizza ovens, residential and commercial heating systems, and road traffic. By coupling emission inventory and experimental data with the developed dispersion modelling framework, spatially resolved concentration profiles of NOx and PM10 were reconstructed across a representative west-to-east transect of the city of Milan (Figure 12). The resulting patterns are consistent with those expected in a densely urbanized environment [35], with road traffic emerging as the dominant contributor to NOx levels and displaying marked peaks in correspondence with the A50 and A51 ring roads. In contrast, PM10 concentrations reveal a more diversified source contribution, where traffic remains important but emissions from wood-fired pizzerias become comparatively more relevant within the urban core.
In urban environments, ambient pollutant concentrations are generally composed of a regional or urban background component and local concentration increments generated by specific emission sources [12,35]. Figure 12 highlights the capability of the modelling framework developed in this study to quantify these source-specific urban increments and distinguish the contributions of individual emission sources. The high-resolution concentration profiles reveal street-level concentration increments and distinct spatial patterns across the city, with the influence of heating systems and wood-fired pizza ovens increasing towards the urban core, while traffic-related concentration peaks were approximately symmetric with respect to the city center and coincide with major ring roads. Furthermore, the comparison between model results and experimental measurements suggests that the background concentration plays a larger role for PM10 and PM2.5 than for NOx. This finding is consistent with previous PMF and CAMS analyses, which showed that the largest fraction of atmospheric particulate matter originates from the regional background rather than from local urban sources.
In previous studies, the city increment was derived from pollutant concentrations measured at one or more air quality monitoring stations on the previous day, thereby accounting for the temporal accumulation of pollutants in urban areas adopting the approach of SHERPA-City project [12,36,37]. Piccoli et al. [38] showed that the CAMx-LPiG hybrid model improves the representation of traffic-related NO2 concentration gradients in Milan and reduces simulation bias relative to conventional CAMx modelling, enabling more accurate urban-scale air quality assessments [38]. In this study, however, the proposed approach makes it possible to estimate the effects of the spatiotemporal variability of emissions from traffic, residential heating, and pizzerias in relation to atmospheric accumulation and transport conditions. Unlike approaches based on monitoring data, neither measurements from air quality monitoring stations nor background concentration data are used, since the simulations are performed continuously for every day of the simulated year.
5. Conclusions
This work presented a data-driven methodology to support the construction of an inventory of establishments equipped with wood-fired ovens, addressing the lack of official information on this type of diffuse emission source. By integrating administrative business records with user generated digital information and multimodal artificial intelligence techniques, the proposed approach enabled the identification of establishments to be included in the emission inventory used for the subsequent air quality assessment.
The validation results showed that the methodology provides a reliable basis for inventory construction, achieving a Recall of 77% while deliberately prioritising the identification of potential emission sources over the reduction of false positives. This design choice is consistent with the objectives of environmental applications, where omitting actual emission sources may have a greater impact than including false positives. The analysis also confirmed that the lack of specificity in available business metadata represents the primary limiting factor for classification precision.
Although developed for the identification of wood-fired pizza ovens, the proposed methodology is inherently reusable. The same workflow can be adapted to other commercial activities for which official inventories are unavailable, integrating heterogeneous administrative records, digital content, and artificial intelligence to identify potential emission sources. Future applications will explore the transferability of this framework to vehicle body repair shops, where identifying facilities equipped with paint booths and curing ovens is a prerequisite for estimating VOC emissions. More generally, the proposed approach provides a scalable methodology to support public administrations in the development and maintenance of emission source inventories for different categories of diffuse anthropogenic emissions.
The local impact of pizzerias on urban air quality has been estimated to be in the range of 2 - 3 µg m−3 of PM10, based on the annual average concentration. This impact is not negligible and confirms that modelling systems need to be complemented by new data-driven approaches for source identification. The comparison of the simulation results also confirmed observations from monitoring stations, PMF and findings from the CAMS modelling system, which indicate that most PM10 concentrations are attributable to physicochemical transport processes associated with emission sources located outside the urban area.
Moreover, the integrated air quality assessment system developed in this paper is aligned with the objectives of the new EU Ambient Air Quality Directive (EU 2024/2881). The system combines air quality monitoring data, indicative measurements, and advanced modelling techniques within a unified framework, placing modelling at the core of the assessment process. It provides high-resolution urban-scale air quality maps and supports microscale analyses in areas affected by pollution hotspots and steep spatial concentration gradients. Furthermore, the system is specifically designed to capture population exposure with a high degree of spatial detail, enabling the identification of local variations in pollutant concentrations over short distances and supporting more accurate exposure assessments in urban environments.
The proposed modelling approach reduced computational time by approximately 99% while enabling the inclusion of all identified emission sources without limitations on the number of sources simulated in each run. The system captures the spatiotemporal variability of emissions from traffic, residential heating, and pizzerias, accounting for atmospheric accumulation and transport processes. Moreover, unlike approaches based on monitoring or externally simulated data, it operates independently of air quality measurements and background concentration data, providing continuous simulations for every day of the year.
Considering Equation 8, the proposed approach could enable the development of a modeling system capable of attributing concentration contributions to each type of emission source, as well as to its spatial location within the computational domain. This capability is particularly valuable for inverse modeling applications, which aim to reconstruct emissions through the comparison of simulated data with observations from air quality monitoring stations and satellite measurements.
Supplementary Materials
The following supporting information can be downloaded at the website of this paper posted on Preprints.org.
Author Contributions
Conceptualization, A.M.; methodology, A.B., C.V., S.L., L.C., E.C., S.G., C.D. and A.M.; software, A.B, C.V., S.L., and A.M.; validation, A.B., C.V., S.L. and A.M.; formal analysis, A.B., C.V., S.L., S.G. and C.D.; investigation, A.B., C.V., S.L., L.C., E.C. and A.M.; resources, G.L. and A.M.; data curation, A.B., C.V., S.L., S.G., C.D. and A.M.; writing—original draft preparation, A.B., C.V., S.L, E.C., S.G., C.D. and A.M.; writing—review and editing, A.B., C.V., S.L., L.C., E.C., S.G., C.D. and A.M.; visualization, A.B., C.V., S.L. and A.M.; supervision, G.L.; project administration, A.M.; funding acquisition, G.L., M.L., V.U. and M.G.B. All authors have read and agreed to the published version of the manuscript.
Funding
Part of this research was carried out within the framework of the Regioni per l'Intelligenza Artificiale (Reg4IA) project, promoted by the Dipartimento per la trasformazione digitale della Presidenza del Consiglio dei ministri together with Italian Regions and Autonomous Provinces. This work was partly supported by the Italian Ministry of the Environment and Energy Security [CUP (Unique Project Code) I34G20000010001] in the framework of the “Profile Pizza” project.
Institutional Review Board Statement
Not applicable.
Informed Consent Statement
Not applicable.
Data Availability Statement
The PARIX business register data are available from the relevant national administrative authority. OpenStreetMap data are publicly available under the Open Database Licence at https://www.openstreetmap.org. Data from The Data Appeal and the Google Places API are not publicly available; they were accessed under contractual licensing agreements between ARIA and the respective data providers, established within the framework of the Regioni per l'Intelligenza Artificiale (Reg4IA) project, promoted by the Dipartimento per la trasformazione digitale della Presidenza del Consiglio dei ministri together with Italian Regions and Autonomous Provinces. The geospatial inventory of wood-fired pizza oven establishments derived from these sources is available from the corresponding author upon reasonable request, subject to the terms of the original data agreements.
Use of Artificial Intelligence
The authors used Microsoft Copilot (Microsoft Corporation) to generate the conceptual image presented in Figure 12. The authors reviewed, validated, and take full responsibility for the final content.
Acknowledgments
This work has been partially supported by the Italian Government's Department for Digital Transformation, through the Reg4IA-DEFAI project.
Conflicts of Interest
The authors declare no conflicts of interest.
References
- Piracha, A.; Chaudhary, M.T. Urban Air Pollution, Urban Heat Island and Human Health: A Review of the Literature. Sustainability 2022, 14, 9234. [Google Scholar] [CrossRef]
- Sicard, P.; Agathokleous, E.; Anenberg, S.C.; De Marco, A.; Paoletti, E.; Calatayud, V. Trends in Urban Air Pollution over the Last Two Decades: A Global Perspective. Sci. Total Environ. 2023, 858, 160064. [Google Scholar] [CrossRef] [PubMed]
- Makinde, P.; Idowu, A.; Pokauh, E.; Adedeji, P. Urban Air Pollution: Sources, Impacts, and Sustainable Mitigation Strategies for a Cleaner Future. World J. Adv. Res. Rev. 2023, 20, 1298–1313. [Google Scholar] [CrossRef]
- Bergomi, A.; Migliavacca, G.; Bertagna, S.; Borelli, M.; Chiavarini, S.; Comite, V.; D’Elia, I.; Fermo, P.; La Torretta, T.M.G.; Piersanti, A.; et al. Air Pollutant Emission Factors from Wood-Fired Pizza Ovens. Environ. Pollut. 2025, 384, 126948. [Google Scholar] [CrossRef] [PubMed]
- Bergomi, A.; Morreale, C.; Fermo, P.; Migliavacca, G. Determination of Pollutant Emissions from Wood-Fired Pizza Ovens. Chem. Eng. Trans. 2022, 92, 499–504. [Google Scholar] [CrossRef]
- Lima, F.D.M.; Pérez-Martínez, P.J.; de Fatima Andrade, M.; Kumar, P.; de Miranda, R.M. Characterization of Particles Emitted by Pizzerias Burning Wood and Briquettes: A Case Study at Sao Paulo, Brazil. Environ. Sci. Pollut. Res. 2020, 27, 35875–35888. [Google Scholar] [CrossRef] [PubMed]
- Stracquadanio, M.; Migliavacca, G.; Fermo, P.; La Torretta, T.M.G.; Morreale, C.; Bergomi, A.; D'Elia, I.; Chiavarini, S.; Bertagna, S.; Malaguti, A.; Piersanti, A. Determinazione di Fattori di Emissione e Caratterizzazione Chimica del Particolato Emesso da Forni a Legna delle Pizzerie Attraverso Misure Sperimentali: Parte 2. Poster presented at PM2024: XI Convegno sul Particolato Atmosferico, Turin, Italy, 28-31 May 2024. [Google Scholar]
- Li, W.; Ge, P.; Chen, M.; Tang, J.; Cao, M.; Cui, Y.; Hu, K.; Nie, D. Tracers from Biomass Burning Emissions and Identification of Biomass Burning. Atmosphere 2021, 12, 1401. [Google Scholar] [CrossRef]
- de Oliveira Alves, N.; Brito, J.; Caumo, S.; Arana, A.; de Souza Hacon, S.; Artaxo, P.; Hillamo, R.; Teinilä, K.; Batistuzzo de Medeiros, S.R.; de Castro Vasconcellos, P. Biomass Burning in the Amazon Region: Aerosol Source Apportionment and Associated Health Risk Assessment. Atmos. Environ. 2015, 120, 277–285. [Google Scholar] [CrossRef]
- INEMAR - ARPA Lombardia. INEMAR, Inventario Emissioni in Atmosfera: emissioni in regione Lombardia nell'anno 2023. ARPA Lombardia Settore Monitoraggi Ambientali 2025. [Google Scholar]
- Yang, D.; Li, M.; Liu, H. A Parallel Computing Algorithm for the Emergency-Oriented Atmospheric Dispersion Model CALPUFF. Atmosphere 2022, 13, 2129. [Google Scholar] [CrossRef]
- Ferrari, F.; Maffeis, G.; Flemming, J.; Gianfreda, R. UTAQ, A TOOL TO MANAGE THE SEVERE AIR POLLUTION EPISODES. Environ. Eng. Manag. J. 2020, 19, 1915–1926. [Google Scholar] [CrossRef]
- European Parliament; Council of the European Union. Directive (EU) 2024/2881 of the European Parliament and of the Council of 23 October 2024 on Ambient Air Quality and Cleaner Air for Europe (Recast). Off. J. Eur. Union 2024, L 2024/2881. Available online: https://eur-lex.europa.eu/eli/dir/2024/2881/oj (accessed on 26 July 2026).
- Guerreiro, C.B.B.; Horálek, J.; de Leeuw, F.; Couvidat, F. Benzo(a)Pyrene in Europe: Ambient Air Concentrations, Population Exposure and Health Effects. Environ. Pollut. 2016, 214, 657–667. [Google Scholar] [CrossRef] [PubMed]
- Jedynska, A.; Hoek, G.; Wang, M.; Eeftens, M.; Cyrys, J.; Beelen, R.; Cirach, M.; De Nazelle, A.; Keuken, M.; Visschedijk, A.; et al. Spatial Variations of Levoglucosan in Four European Study Areas. Sci. Total Environ. 2015, 505, 1072–1081. [Google Scholar] [CrossRef] [PubMed]
- OpenStreetMap Contributors. OpenStreetMap [Database]. Available online: https://www.openstreetmap.org (accessed on May 2026).
- The Data Appeal S.p.A. Business Intelligence Data for Italy [Dataset, accessed under commercial licence]; The Data Appeal S.p.A.: Florence, Italy, 2026. [Google Scholar]
- Google LLC. Google Places API [Web Service]. Available online: https://developers.google.com/maps/documentation/places/web-service (accessed on May 2026).
- InfoCamere. PARIX - Accesso Nativo al Registro Imprese [Database, available upon application]; InfoCamere: Rome, Italy, 2026. [Google Scholar]
- Azienda regionale per l’Innovazione e gli Acquisti S.p.A. (ARIA) Open Data. CURIT (Catasto Unico Regionale degli Impianti Termici). Available online: https://www.curit.it/it_IT/opendata (accessed on 2 September 2026).
- Marongiu, A.; Angelino, E.; Malvestiti, G.; Moretti, M.; Fossati, G.; Peroni, E. Emission Estimates and Air Quality Simulation on Lombardy during Lockdown. Air Qual. Atmos. Health 2023, 16, 61–75. [Google Scholar] [CrossRef] [PubMed]
- UNI. UNI EN 12341:2014; Ambient Air. Standard Gravimetric Measurement Method for the Determination of the PM10 or PM2.5 Mass Concentration of Suspended Particulate Matter. Ente Italiano di Normazione (UNI): Milan, Italy, 2014.
- UNI. UNI EN 14211:2012; Ambient Air Quality. Standard Method for the Measurement of the Concentration of Nitrogen Dioxide and Nitrogen Monoxide by Chemiluminescence. Ente Italiano di Normazione (UNI): Milan, Italy, 2012.
- Reizer, E.; Csizmadia, I.G.; Nehéz, K.; Viskolcz, B.; Fiser, B. Theoretical Investigation of Benzo(a)Pyrene Formation. Chem. Phys. Lett. 2021, 772, 138564. [Google Scholar] [CrossRef]
- Yang, G.; Wang, L.; Jiang, X.; Fang, Q.; Peng, Y.; Wen, W.; Yang, Q.; Yu, Y.; Liu, J. Benzo[a]Pyrene Carcinogenicity across Organs and Cancer Stages: Molecular Mechanisms and Interactions with Co-Exposed Chemicals. Environ. Pollut. 2026, 406, 128650. [Google Scholar] [CrossRef] [PubMed]
- European Parliament; Council of the European Union. Directive 2008/50/EC of the European Parliament and of the Council of 21 May 2008 on Ambient Air Quality and Cleaner Air for Europe. Off. J. Eur. Union 2008, L 152, 1–44. Available online: https://eur-lex.europa.eu/eli/dir/2008/50/oj (accessed on 30 July 2026).
- UNI. UNI EN 15549:2008; Air Quality. Standard Method for the Measurement of the Concentration of Benzo[a]pyrene in Ambient Air. Ente Italiano di Normazione (UNI): Milan, Italy, 2008.
- Ministero dell'Ambiente e della Tutela del Territorio e del Mare. Decreto 30 Marzo 2017. Procedure di Garanzia di Qualità per Verificare il Rispetto della Qualità delle Misure dell'Aria Ambiente, Effettuate nelle Stazioni delle Reti di Misura. Gazz. Uff. Rep. Ital. 2017 2017, 96. [Google Scholar]
- LIFE PREPAIR Project. Air Quality and Emission Evaluation. Available online: https://www.lifeprepair.eu/index.php/actions/air-quality-and-emission-evaluation/?lang=en (accessed on 26 August 2026).
- Norris, G.; Duvall, R.; Brown, S.; Bai, S. EPA/600/R-14/108; EPA Positive Matrix Factorization (PMF) 5.0 Fundamentals and User Guide. U.S. Environmental Protection Agency, Office of Research and Development: Washington, DC, USA, 2014.
- Granella, F.; Renna, S.; Aleluia Reis, L. The Formation of Secondary Inorganic Aerosols: A Data-Driven Investigation of Lombardy’s Secondary Inorganic Aerosol Problem. Atmos. Environ. 2024, 327, 120480. [Google Scholar] [CrossRef]
- Copernicus Atmosphere Monitoring Service (CAMS). Policy Support Tool: Country and City Impact Assessment, Milan, 2023. Available online: https://policy.atmosphere.copernicus.eu/yearly/country-impact/?city=Milano&year=2023 (accessed on 01 August 2026).
- Hennigan, C.J.; Sullivan, A.P.; Collett, J.L.; Robinson, A.L. Levoglucosan Stability in Biomass Burning Particles Exposed to Hydroxyl Radicals. Geophys. Res. Lett. 2010, 37, L09806. [Google Scholar] [CrossRef]
- Szramowiat-Sala, K.; Marczak-Grzesik, M.; Karczewski, M.; Kistler, M.; Giebl, A.K.; Styszko, K. Chemical Investigation of Polycyclic Aromatic Hydrocarbon Sources in an Urban Area with Complex Air Quality Challenges. Sci. Rep. 2025, 15, 6987. [Google Scholar] [CrossRef] [PubMed]
- Harrison, R.M. Urban Atmospheric Chemistry: A Very Special Case for Study. npj Clim. Atmos. Sci. 2018, 1, 20175. [Google Scholar] [CrossRef]
- Thunis, P.; Degraeuwe, B.; Pisoni, E.; Trombetti, M.; Peduzzi, E.; Belis, C.A.; Wilson, J.; Clappier, A.; Vignati, E. PM2.5 Source Allocation in European Cities: A SHERPA Modelling Study. Atmos. Environ. 2018, 187, 93–106. [Google Scholar] [CrossRef]
- Maffeis, G. Prediction of carbon monoxide acute air pollution episodes. Model formulation and "rst application in Lombardy. Atmos. Environ. 1999, 33, 3859–3872. [Google Scholar] [CrossRef]
- Piccoli, A.; Agresti, V.; Lonati, G.; Pirovano, G. Development and Evaluation of the Online Hybrid Model CAMx-LPiG. Atmosphere 2025, 16, 604. [Google Scholar] [CrossRef]
Figure 1.
Meteorological domain, land use, and main structure networks of the Municipality of Milan.
Figure 1.
Meteorological domain, land use, and main structure networks of the Municipality of Milan.
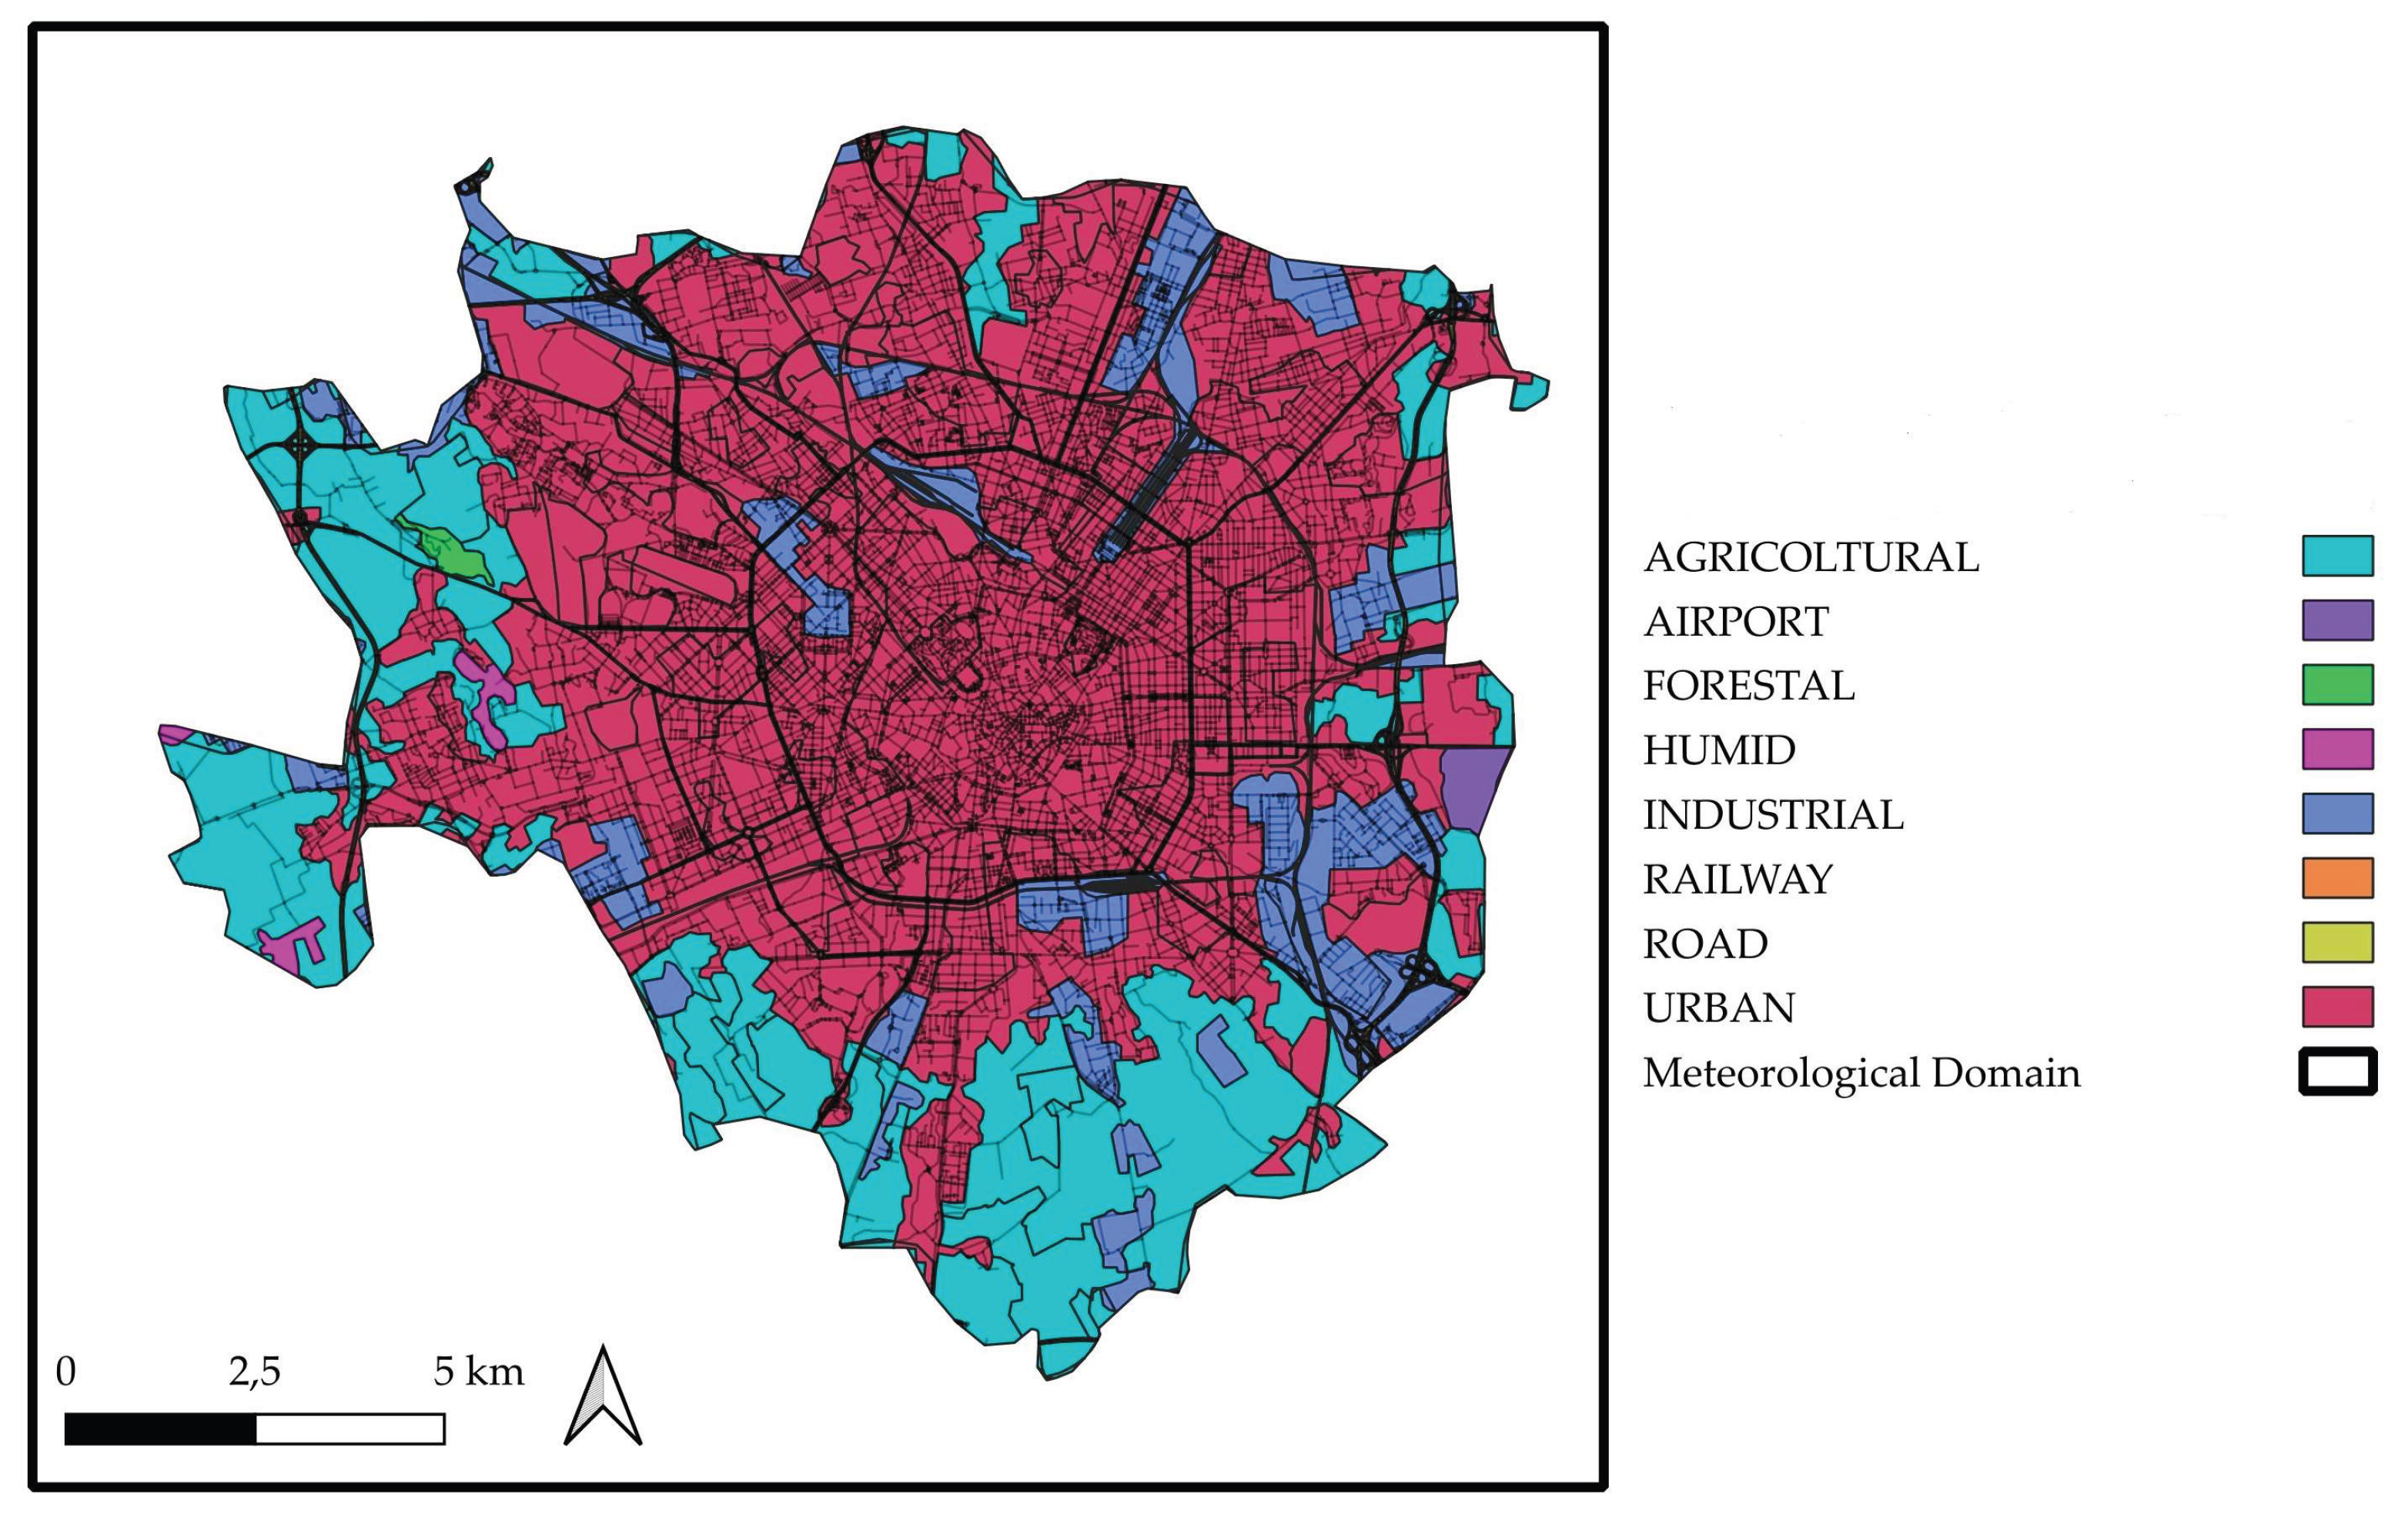
Figure 2.
Contribution of wood-fired pizza ovens to total emissions in Milan and Lombardy, according to the INEMAR 2023 emission inventory.
Figure 2.
Contribution of wood-fired pizza ovens to total emissions in Milan and Lombardy, according to the INEMAR 2023 emission inventory.
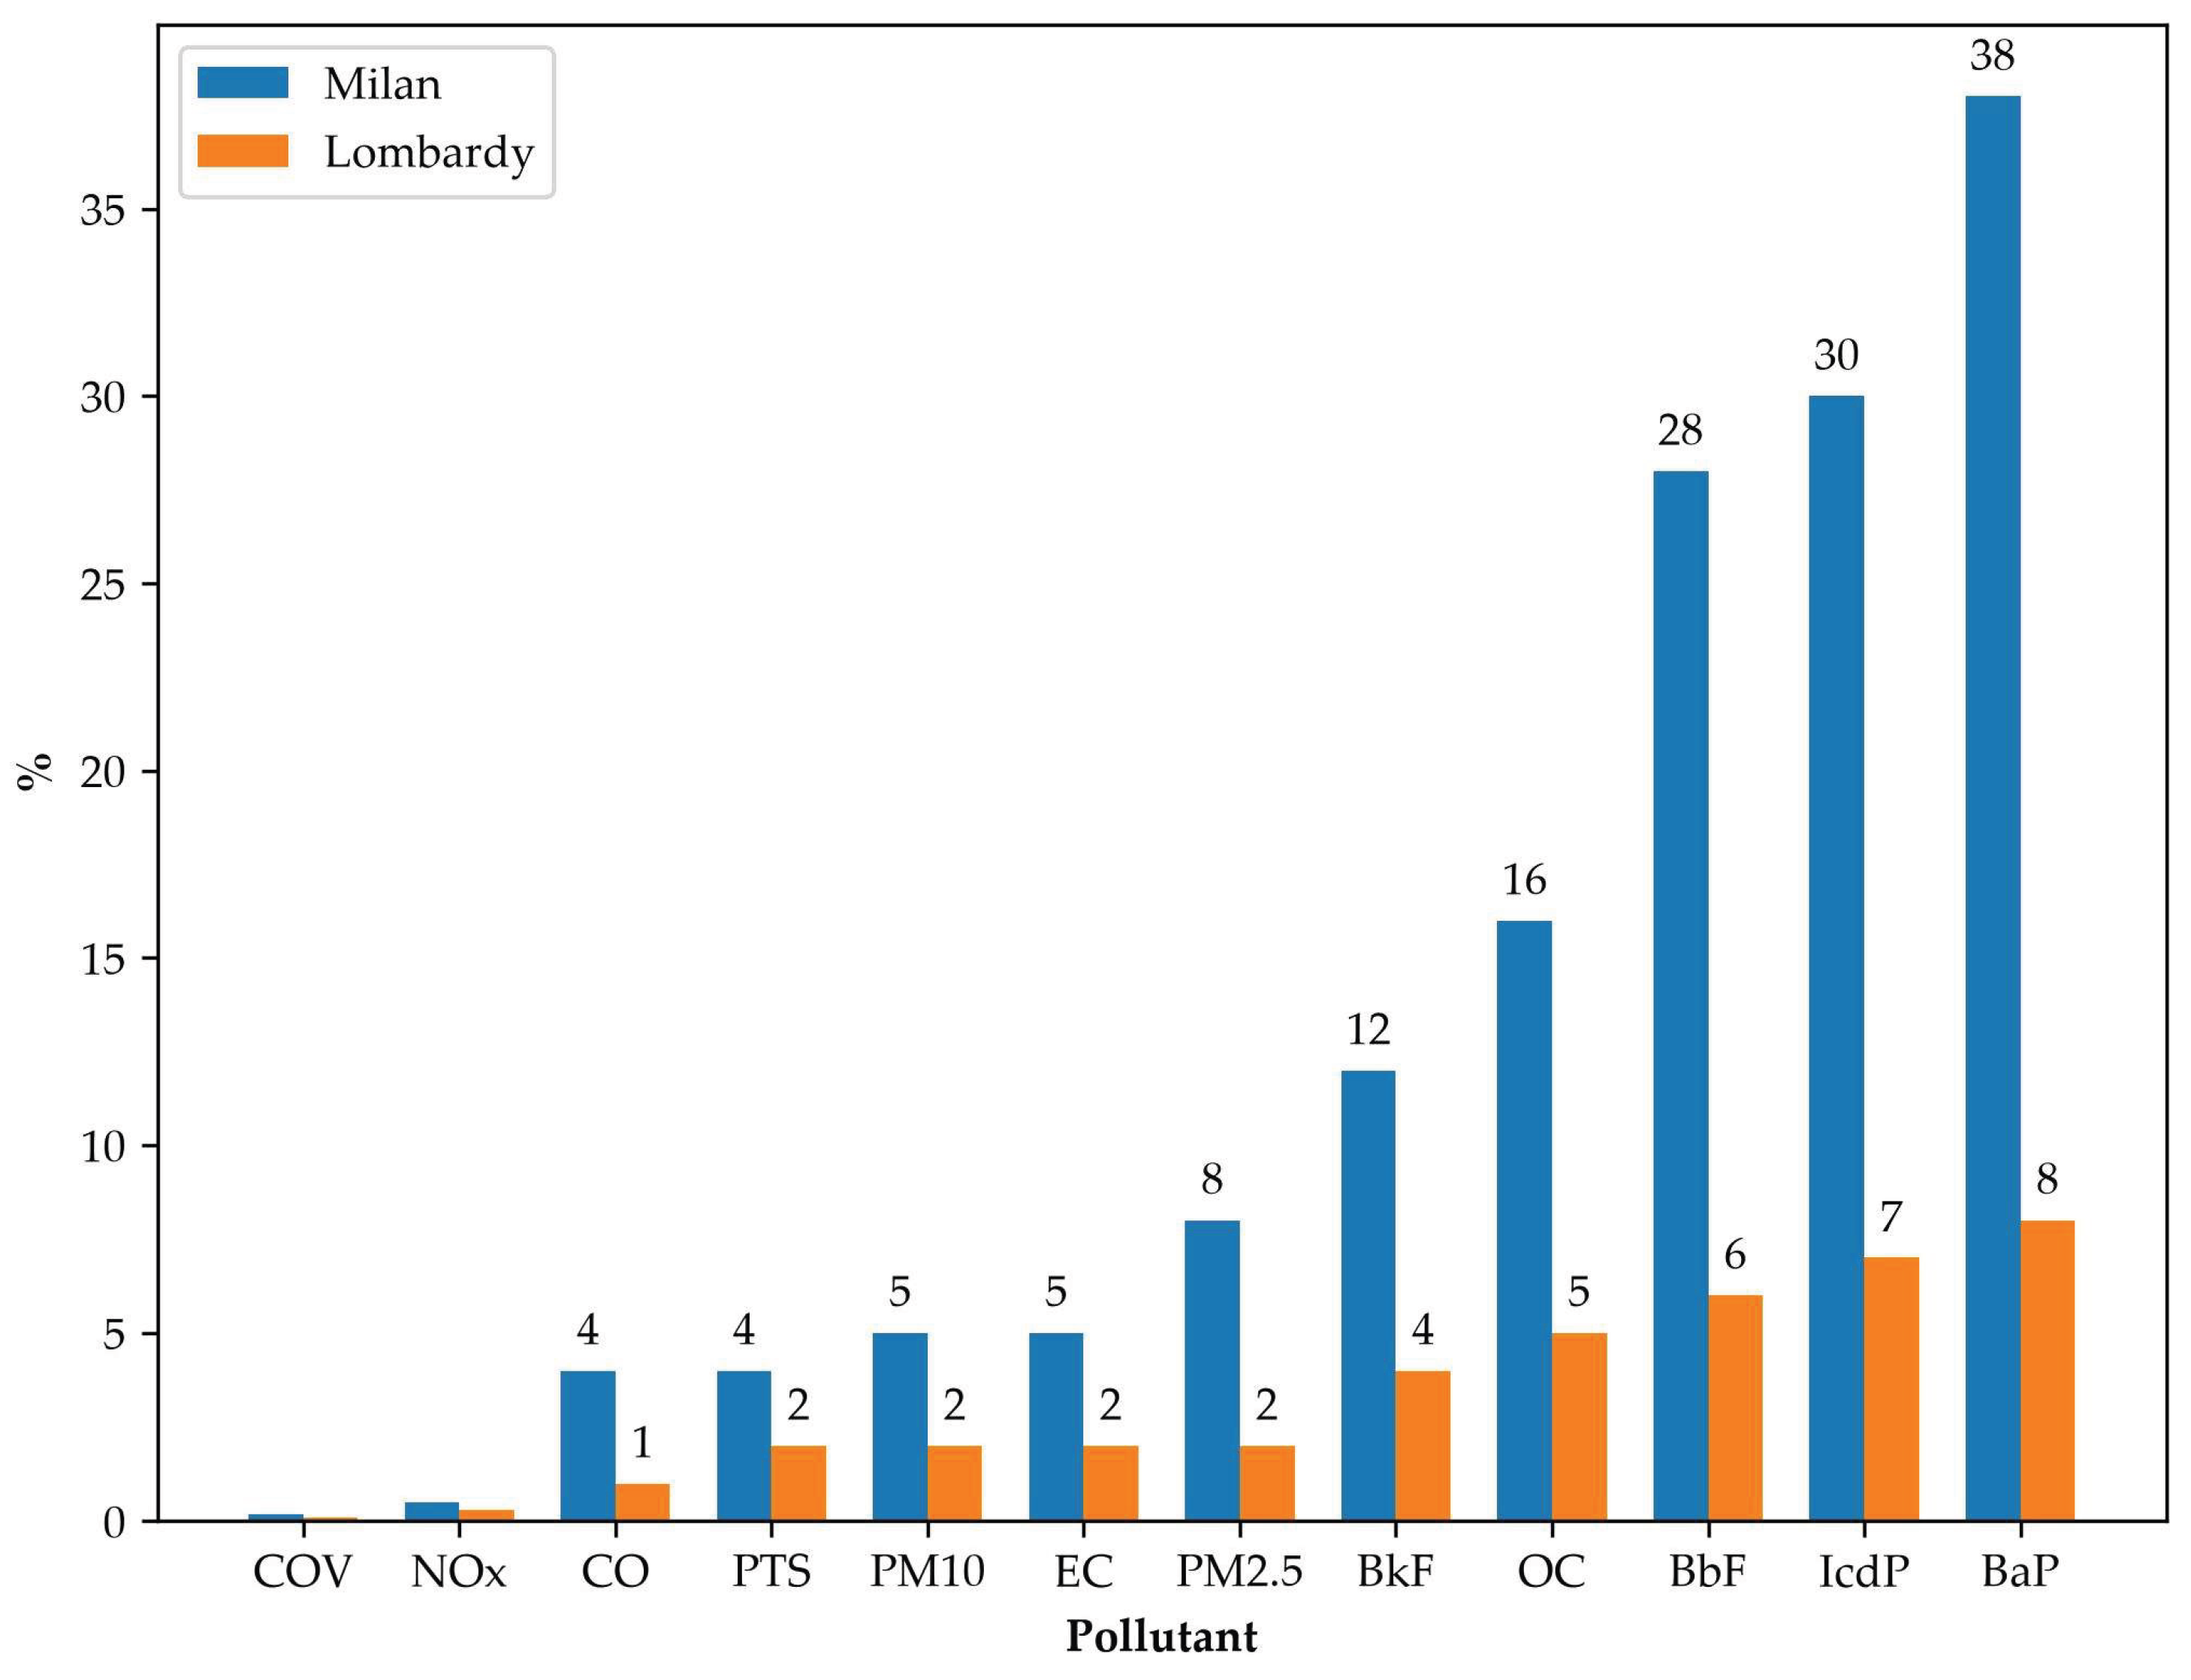
Figure 3.
Modulation factors (dimensionless) describing the temporal emission profiles of heating systems (a), road traffic (b), and wood-fired ovens (b).
Figure 3.
Modulation factors (dimensionless) describing the temporal emission profiles of heating systems (a), road traffic (b), and wood-fired ovens (b).
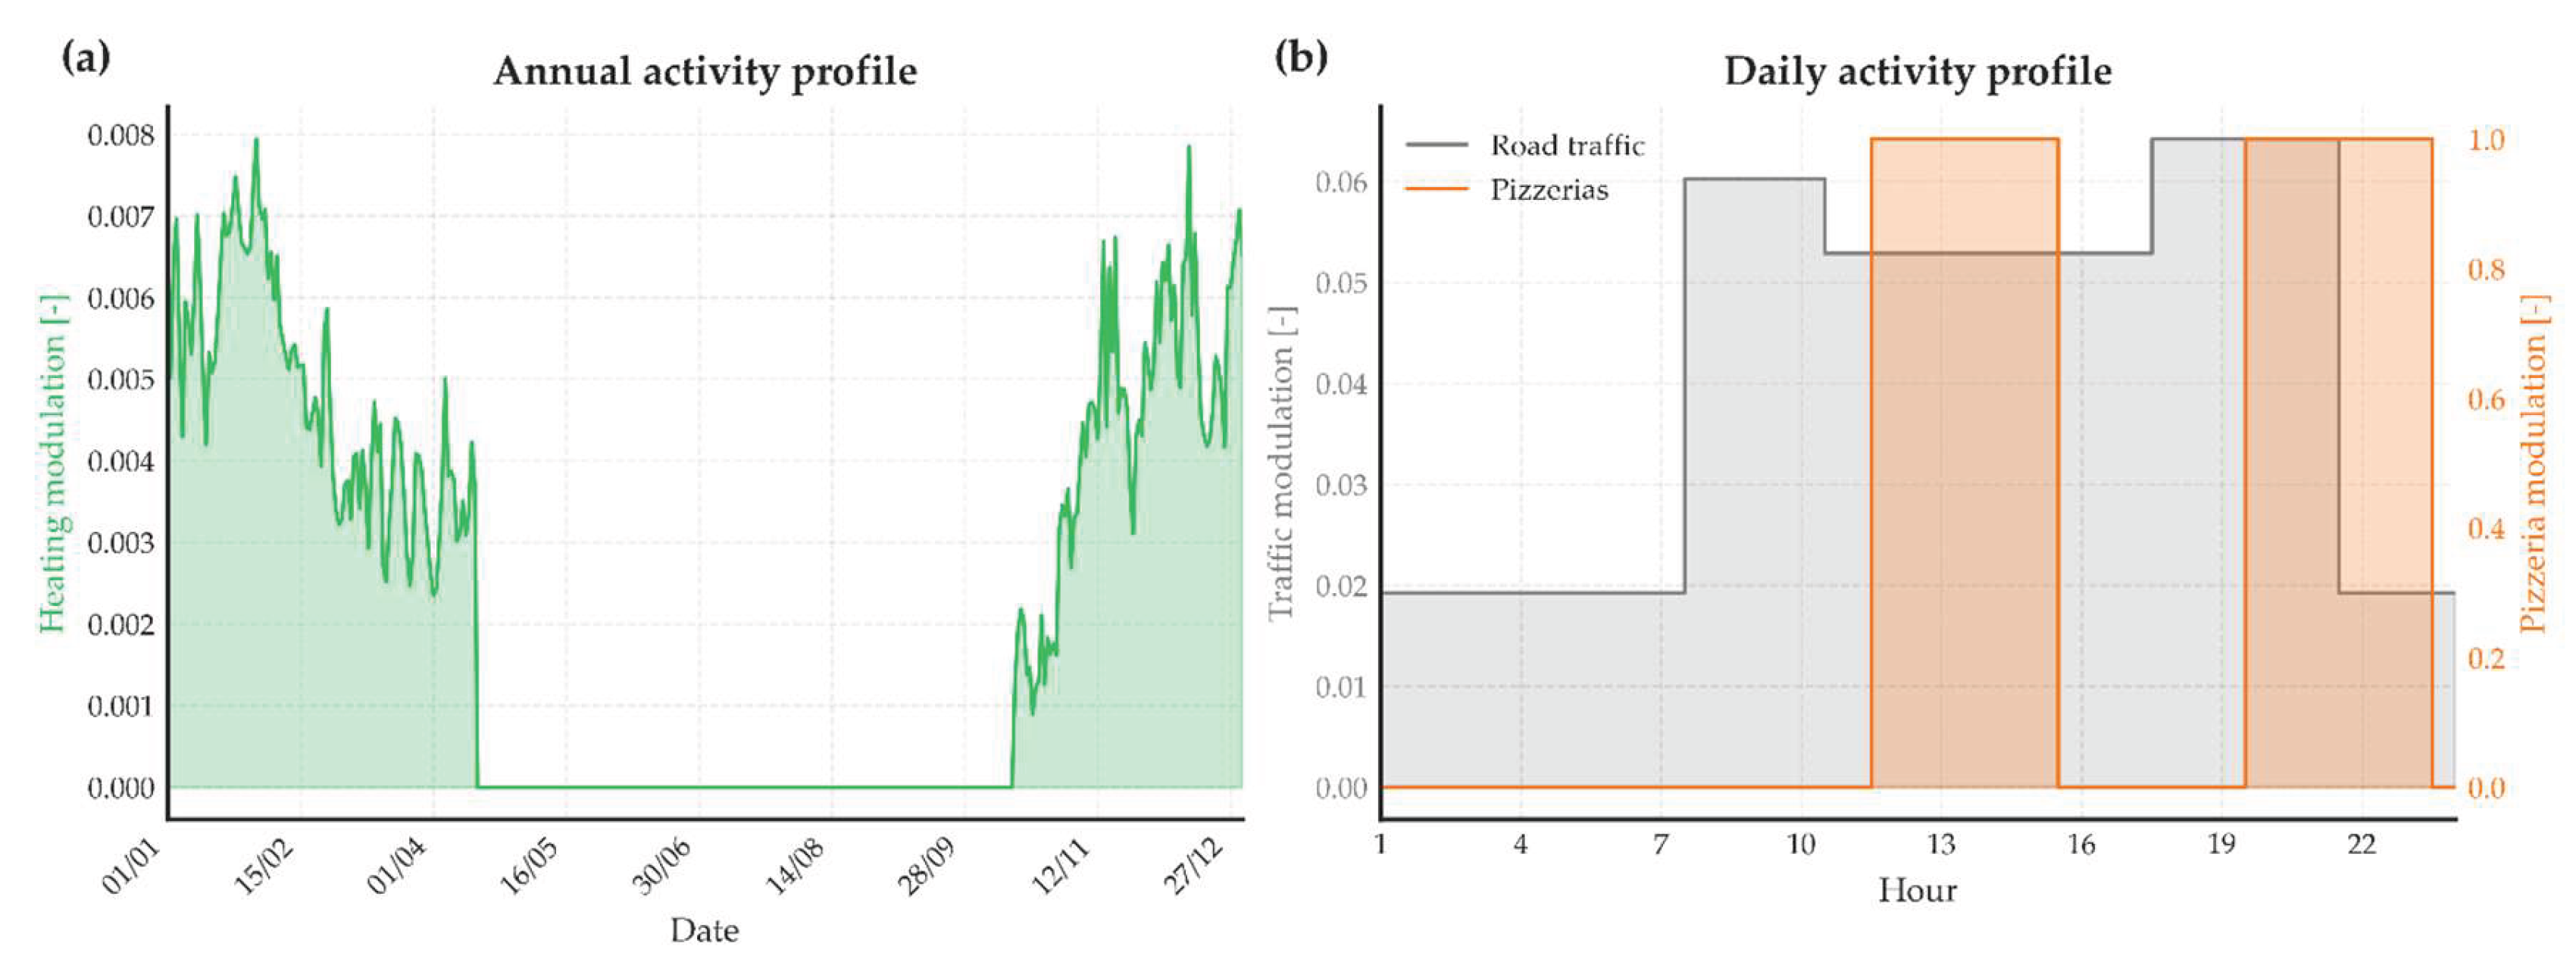
Figure 4.
Location of the five ARPA air quality monitoring stations within the Municipality of Milan.
Figure 4.
Location of the five ARPA air quality monitoring stations within the Municipality of Milan.
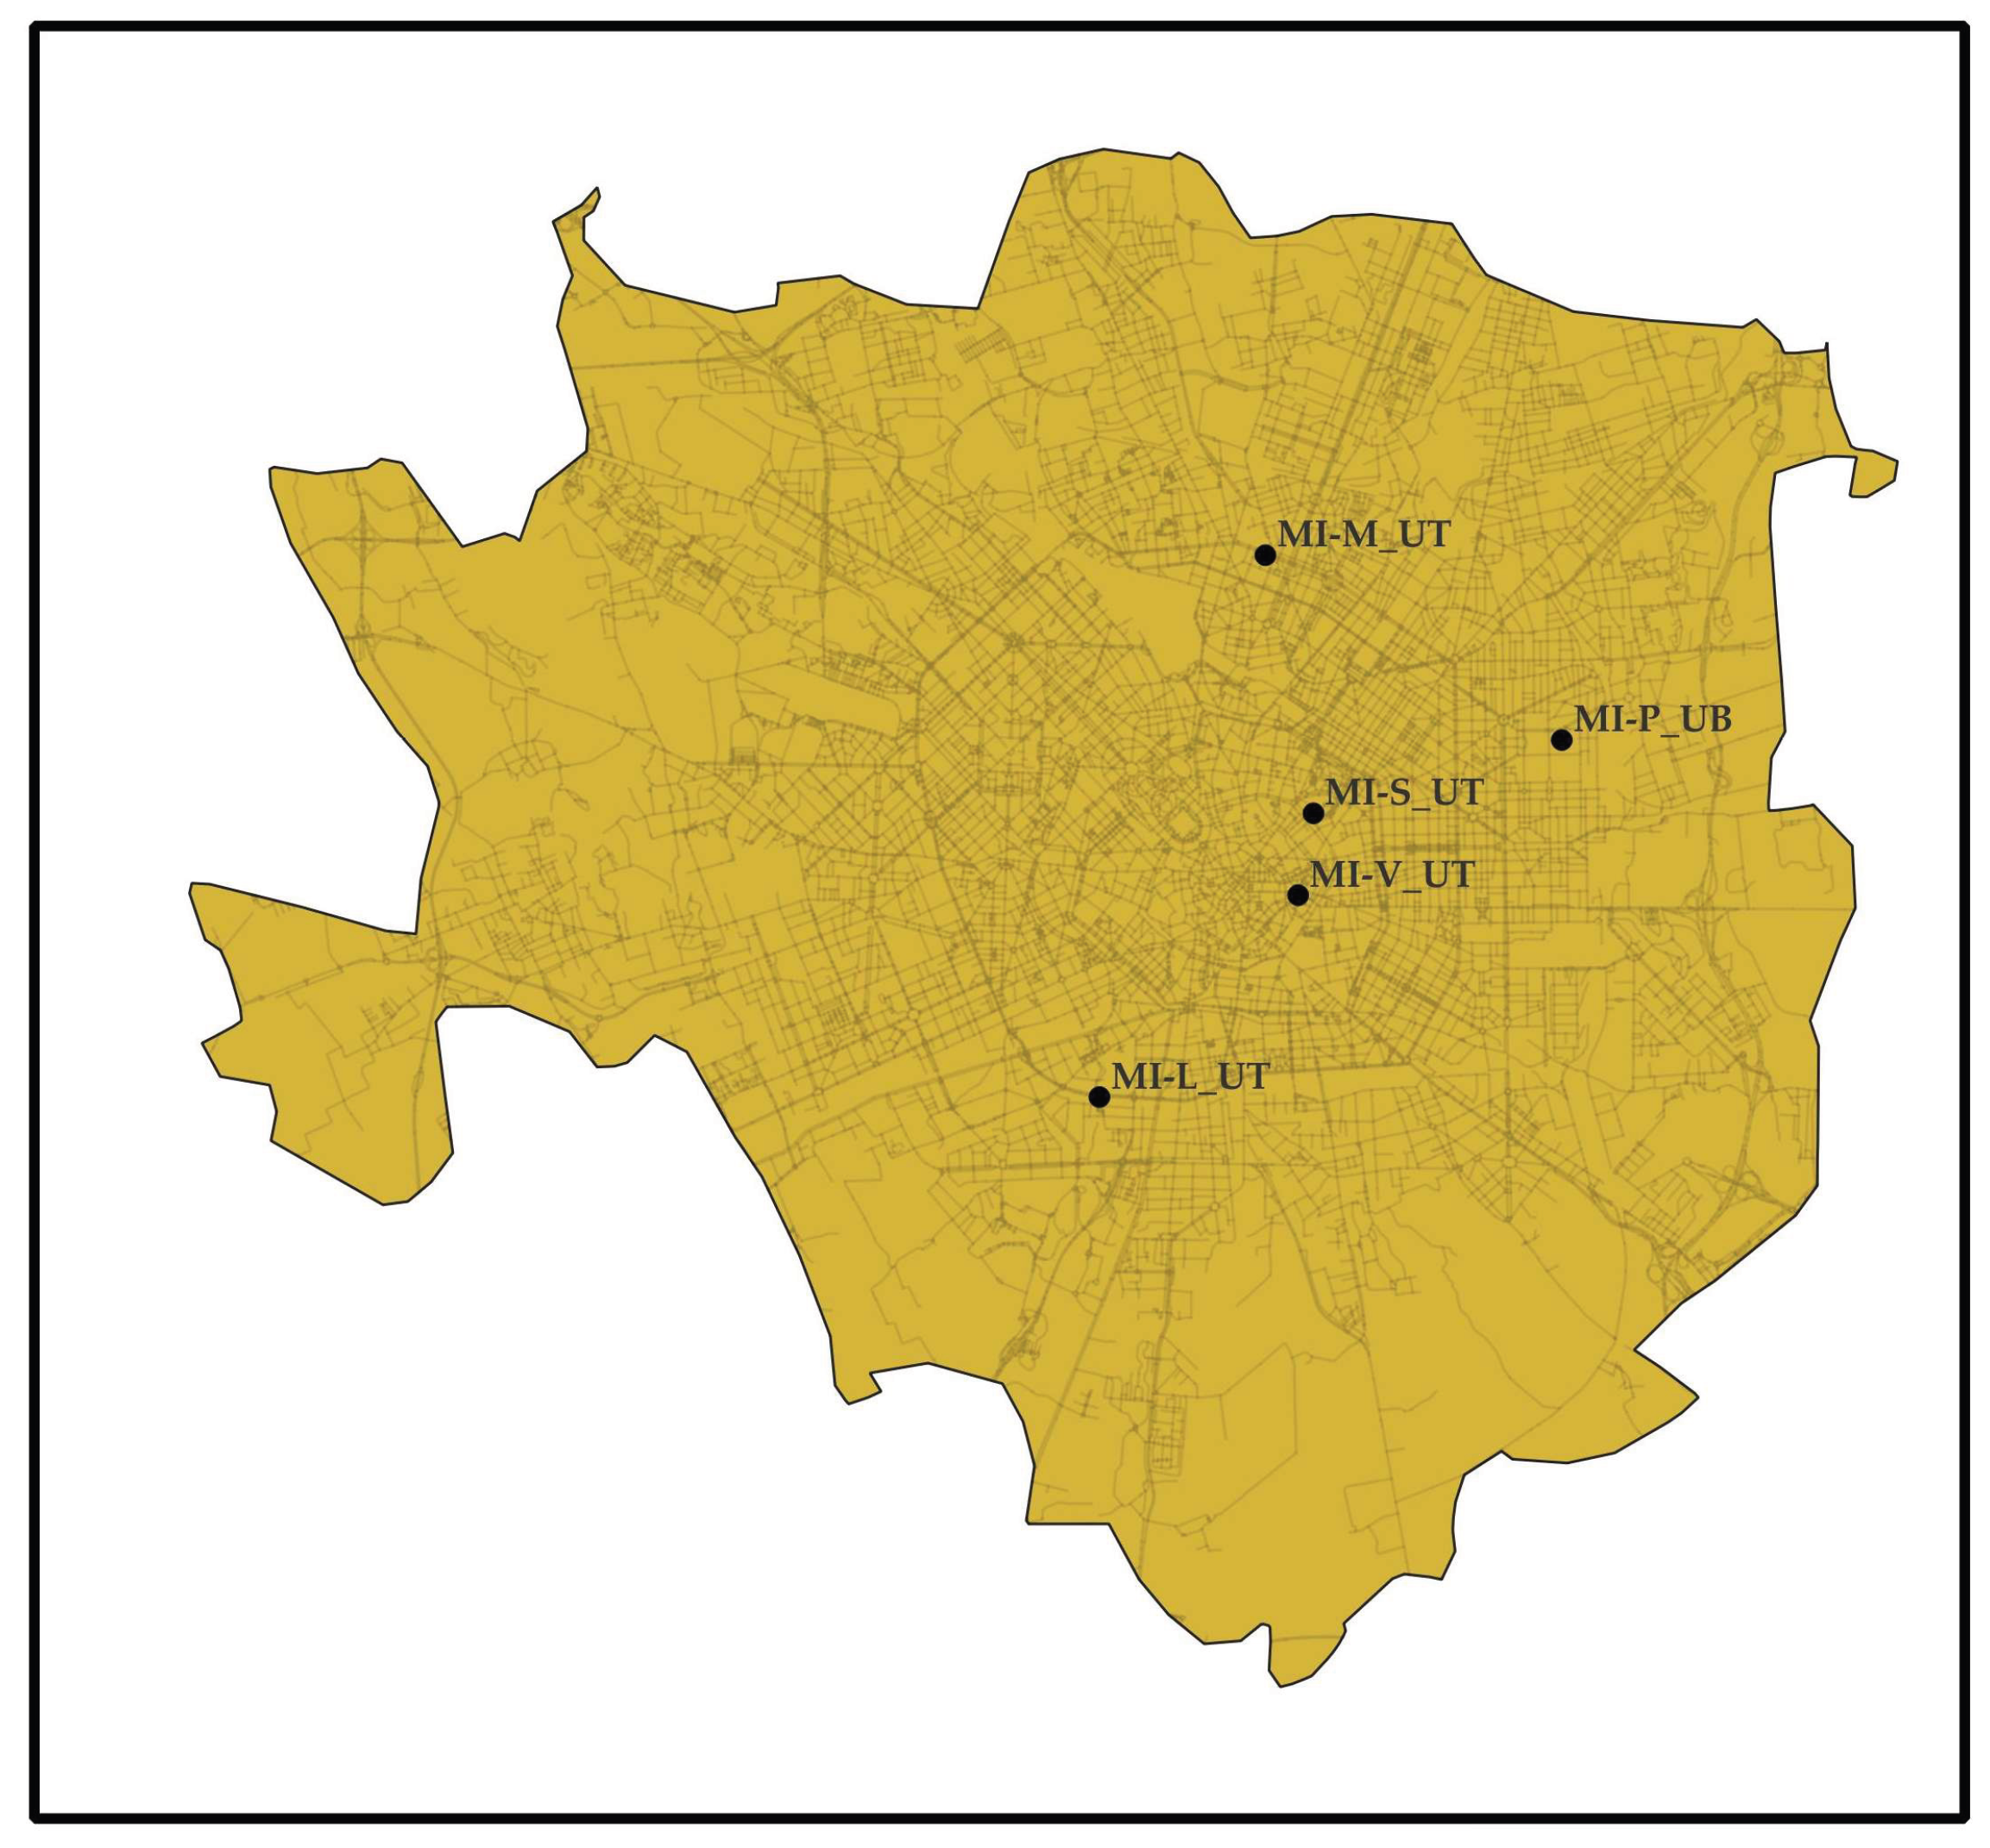
Figure 5.
Integrated methodology estimating the impact of wood-fired pizza oven emissions on urban environments.
Figure 5.
Integrated methodology estimating the impact of wood-fired pizza oven emissions on urban environments.
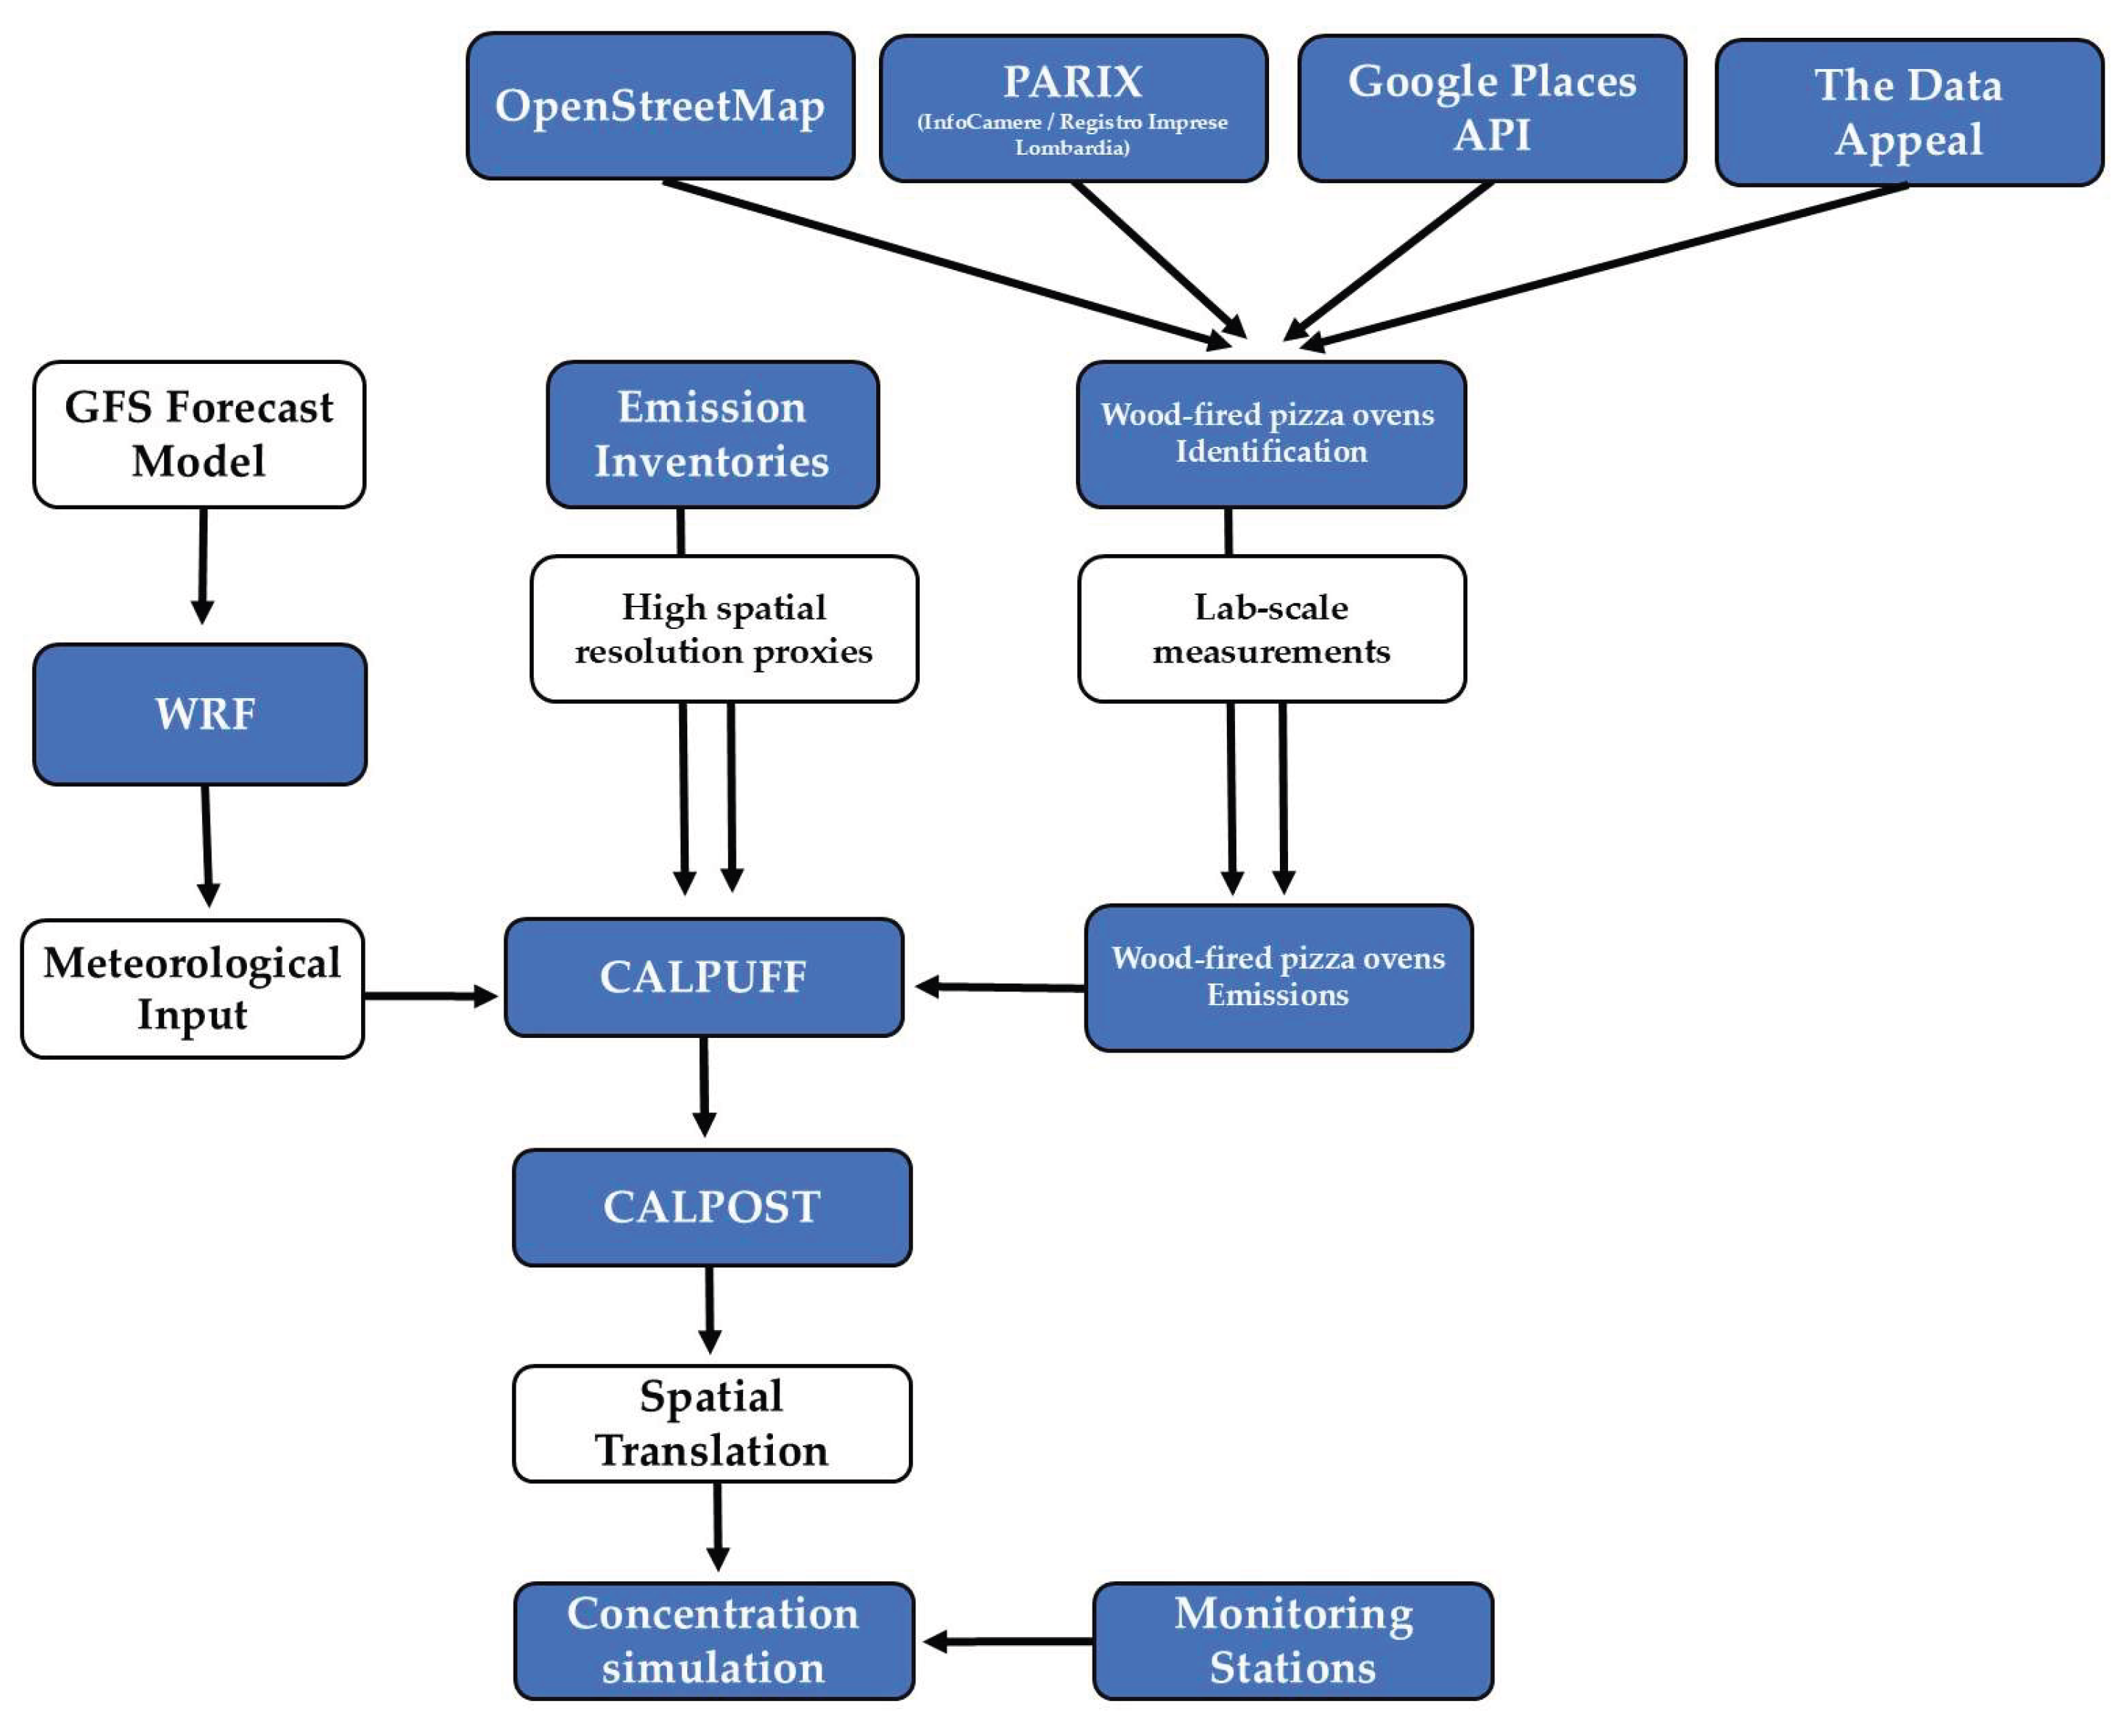
Figure 5.
Cell-by-cell comparison of the conventional and newly proposed models.
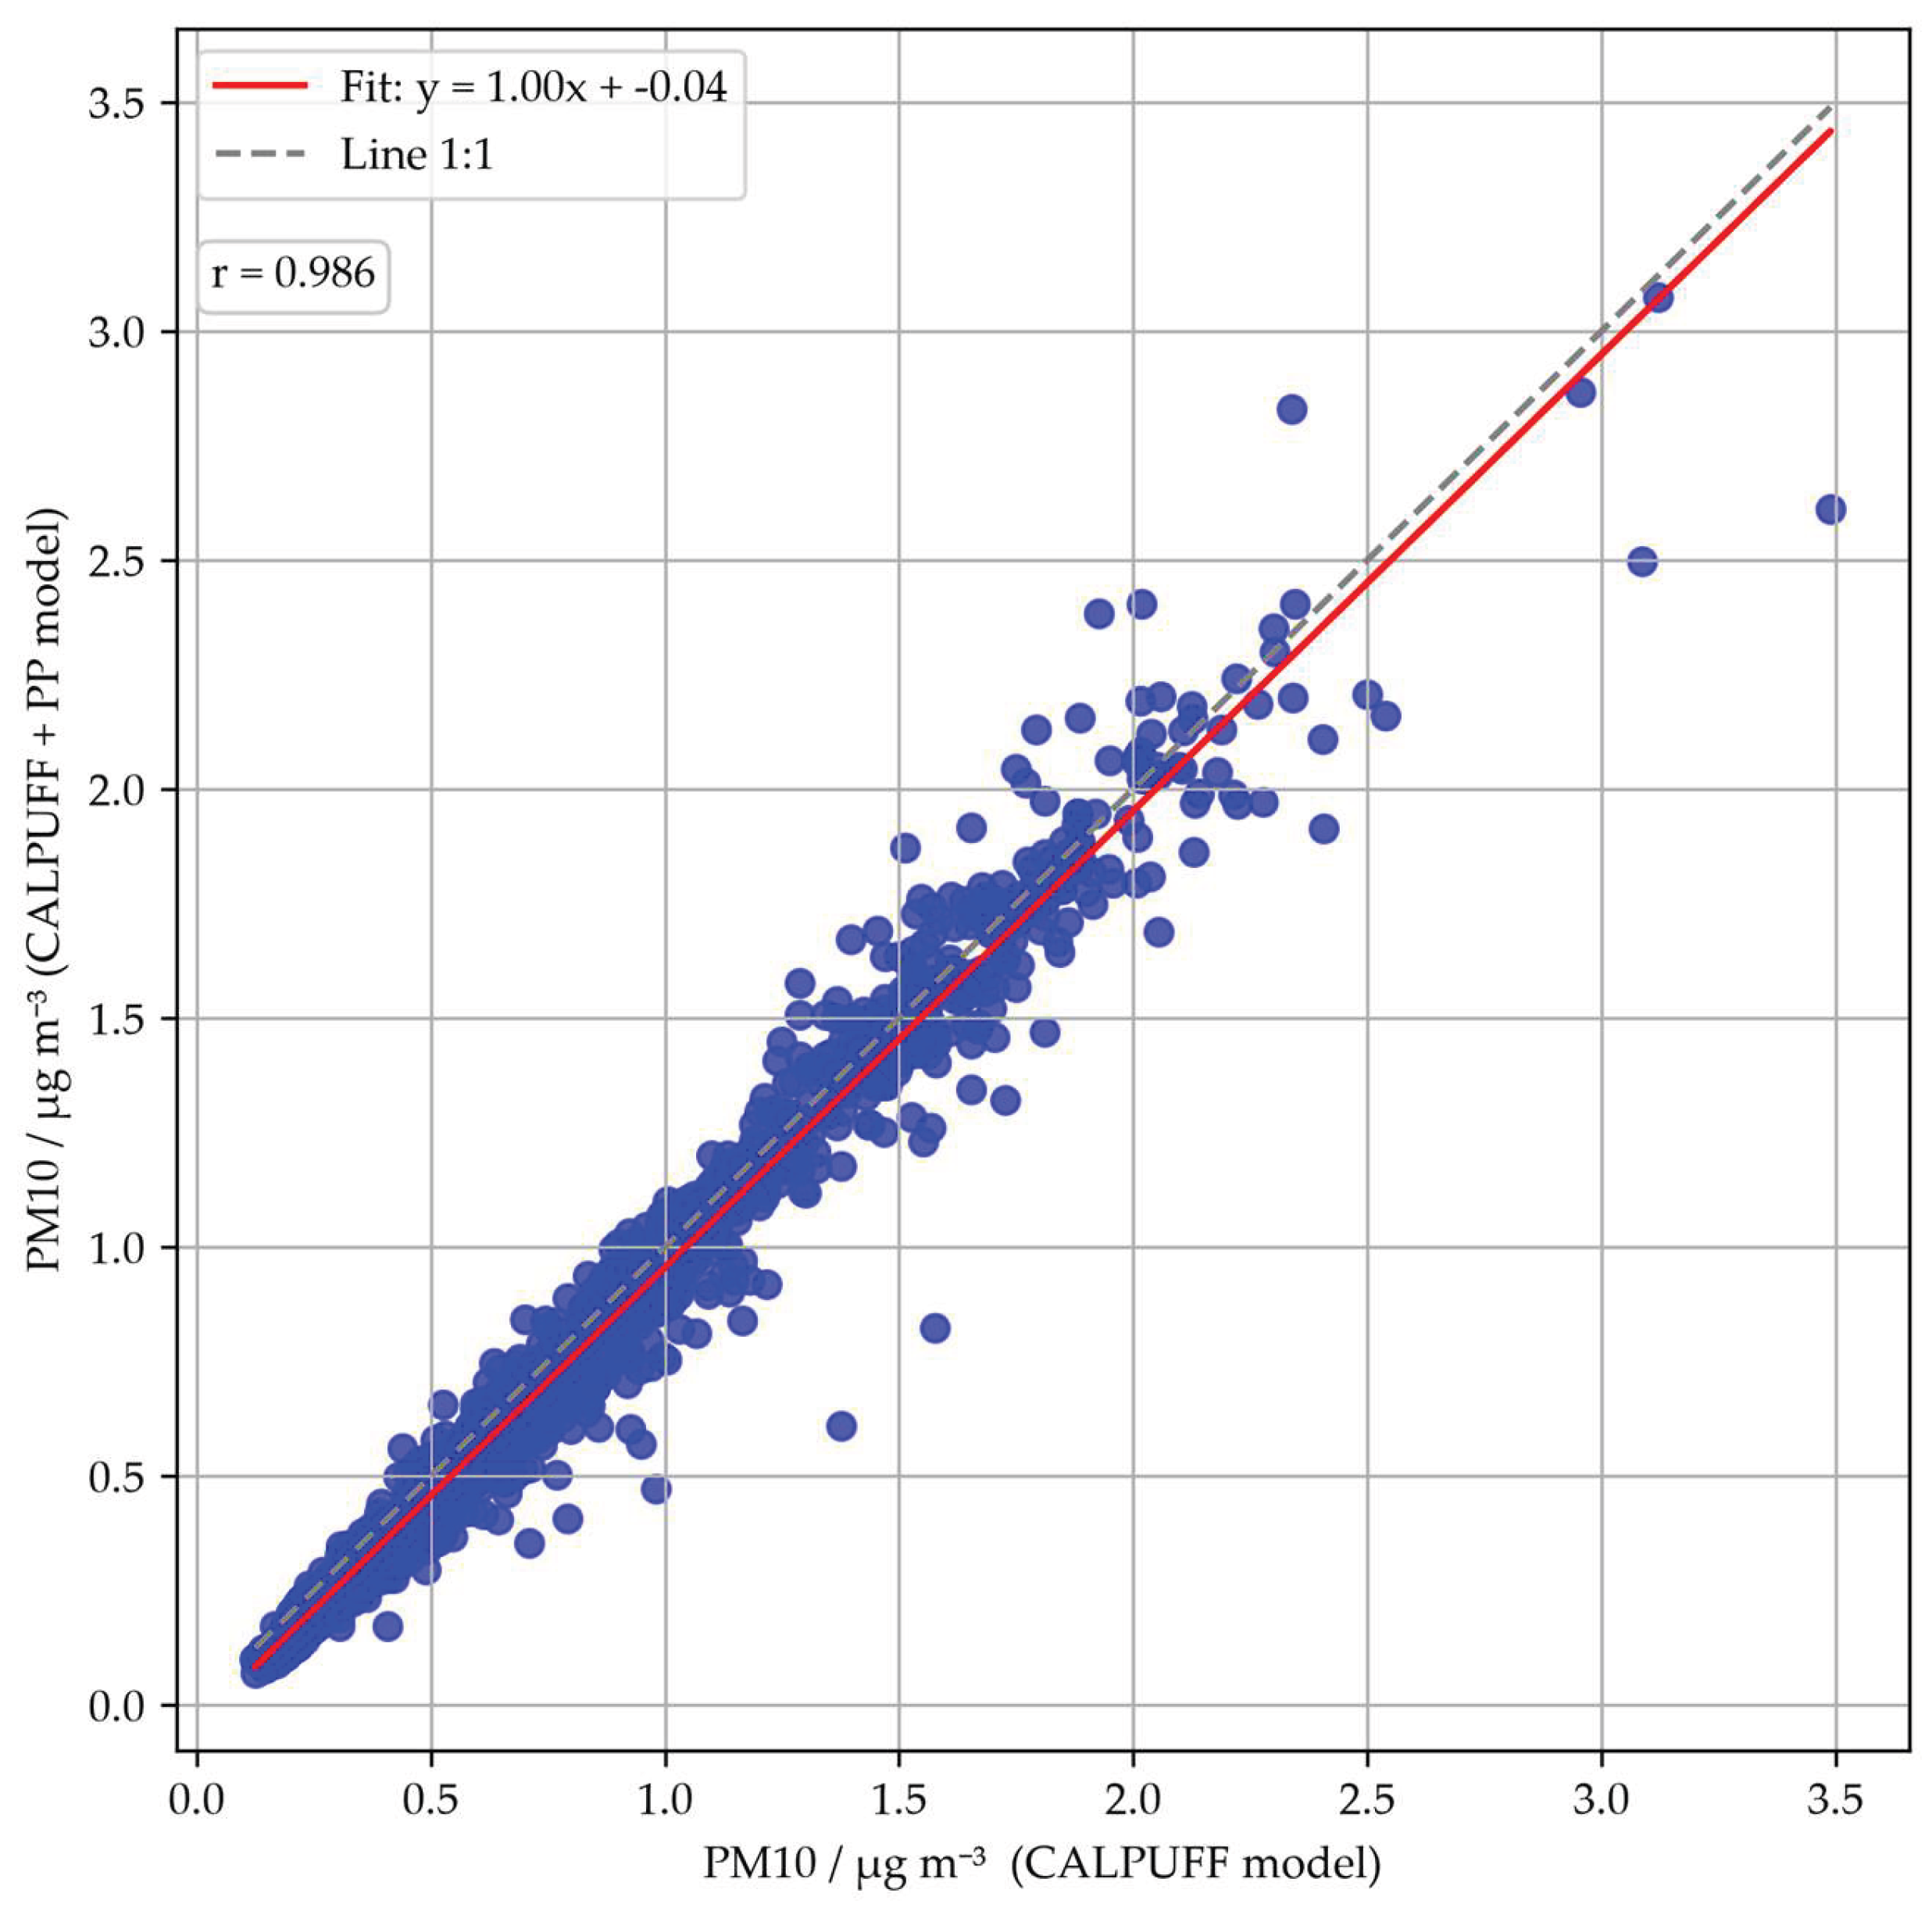
Figure 6.
Annual average simulated contributions of wood-fired pizza ovens, road traffic, and residential heating to ambient PM10, PM2.5, and NOx concentrations across the Municipality of Milan. Panels (a-c) show contributions to PM10 of pizza ovens, traffic, and heating, respectively; panels (d-f) show contributions to PM2.5 of the same sources; and panels (g-i) show contributions to NOx. Color scales represent the annual mean concentration attributable to each source category.
Figure 6.
Annual average simulated contributions of wood-fired pizza ovens, road traffic, and residential heating to ambient PM10, PM2.5, and NOx concentrations across the Municipality of Milan. Panels (a-c) show contributions to PM10 of pizza ovens, traffic, and heating, respectively; panels (d-f) show contributions to PM2.5 of the same sources; and panels (g-i) show contributions to NOx. Color scales represent the annual mean concentration attributable to each source category.
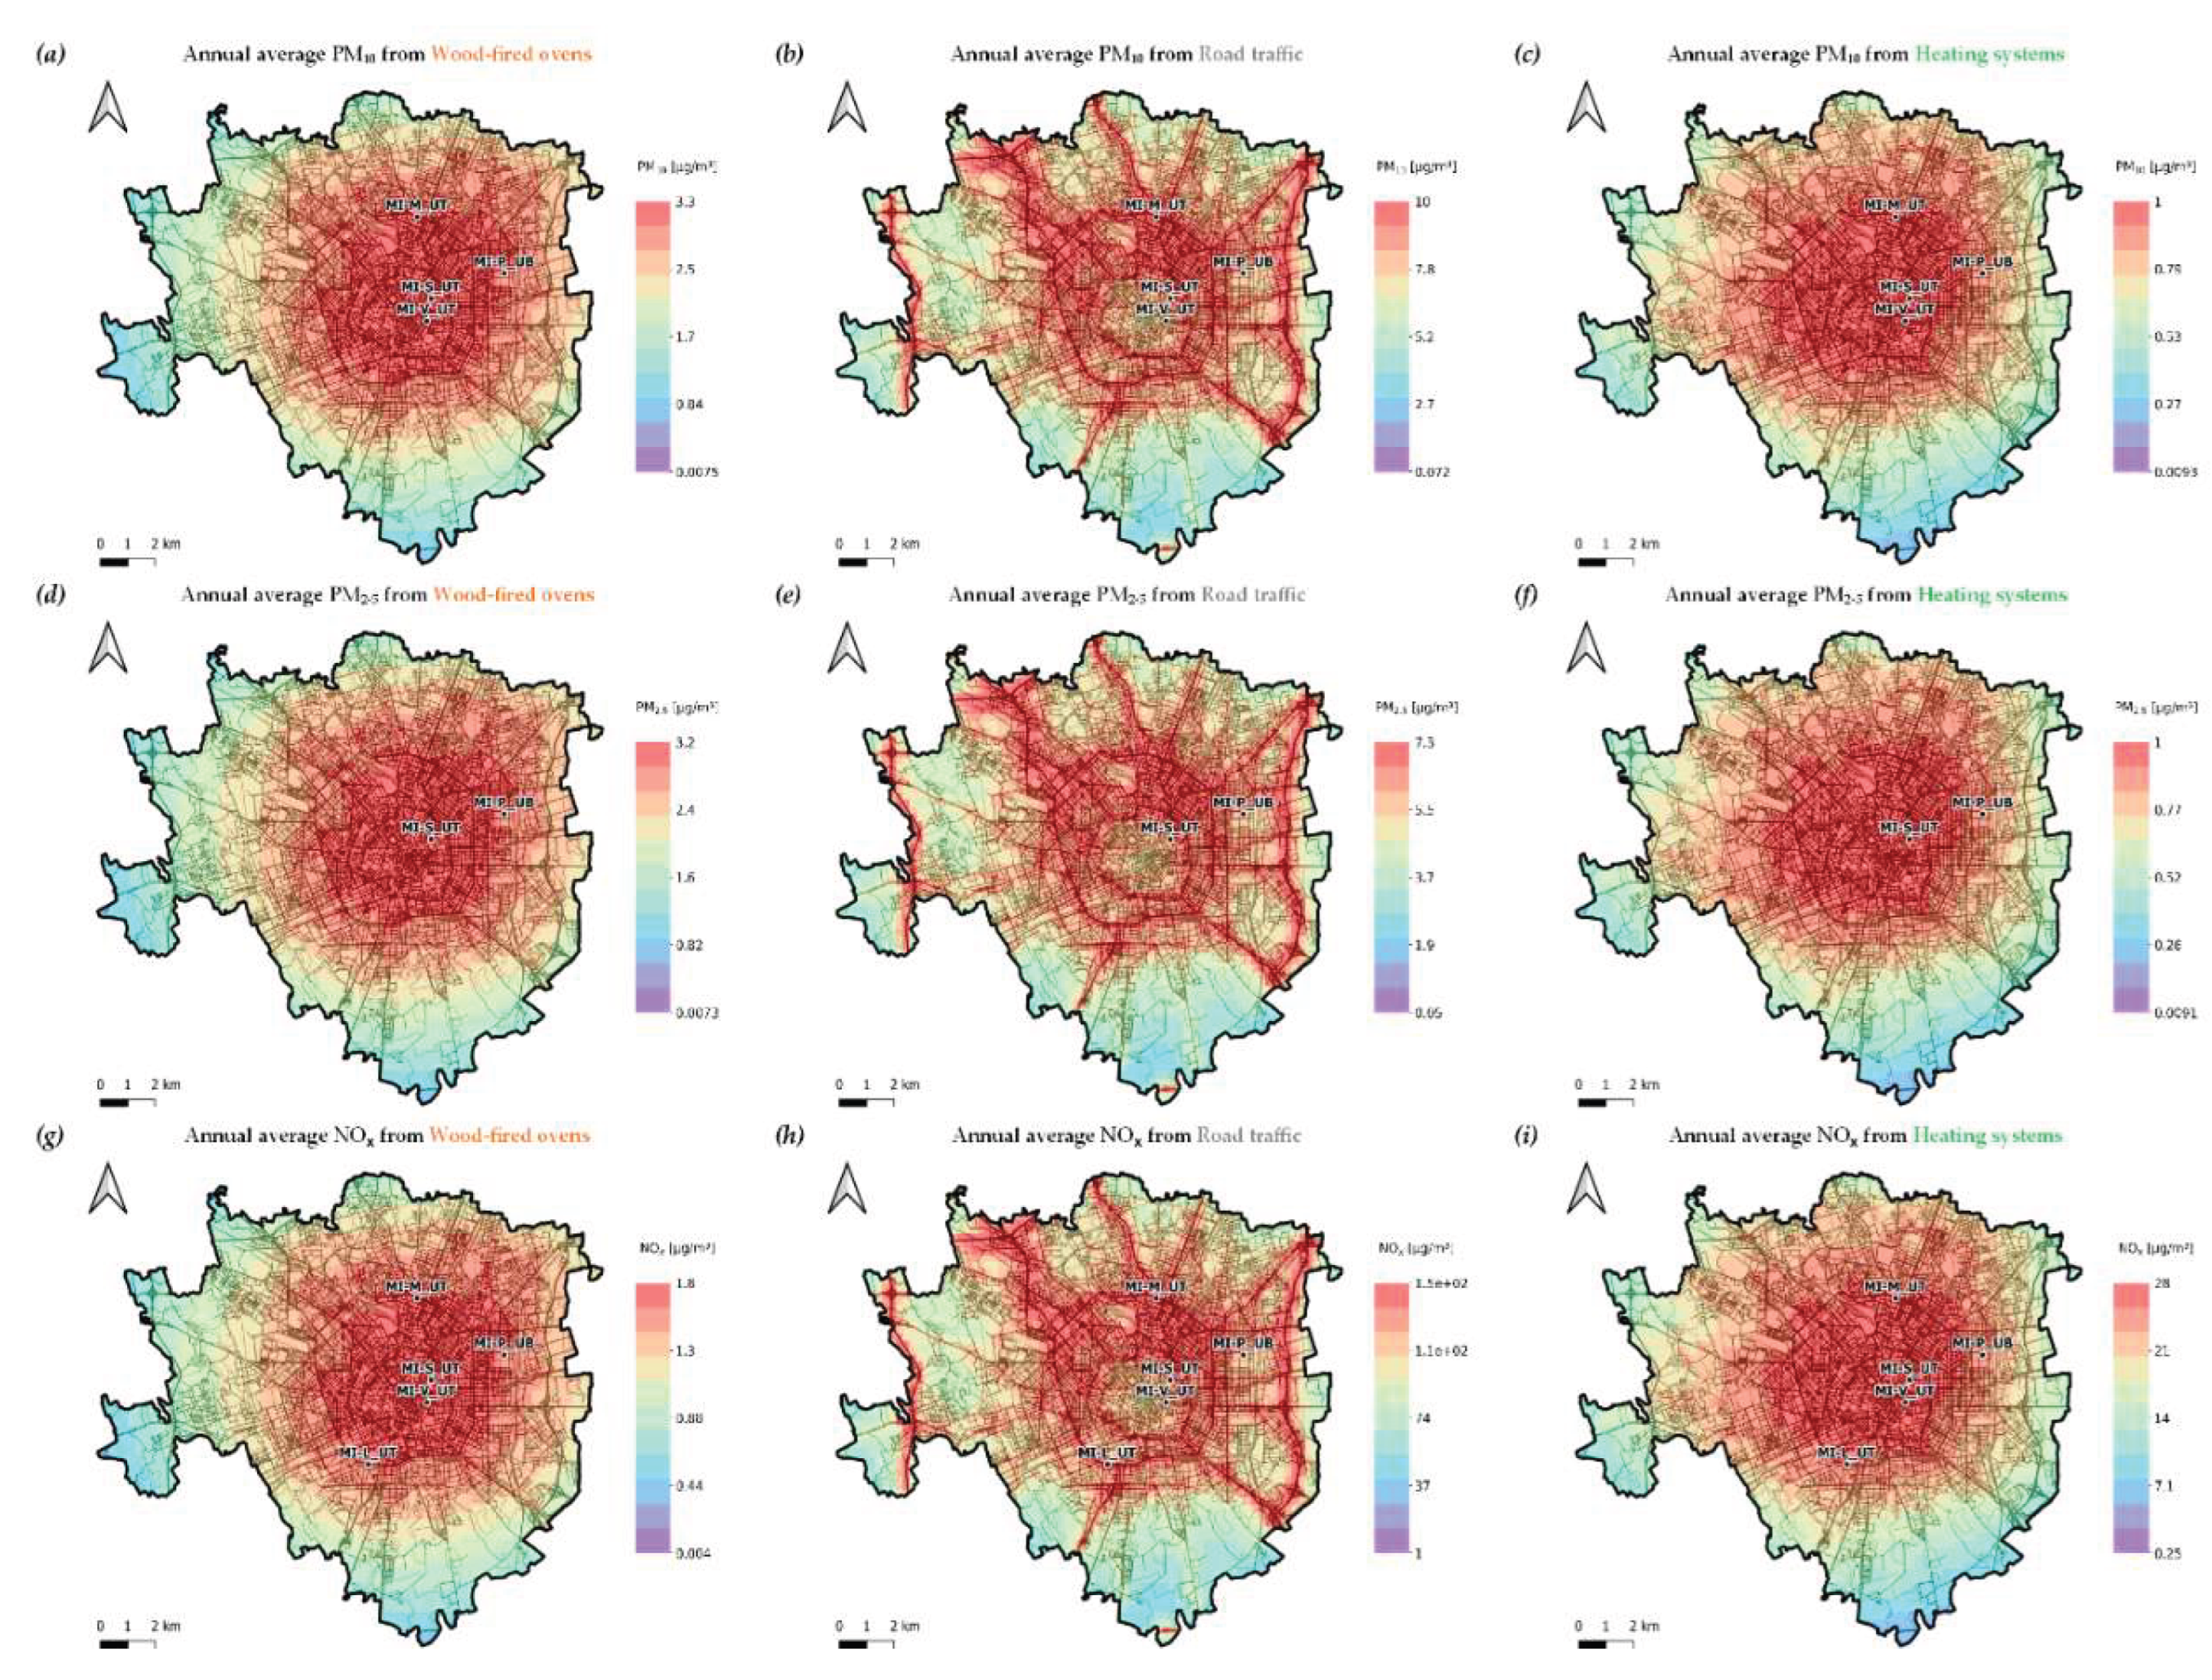
Figure 7.
a) Total (wood-fired ovens + road traffic + heating systems) simulated and observed NOx concentrations at the MI-P_UB monitoring station; b) correlation between simulated and observed NOx concentrations; c) simulated contribution of wood-fired ovens, road traffic, and heating systems to total NOx concentrations ; d) monthly simulated contribution of wood-fired ovens, road traffic and heating systems.
Figure 7.
a) Total (wood-fired ovens + road traffic + heating systems) simulated and observed NOx concentrations at the MI-P_UB monitoring station; b) correlation between simulated and observed NOx concentrations; c) simulated contribution of wood-fired ovens, road traffic, and heating systems to total NOx concentrations ; d) monthly simulated contribution of wood-fired ovens, road traffic and heating systems.
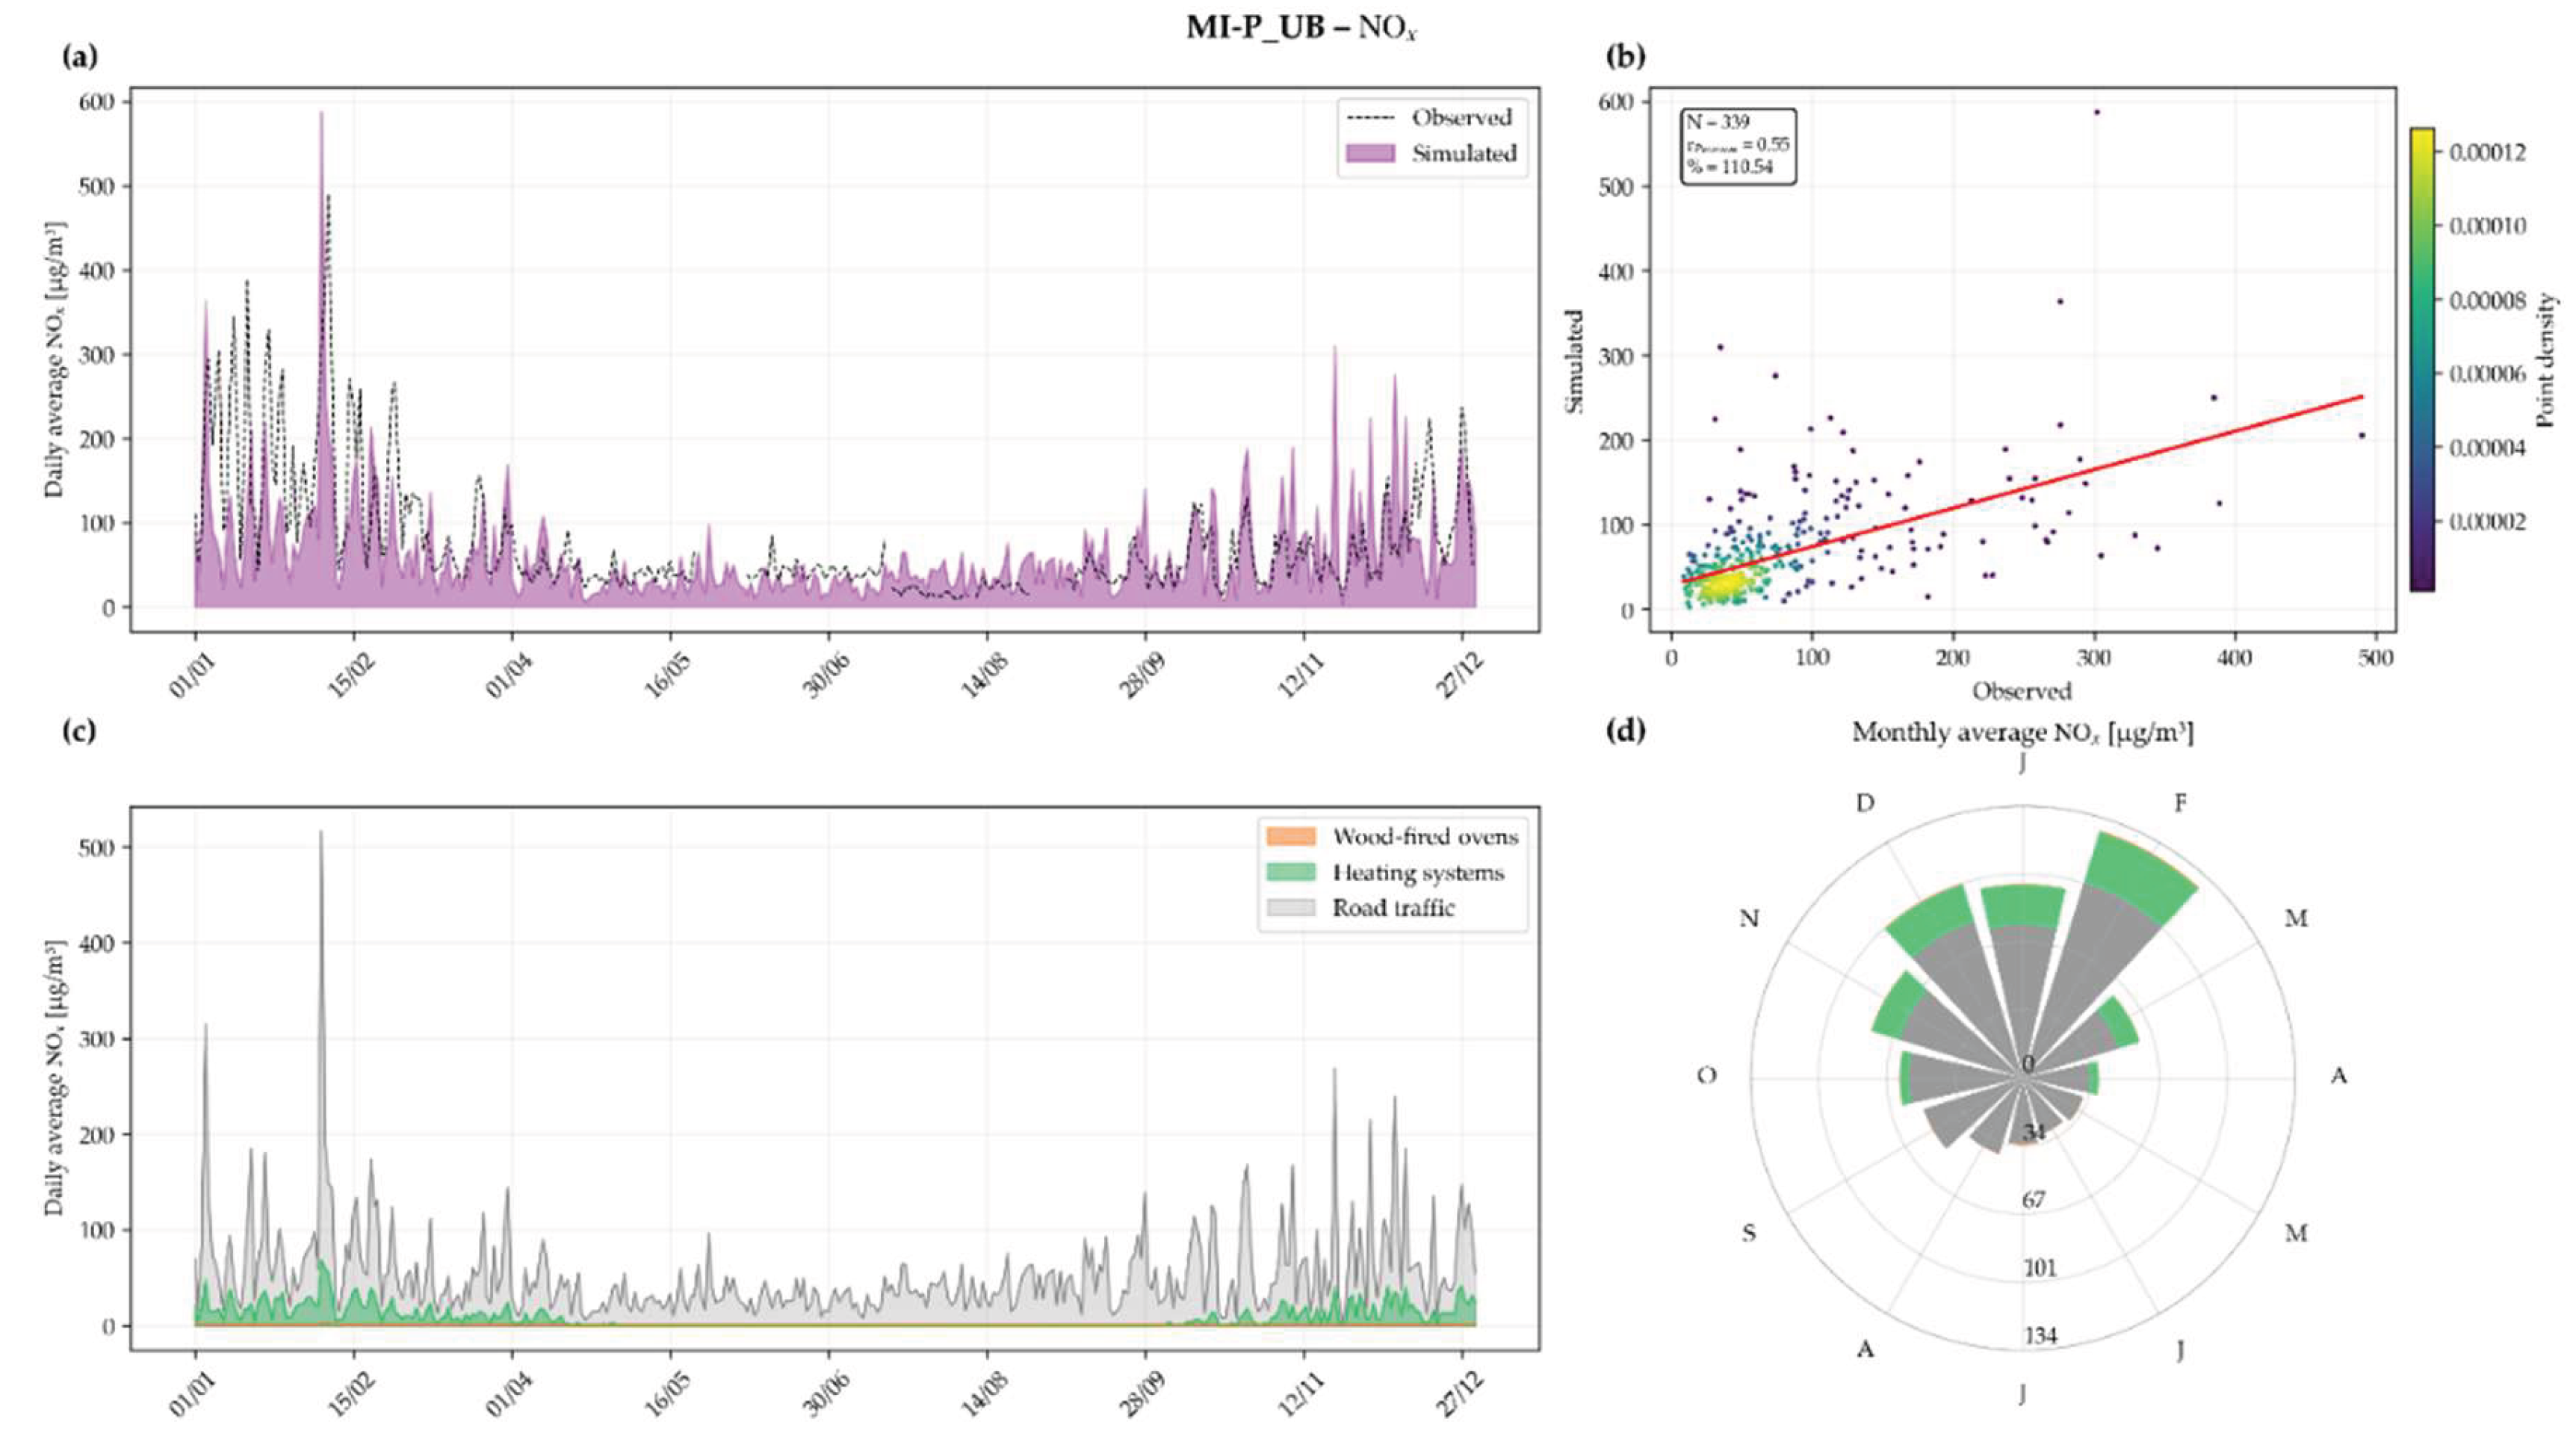
Figure 8.
a) Total (wood-fired ovens + road traffic + heating systems) simulated versus observed PM10 concentrations at the MI-P_UB monitoring station; b) correlation between simulated and observed PM10 concentrations; c) simulated contribution of wood-fired ovens, road traffic, and heating systems to toal PM10 concentrations; d) monthly simulated contribution of wood-fired ovens, road traffic and heating system.
Figure 8.
a) Total (wood-fired ovens + road traffic + heating systems) simulated versus observed PM10 concentrations at the MI-P_UB monitoring station; b) correlation between simulated and observed PM10 concentrations; c) simulated contribution of wood-fired ovens, road traffic, and heating systems to toal PM10 concentrations; d) monthly simulated contribution of wood-fired ovens, road traffic and heating system.
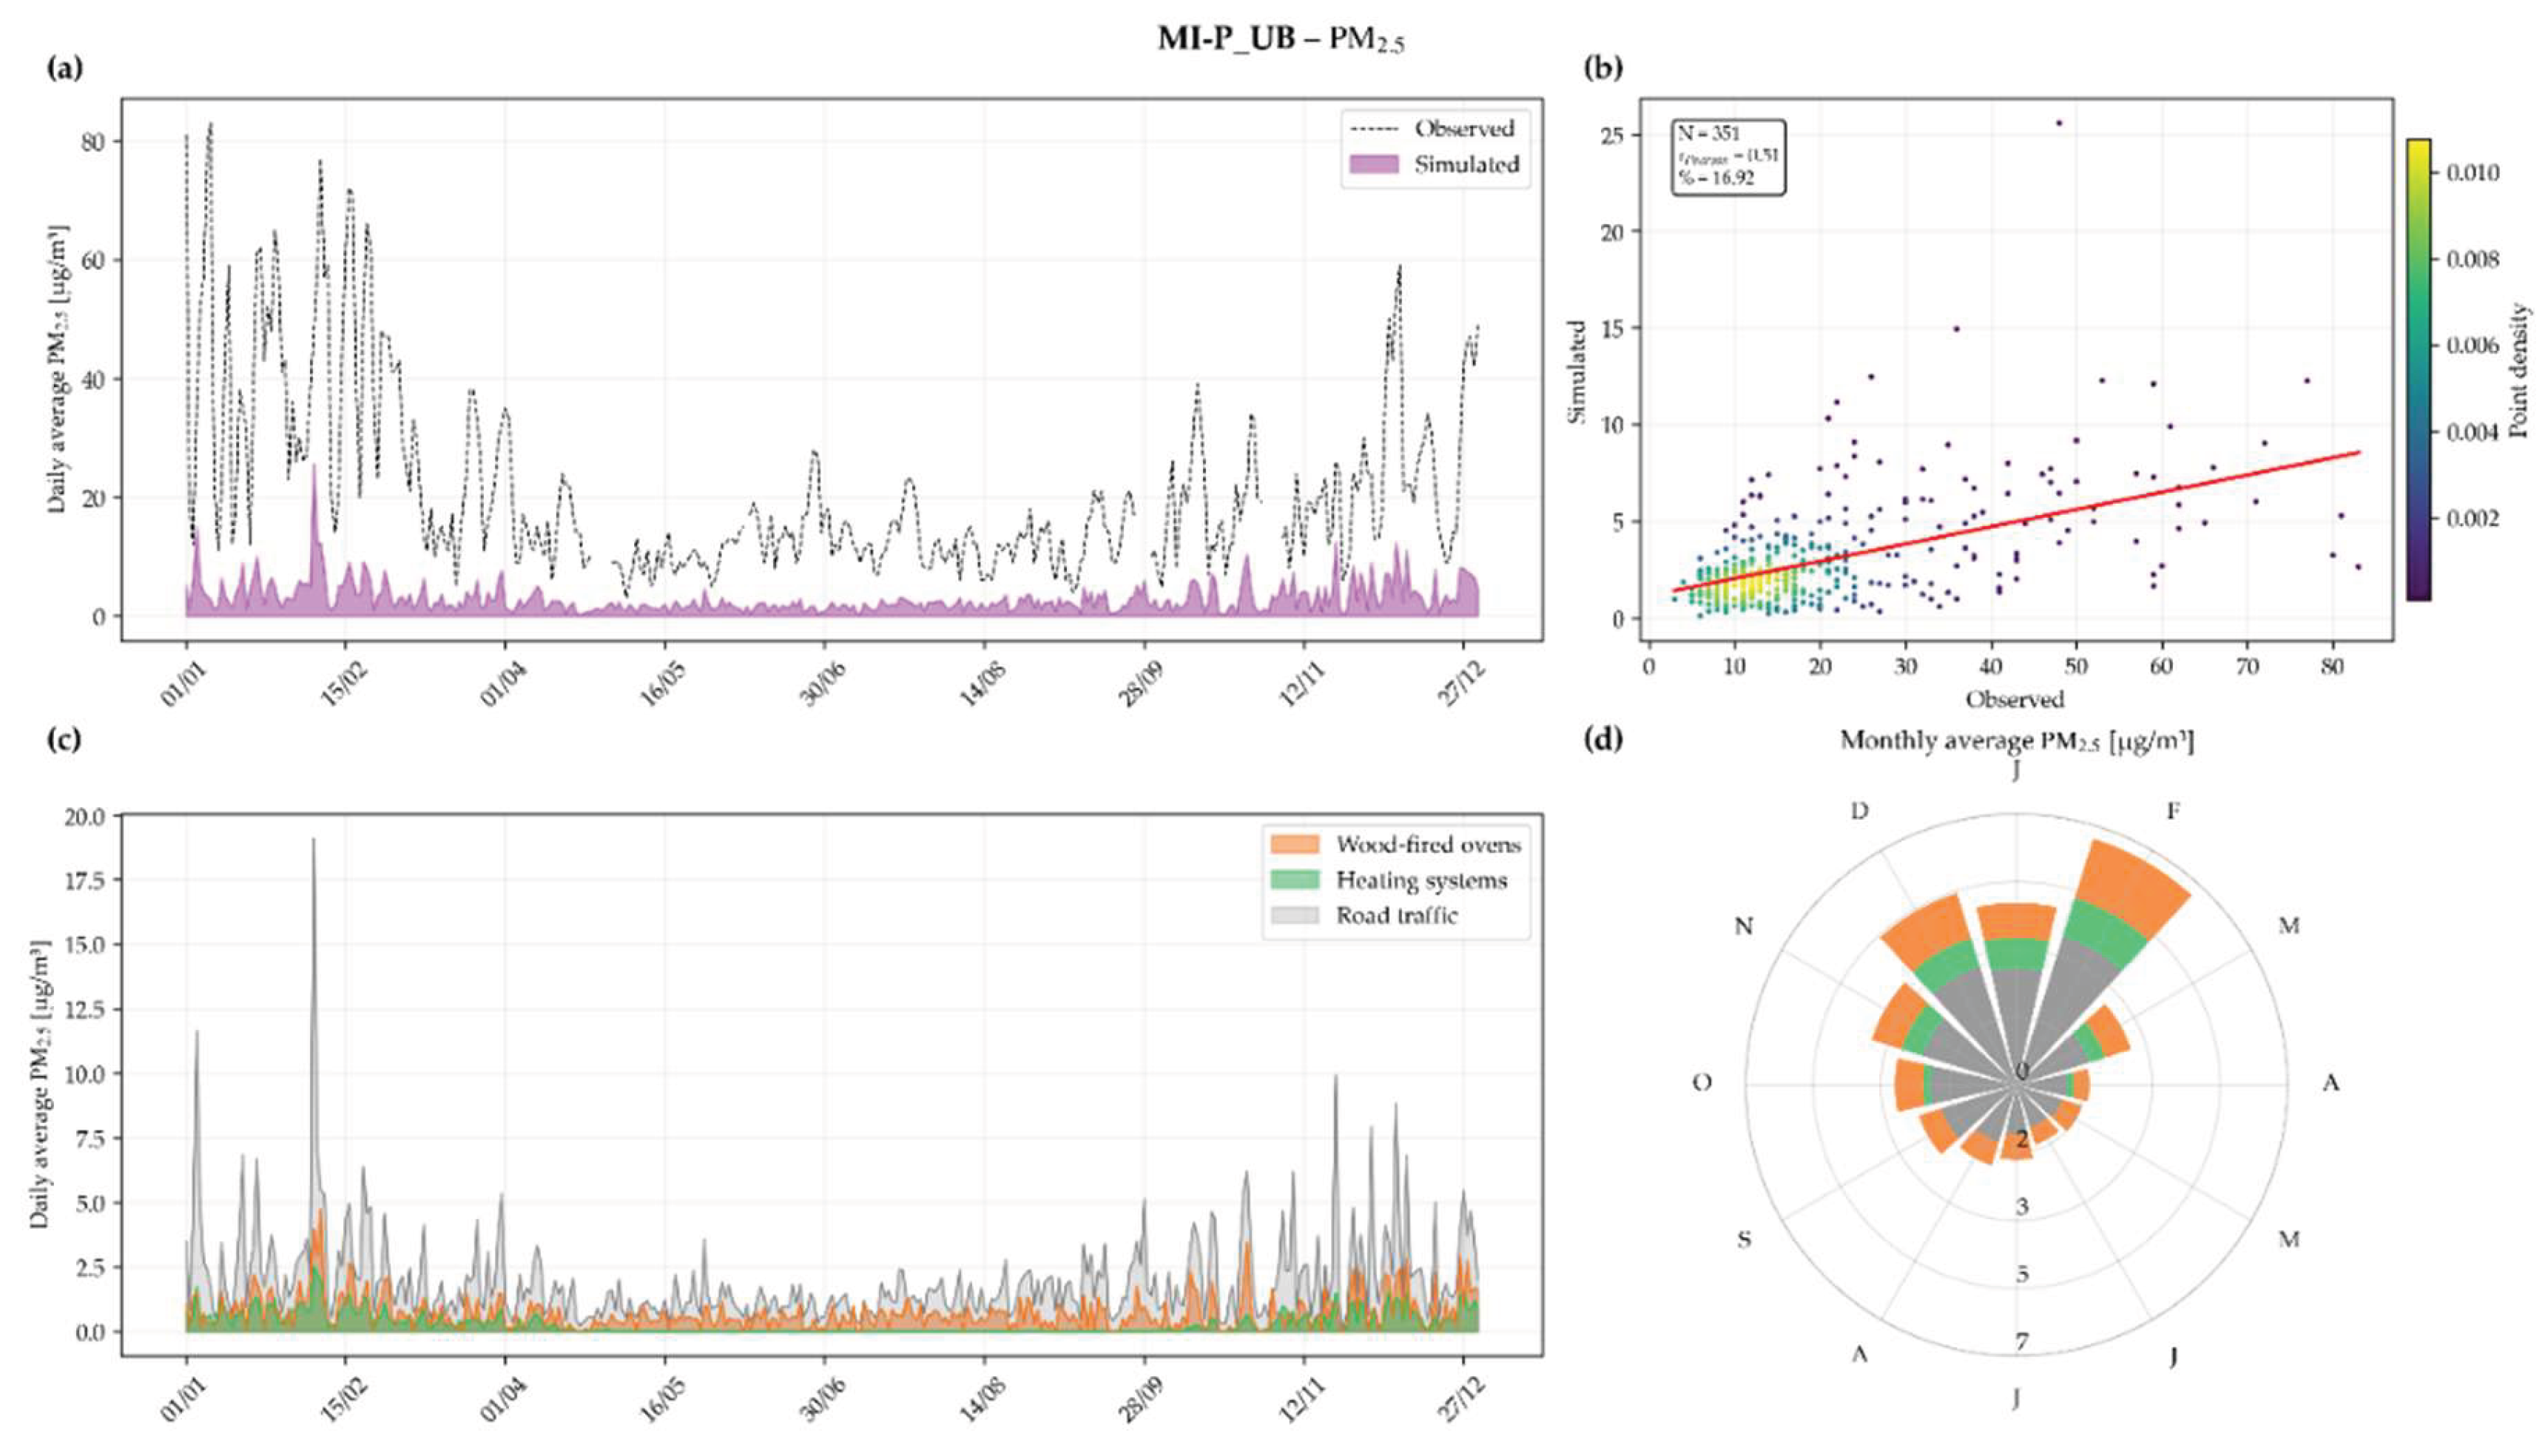
Figure 9.
a) Total (wood-fired ovens + road traffic + heating systems) simulated versus observed PM10 concentrations at the MI-V_UT monitoring station; b) correlation between simulated and observed PM2.5 concentrations; c) simulated contribution of wood-fired ovens, road traffic, and heating systems to total PM10 concentrations; d) monthly simulated contribution of wood-fired ovens, road traffic and heating system.
Figure 9.
a) Total (wood-fired ovens + road traffic + heating systems) simulated versus observed PM10 concentrations at the MI-V_UT monitoring station; b) correlation between simulated and observed PM2.5 concentrations; c) simulated contribution of wood-fired ovens, road traffic, and heating systems to total PM10 concentrations; d) monthly simulated contribution of wood-fired ovens, road traffic and heating system.
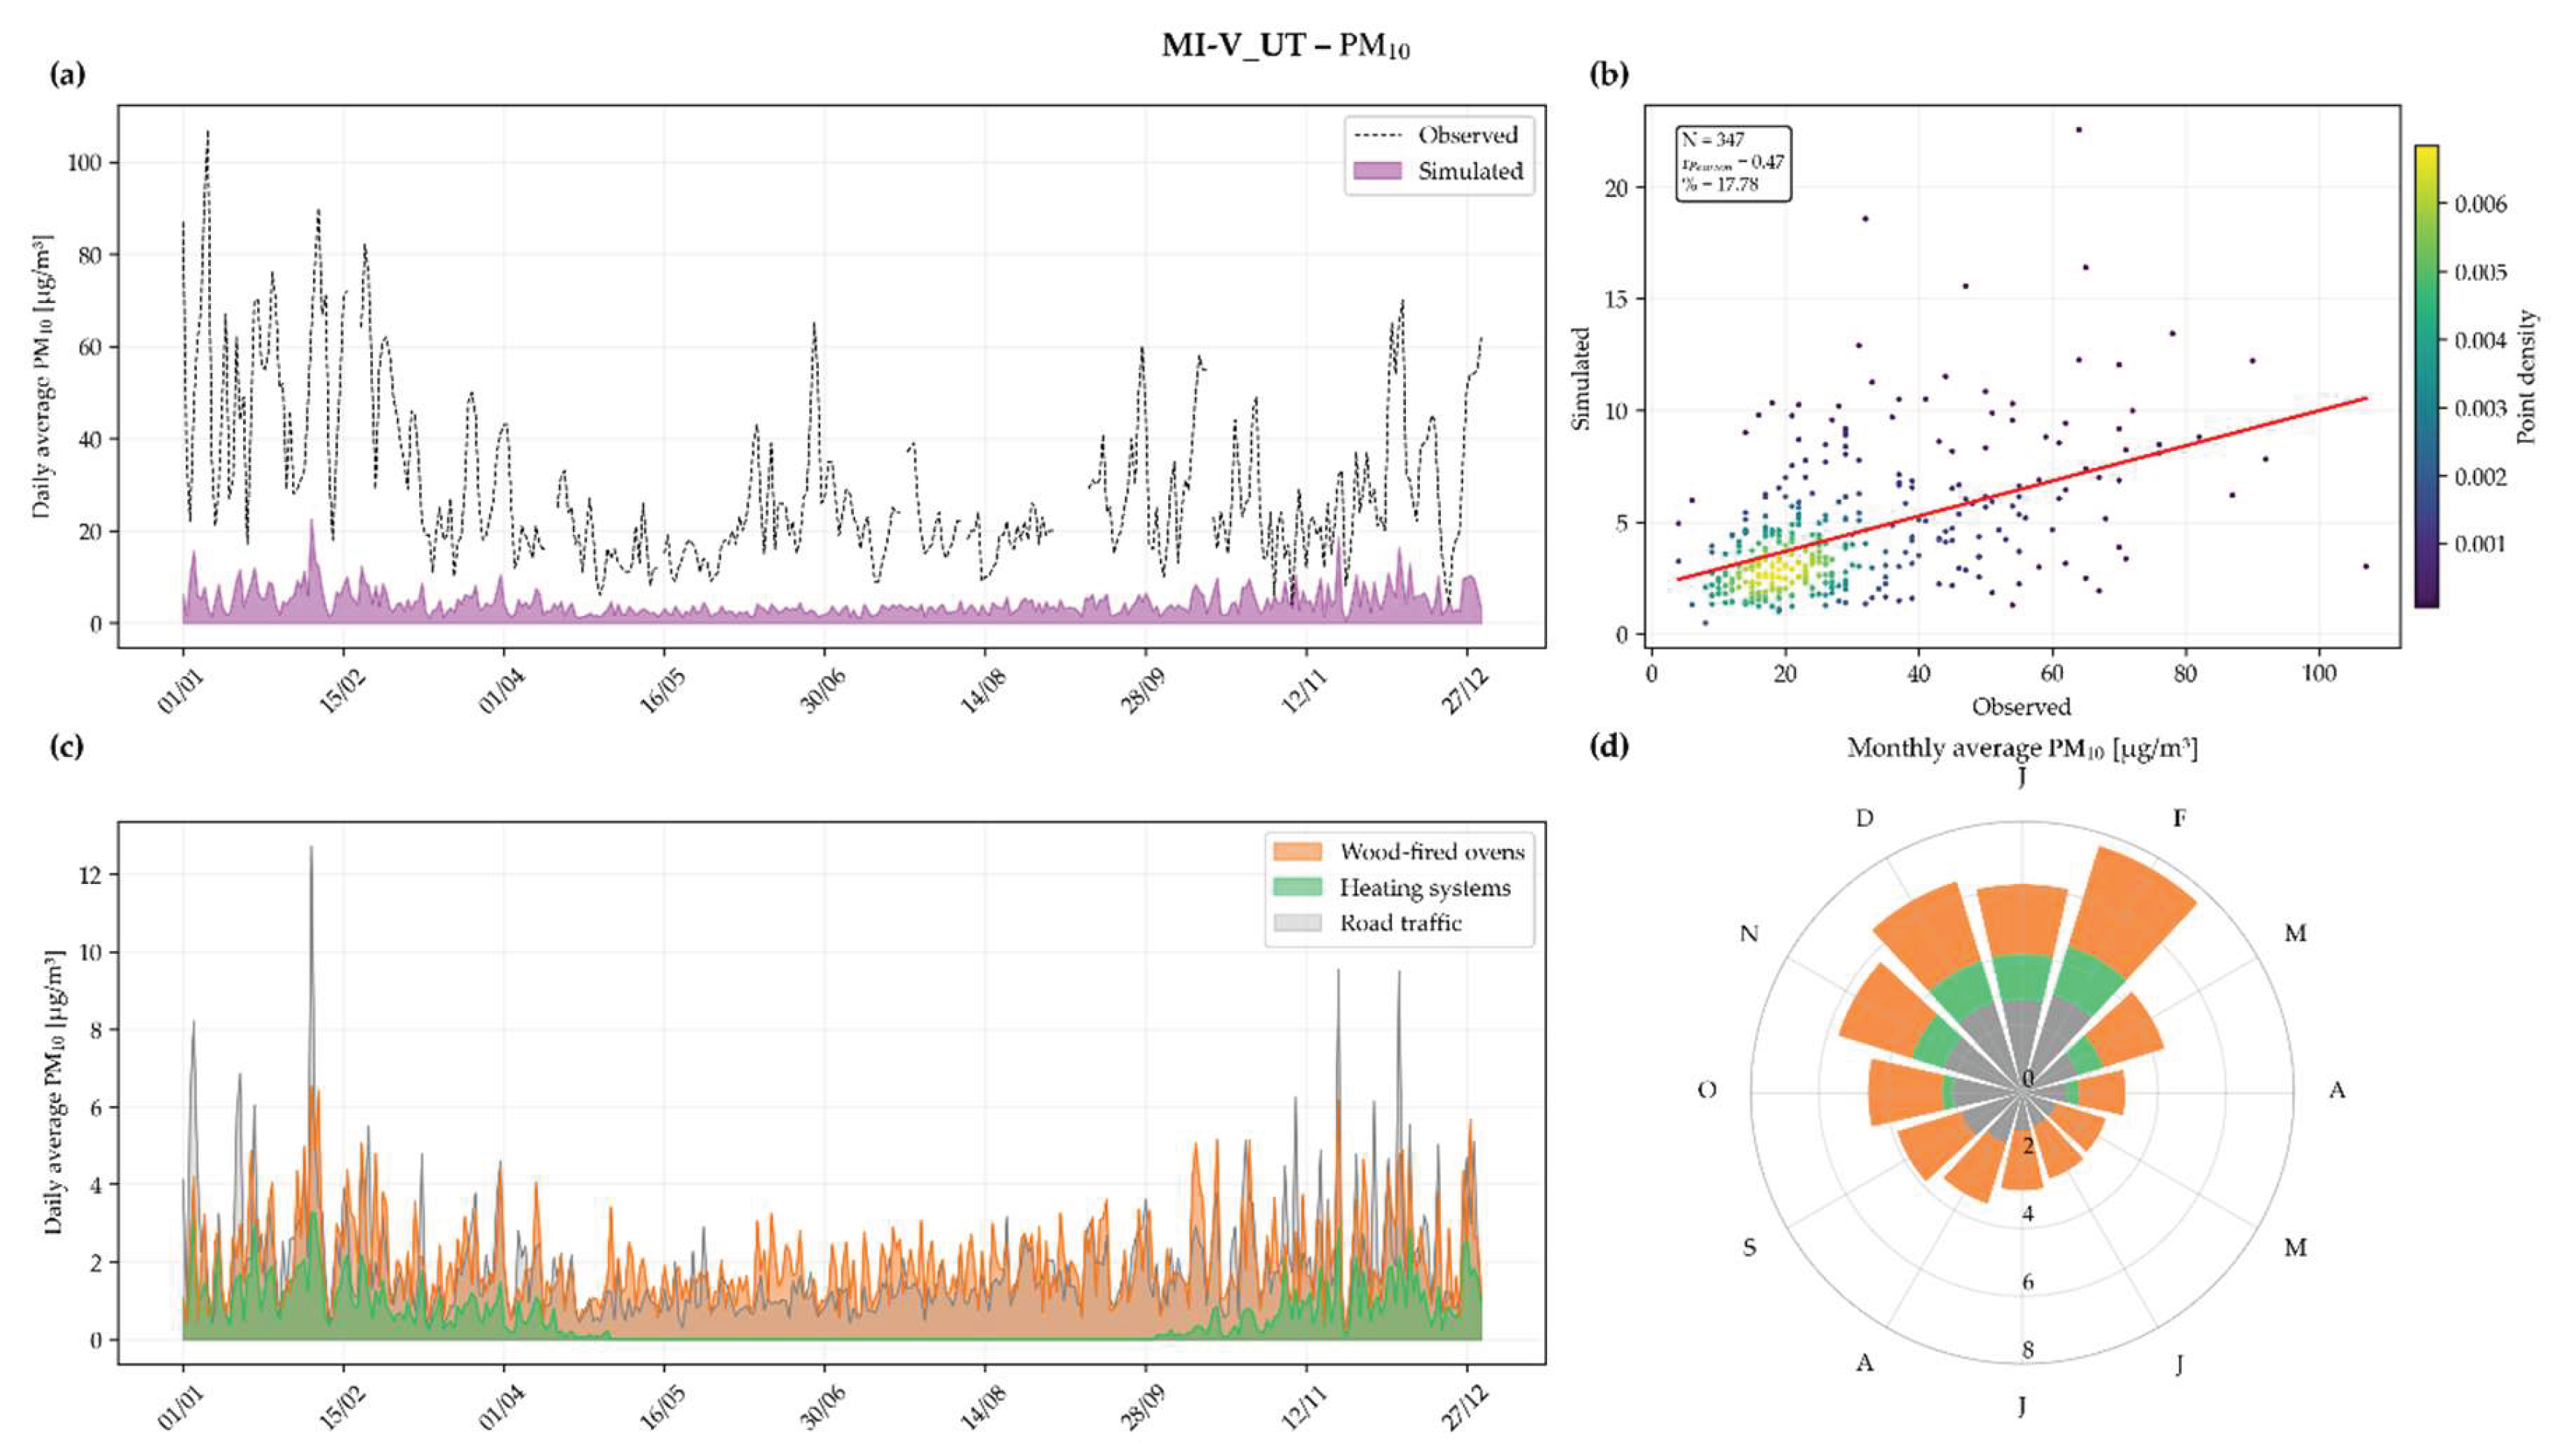
Figure 10.
a) Simulated versus PMF-extracted concentrations (road traffic + biomass burning) at the MI-P_UB monitoring station; b) scatter plot showing the correlation between the two.
Figure 10.
a) Simulated versus PMF-extracted concentrations (road traffic + biomass burning) at the MI-P_UB monitoring station; b) scatter plot showing the correlation between the two.
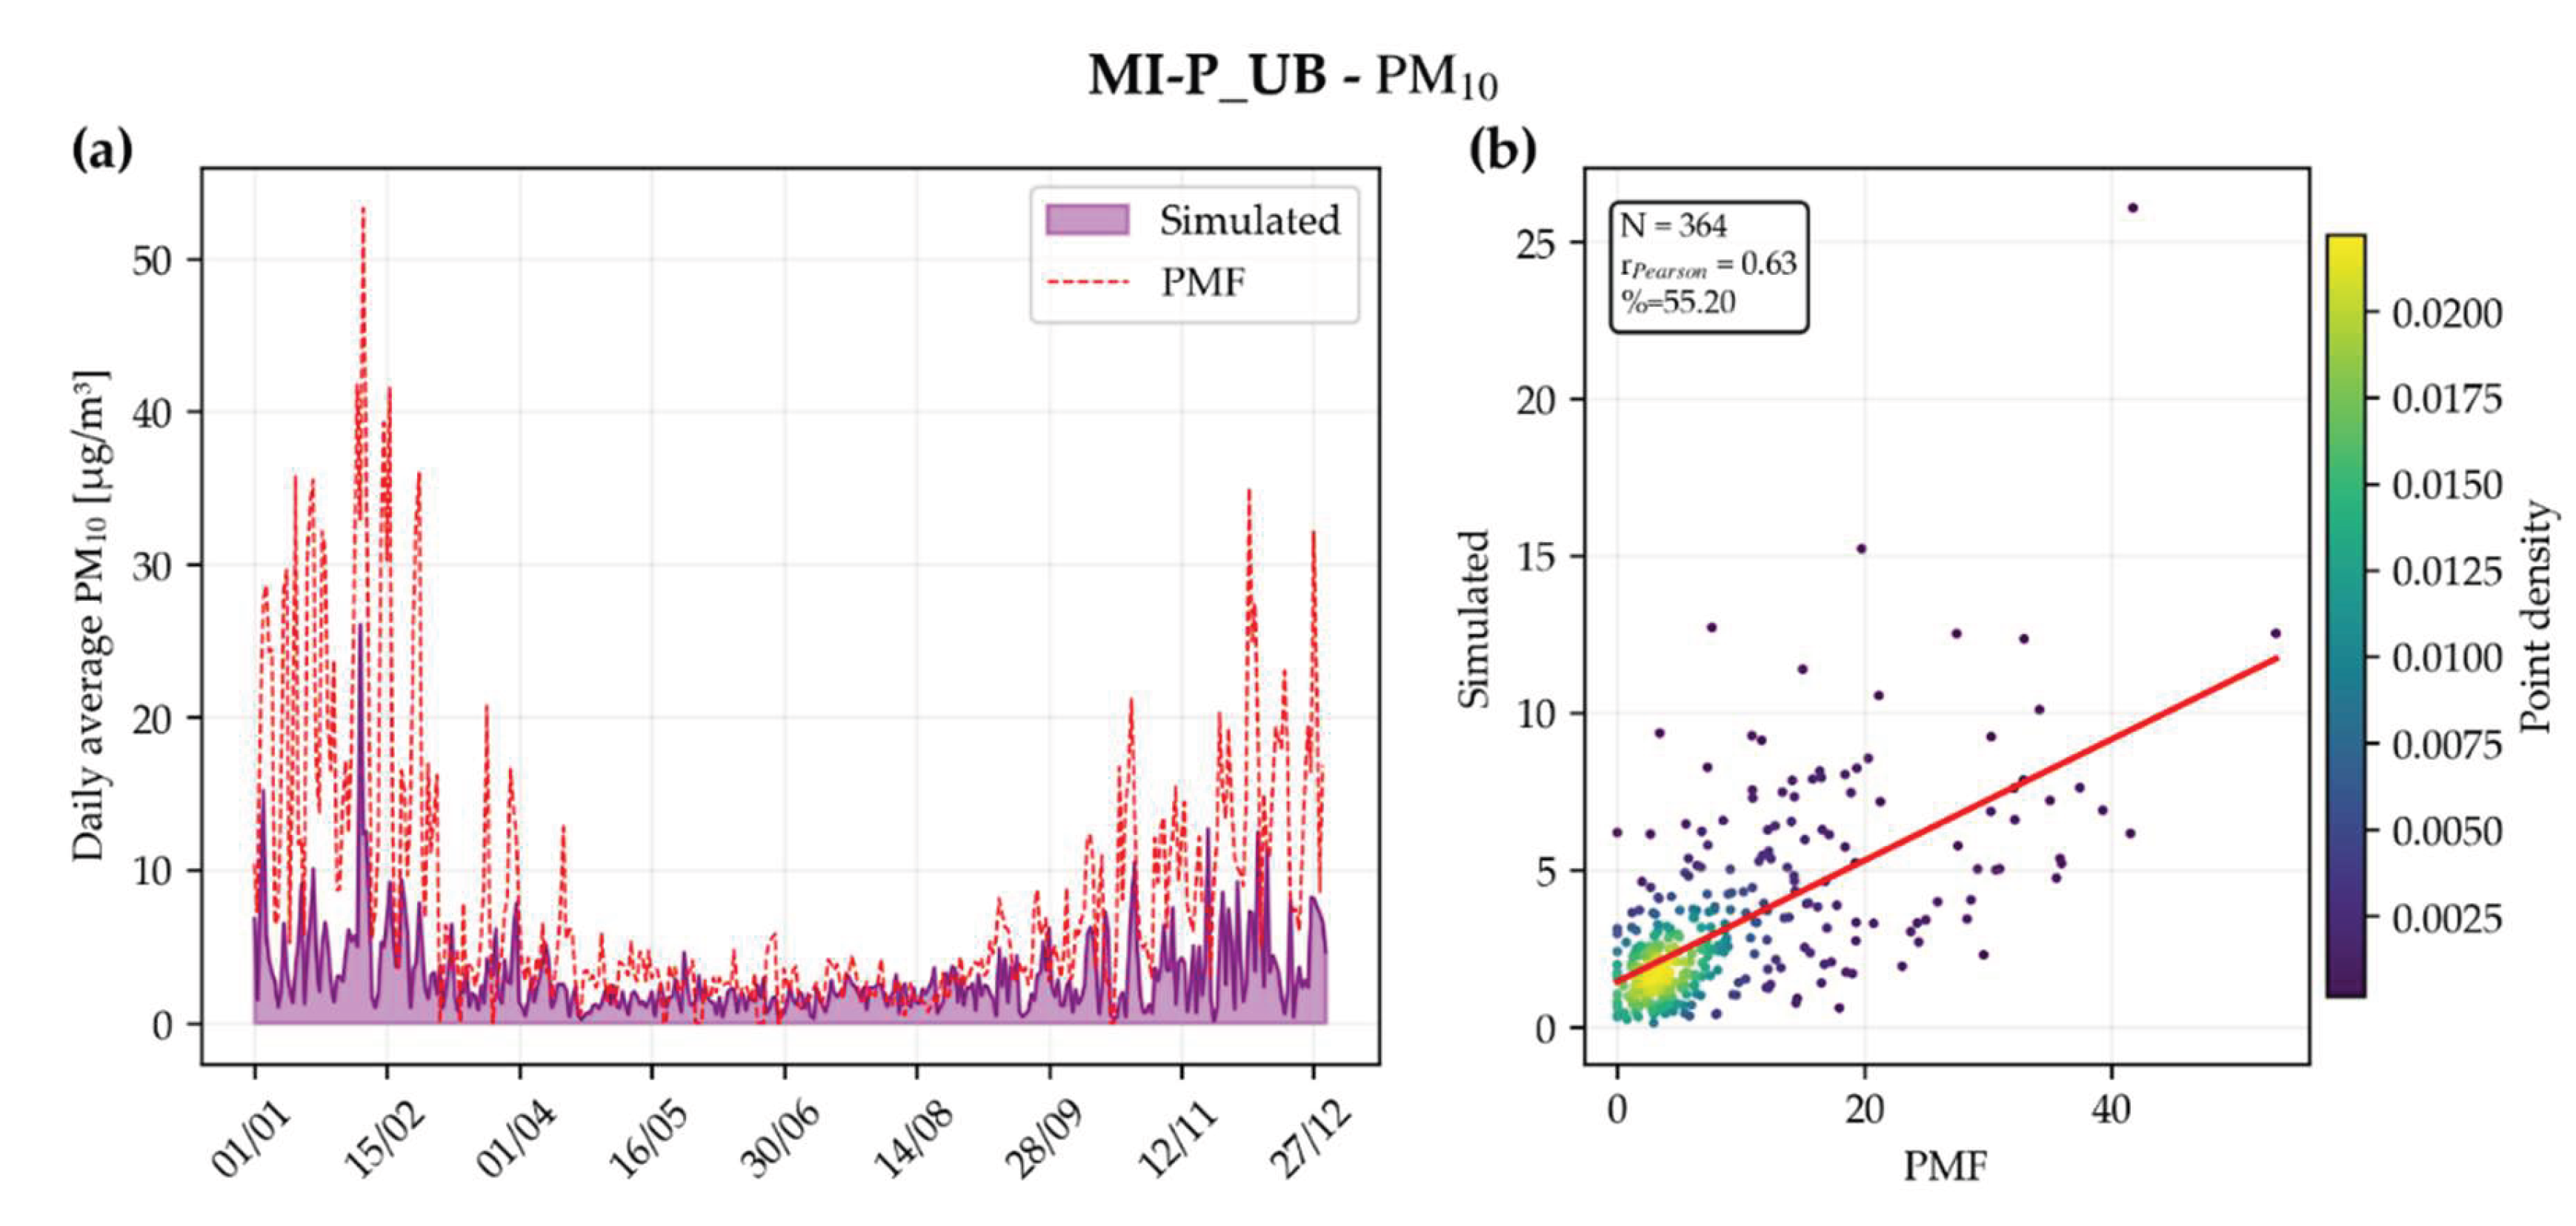
Figure 11.
Comparison between simulated (red) and observed (blue) LG concentration trends at the MI-P_UB monitoring site.
Figure 11.
Comparison between simulated (red) and observed (blue) LG concentration trends at the MI-P_UB monitoring site.
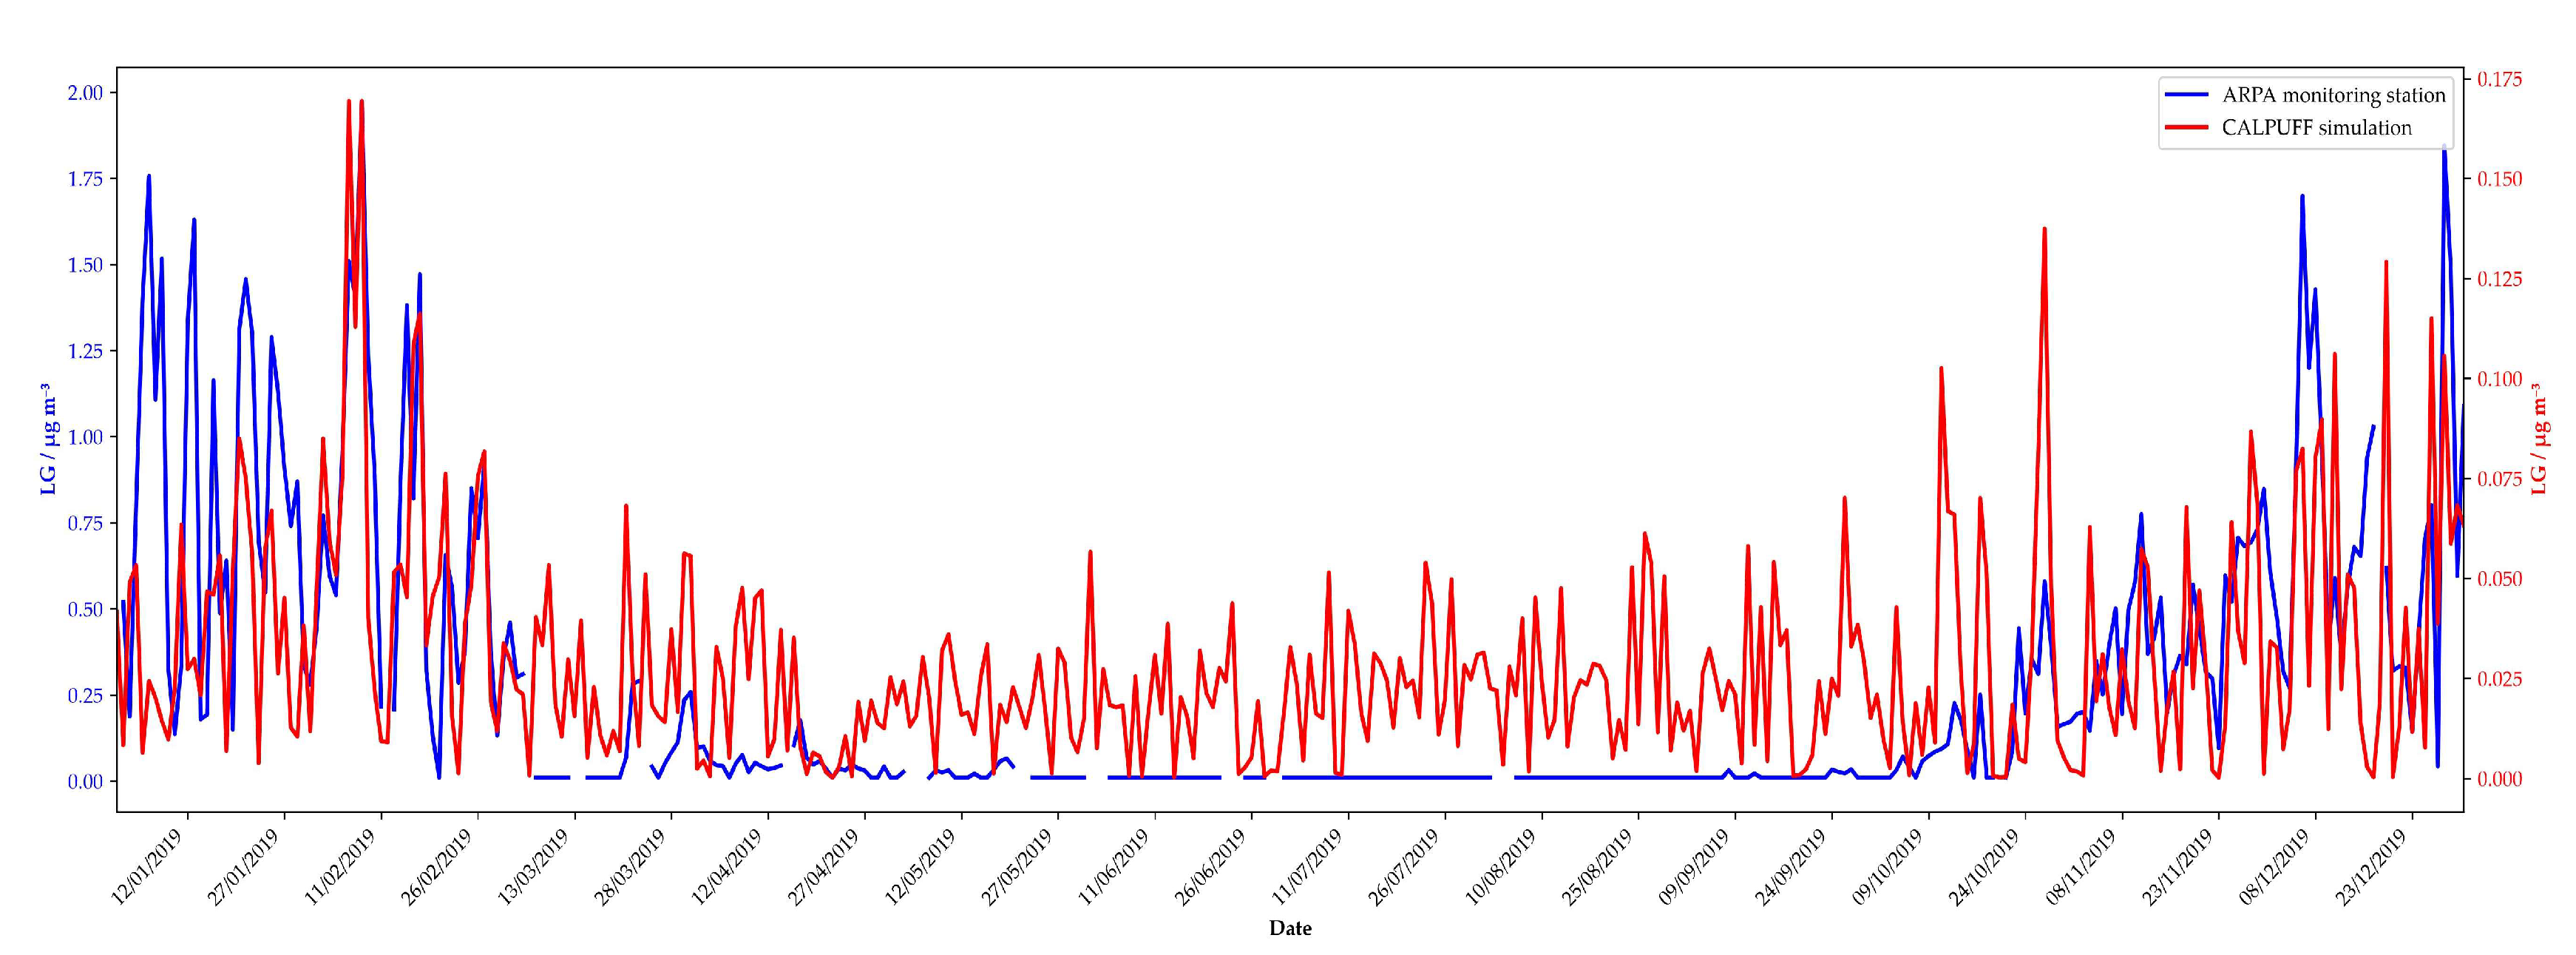
Figure 12.
a) Conceptual illustration of the city of Milan generated using Microsoft Copilot (Microsoft Corporation) based on author-defined prompts. b) Urban pollution profile of NOx derived from model results. c) Urban pollution profile of PM10 derived from model results.
Figure 12.
a) Conceptual illustration of the city of Milan generated using Microsoft Copilot (Microsoft Corporation) based on author-defined prompts. b) Urban pollution profile of NOx derived from model results. c) Urban pollution profile of PM10 derived from model results.
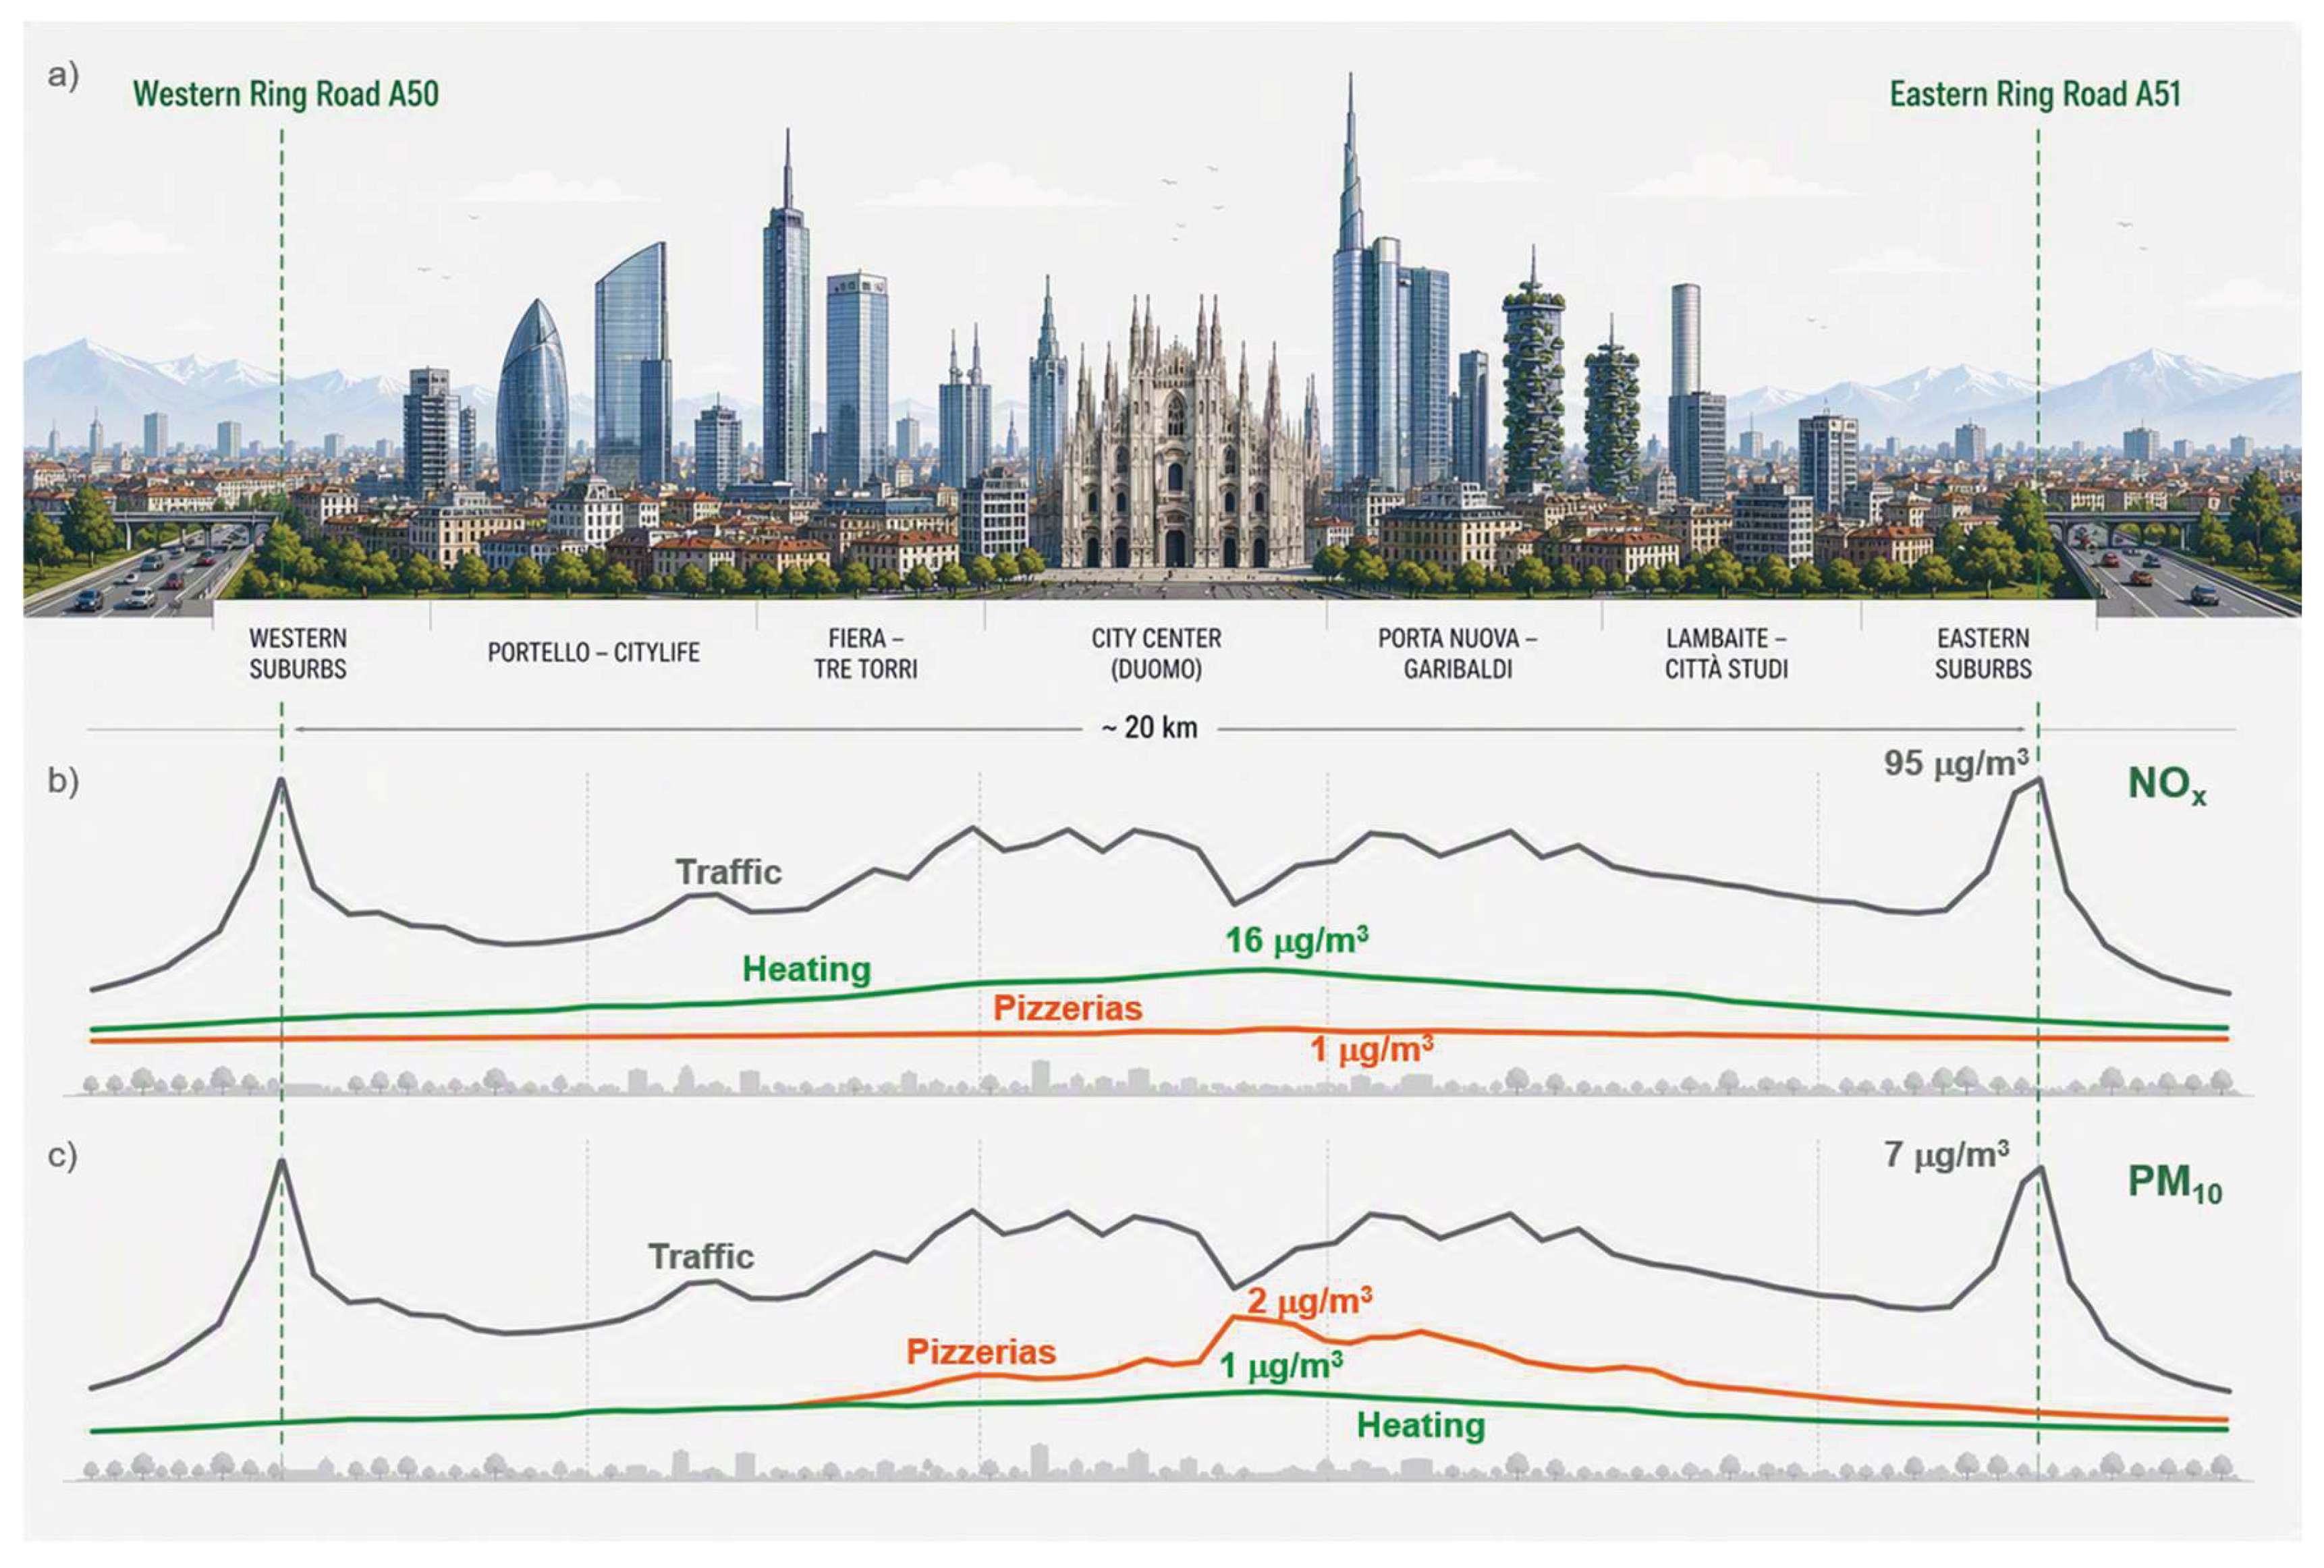

Table 1.
Air pollutant mass fluxes.
| Pollutant | Flux/g s−1 |
|---|---|
| PM10 | 5.41E-3 |
| PM2.5 | 4.99E-3 |
| NOx | 2.70E-3 |
Table 2.
Total estimated emissions from INEMAR 2019, expressed in ton year−1.
| Source | PM10 | PM2.5 | NOx |
|---|---|---|---|
| Heating systems | 35.53 | 34.95 | 945.82 |
| Road Traffic | 224.95 | 157.50 | 3154.33 |
Table 3.
Monitoring stations and pollutants/tracers selected for the present study.
| Site code | Site name | Type | Coordinates (WGS84, 32N) | Pollutants/tracers |
|---|---|---|---|---|
| MI-P_UB | Milano-Pascal Città Studi | UB | (518106, 5036117) | PM10, PM2.5, NOx, LG, BaP |
| MI-S_UT | Milano-Senato | UT | (515436, 5035328) | PM10, PM2.5, NOx, LG, BaP |
| MI-M_UT | Milano-Marche | UT | (514919, 5038106) | PM10, NOx |
| MI-V_UT | Milano-Verziere | UT | (515271, 5034447) | PM10 NOx |
| MI-L_UT | Milano-Liguria | UT | (513134,5032274) | NOx |
Table 4.
Validation results.
| Metric | Value |
|---|---|
| Recall | 77% |
| Precision | 20% |
| F1-score | 31% |
Table 5.
Performance by business category in the validation dataset.
| Business category | Cases | Recall | Precision |
|---|---|---|---|
| Pizzeria | 350 | 87% | 50% |
| Italian restaurant | 223 | 84% | 12% |
| Fast food | 55 | 67% | 8% |
| Generic restaurant | 669 | 56% | 5% |
| Bakery | 50 | 33% | 8% |
Disclaimer/Publisher’s Note: The statements, opinions and data contained in all publications are solely those of the individual author(s) and contributor(s) and not of MDPI and/or the editor(s). MDPI and/or the editor(s) disclaim responsibility for any injury to people or property resulting from any ideas, methods, instructions or products referred to in the content. |
© 2026 by the authors. Licensee MDPI, Basel, Switzerland. This article is an open access article distributed under the terms and conditions of the Creative Commons Attribution (CC BY) license (http://creativecommons.org/licenses/by/4.0/).
Copyright: This open access article is published under a Creative Commons CC BY 4.0 license, which permit the free download, distribution, and reuse, provided that the author and preprint are cited in any reuse.